




Statistics is the chapter where the arithmetic is easy and the printed answer key is least reliable. The NCERT Exemplar Solutions for Class 11 Maths Chapter 13 Statistics on this page solve all 46 questions of the chapter, step by step, according to the 2026-27 NCERT Exemplar.
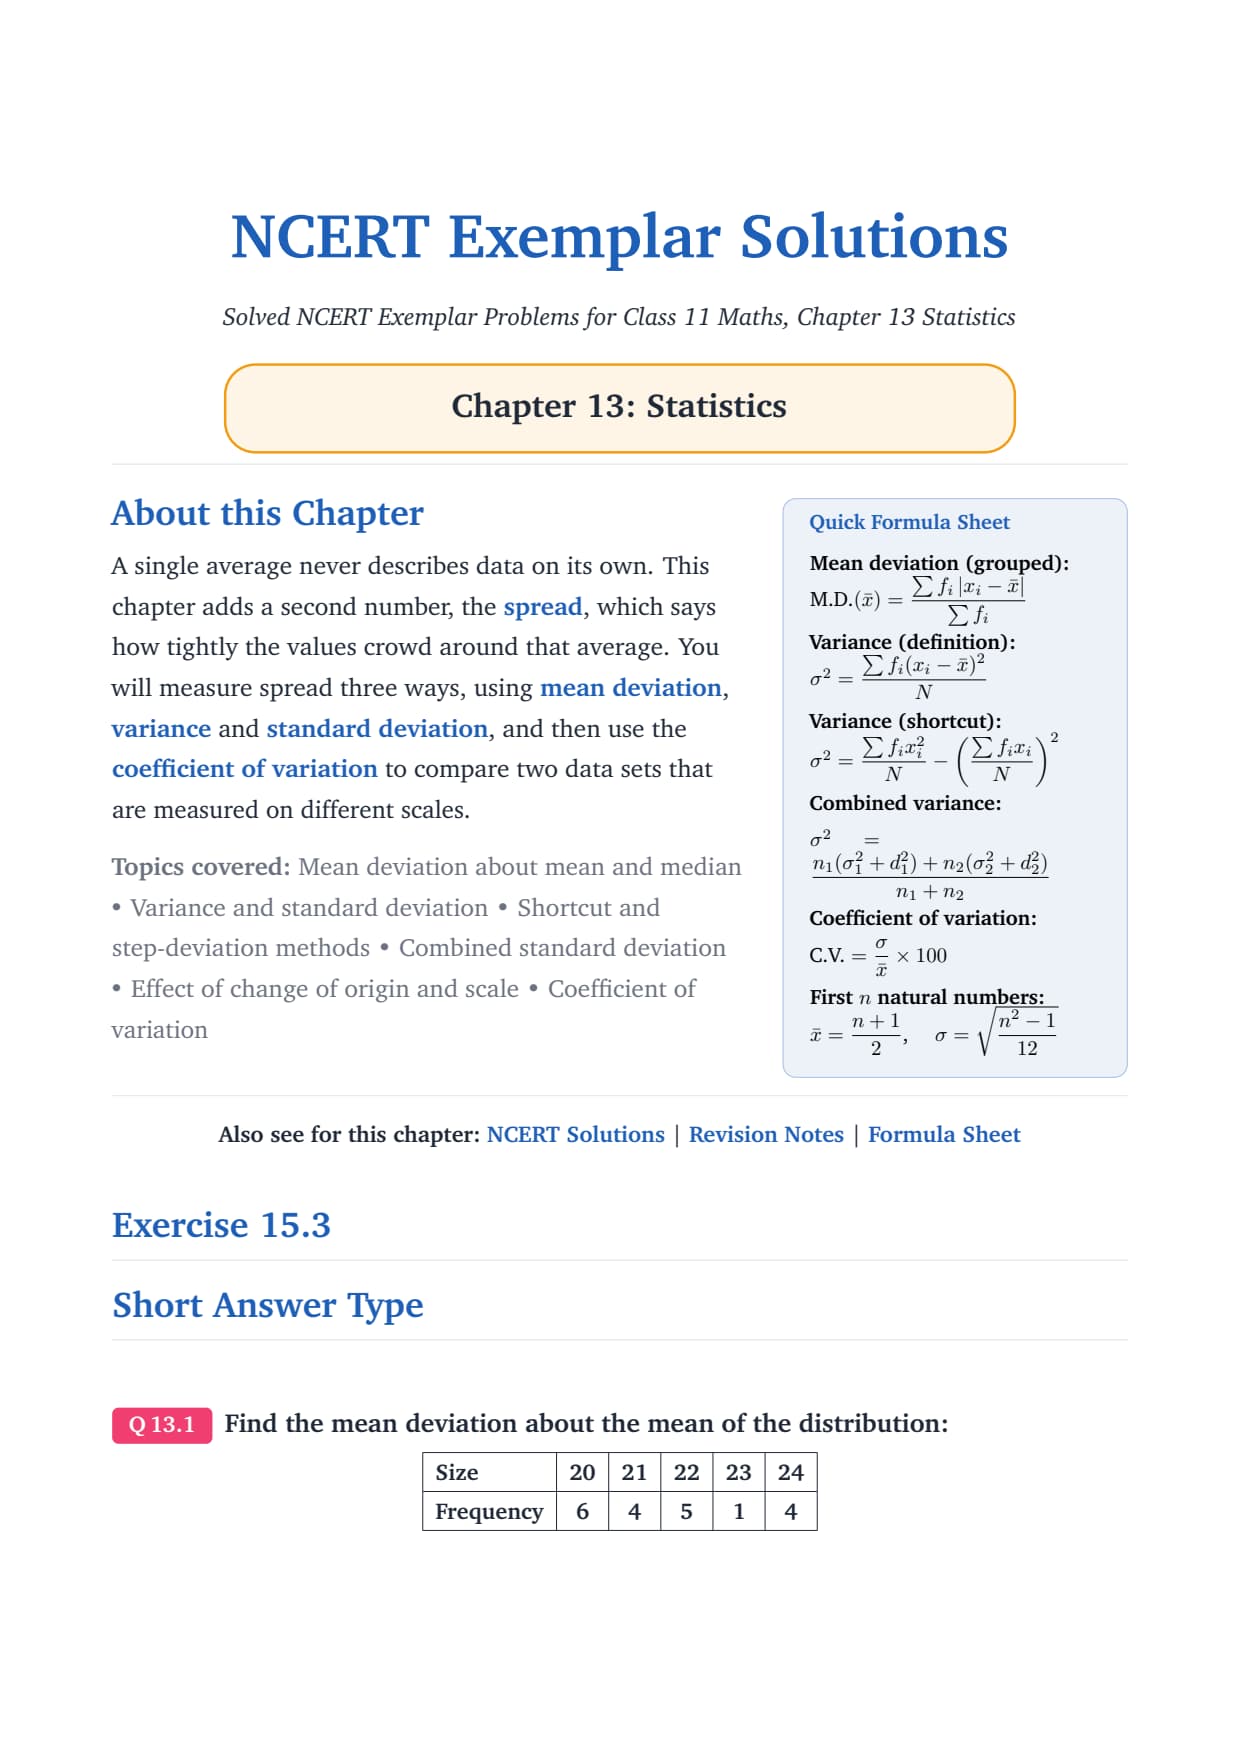
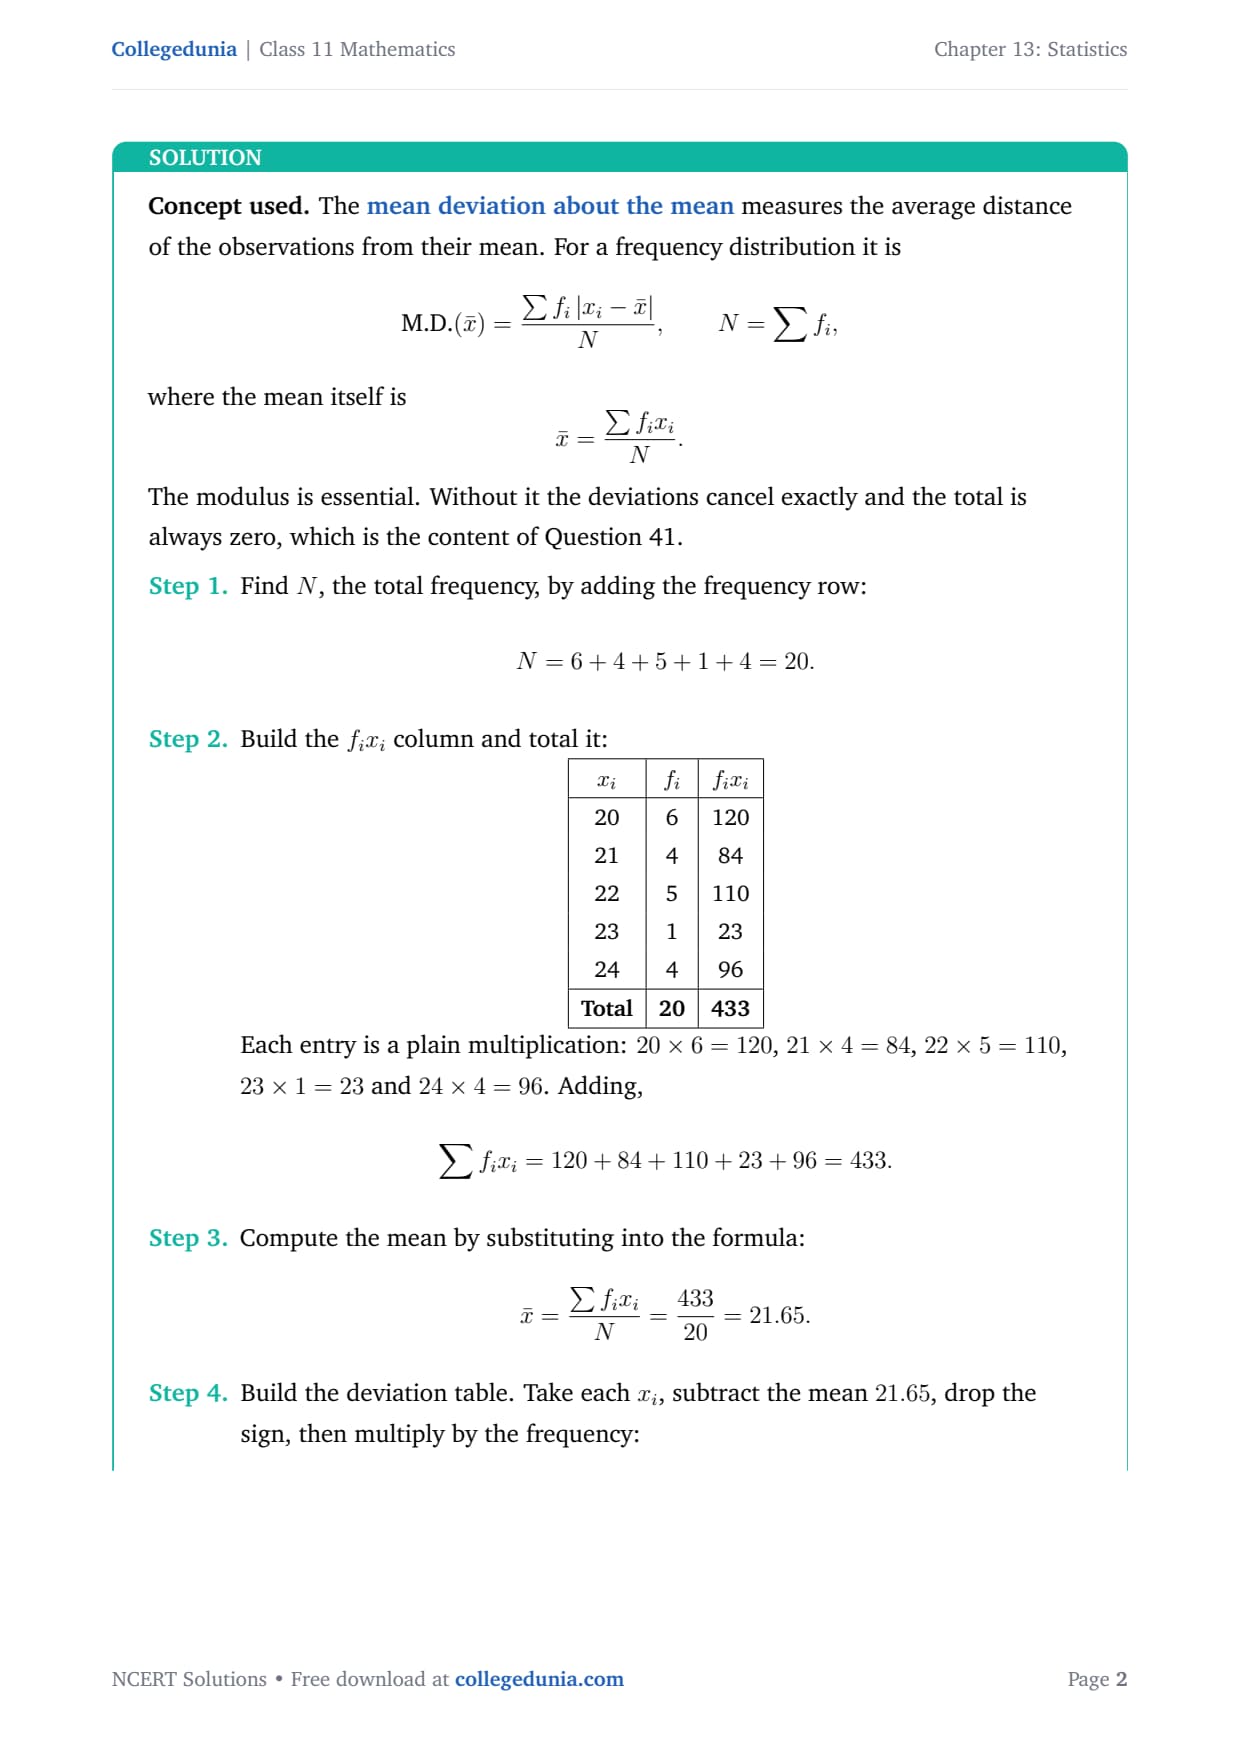
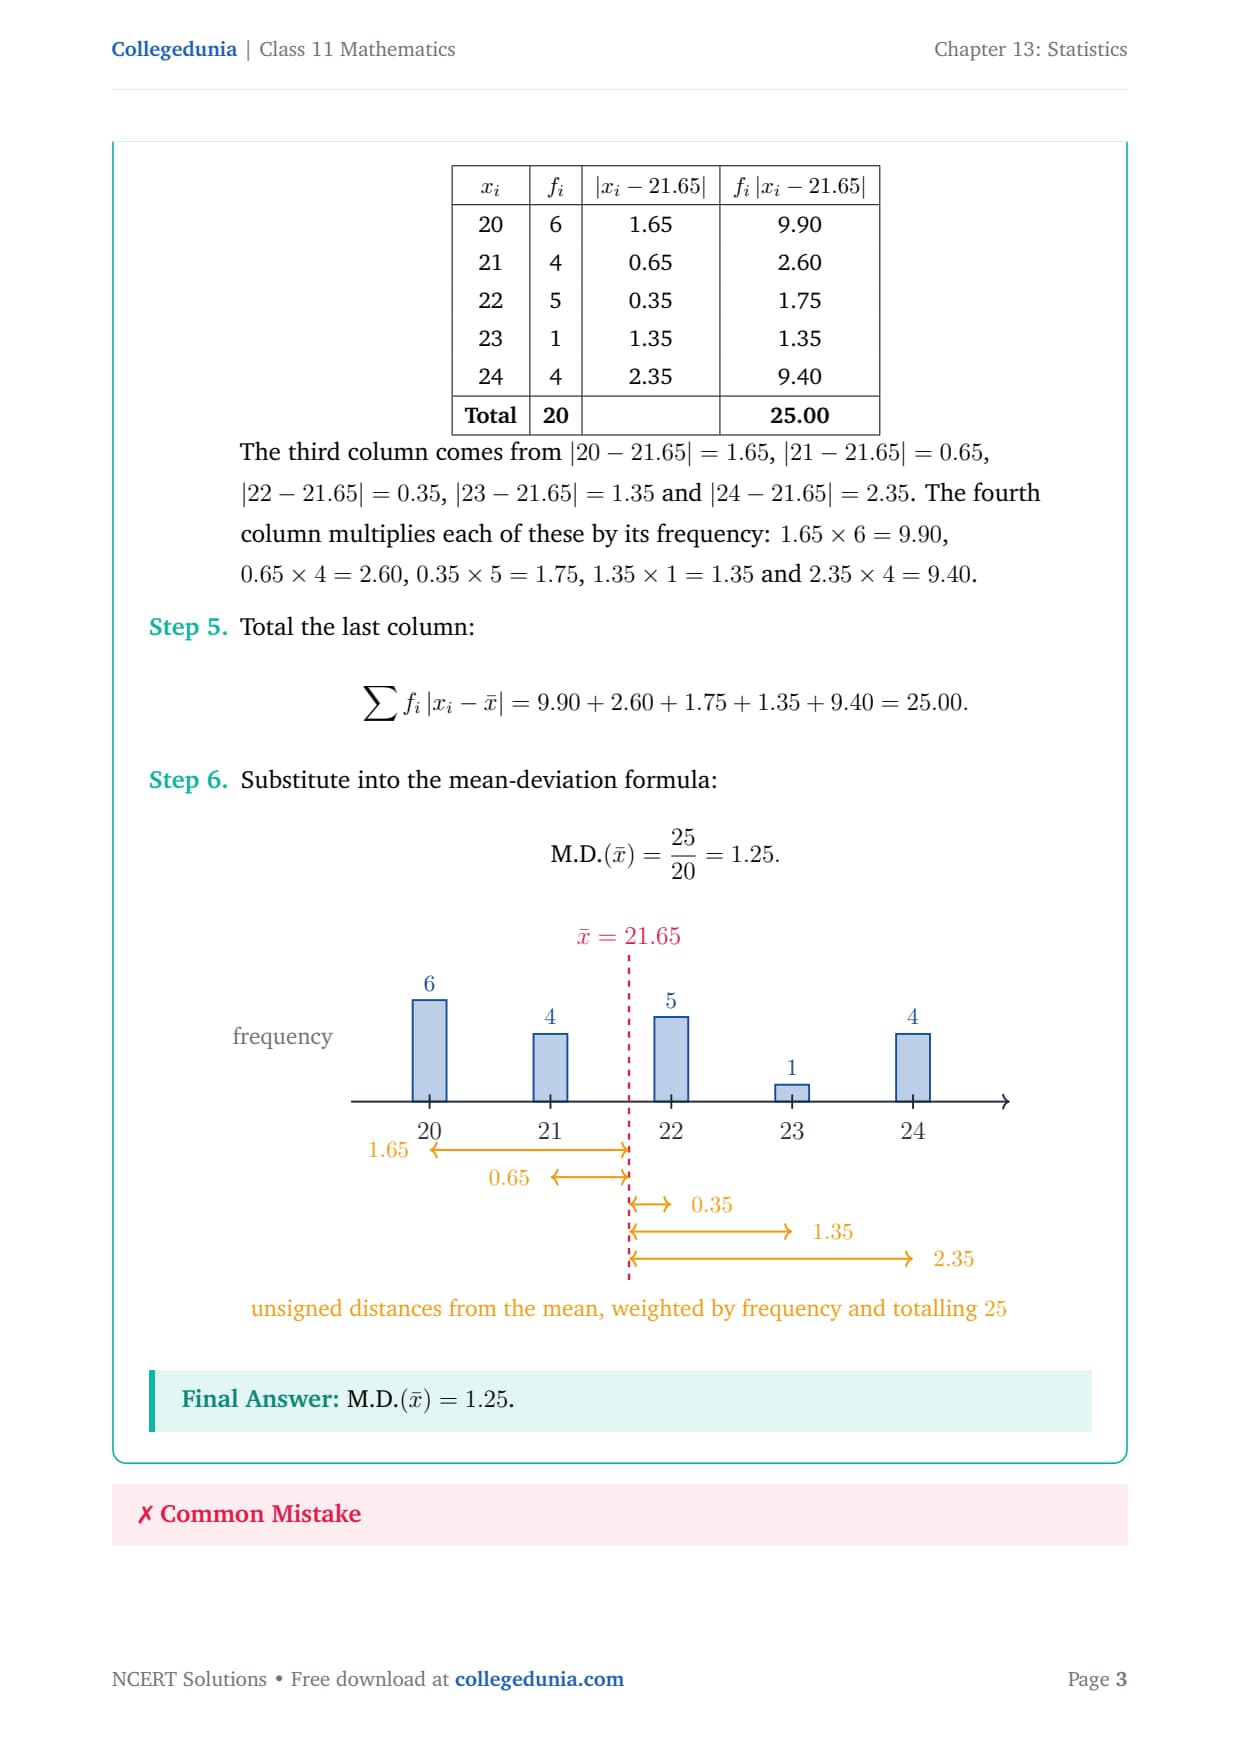
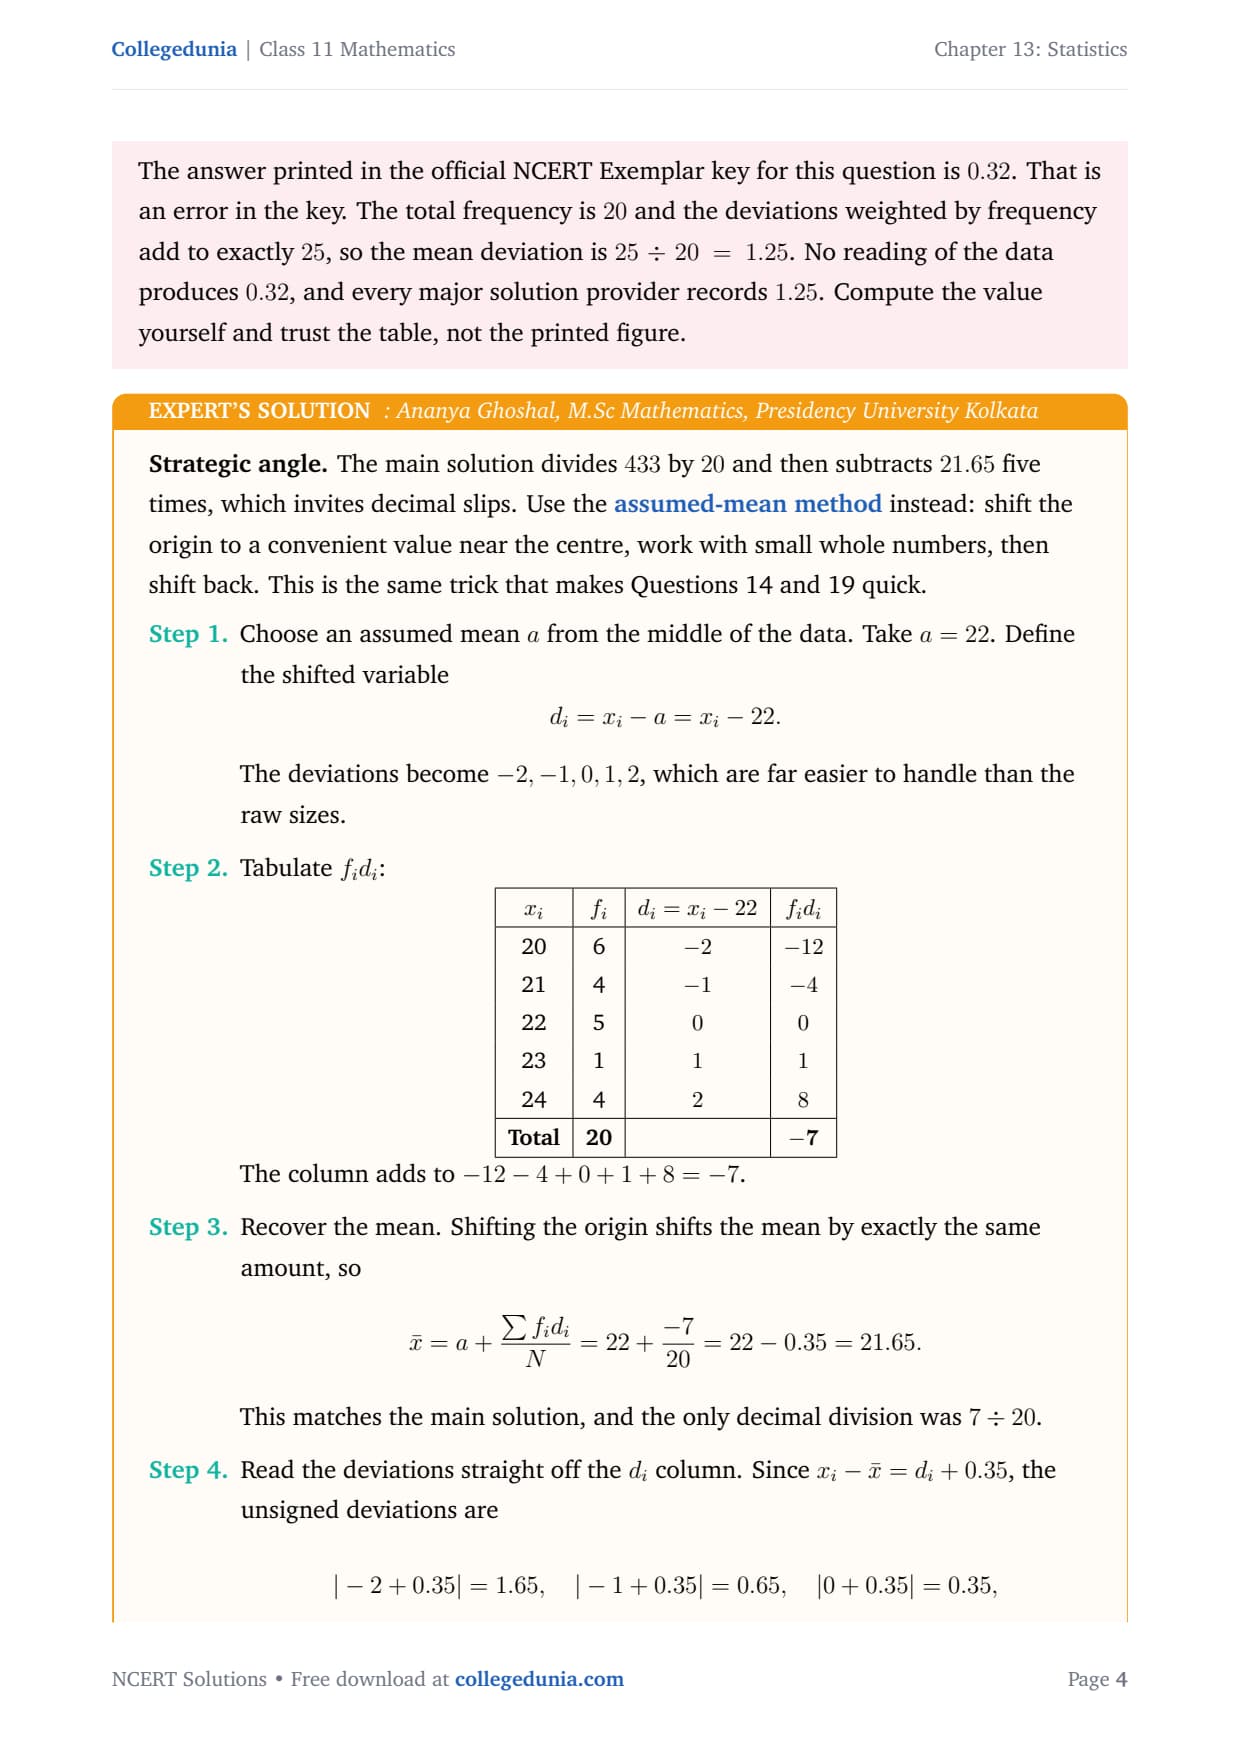
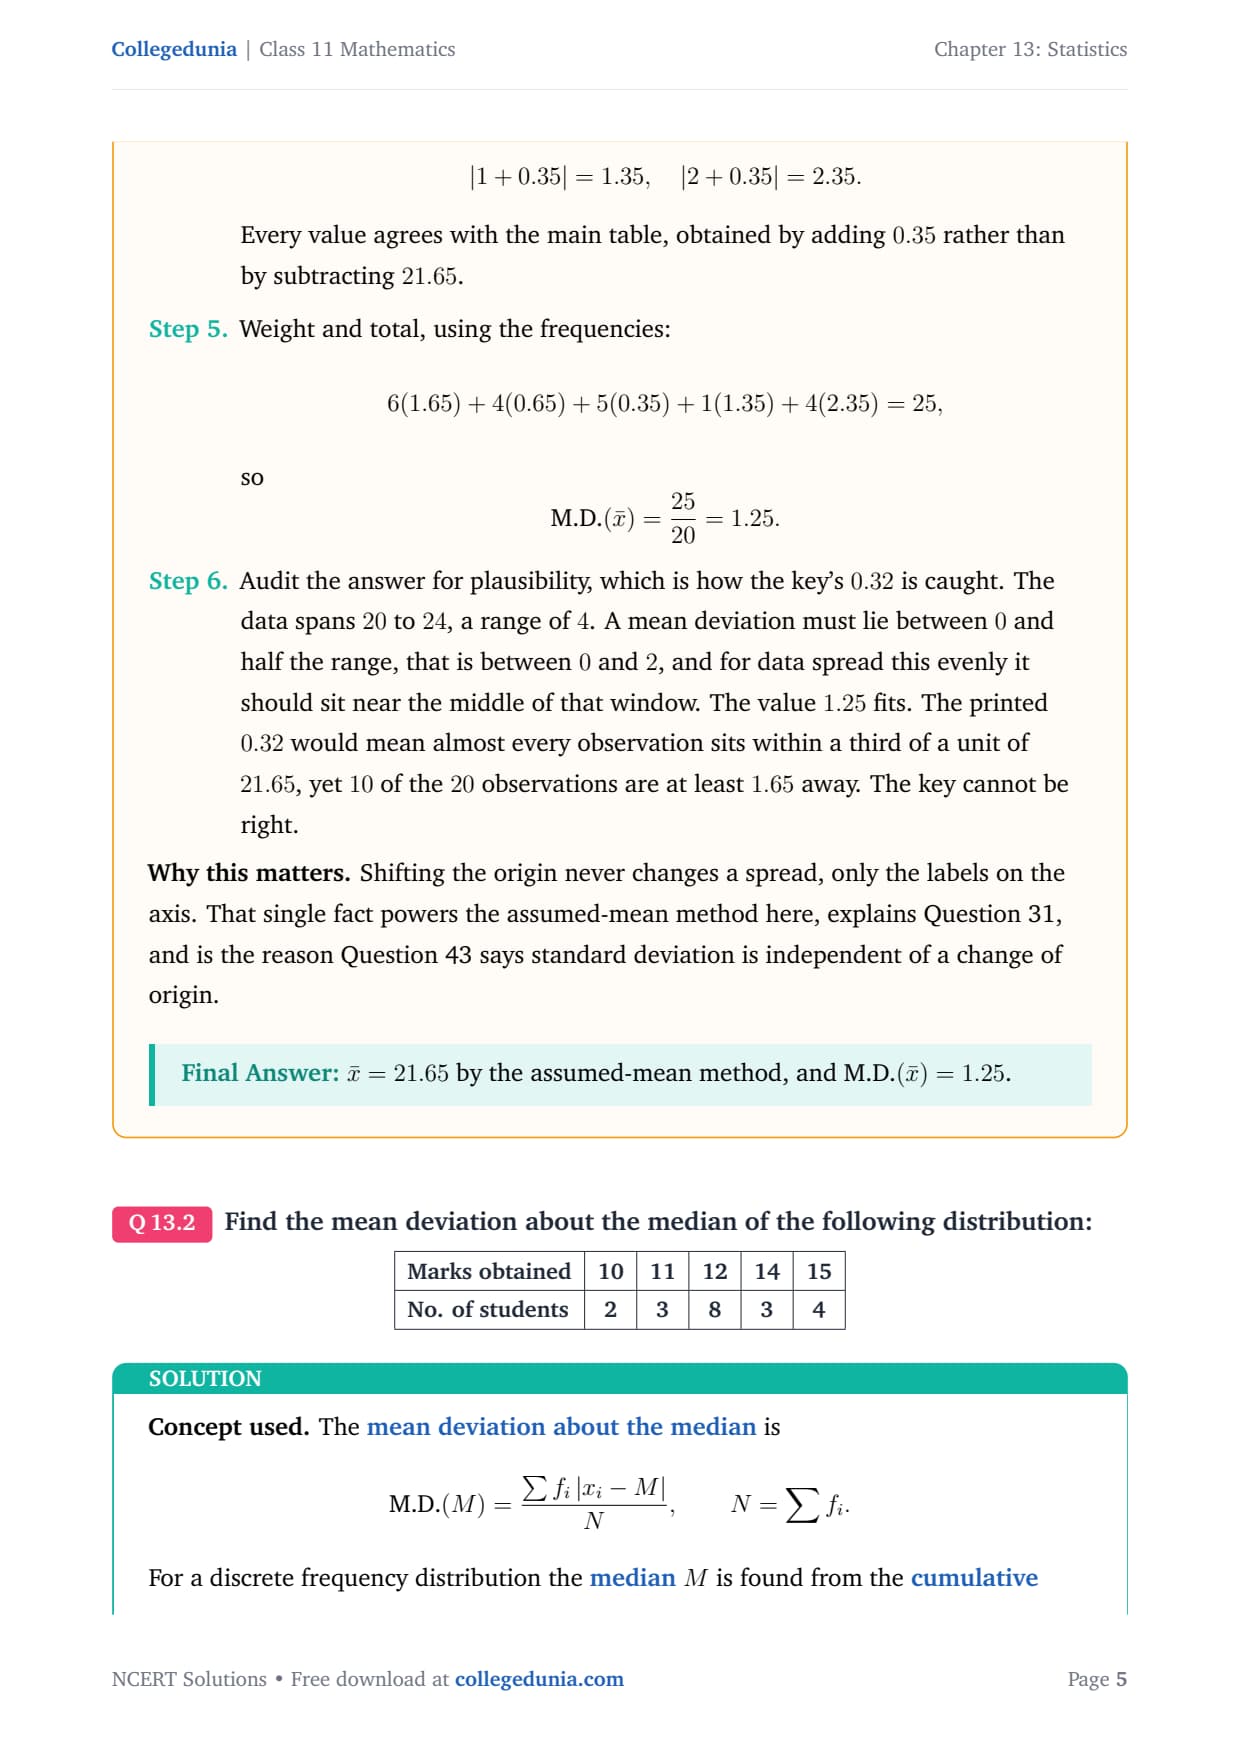
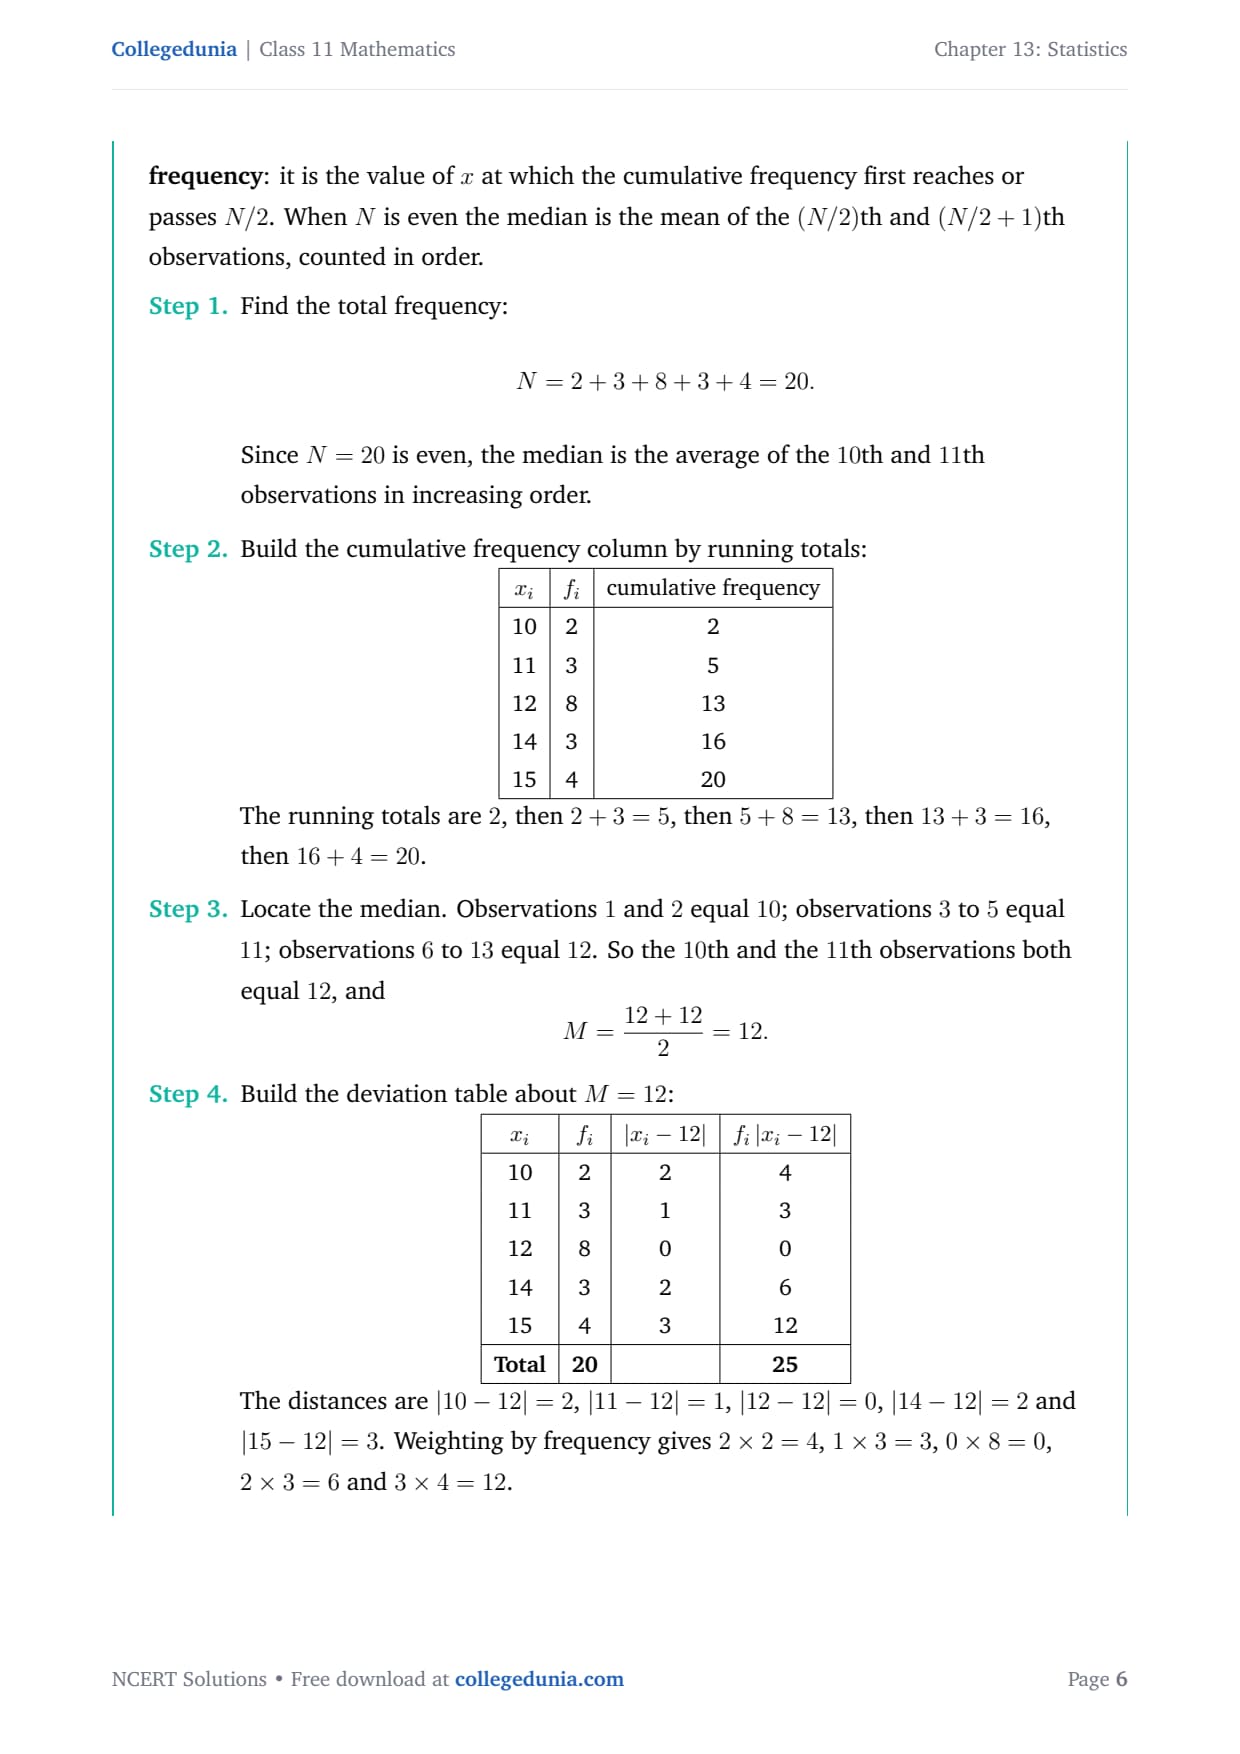
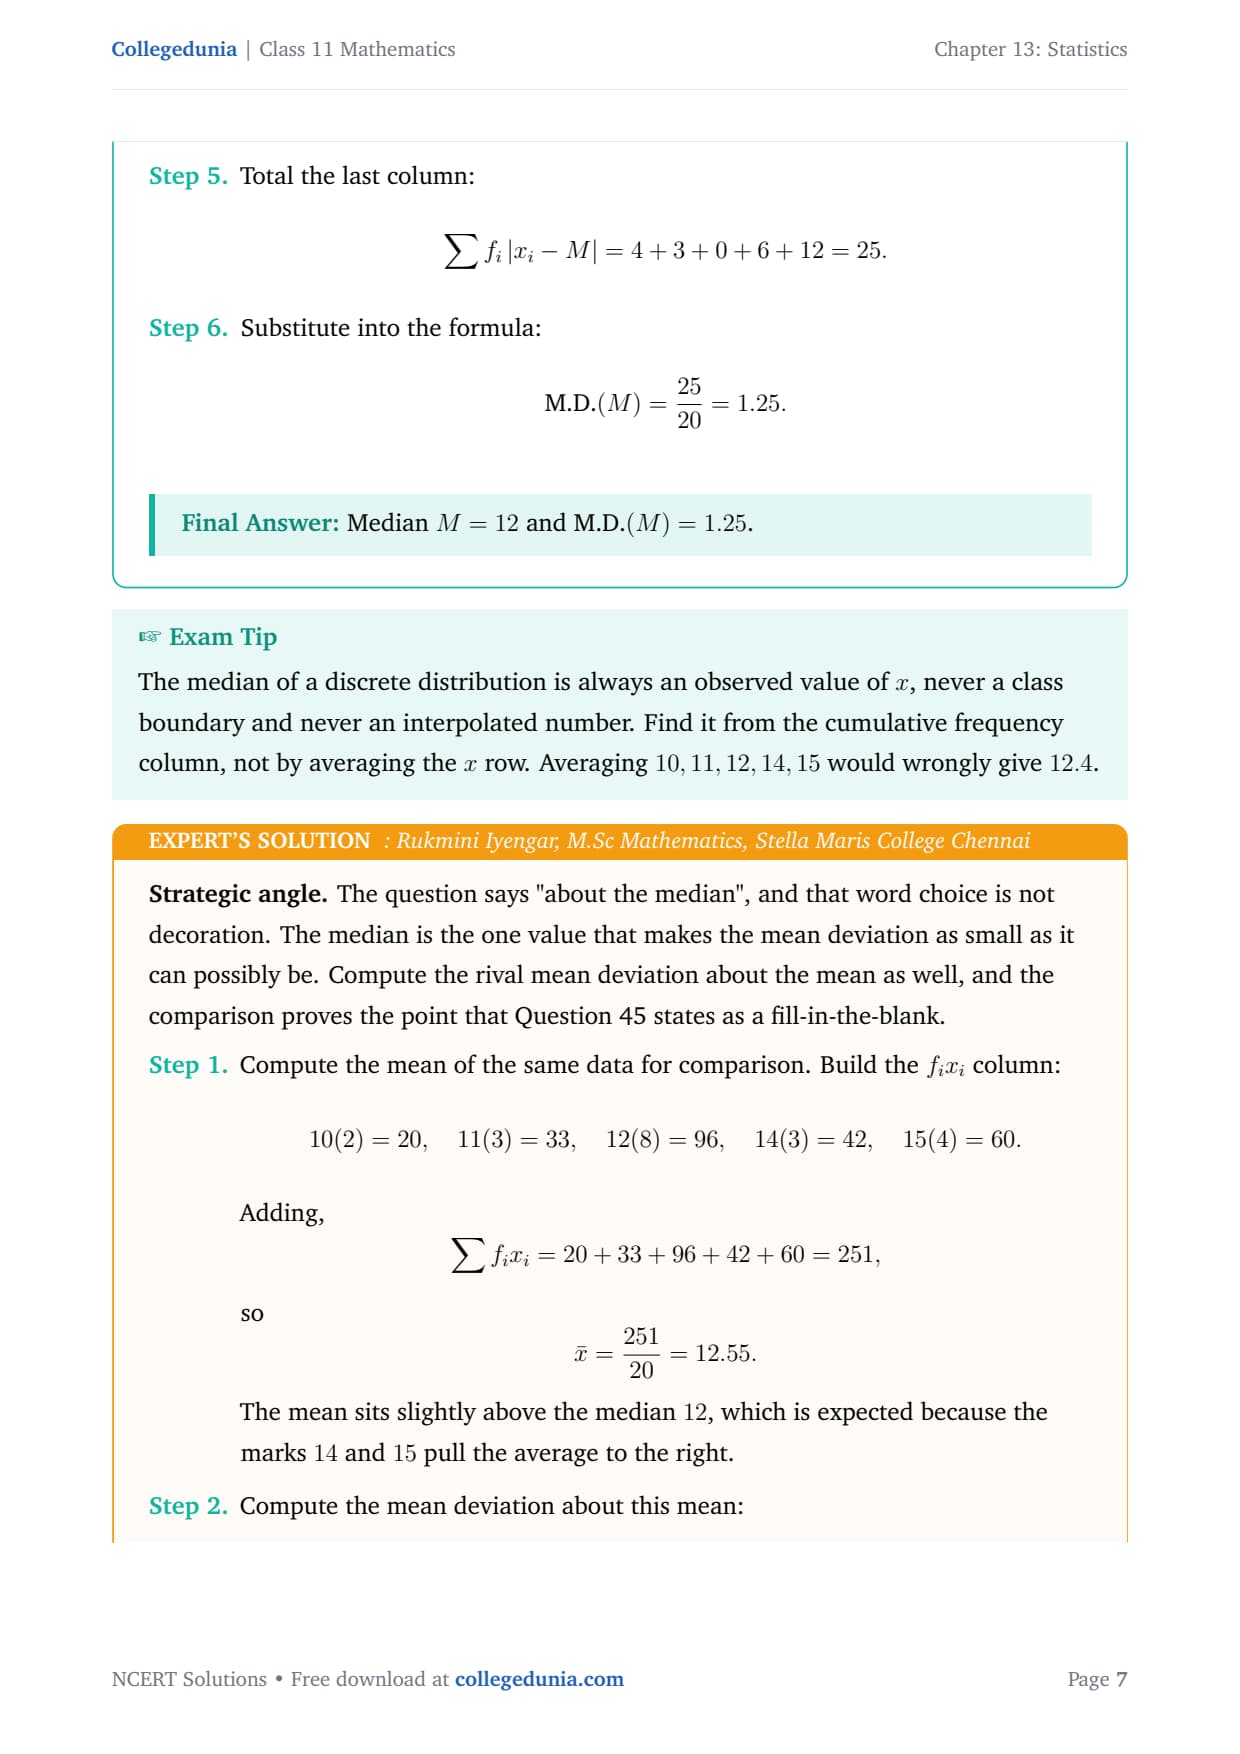
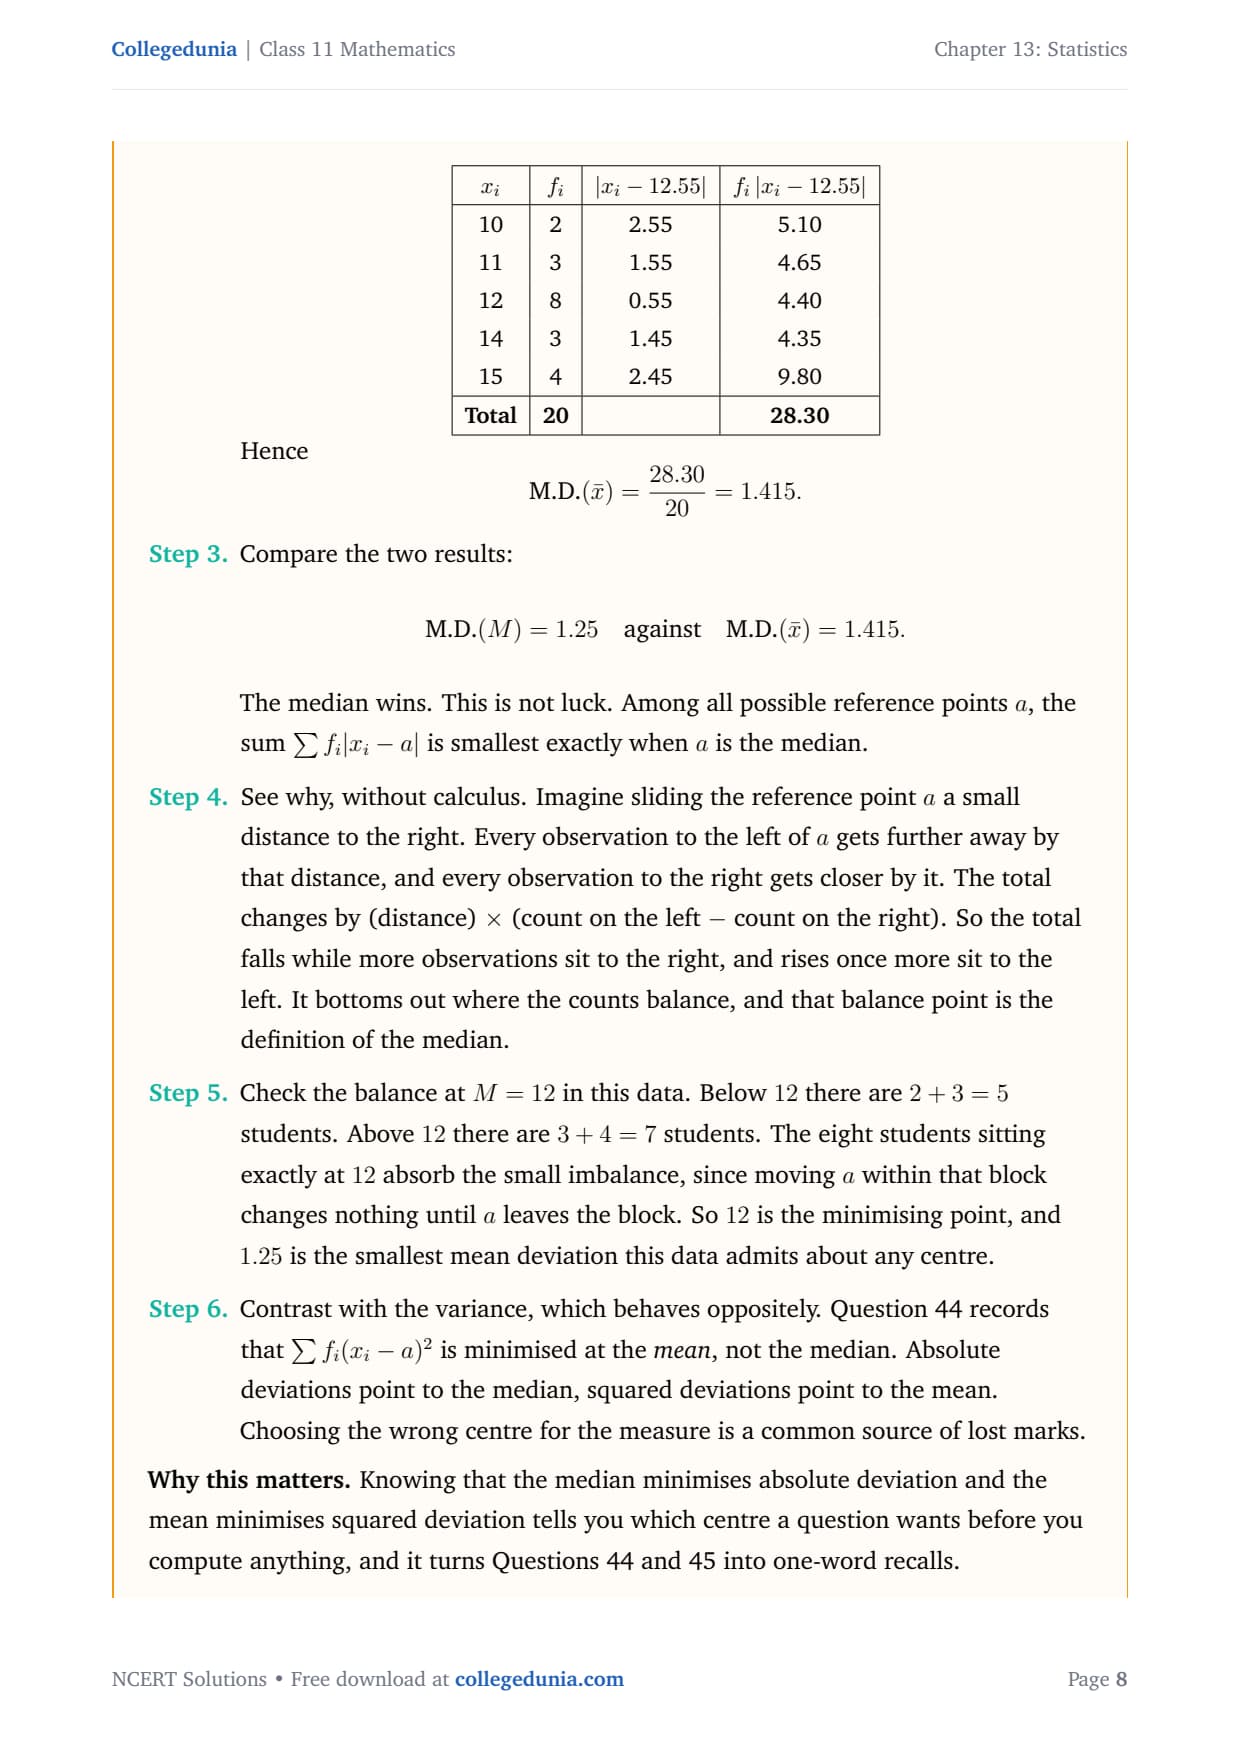
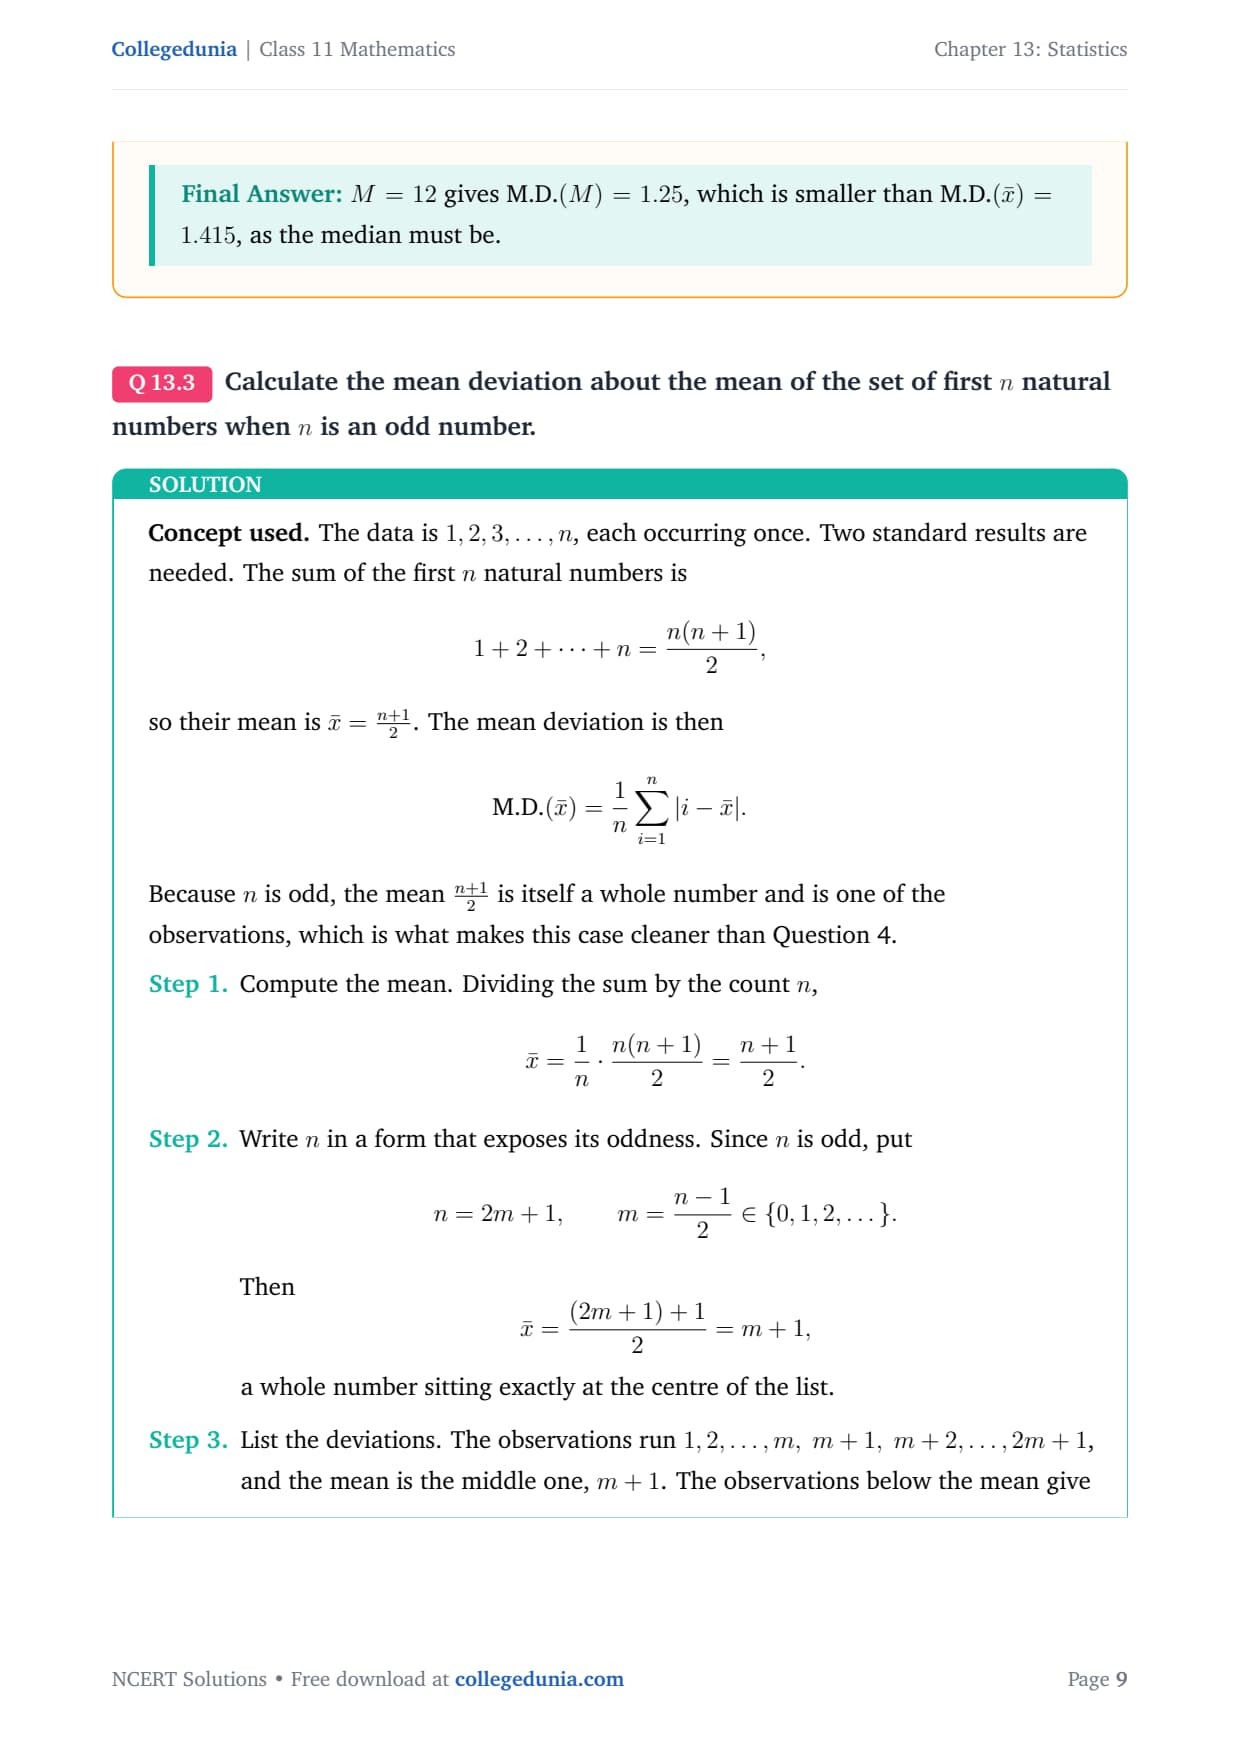
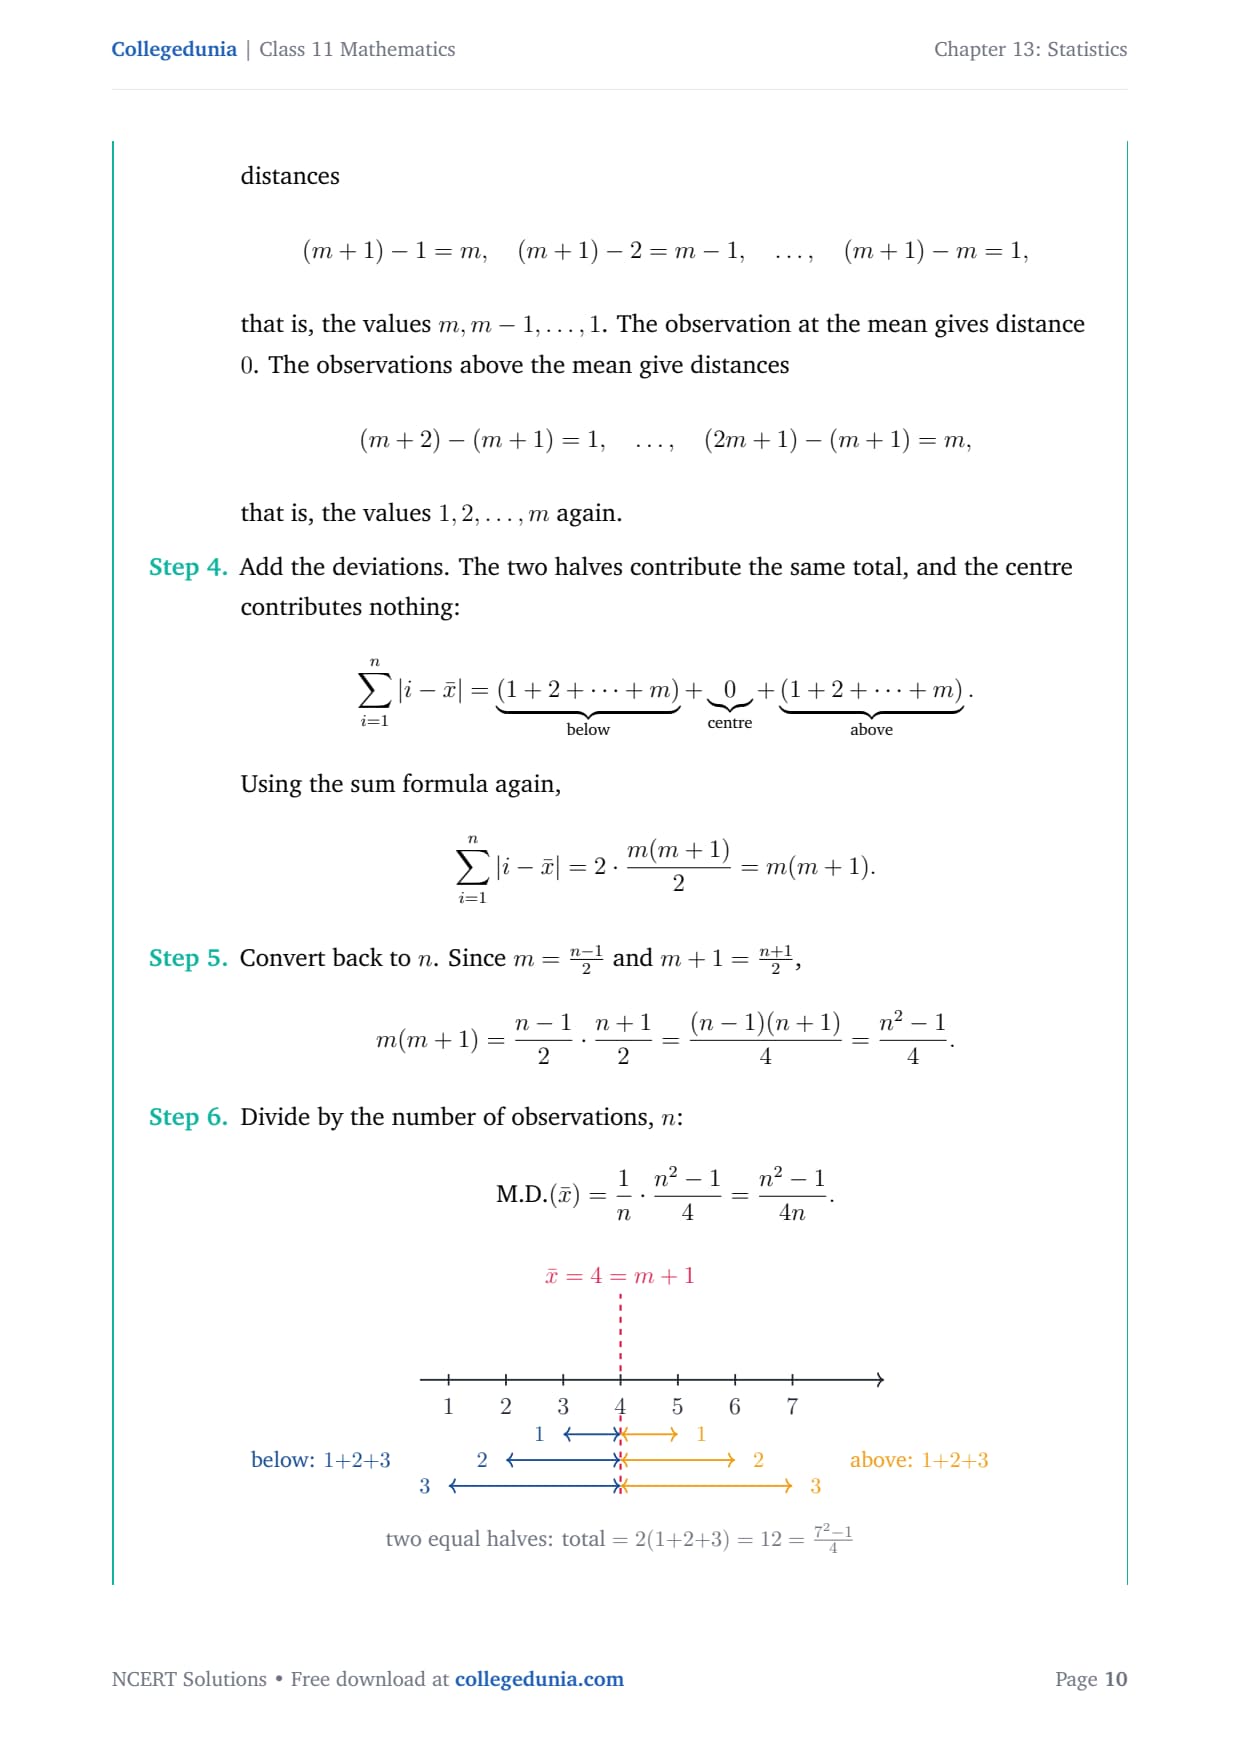
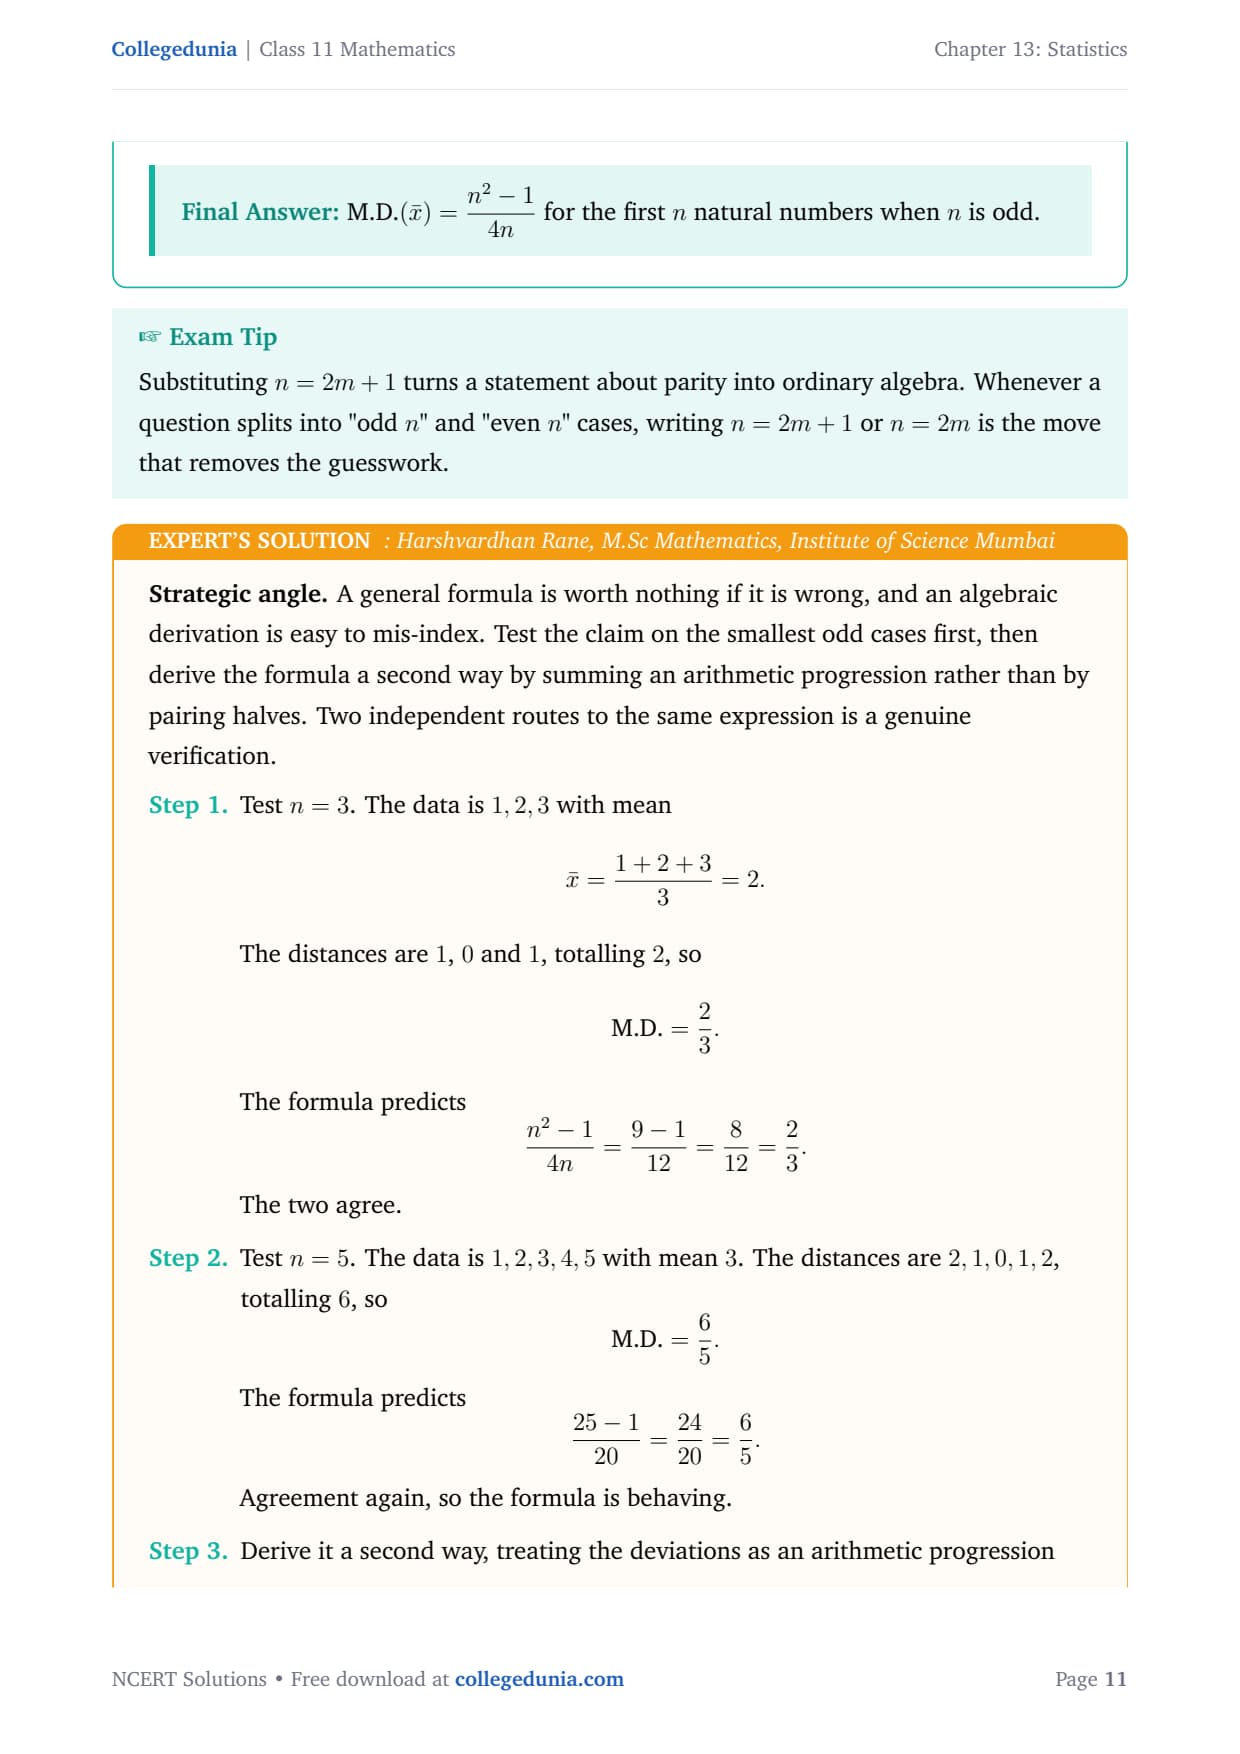
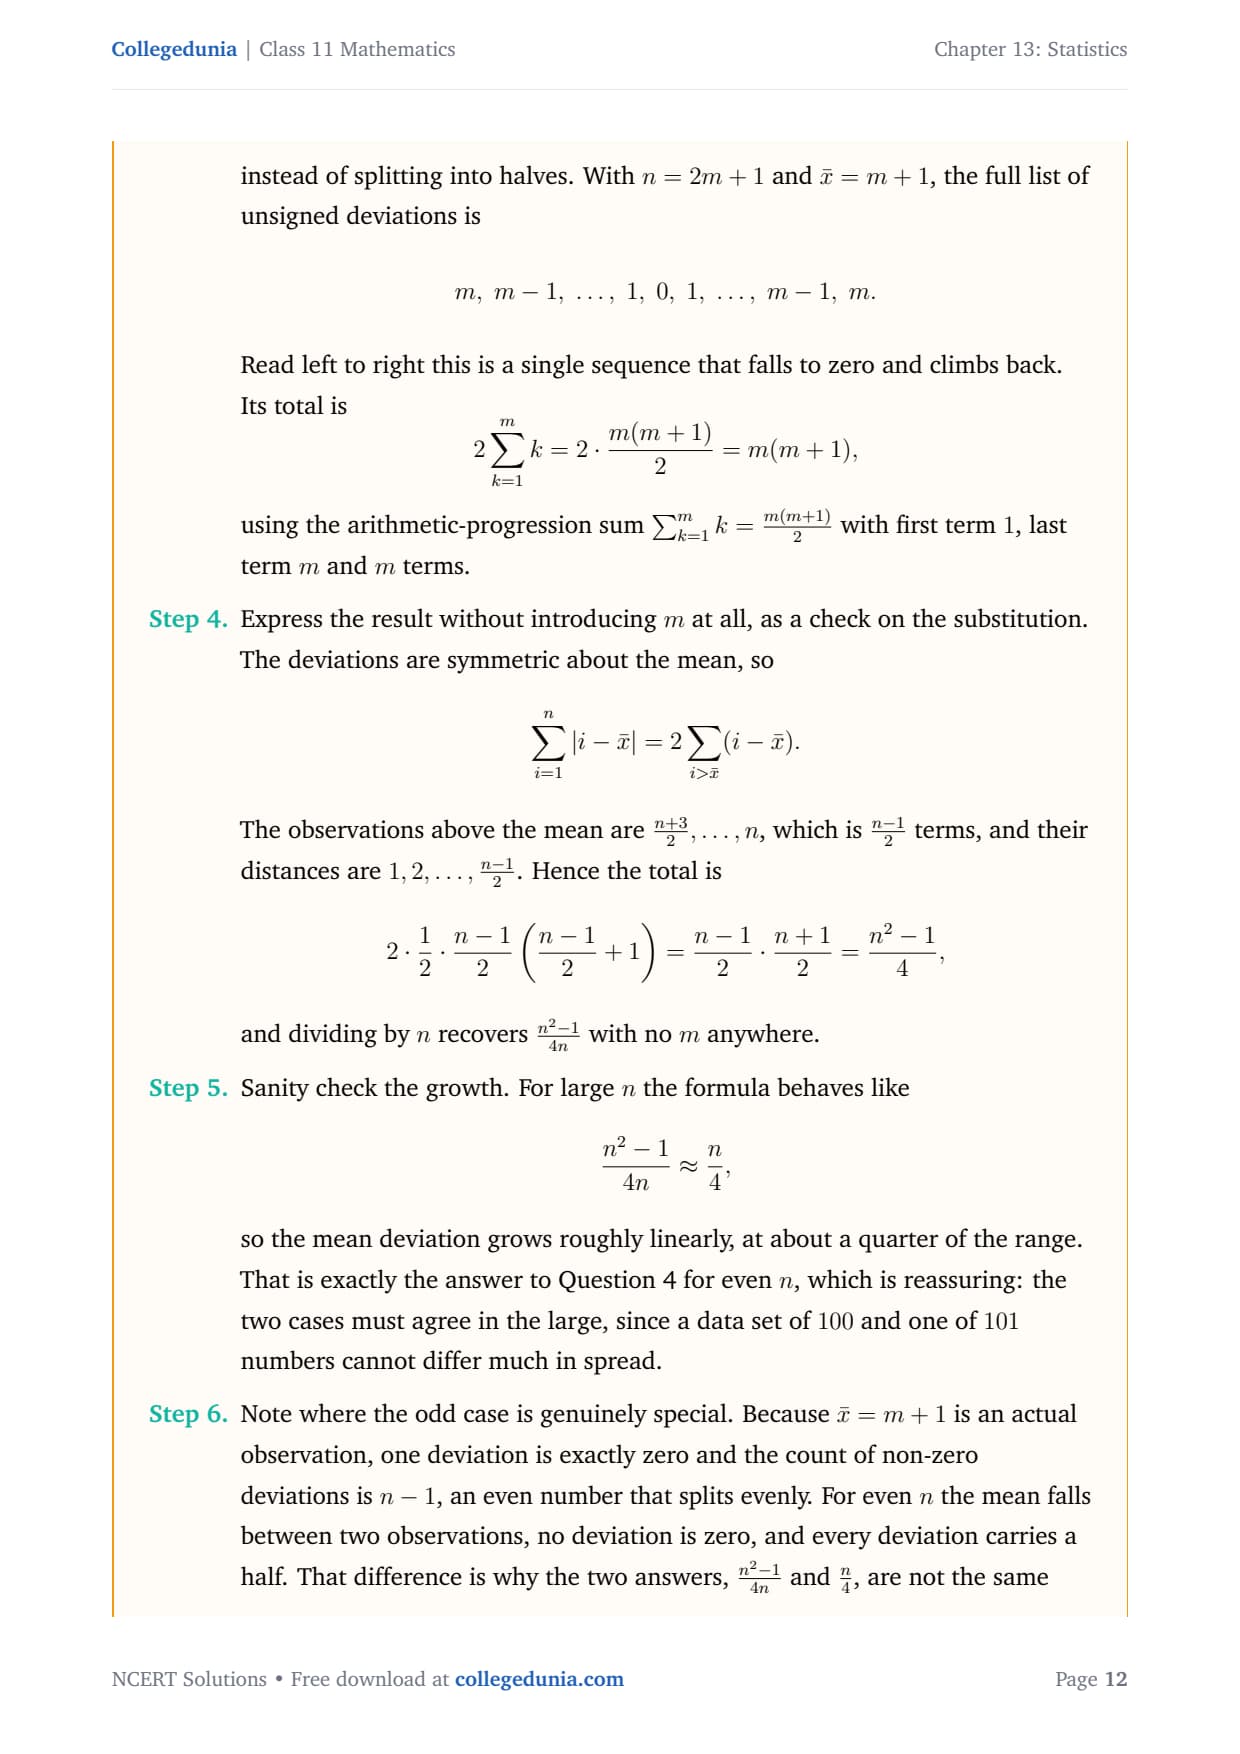
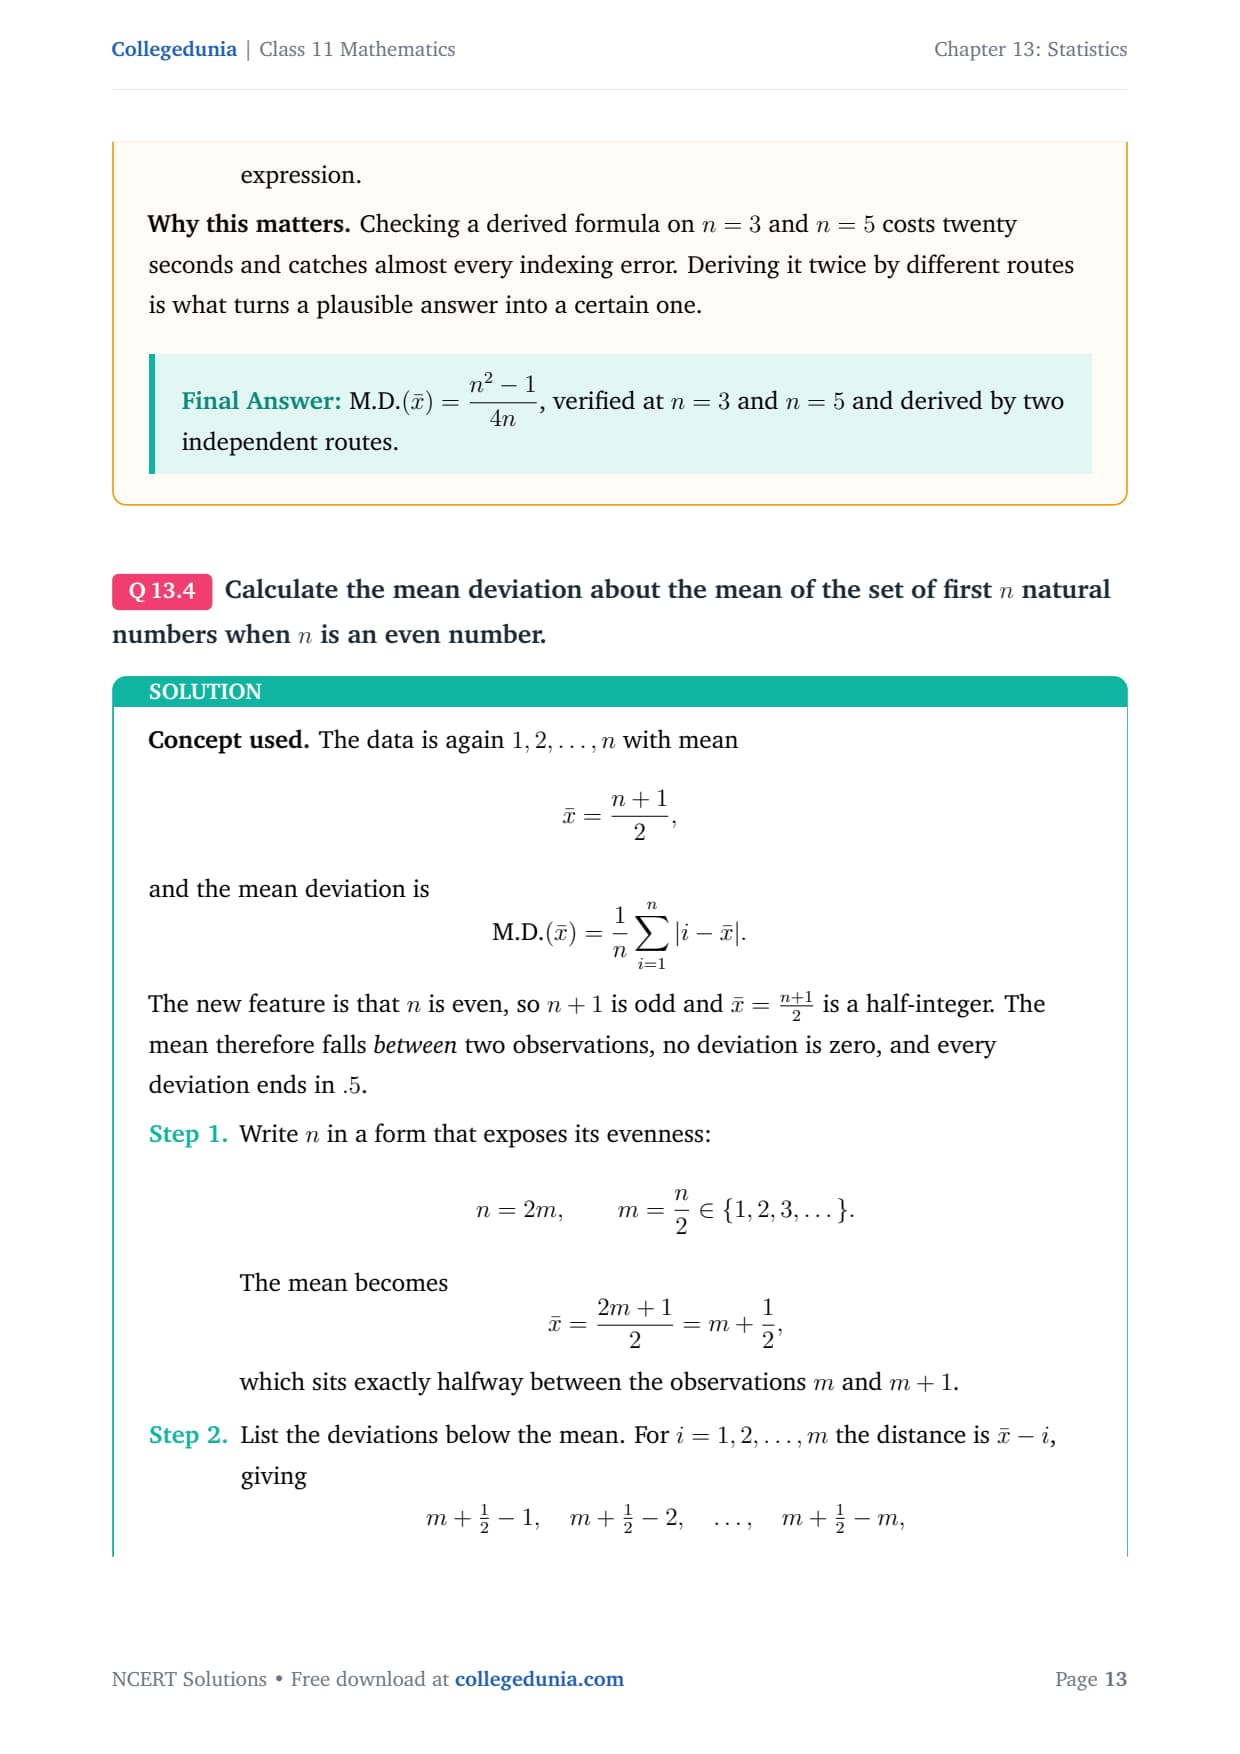
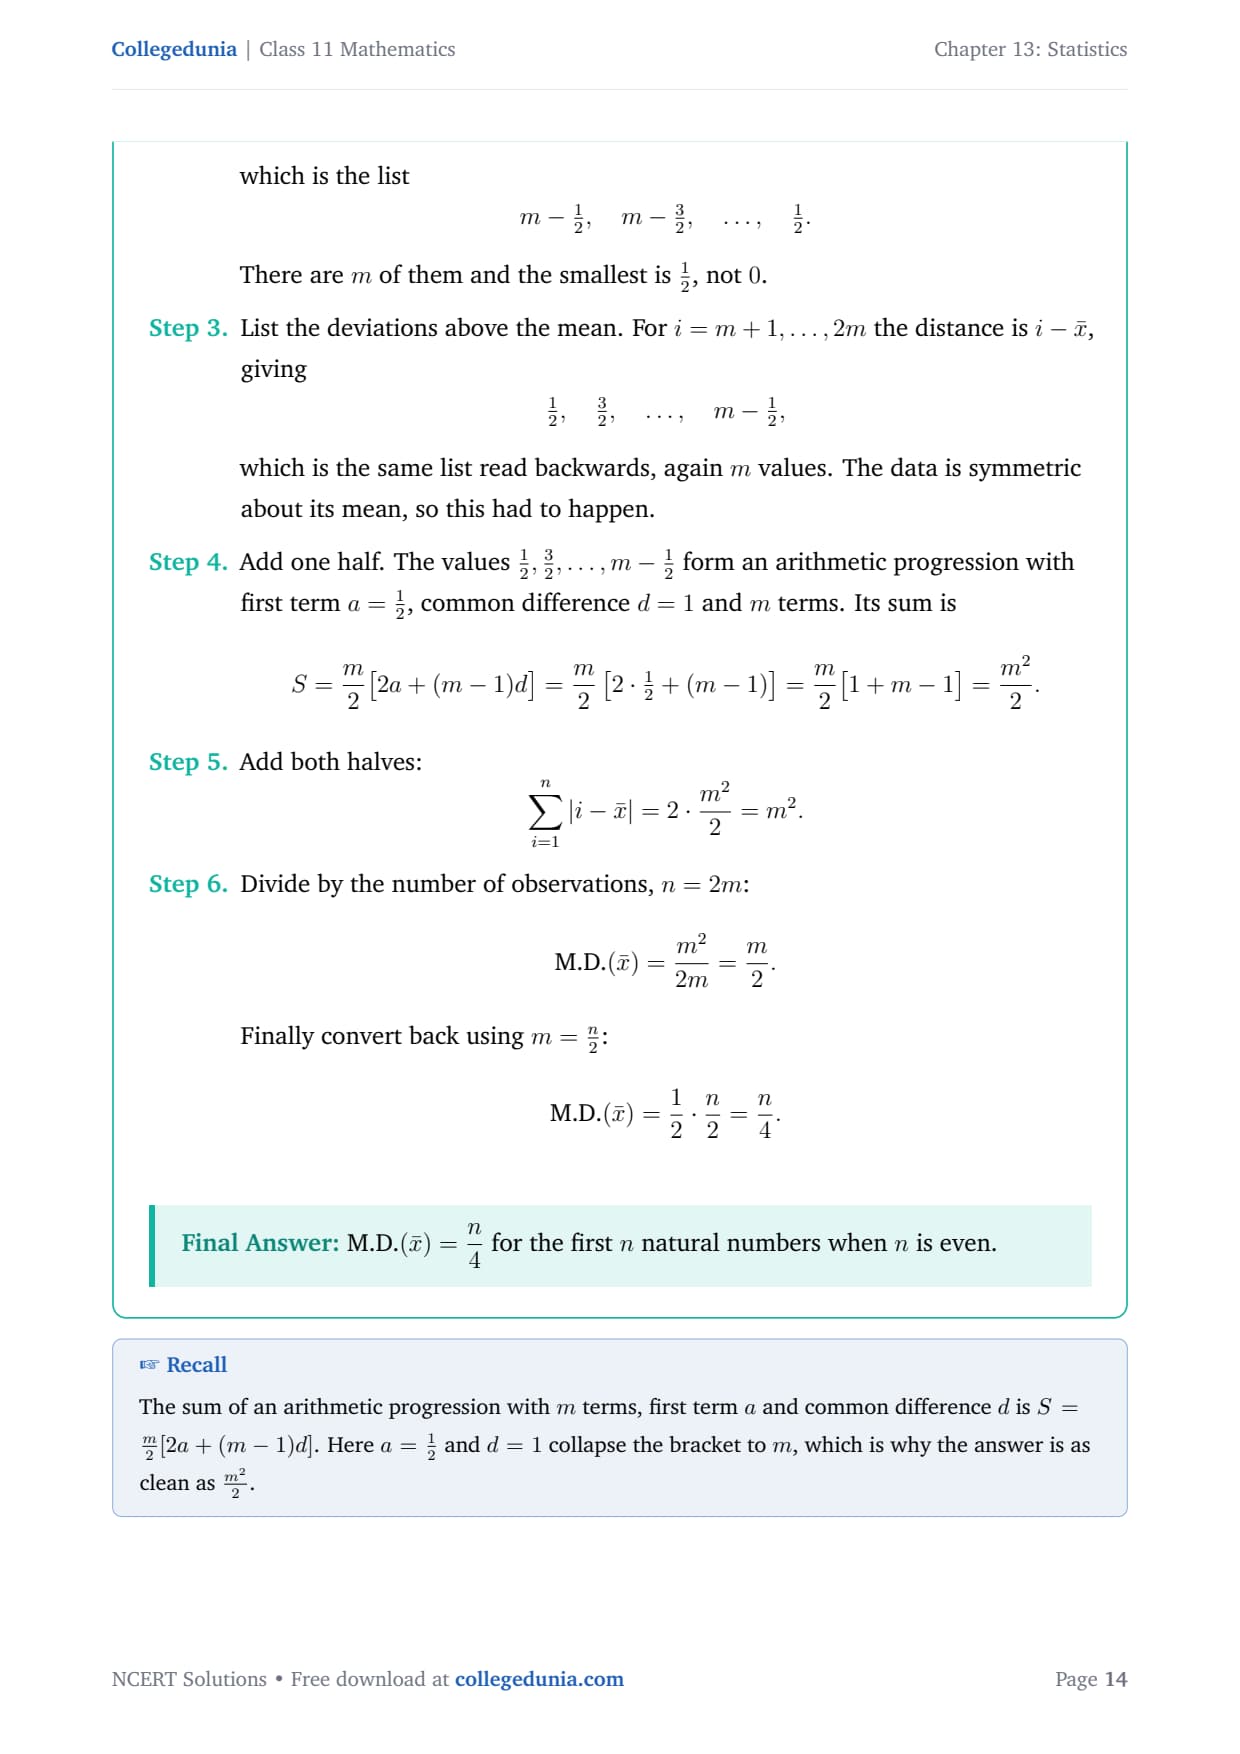
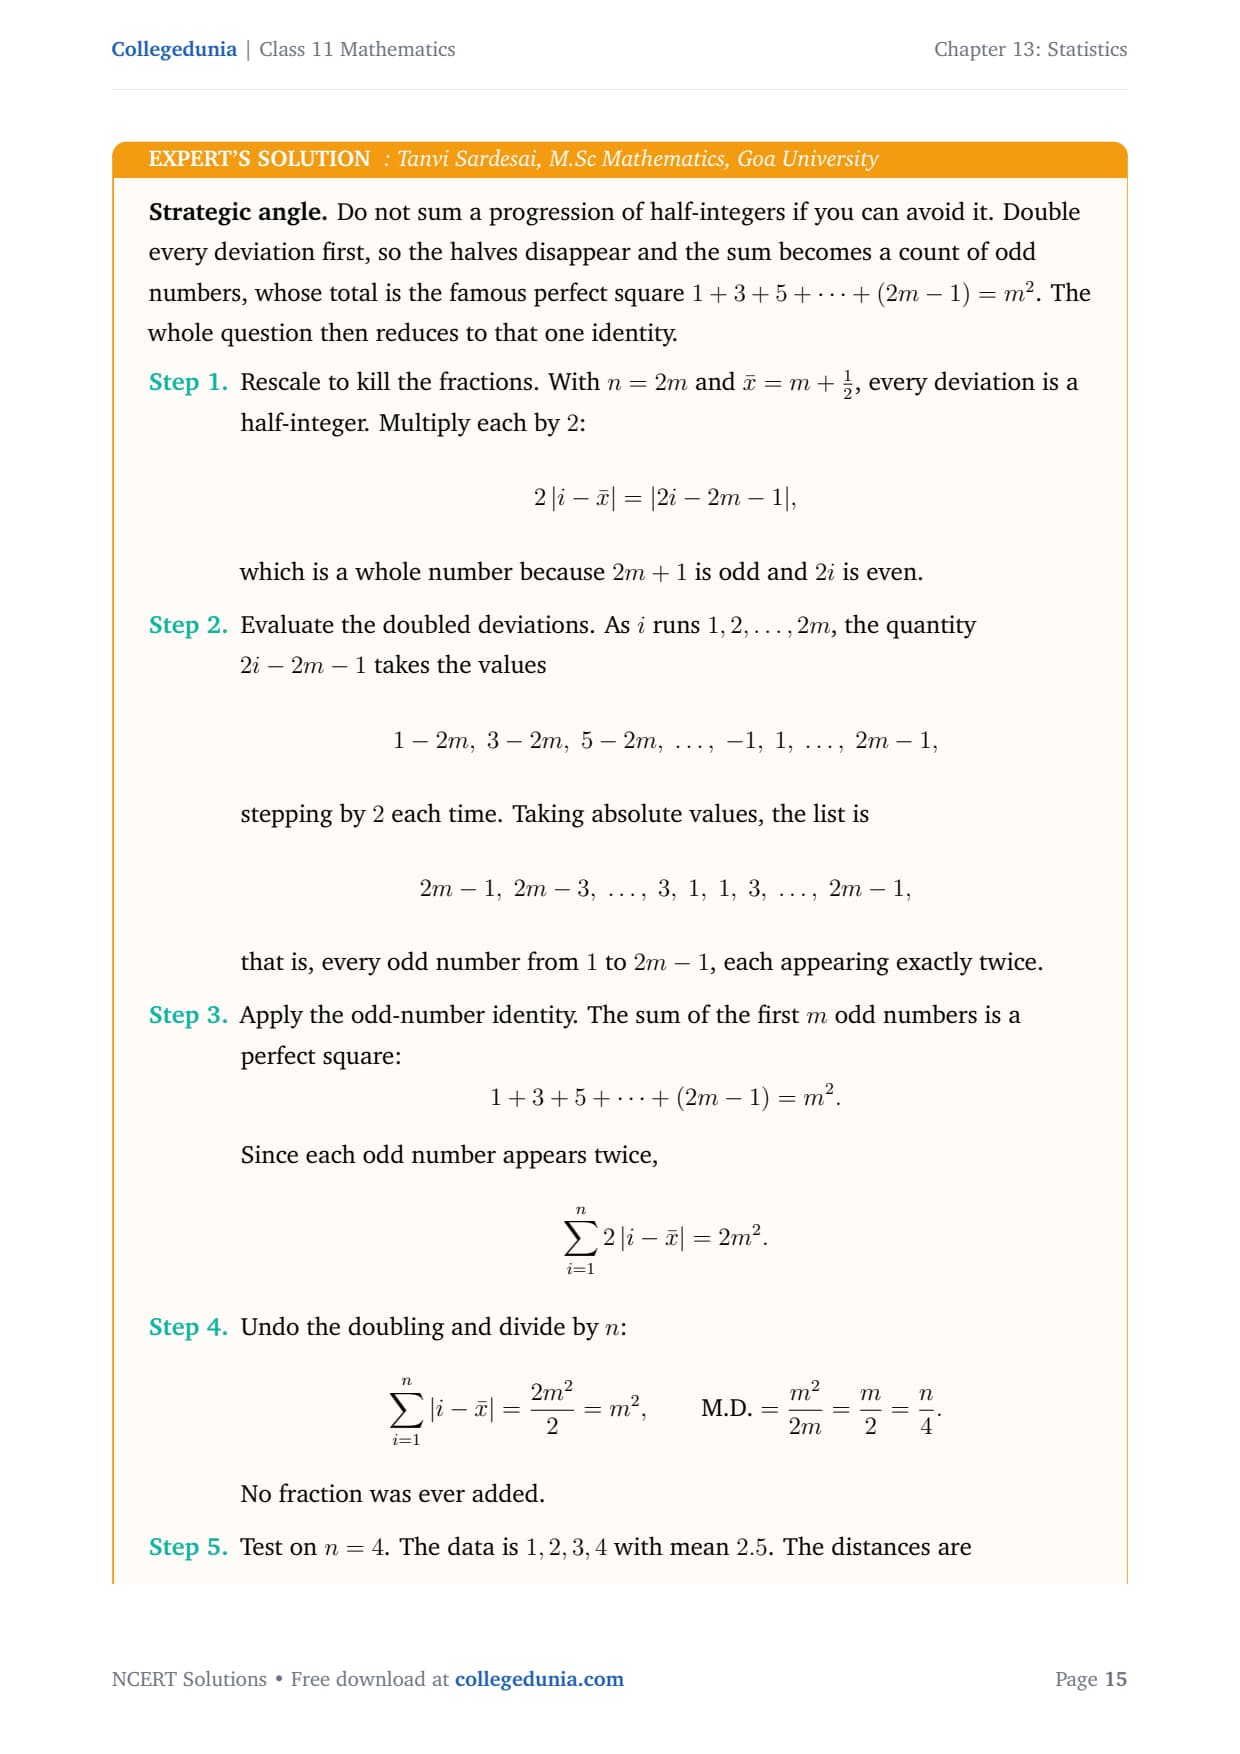
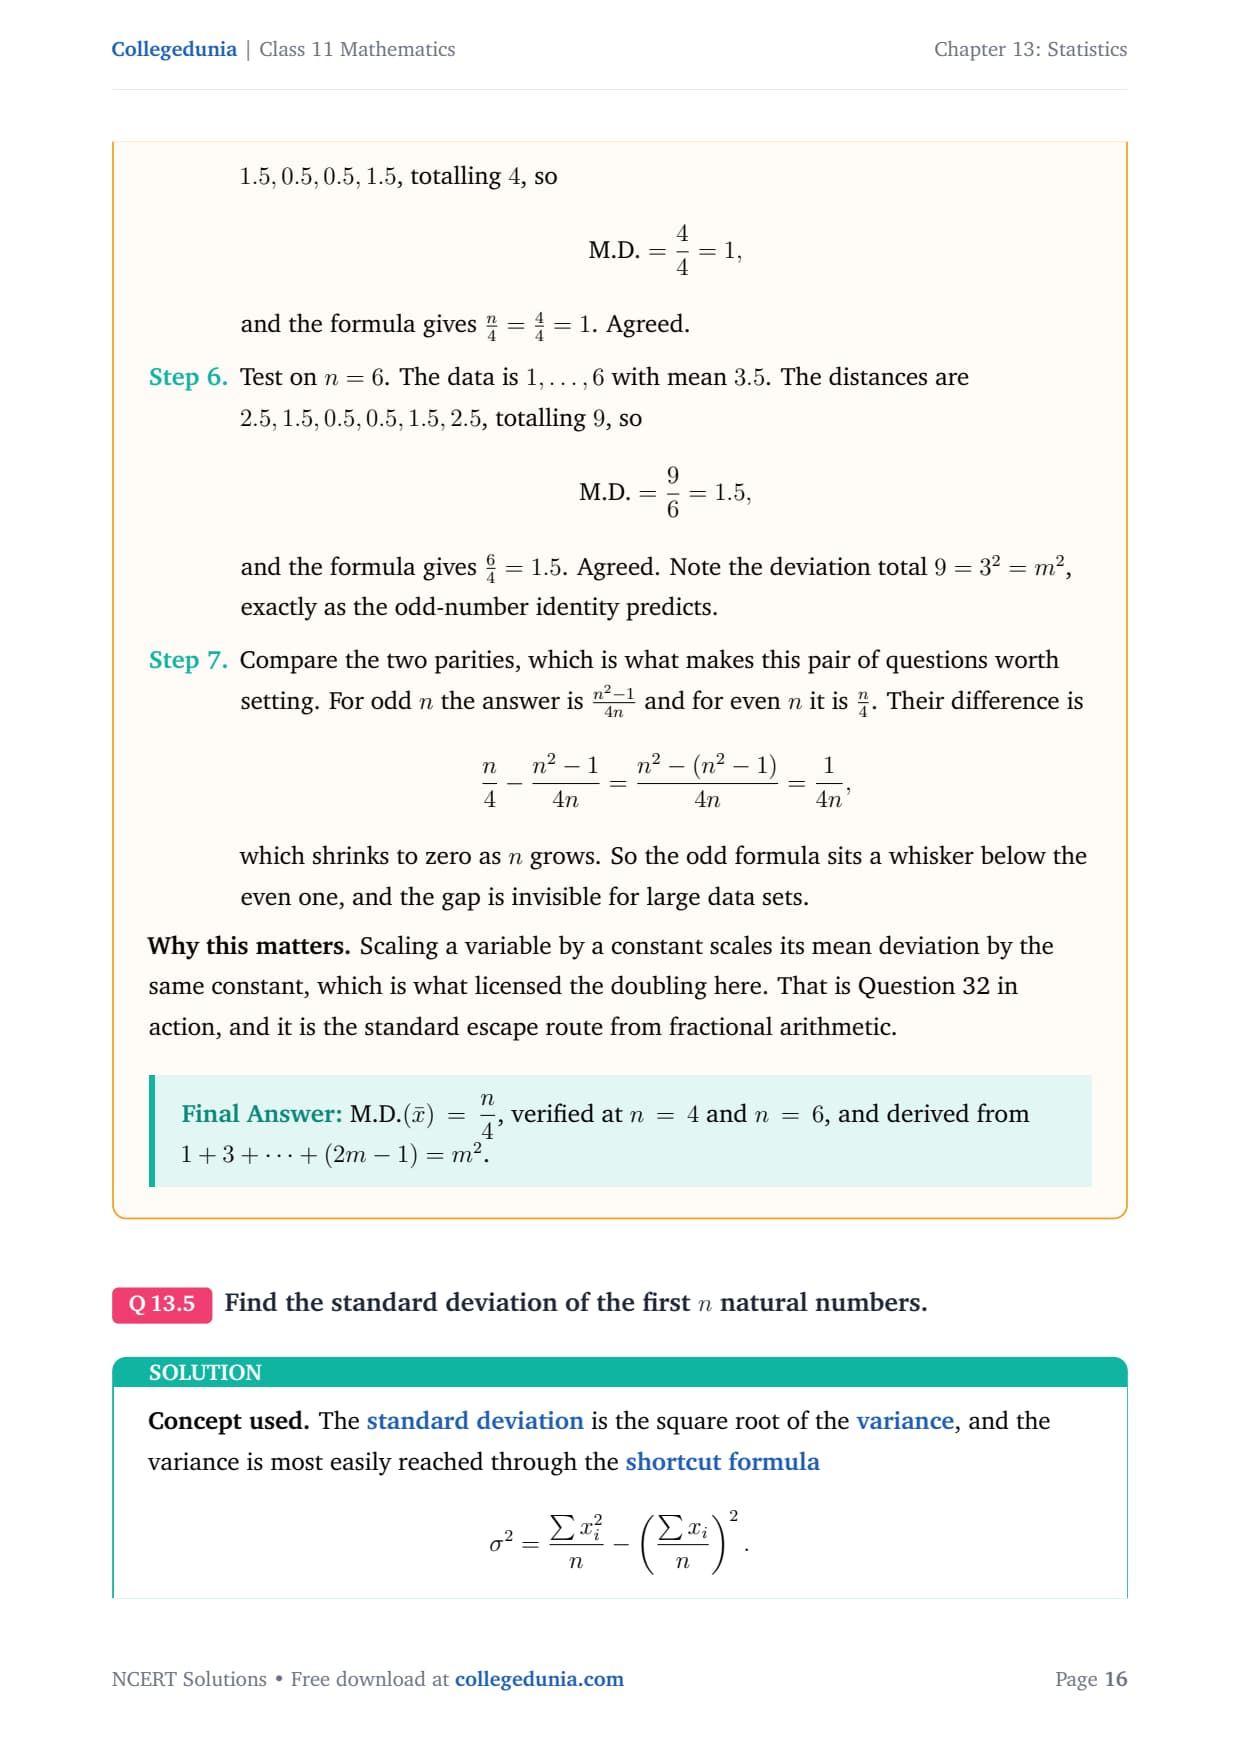
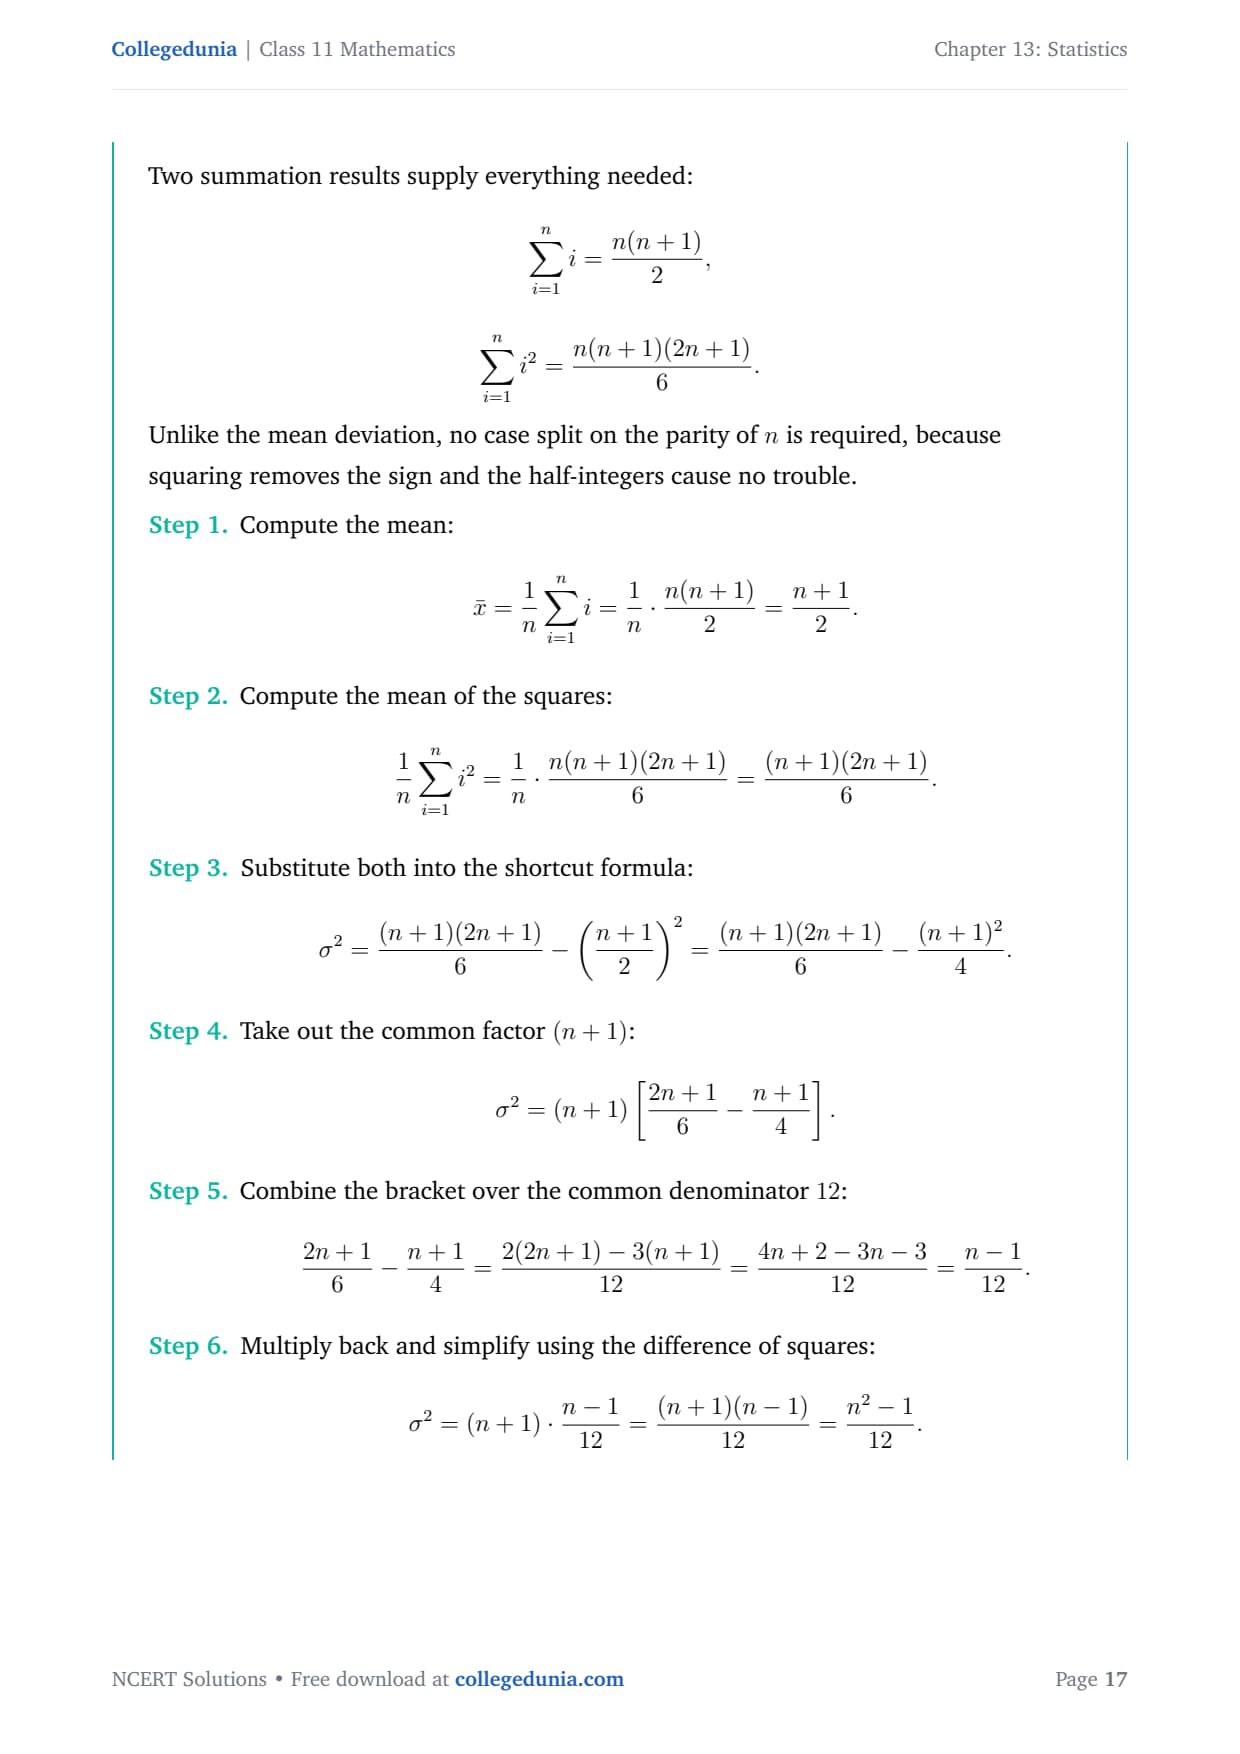
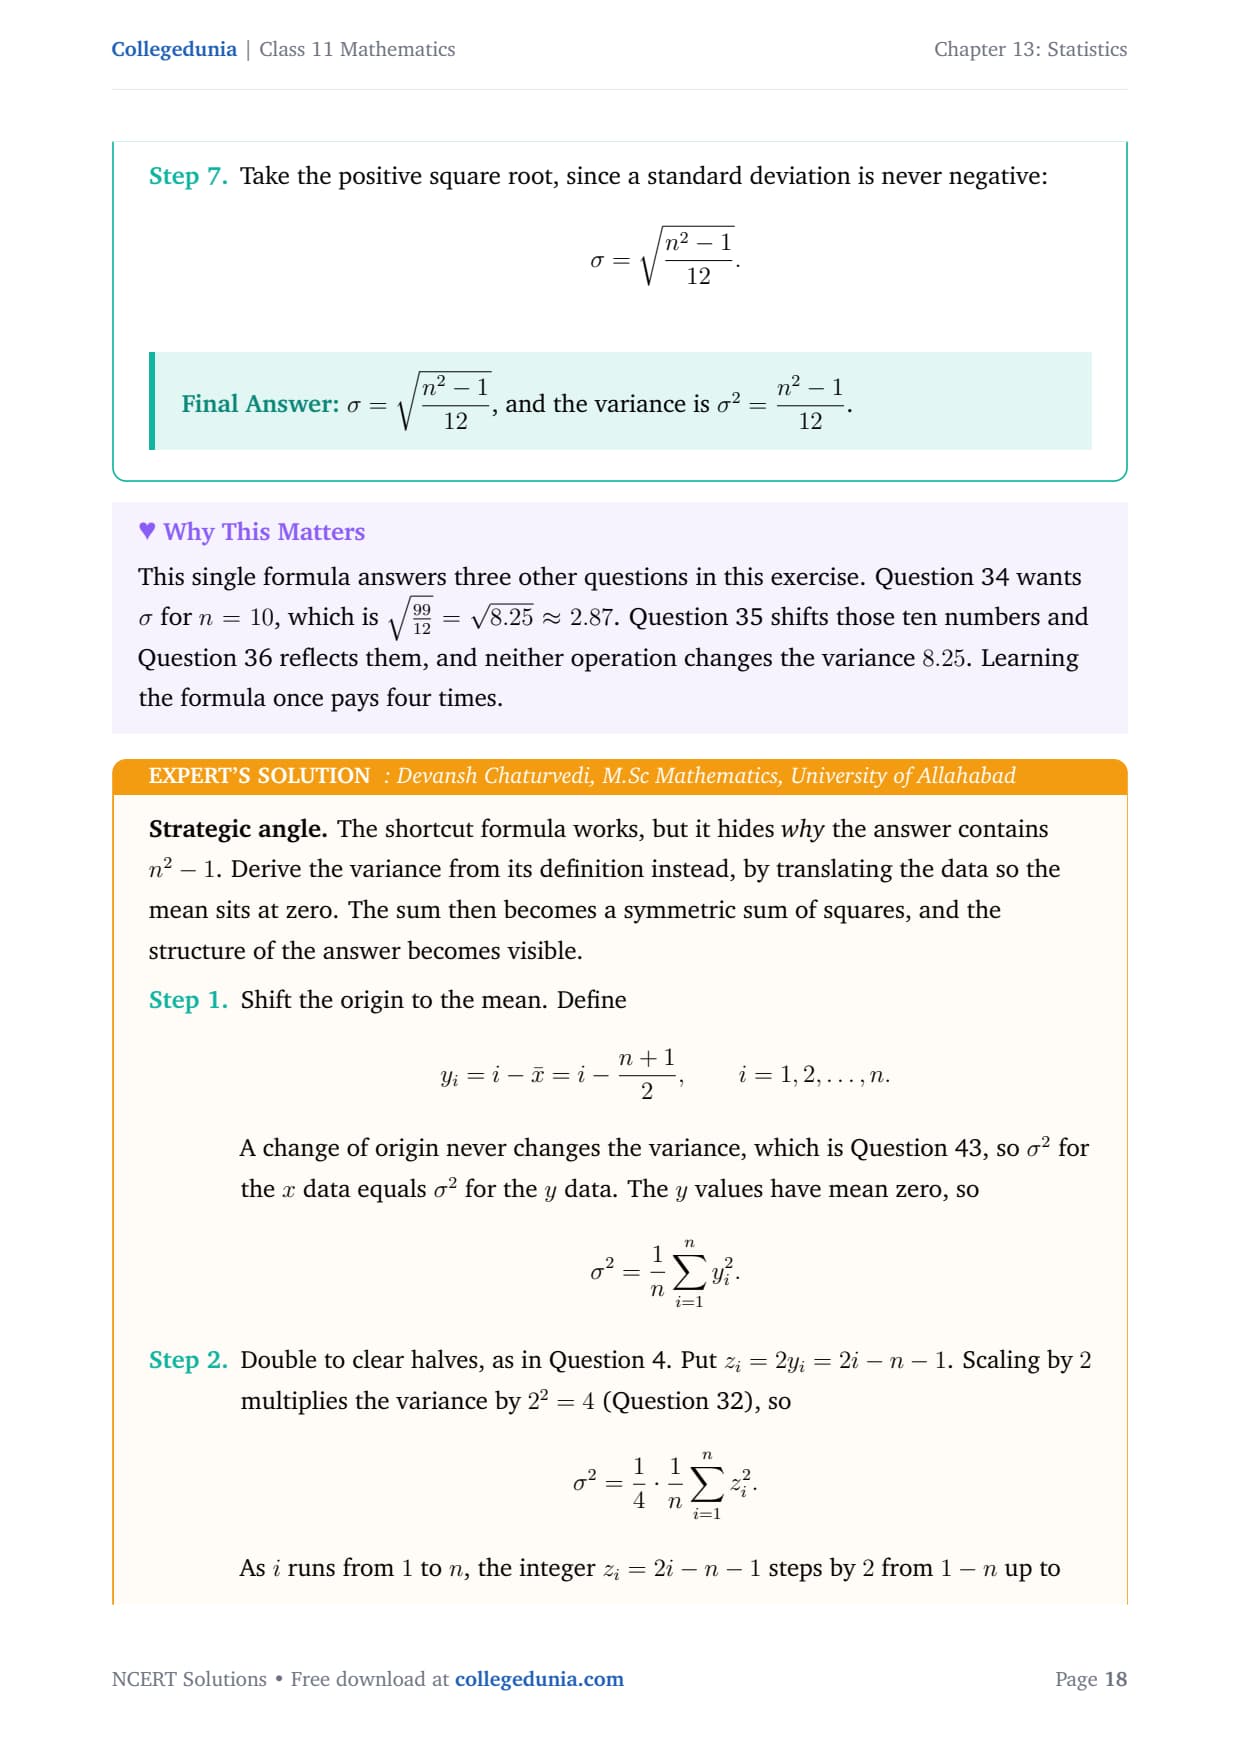
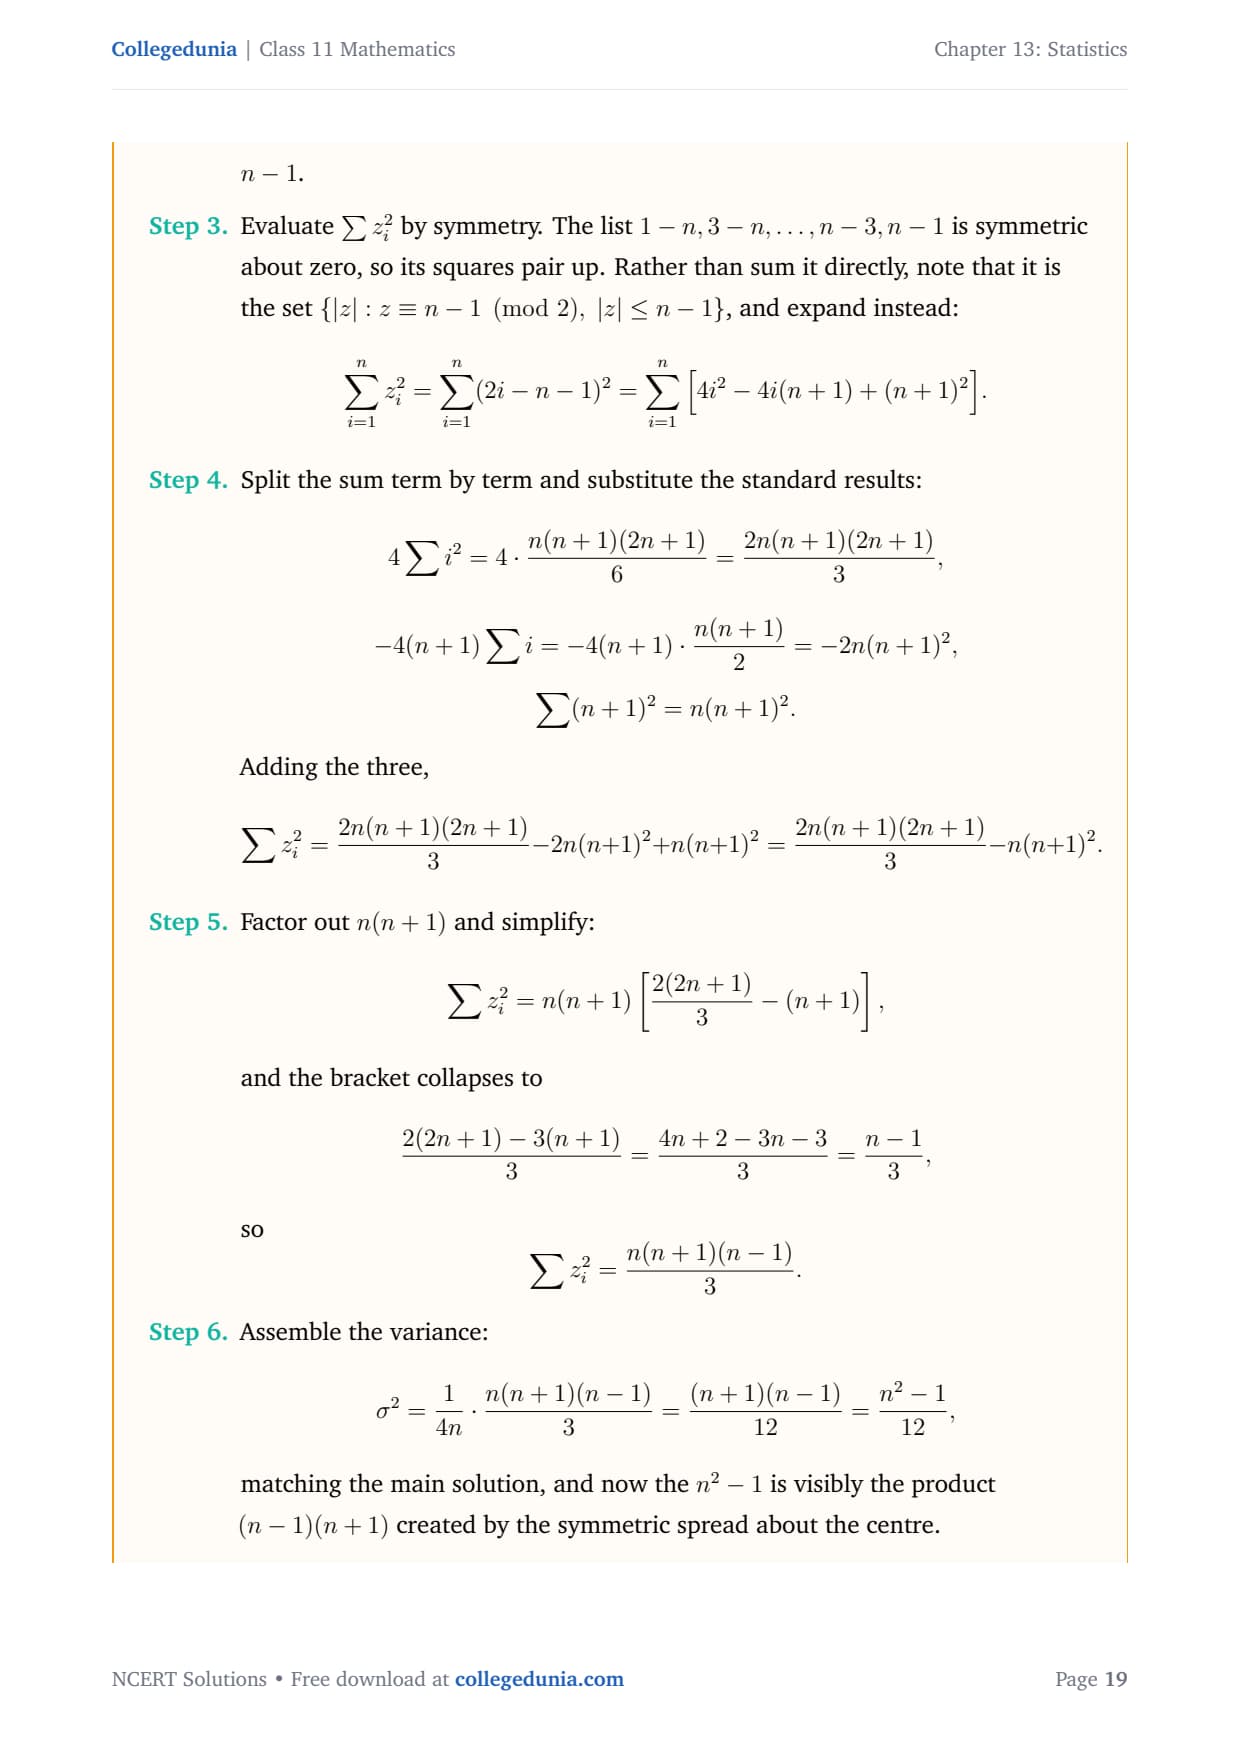
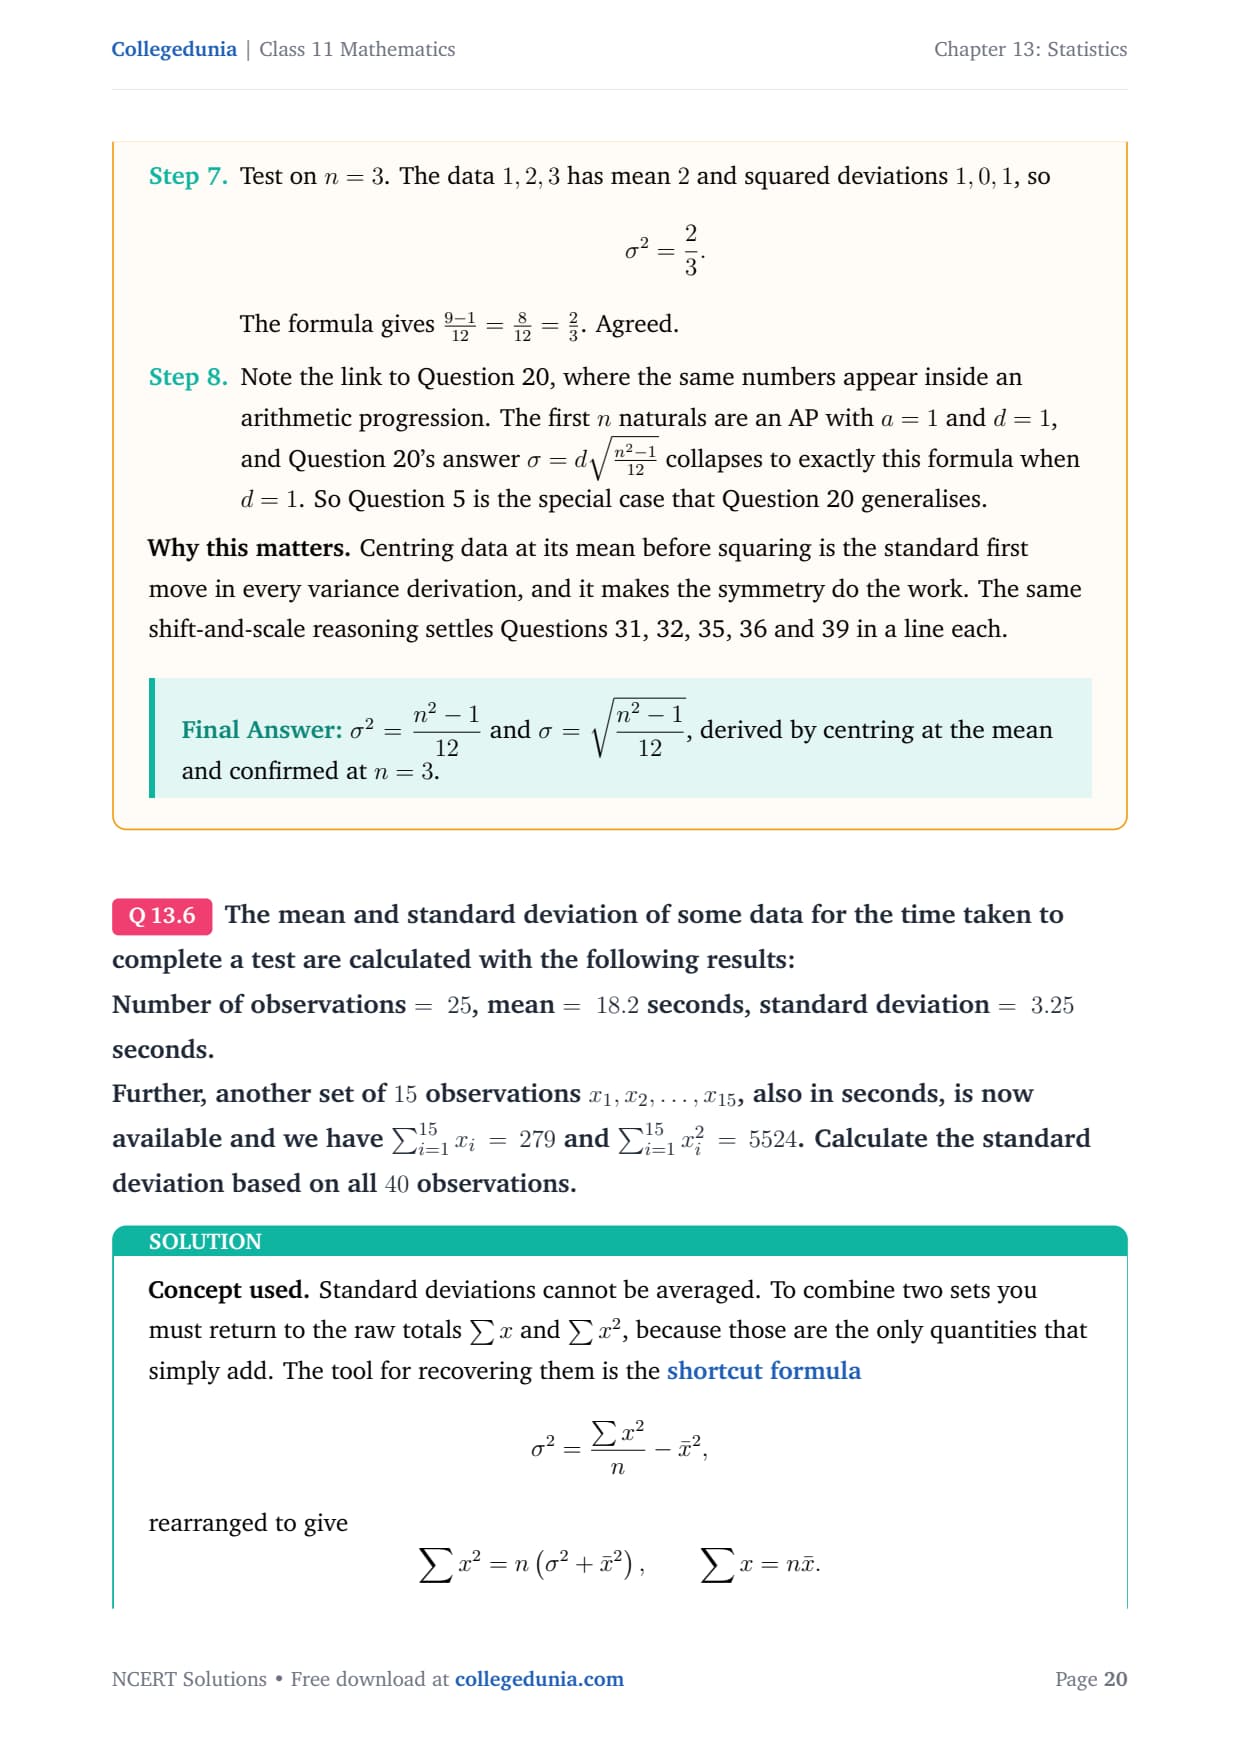
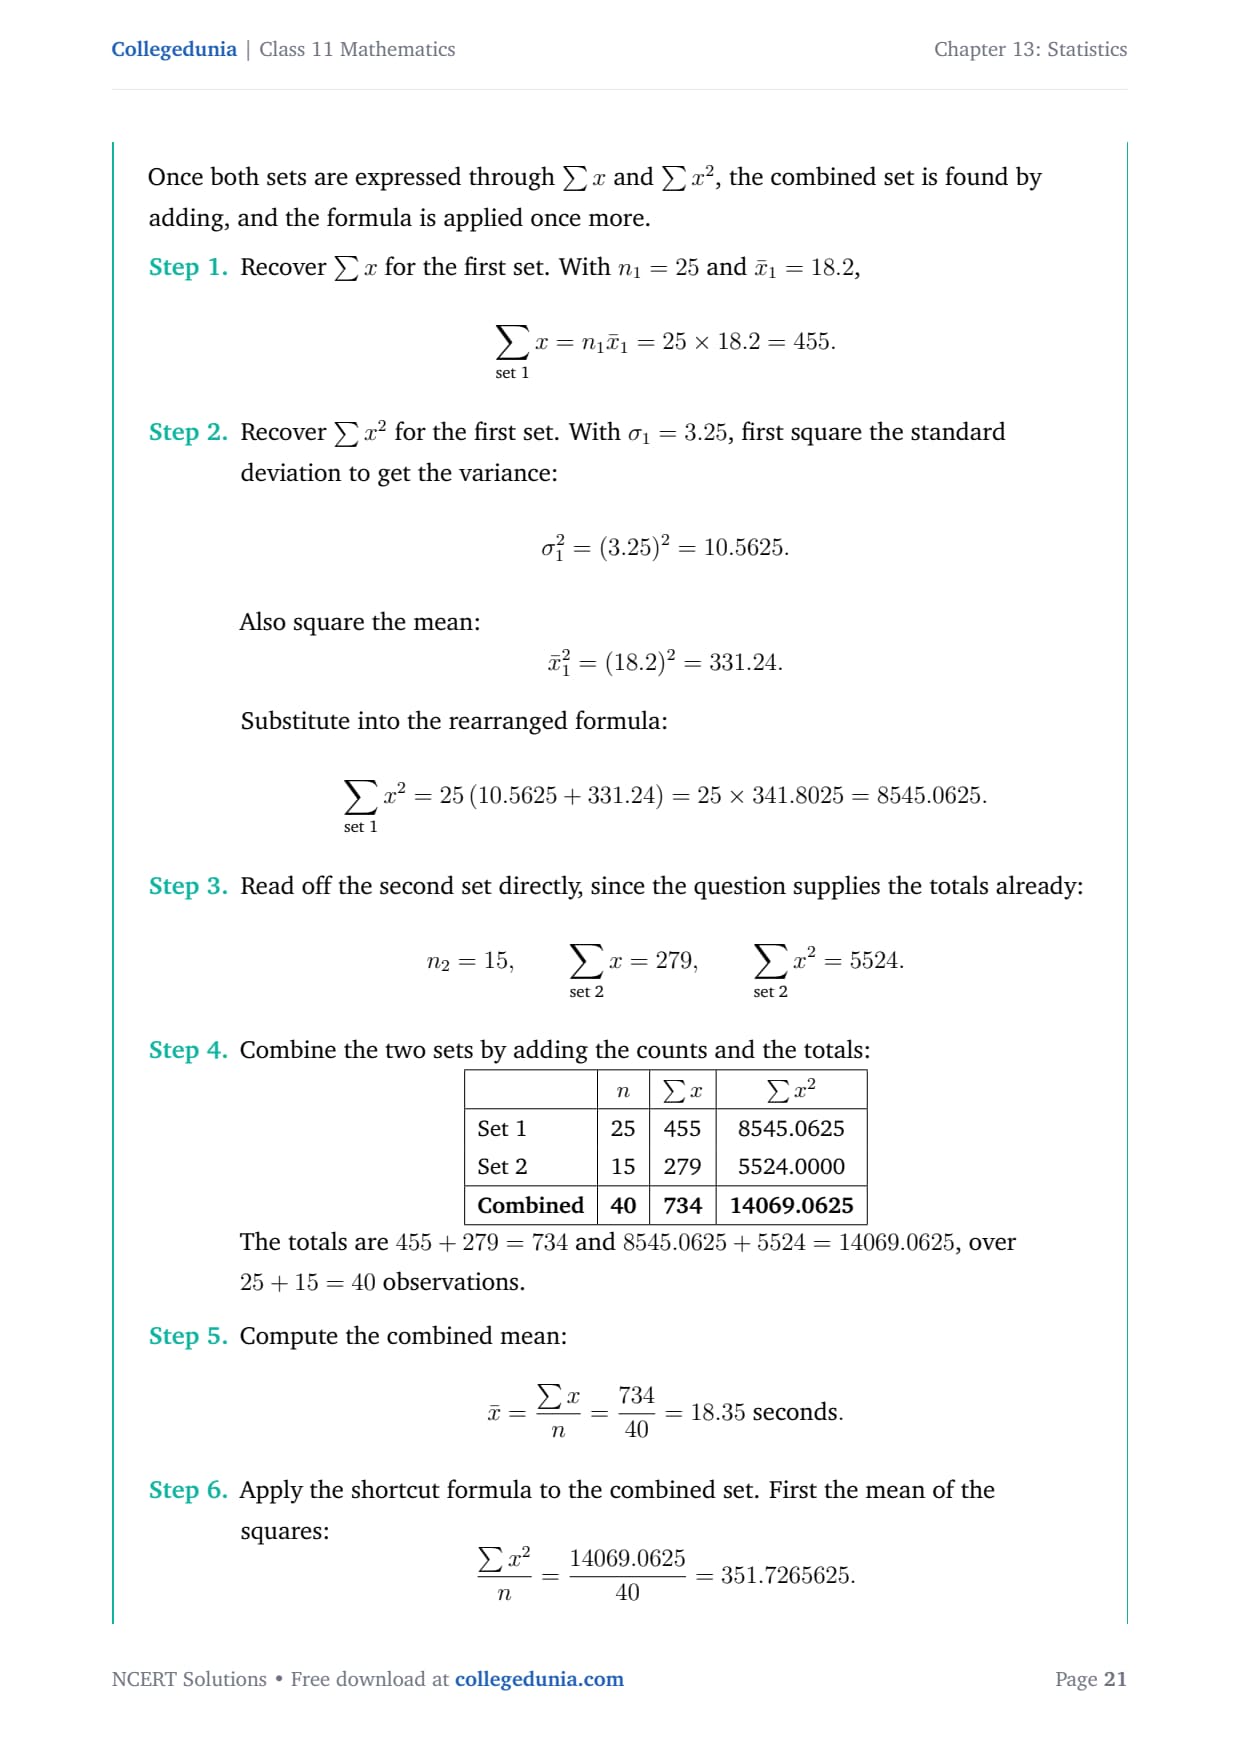
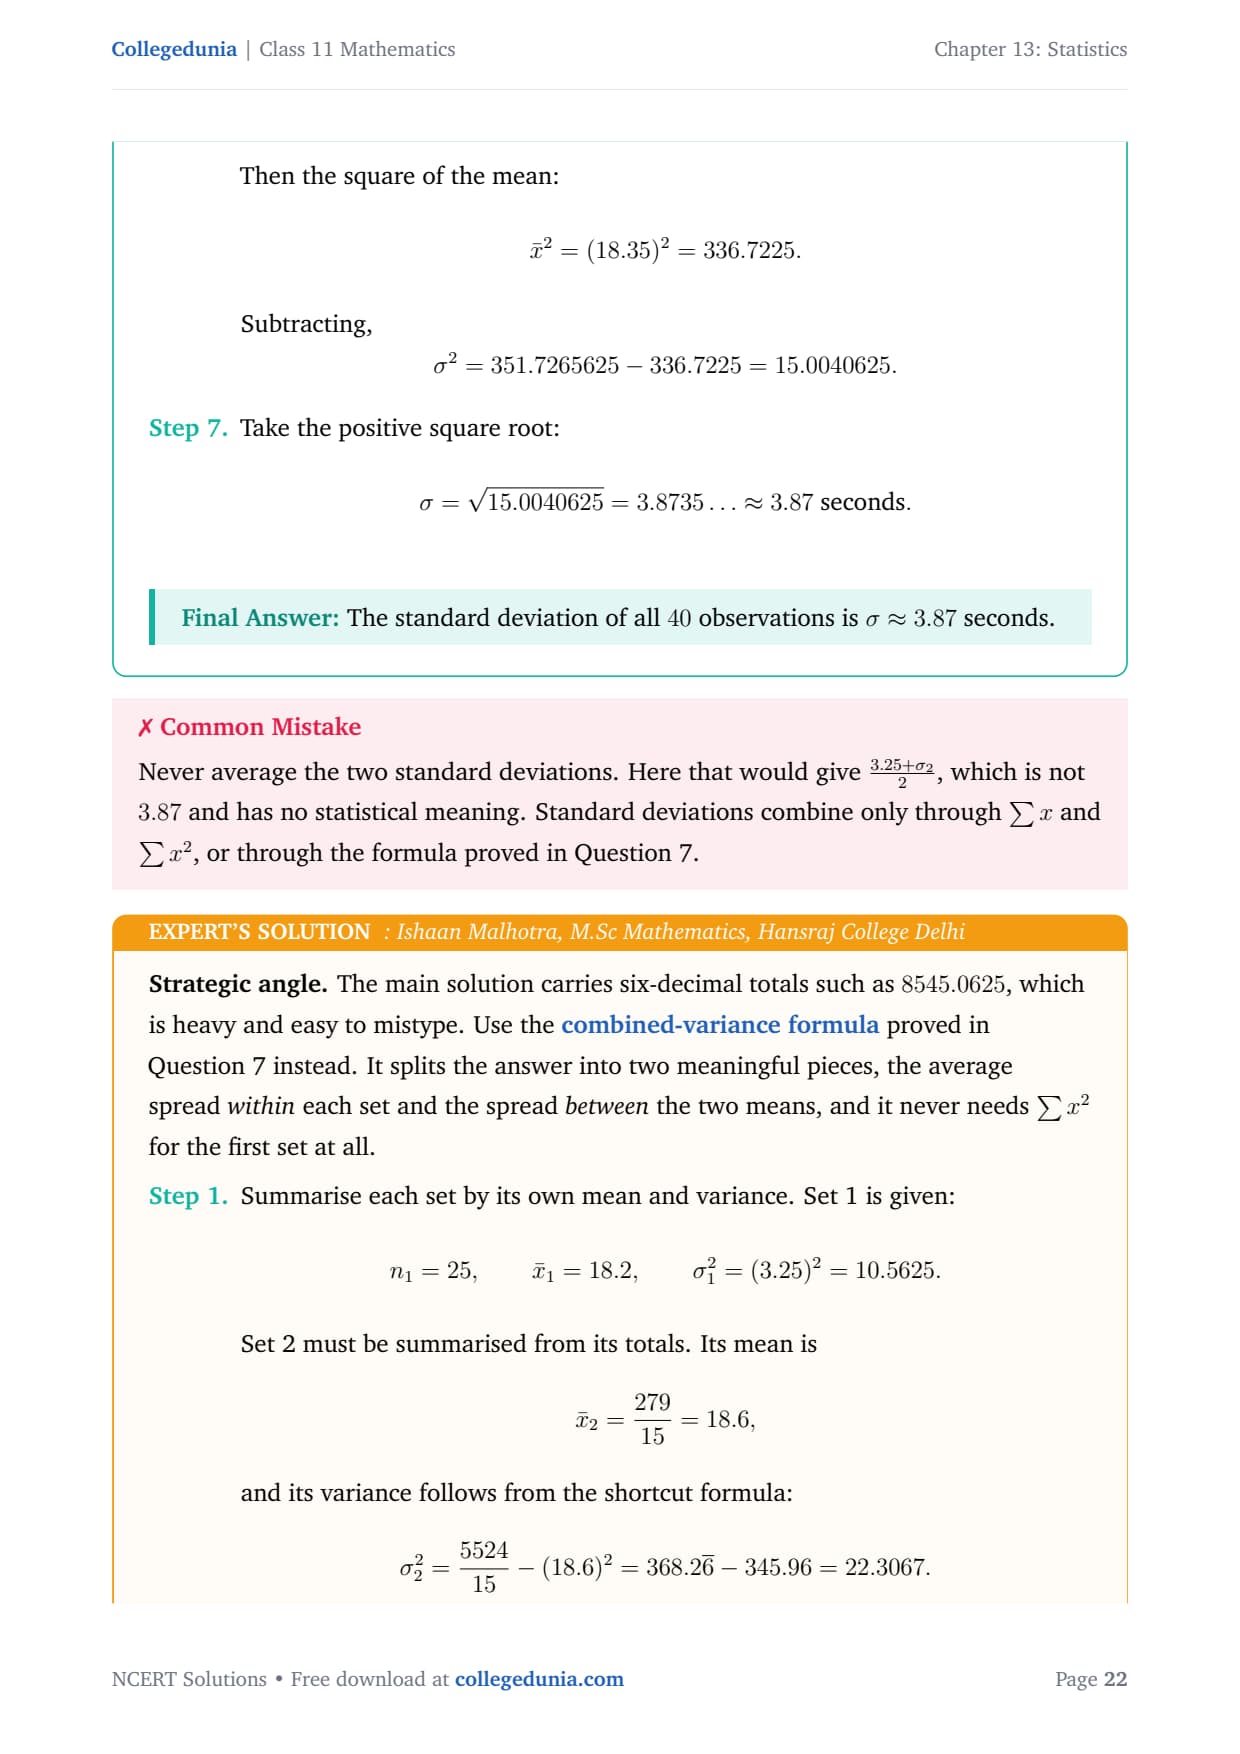
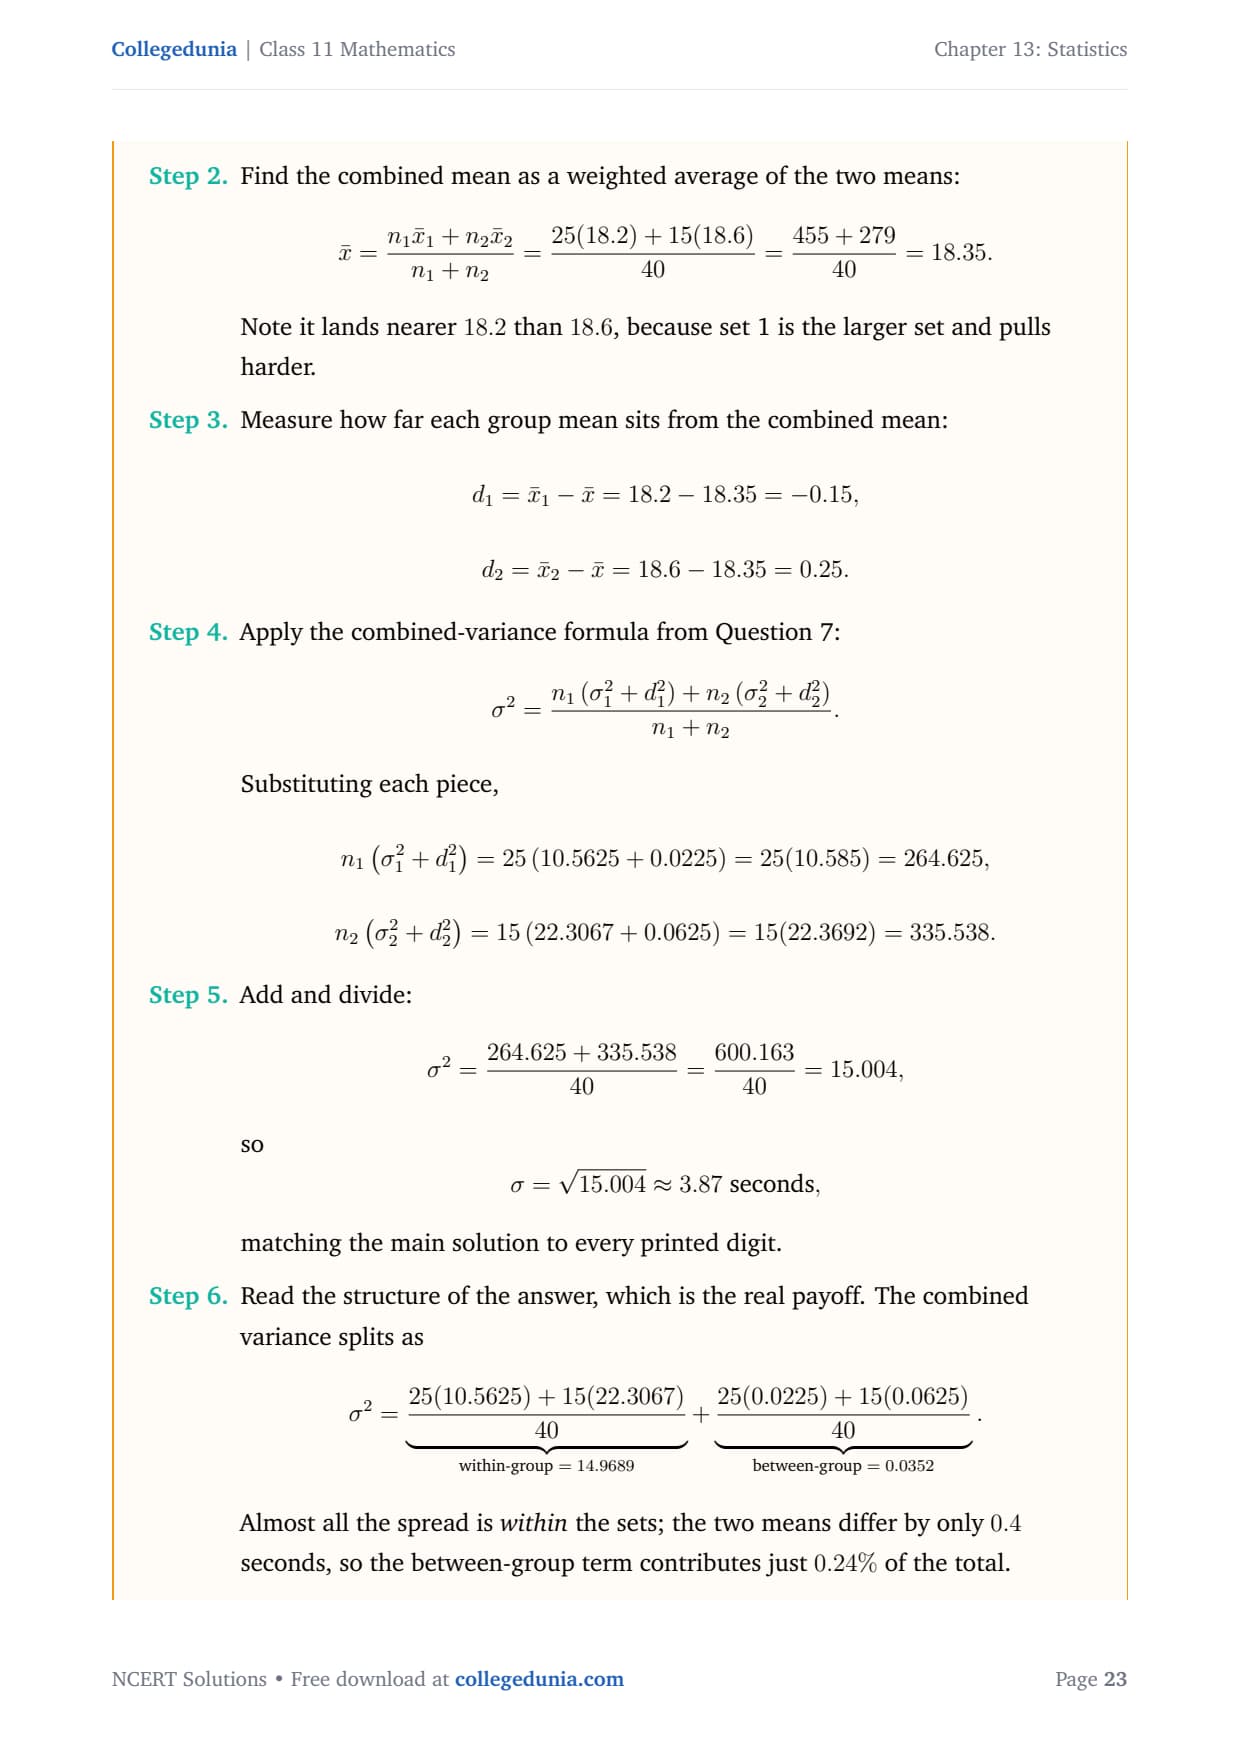
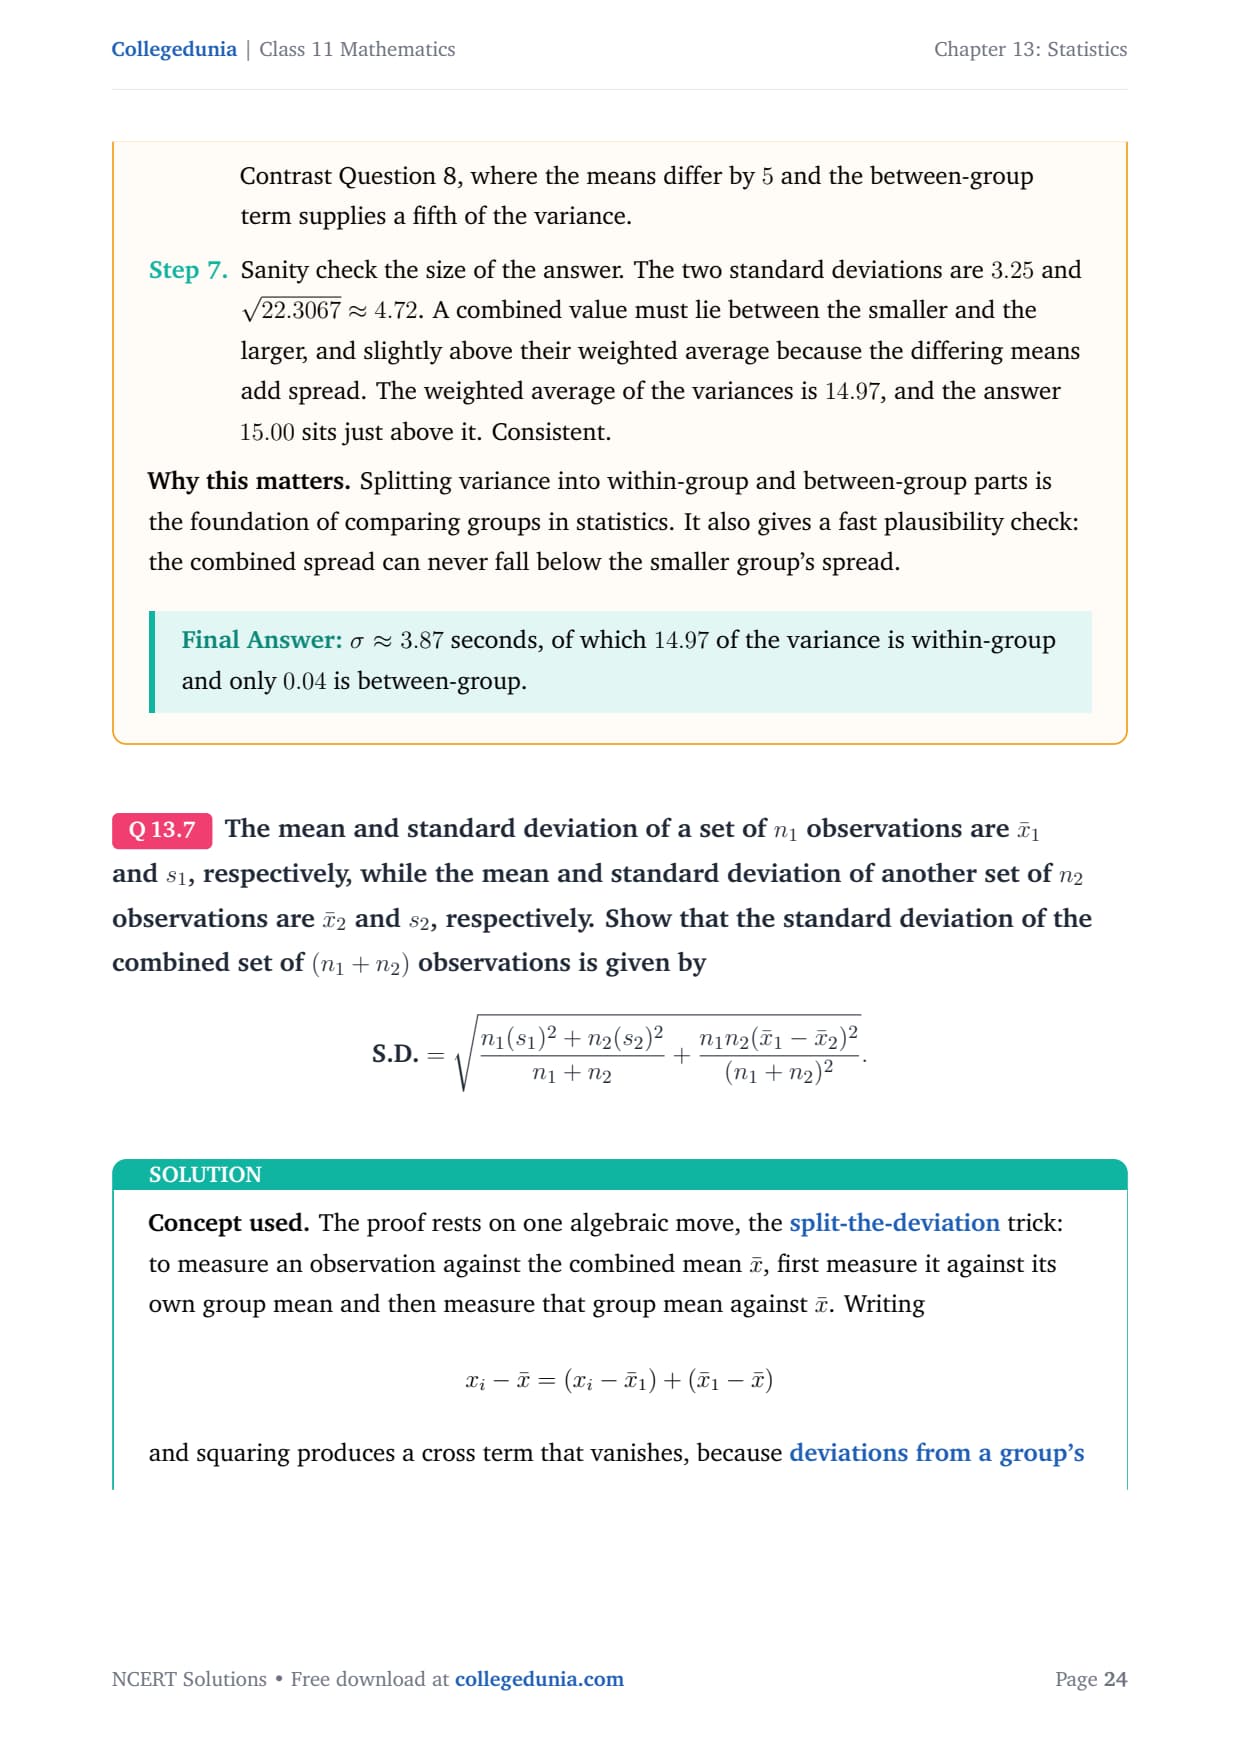
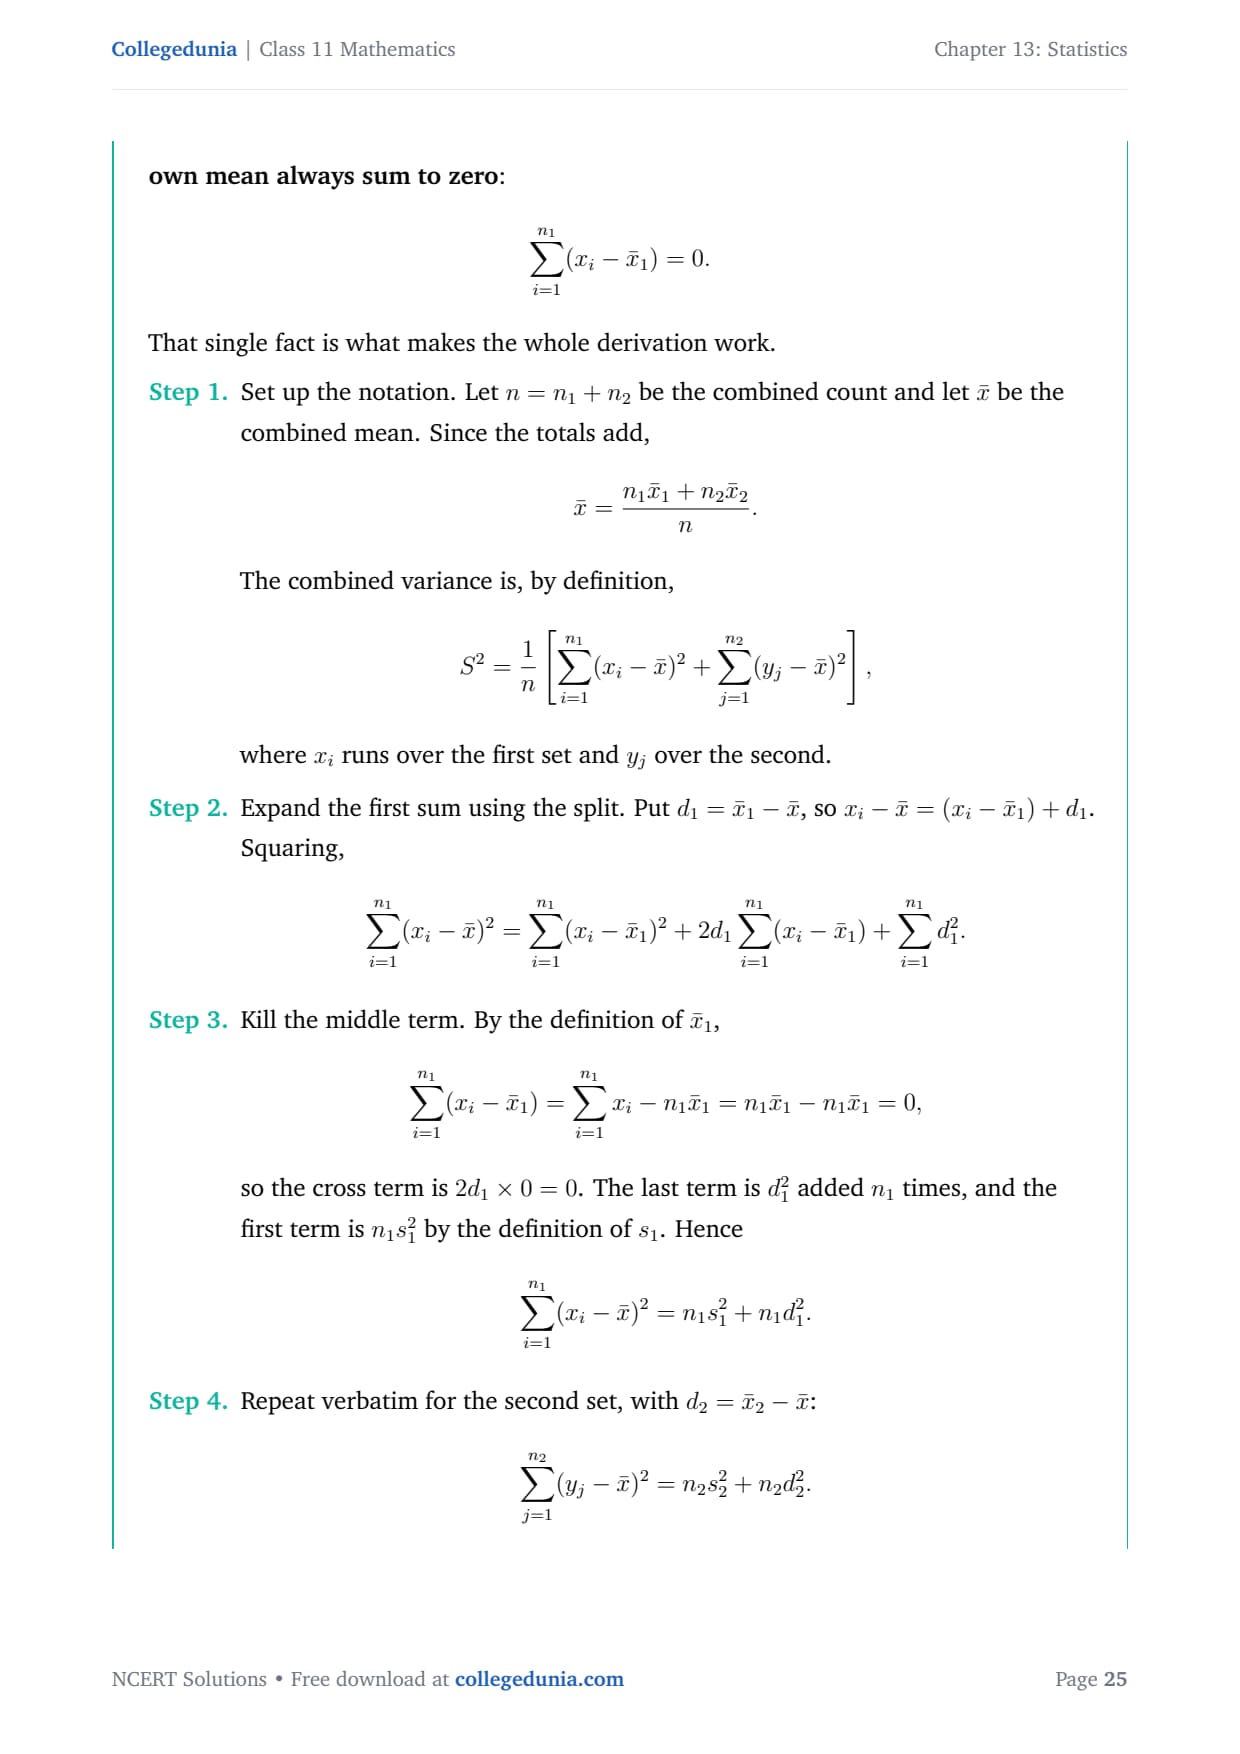
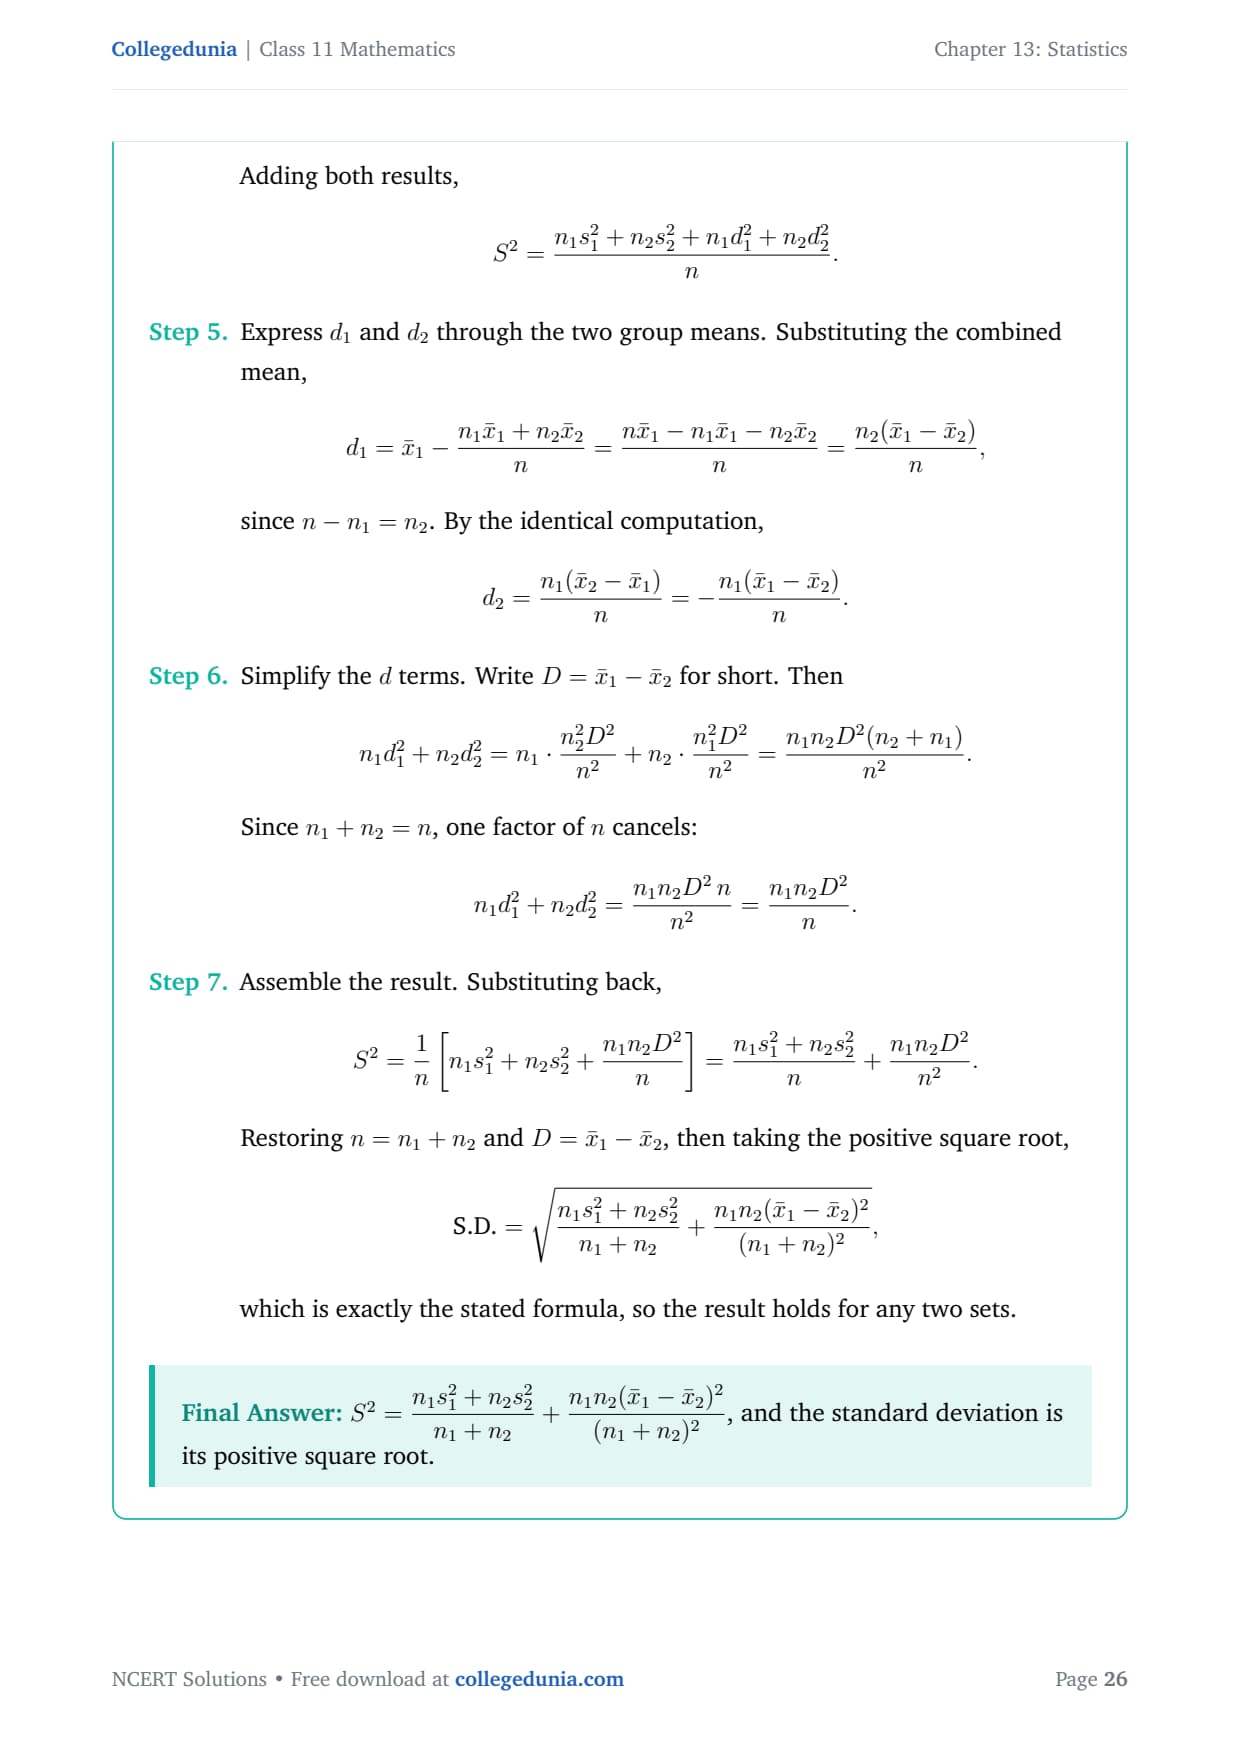
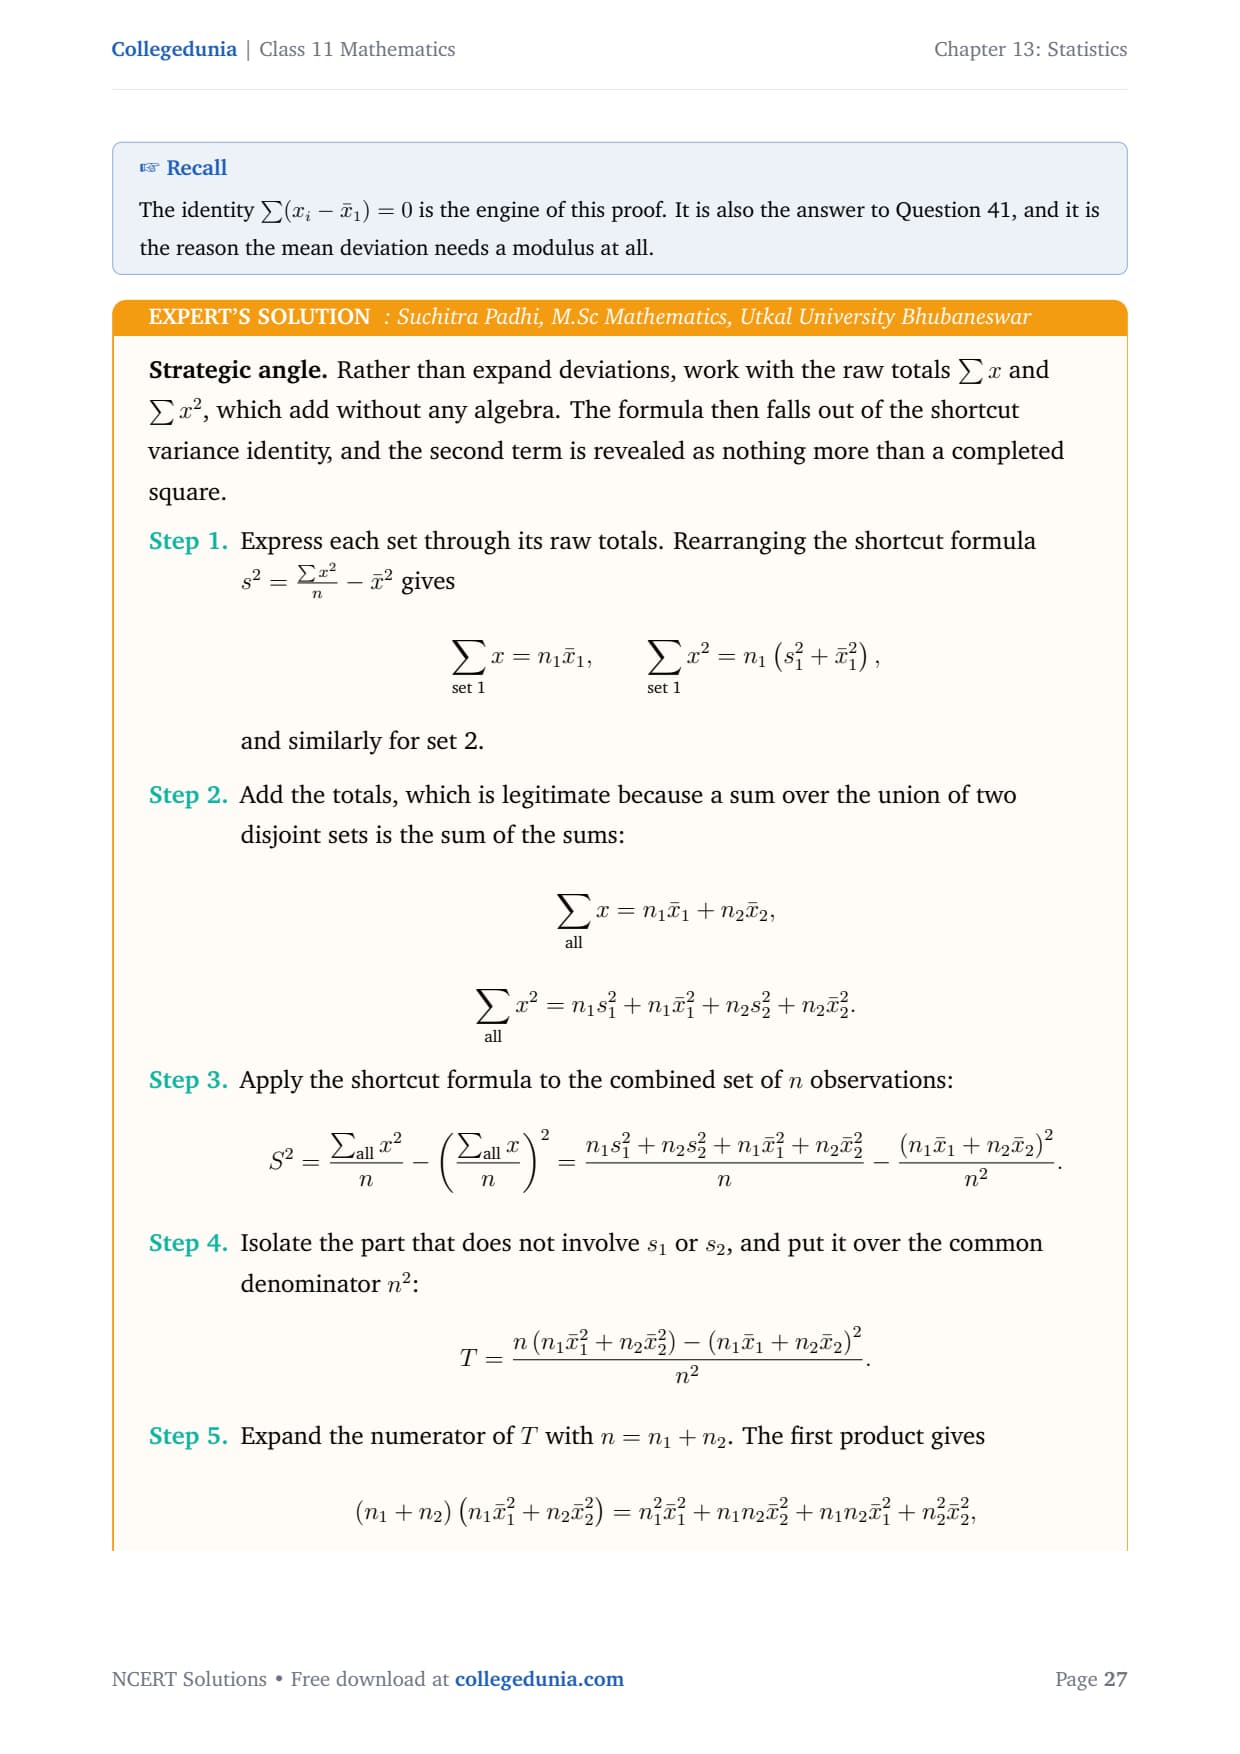
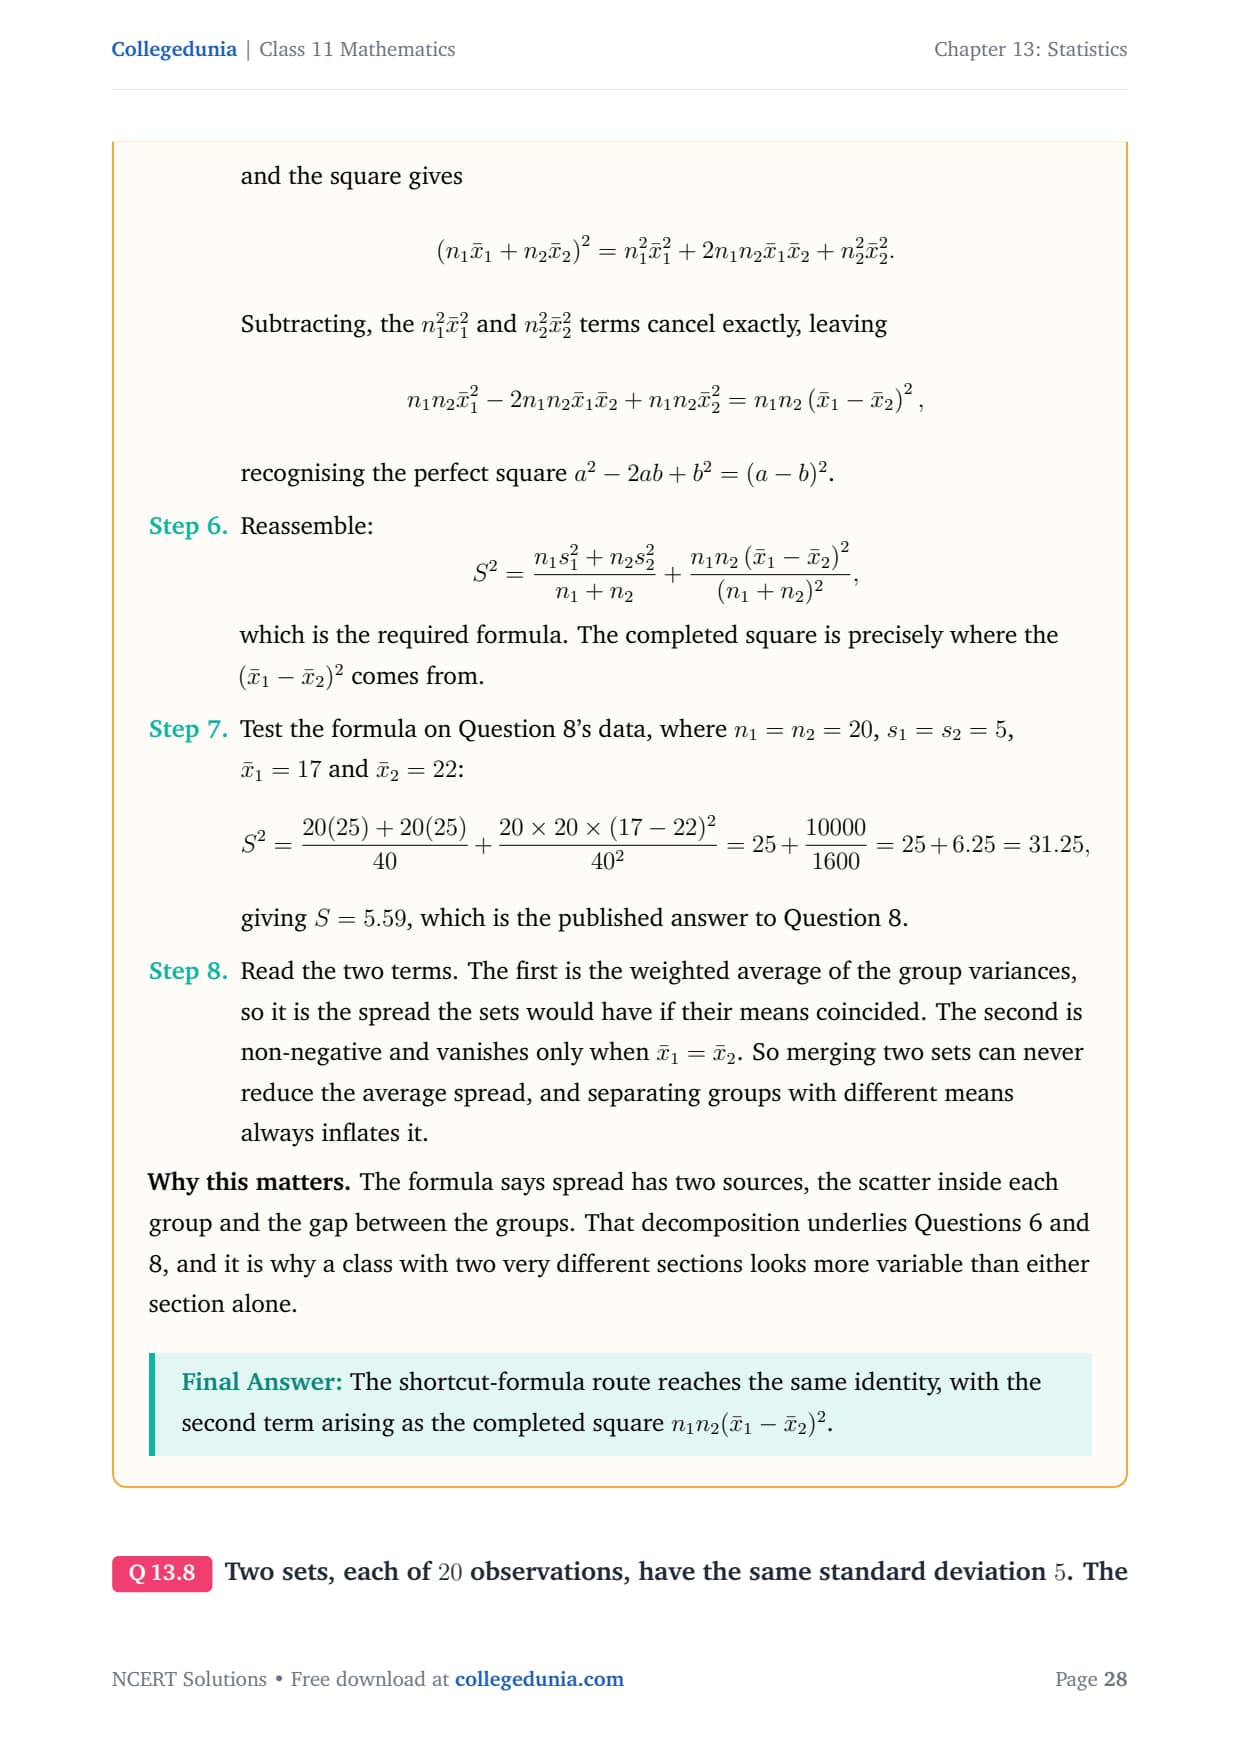
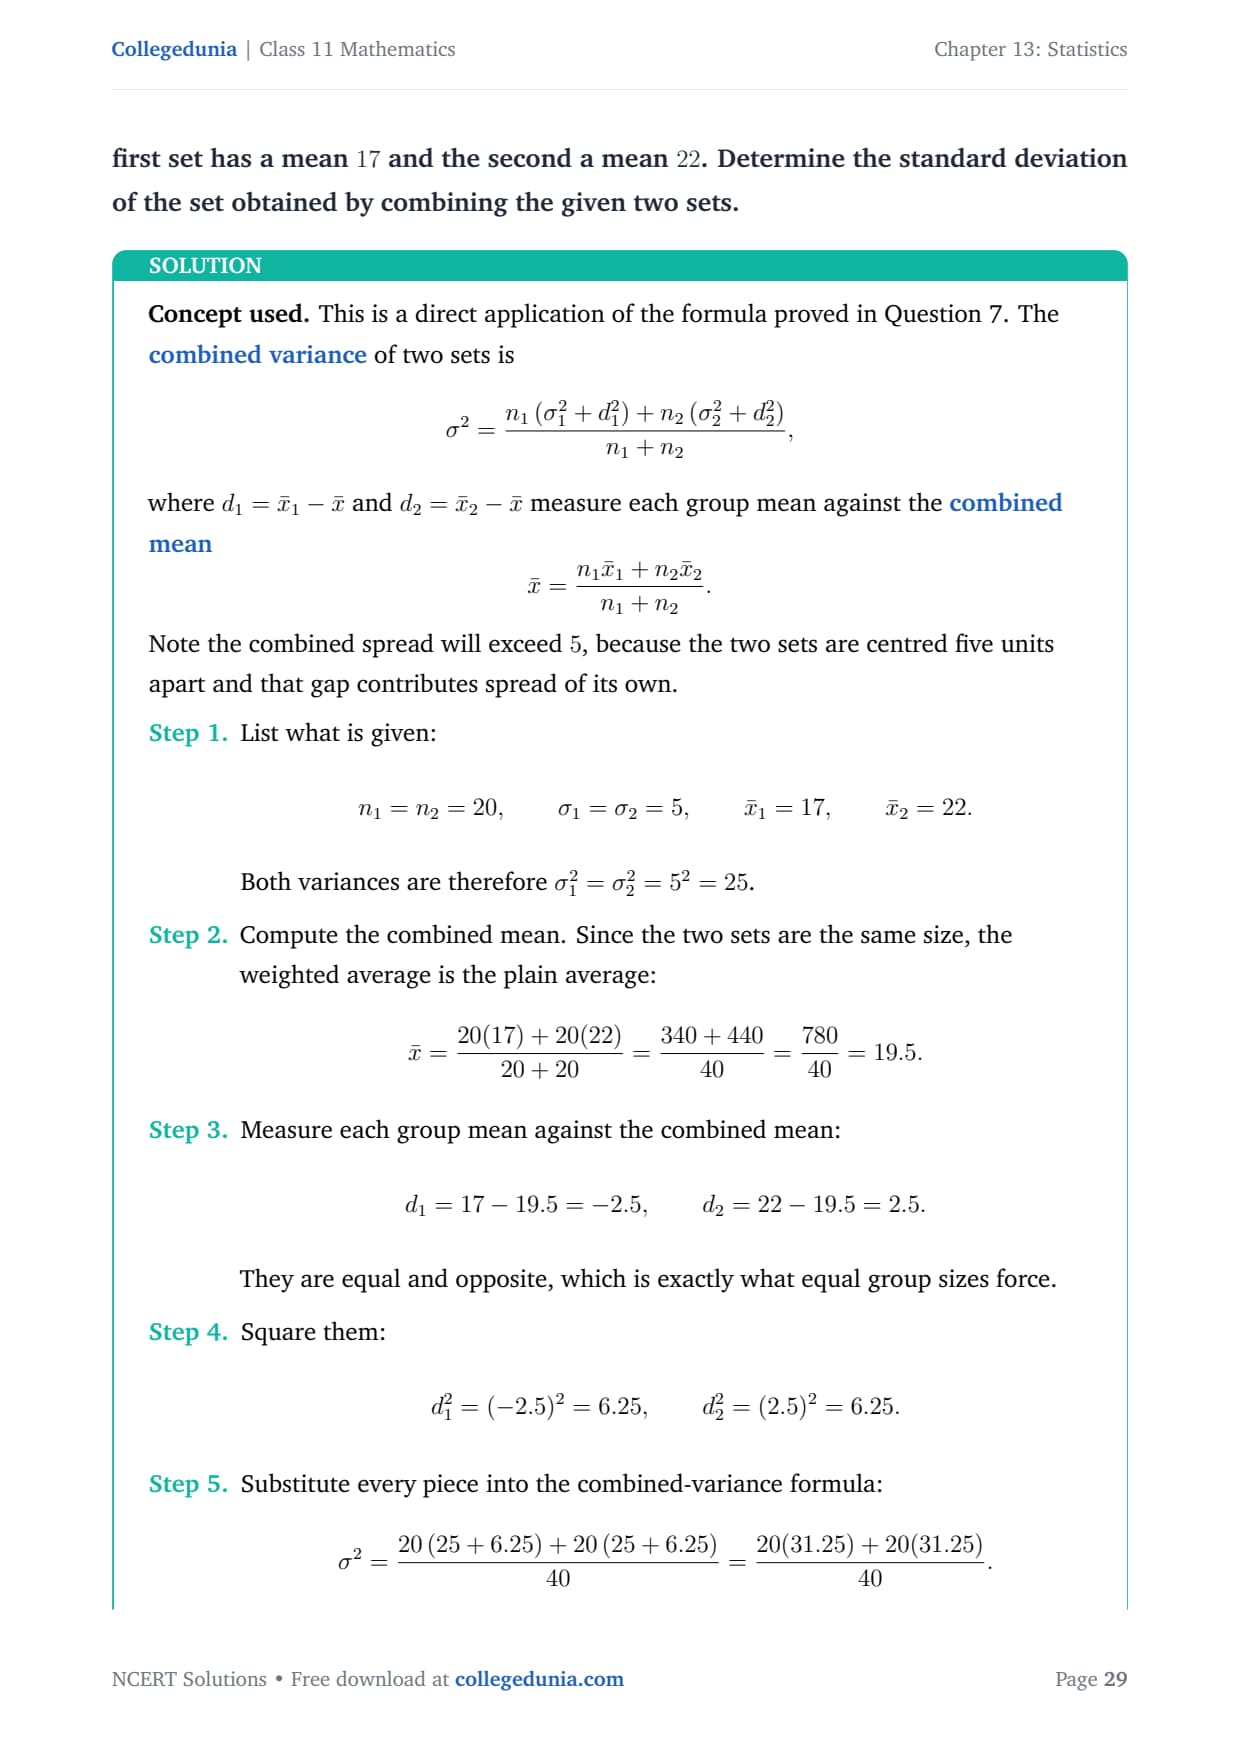
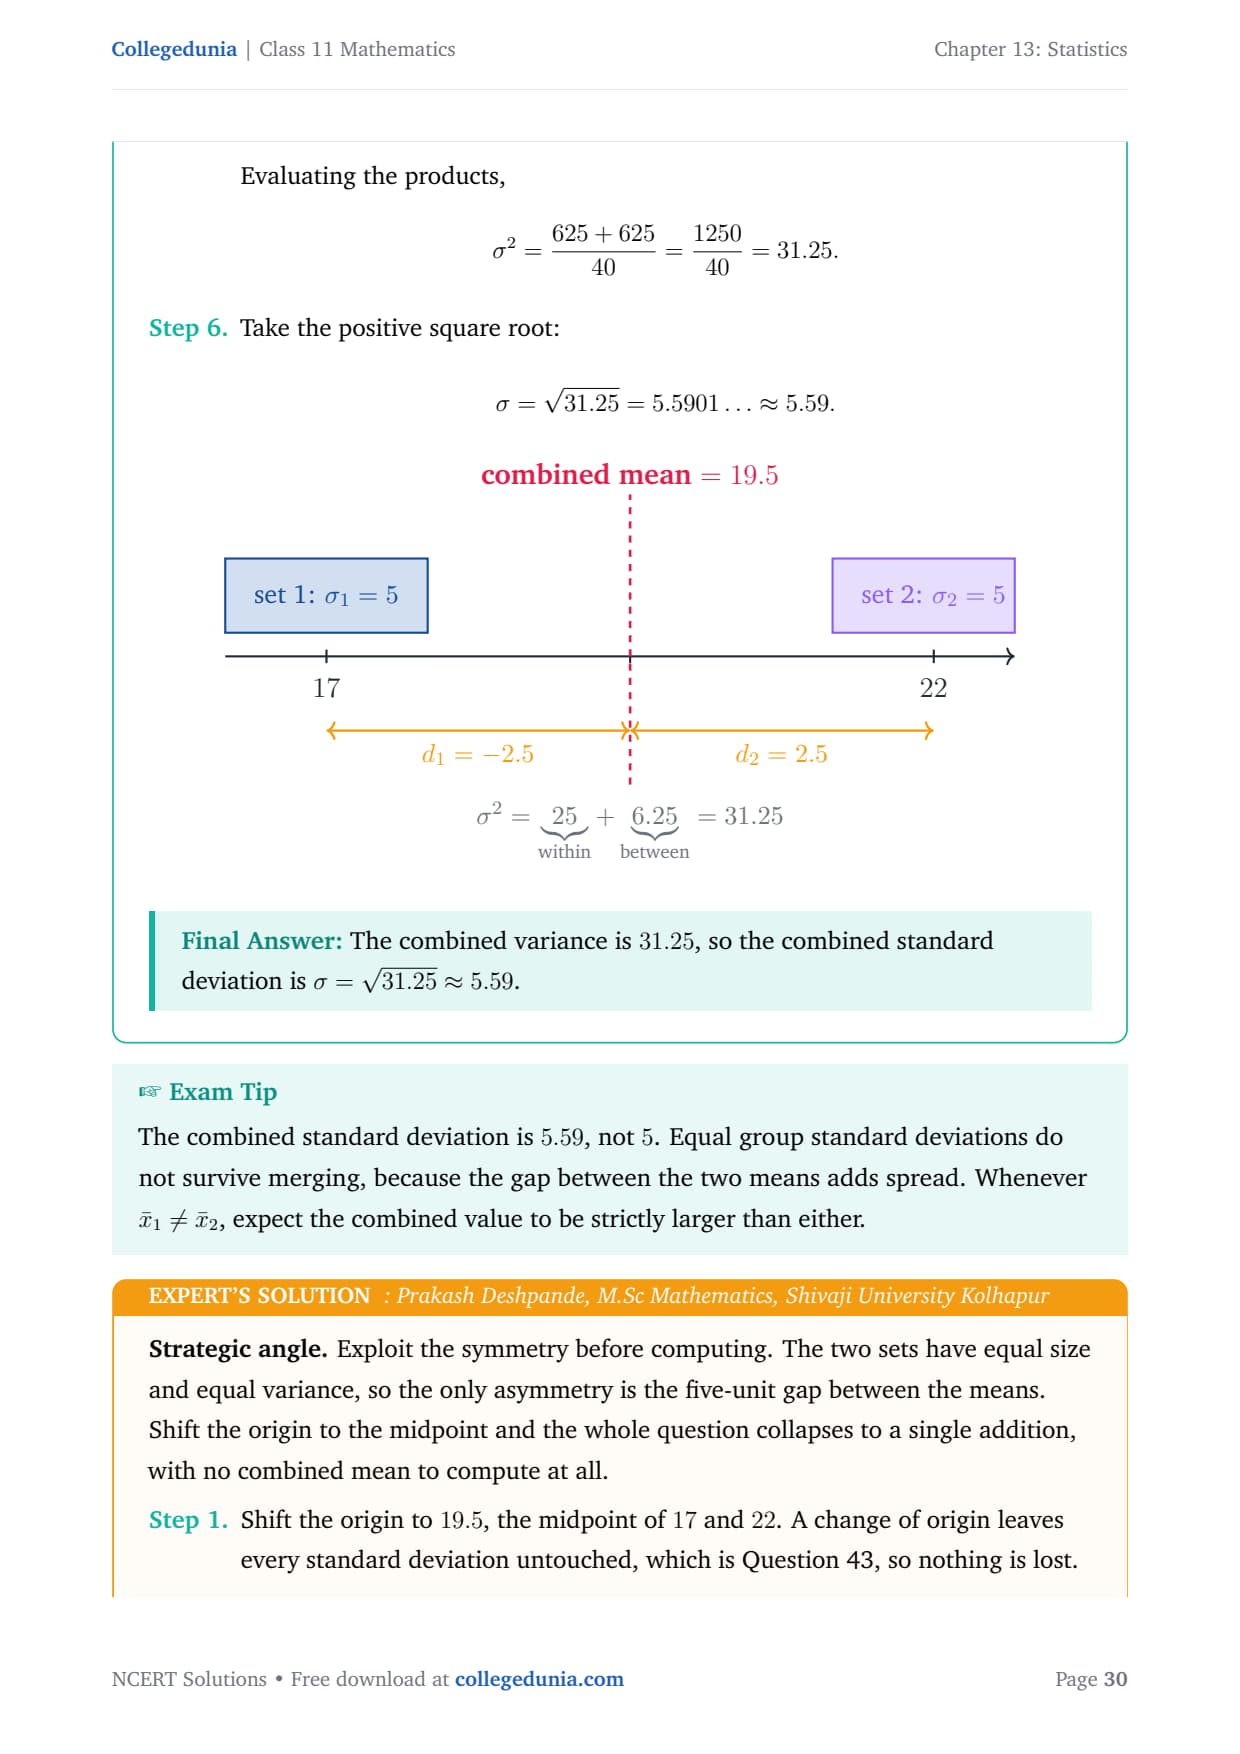
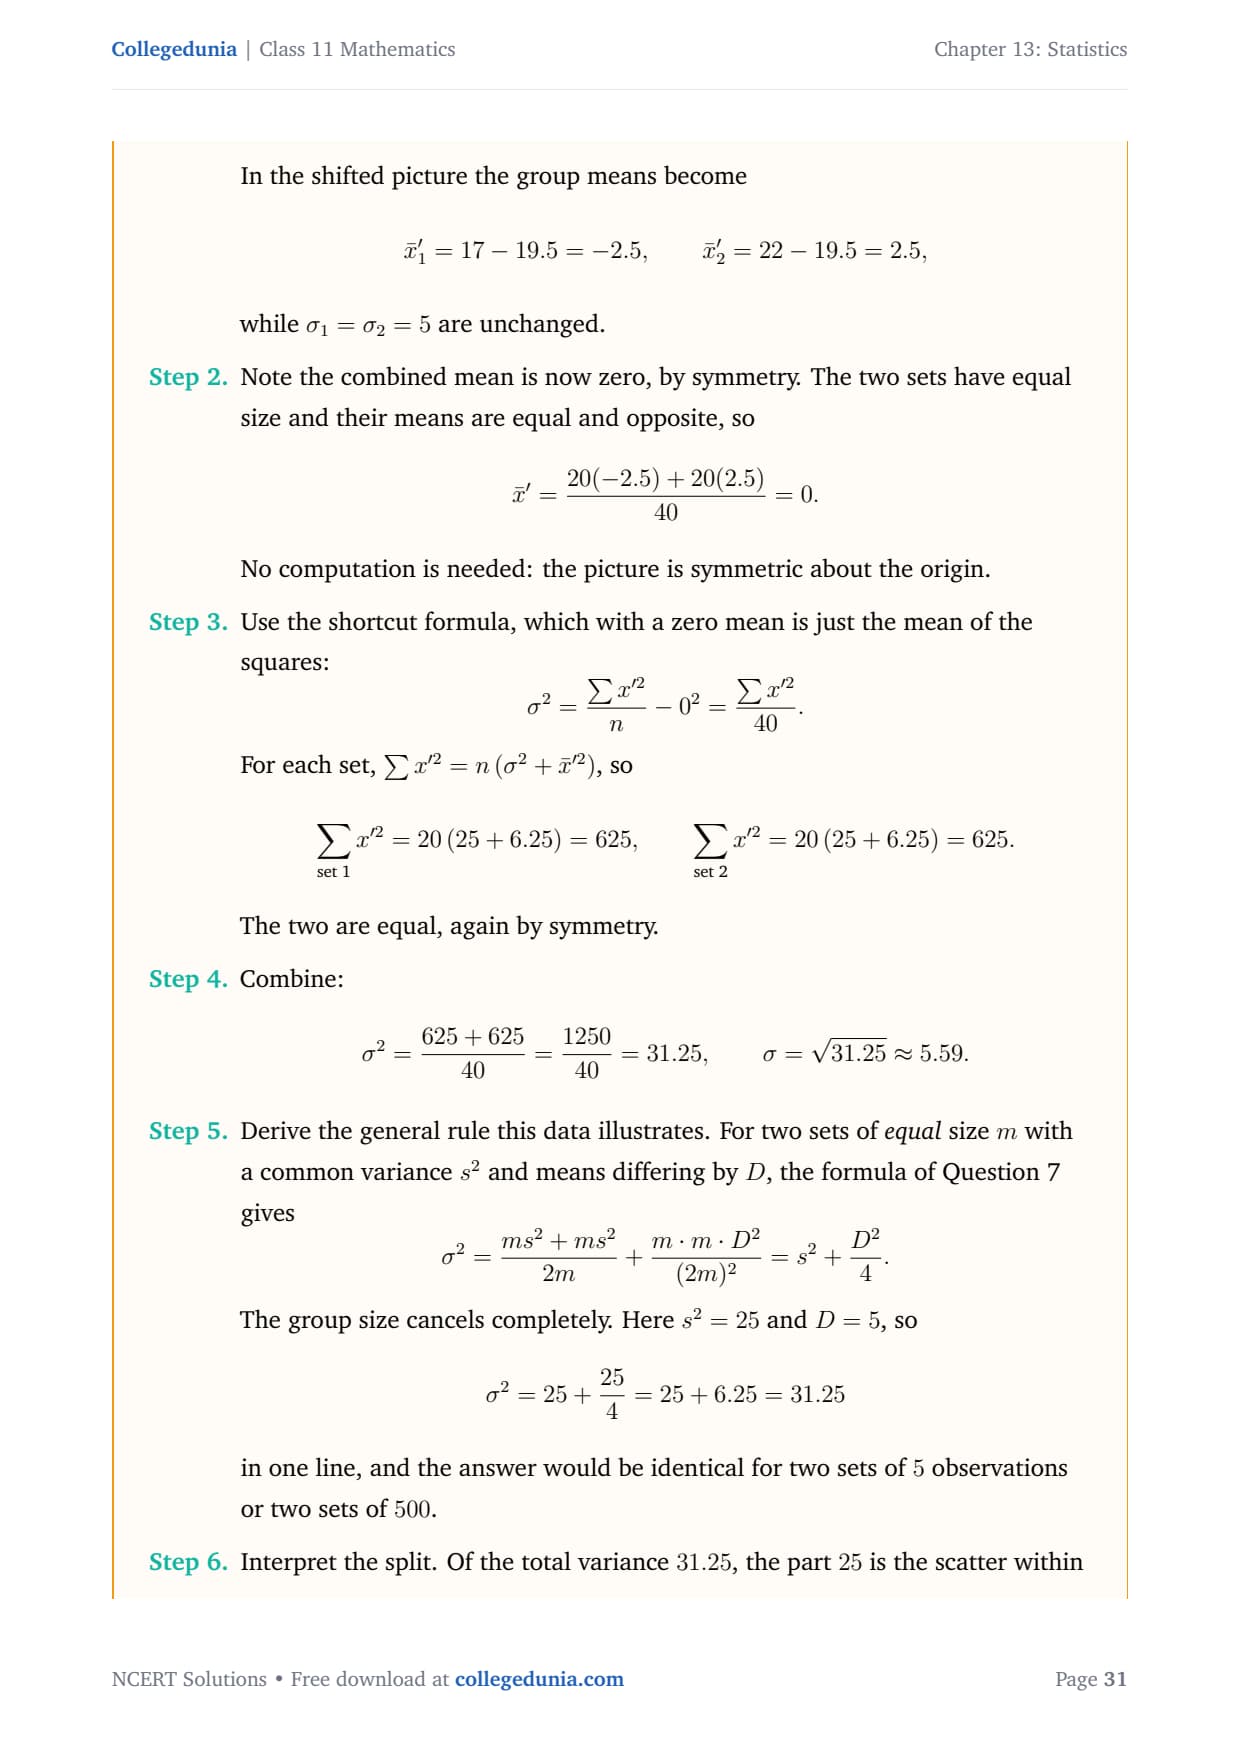
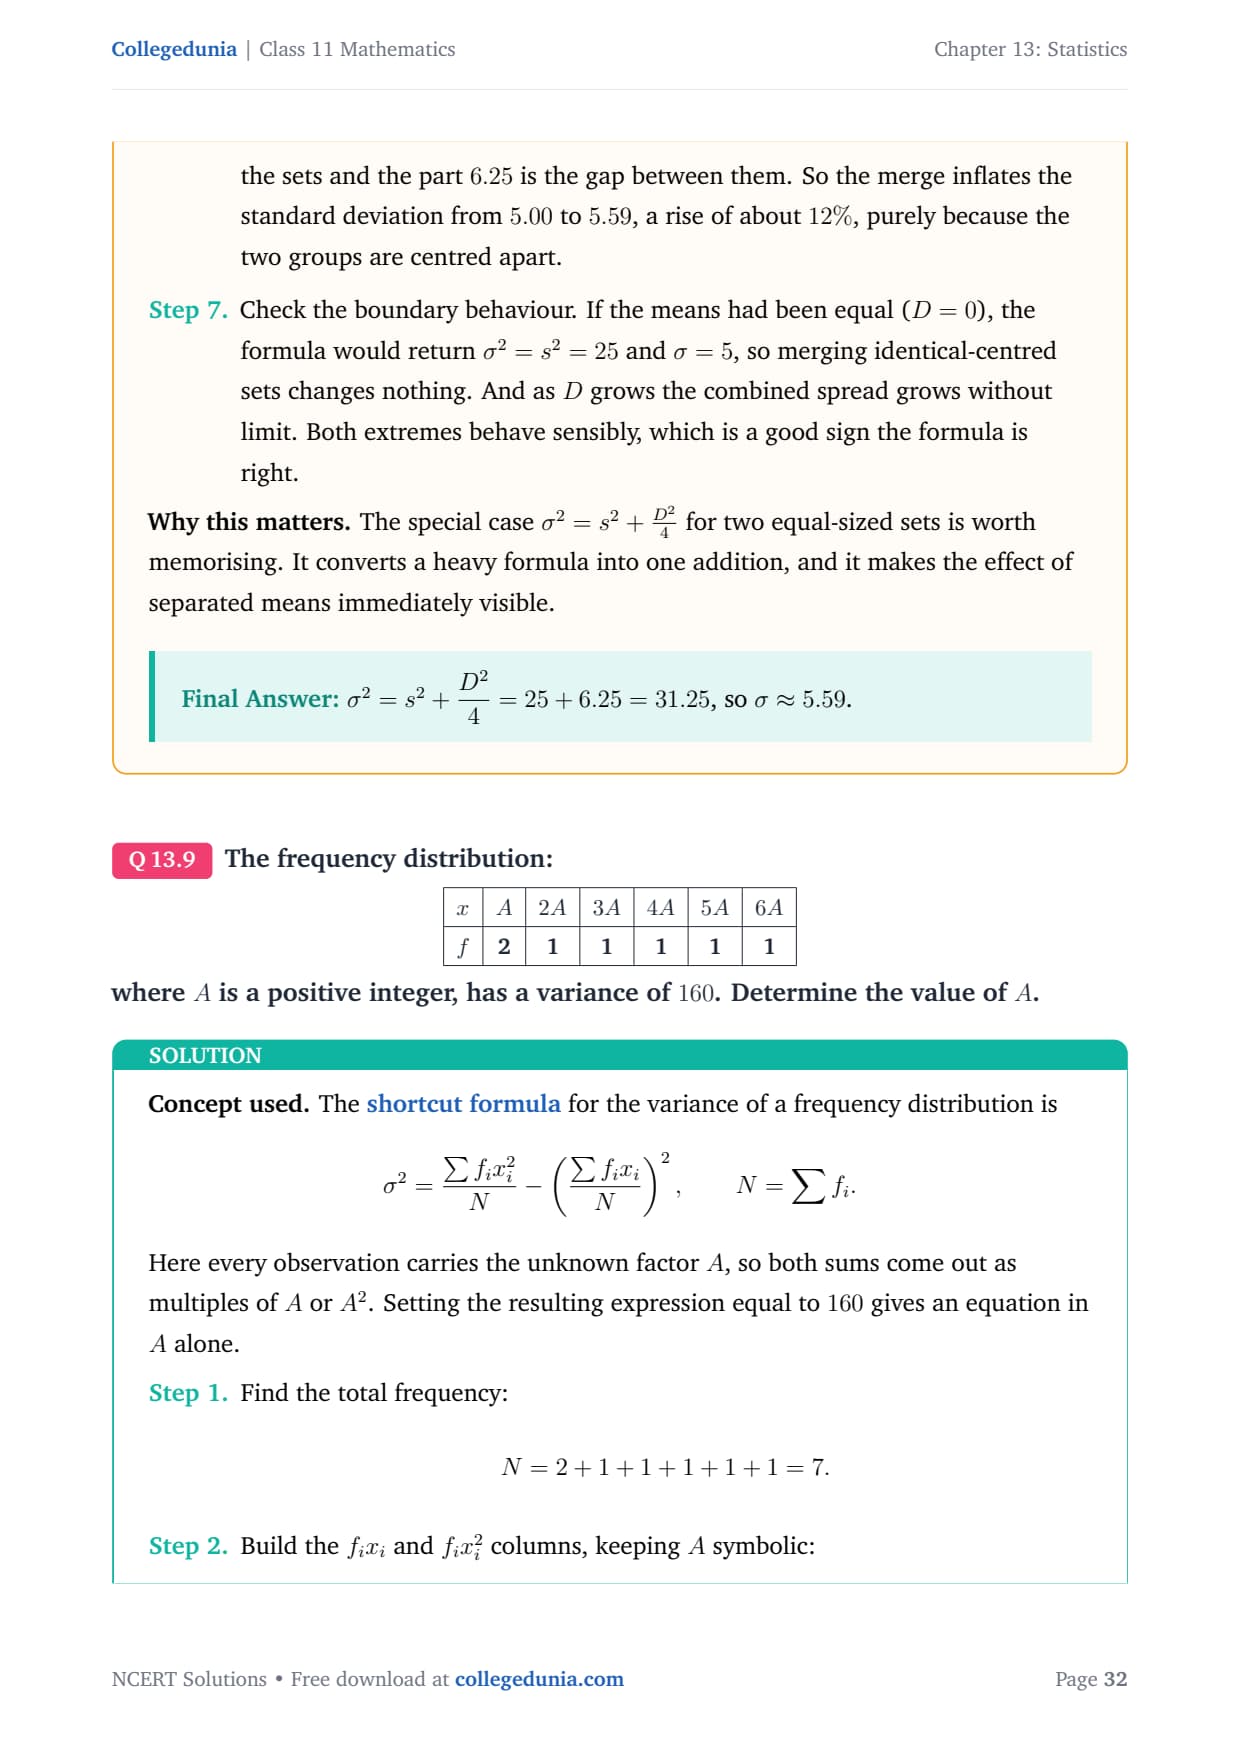
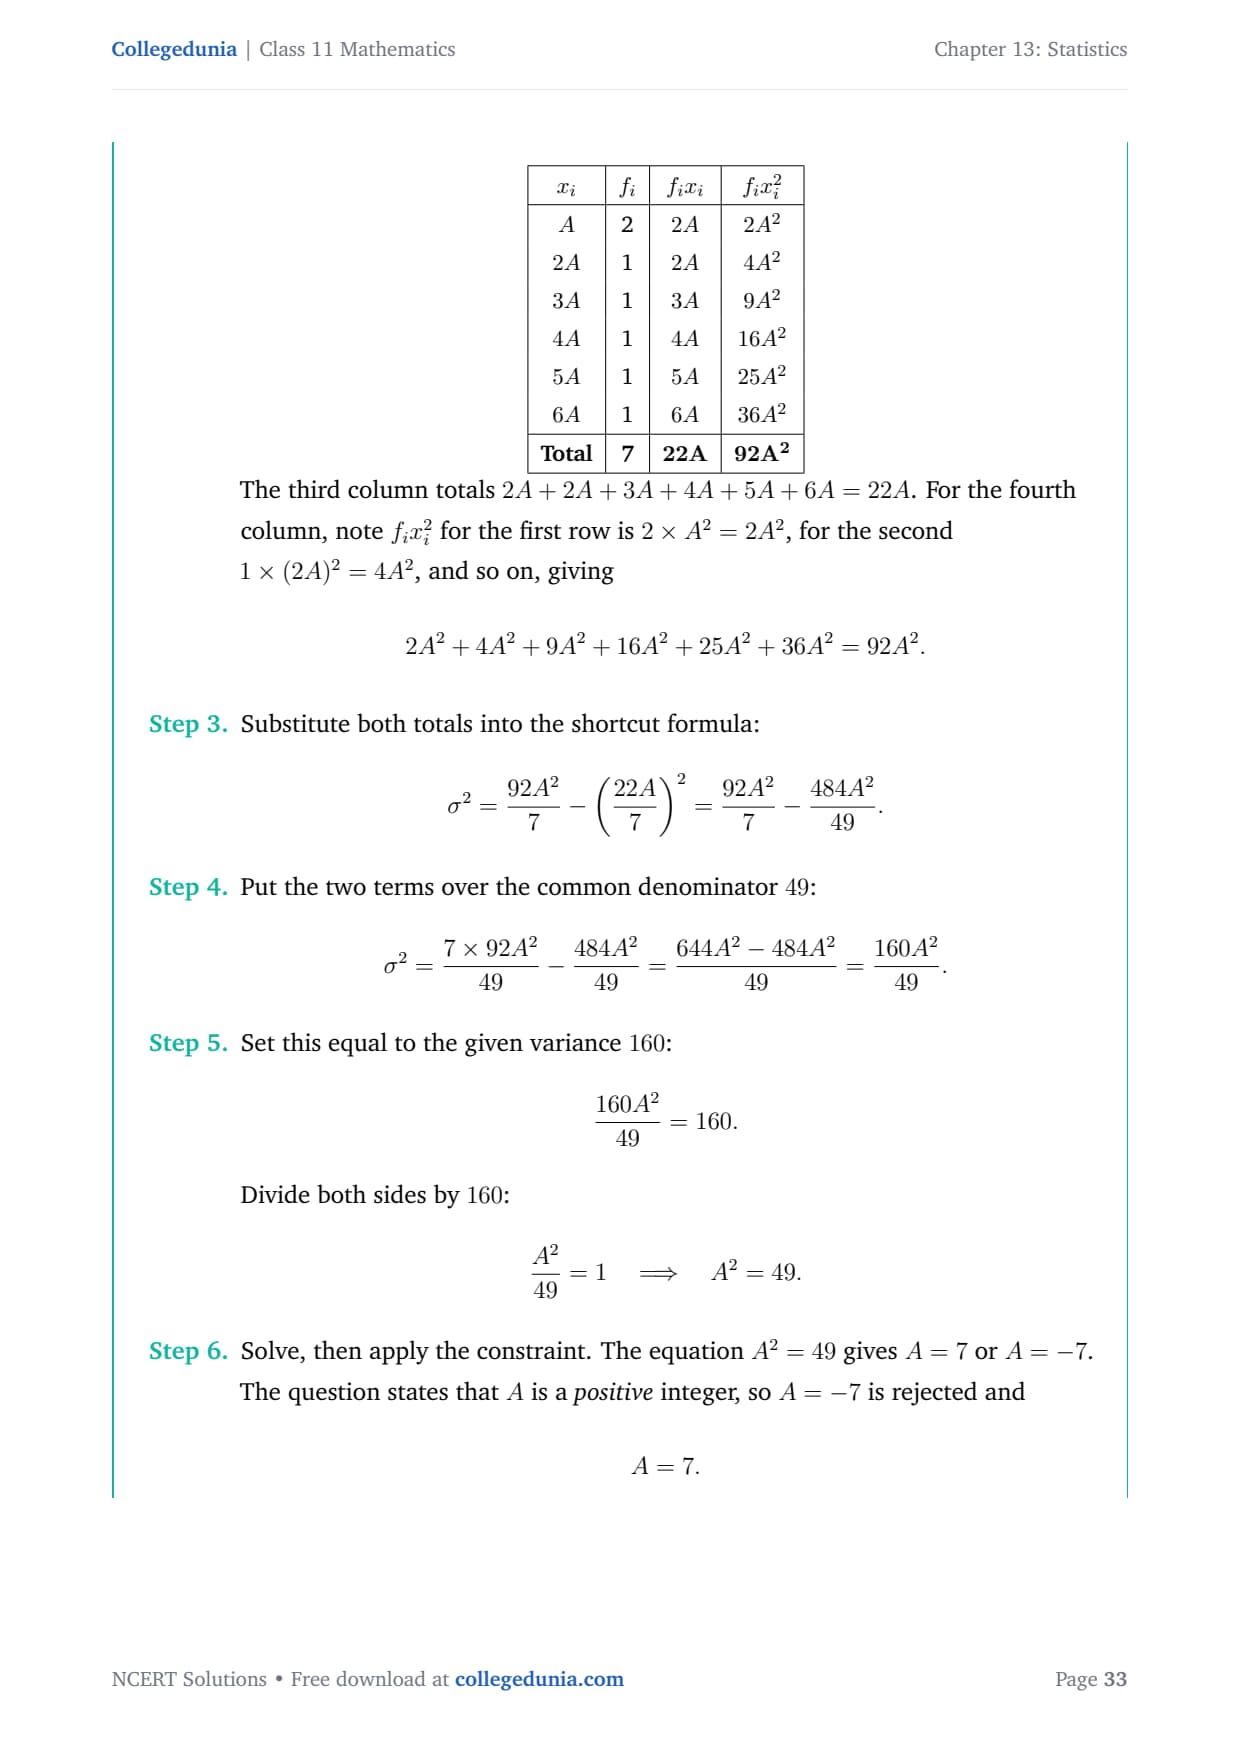
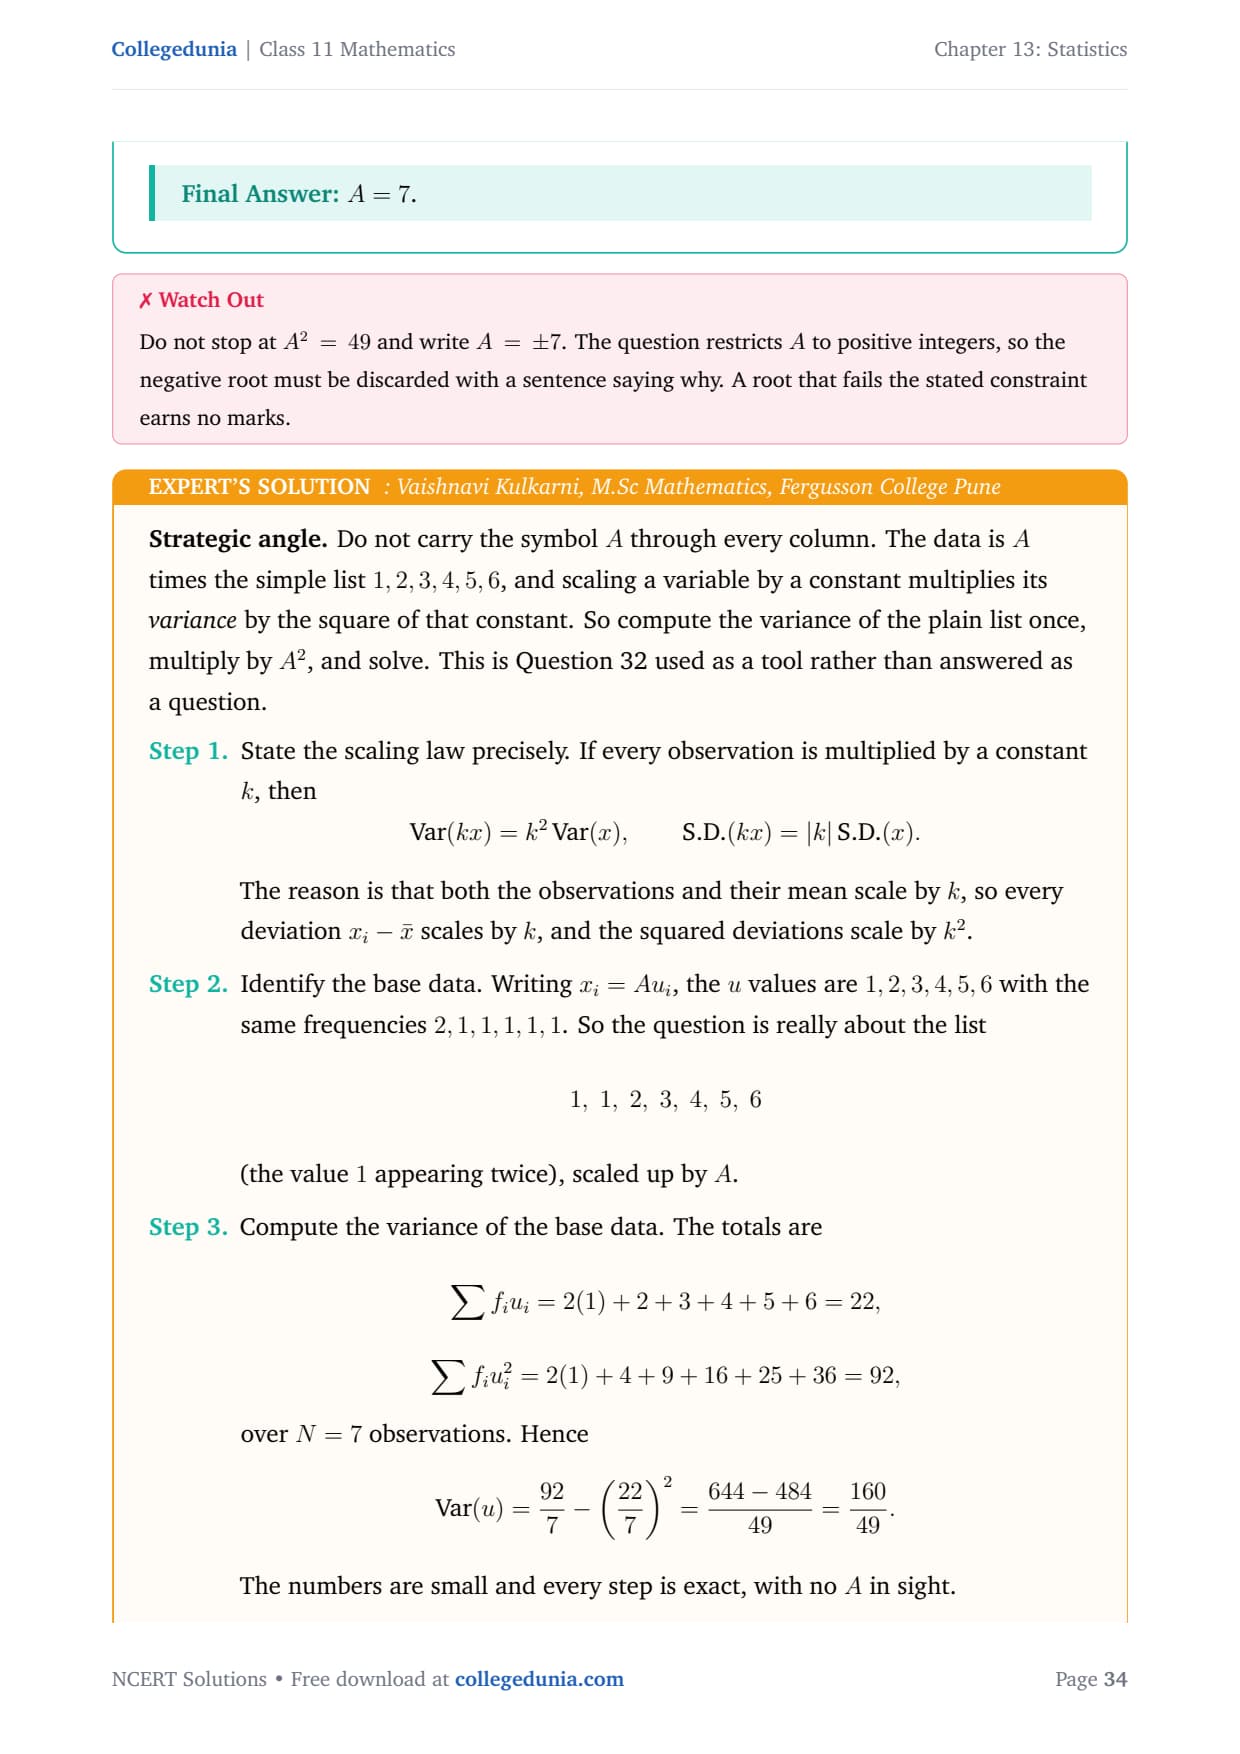
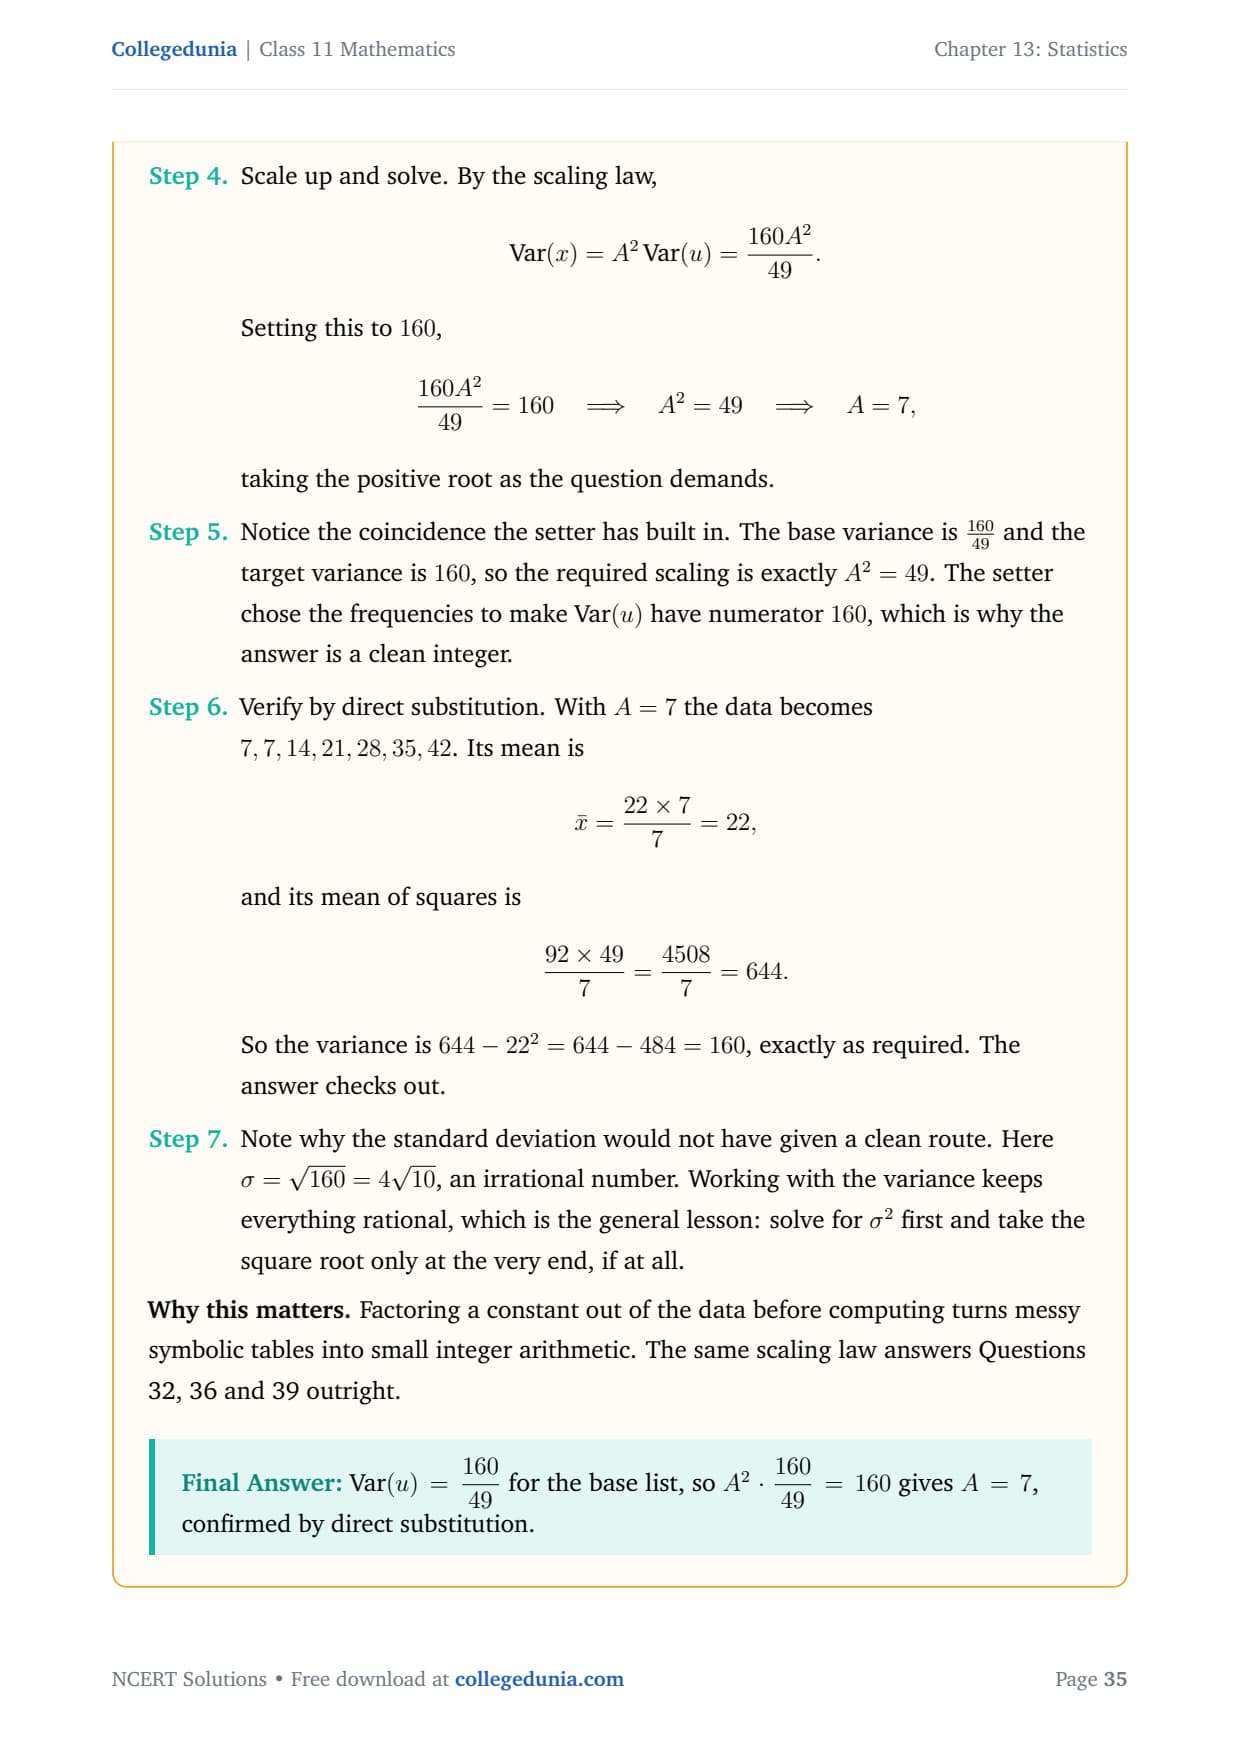
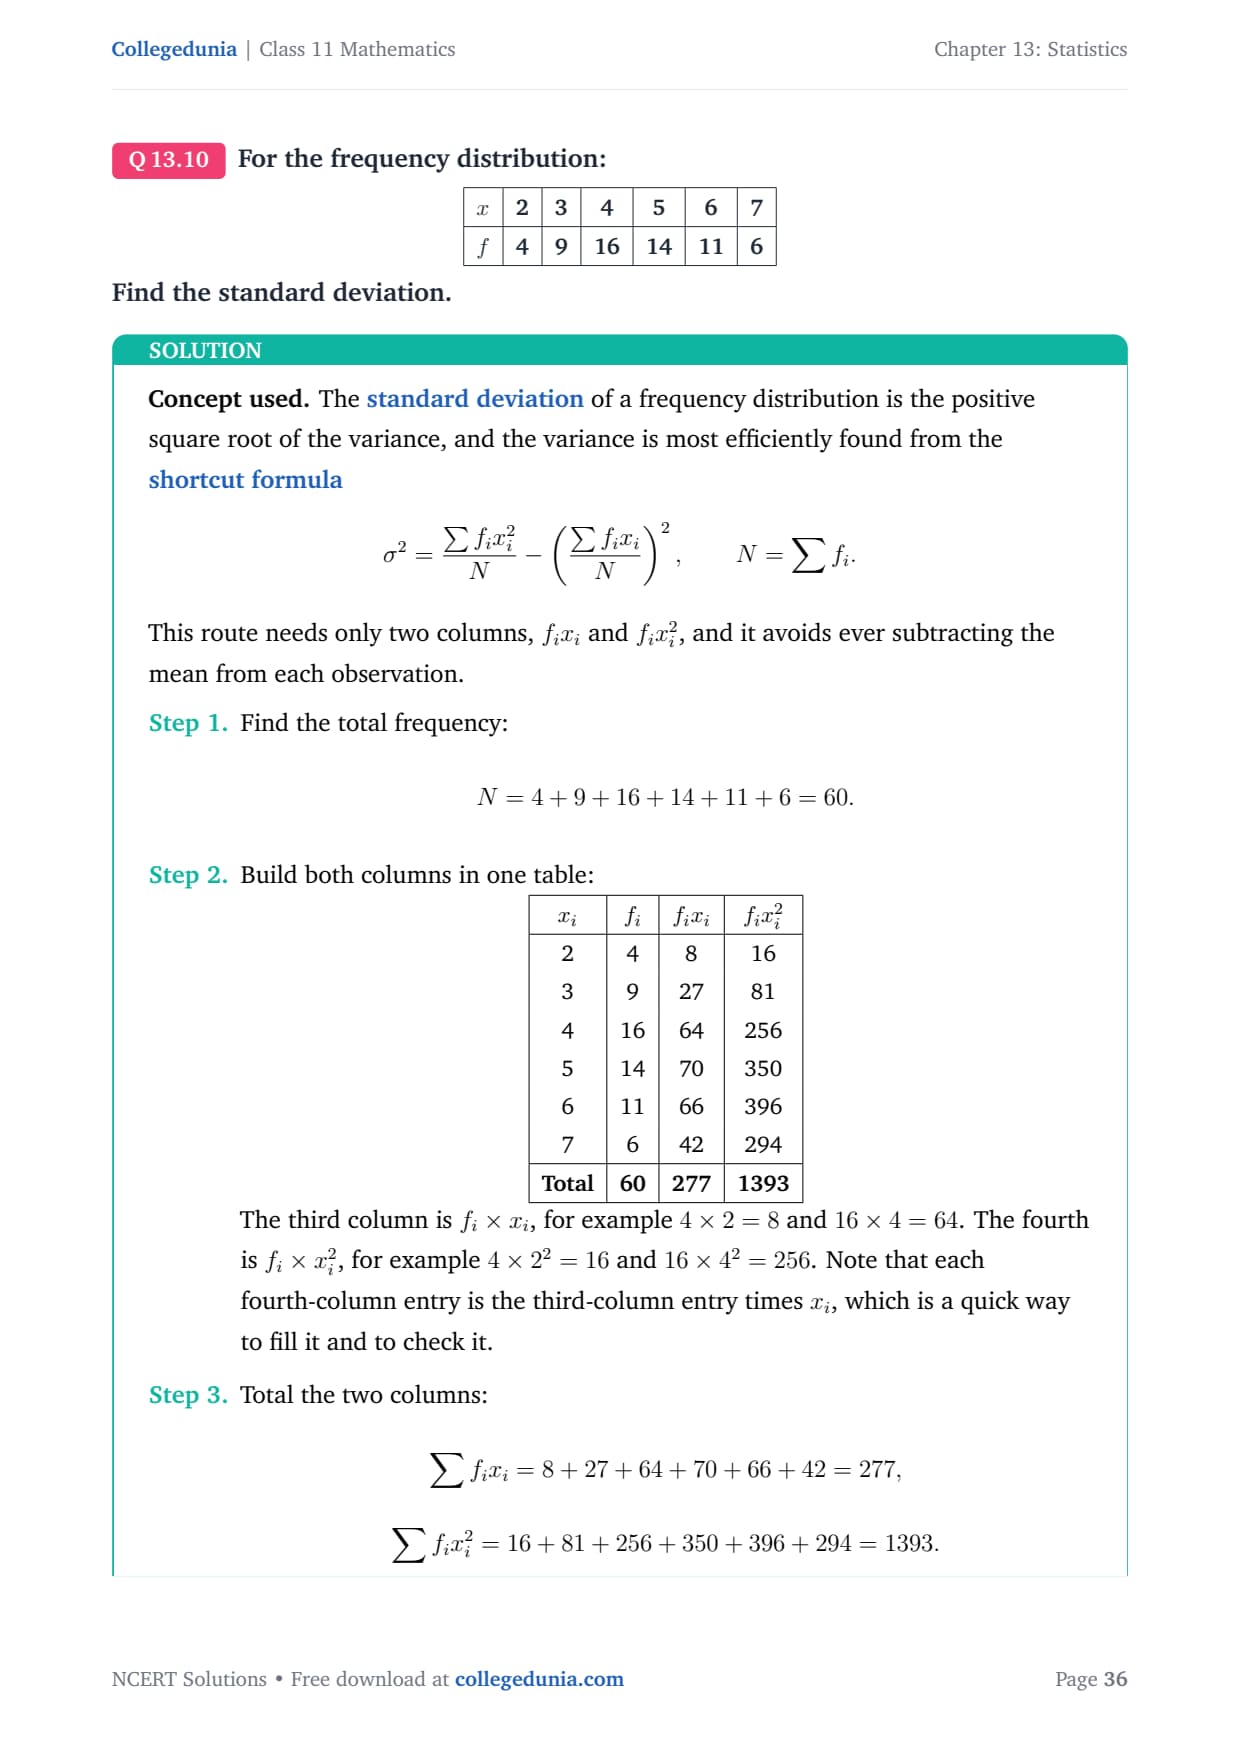
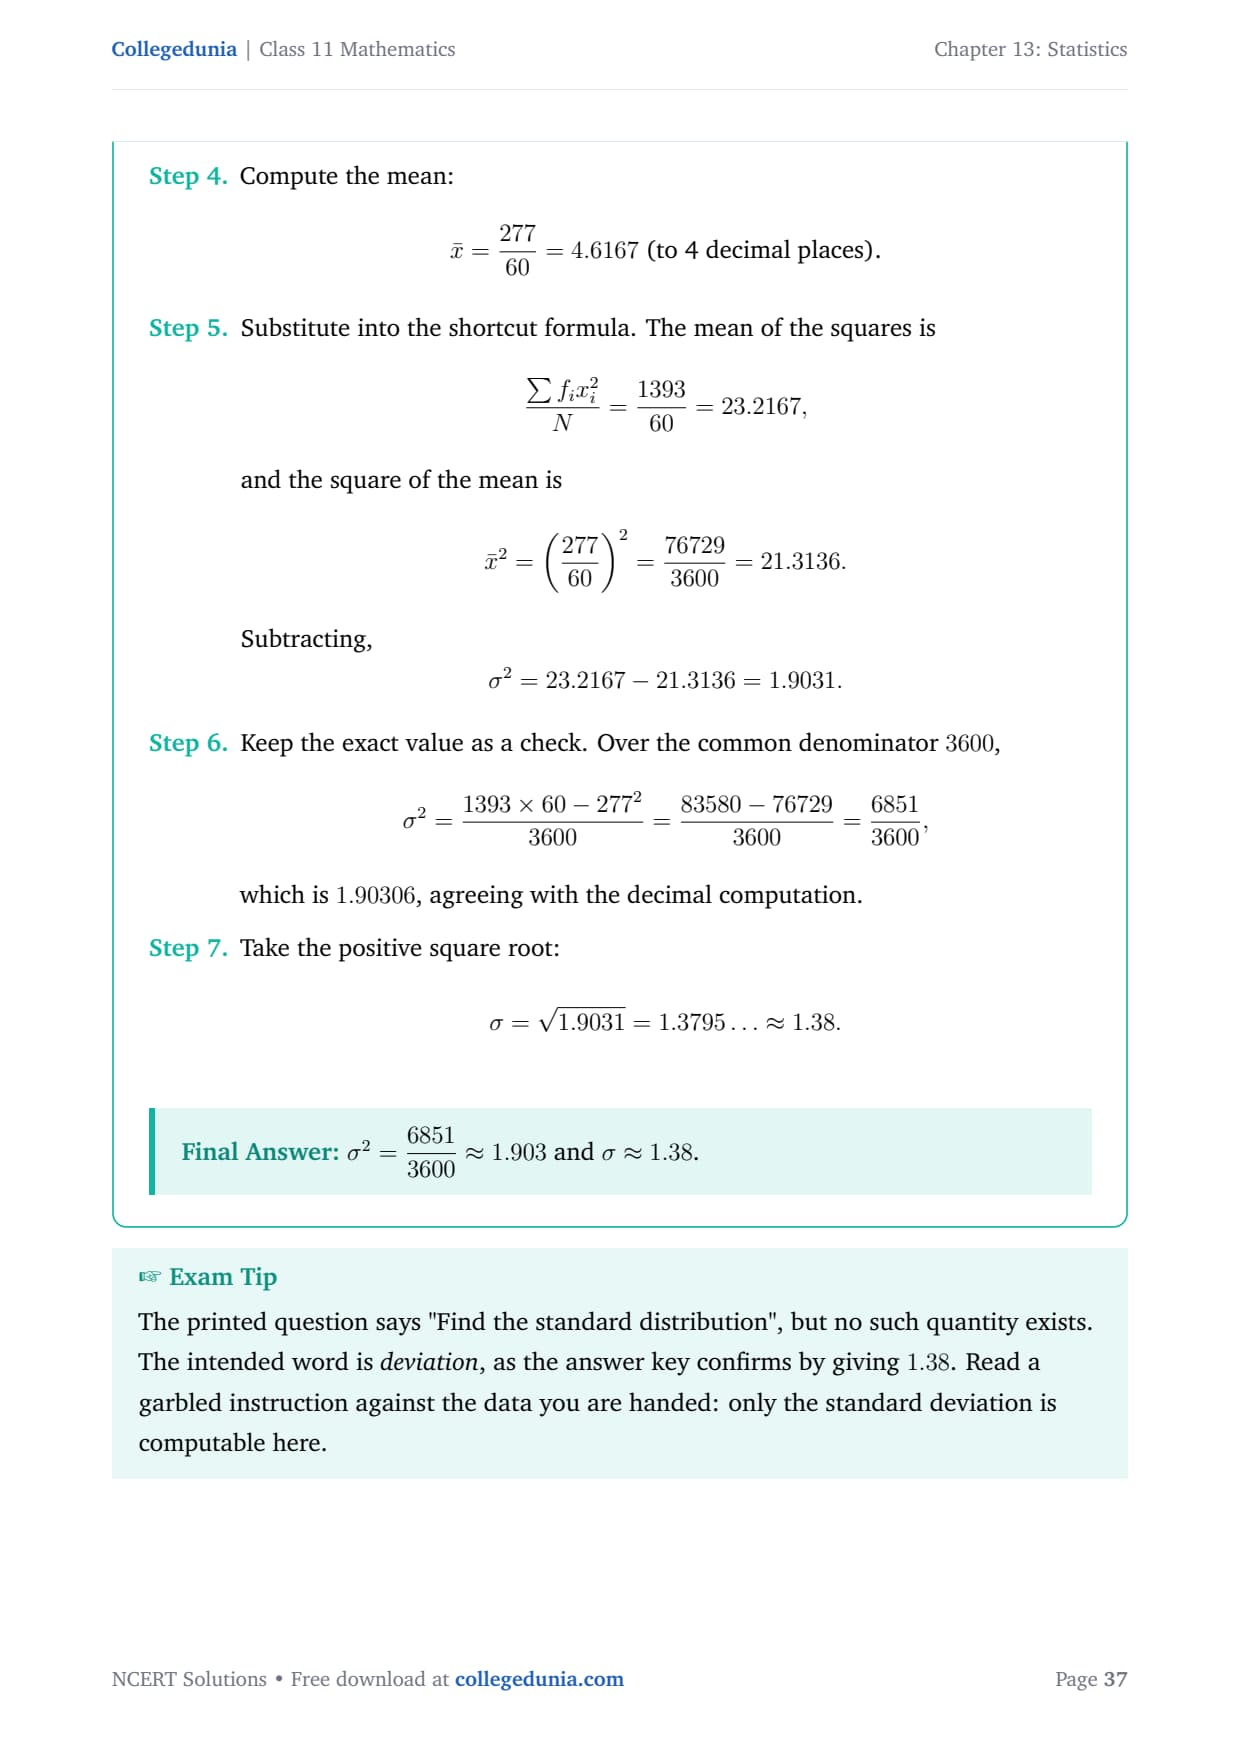
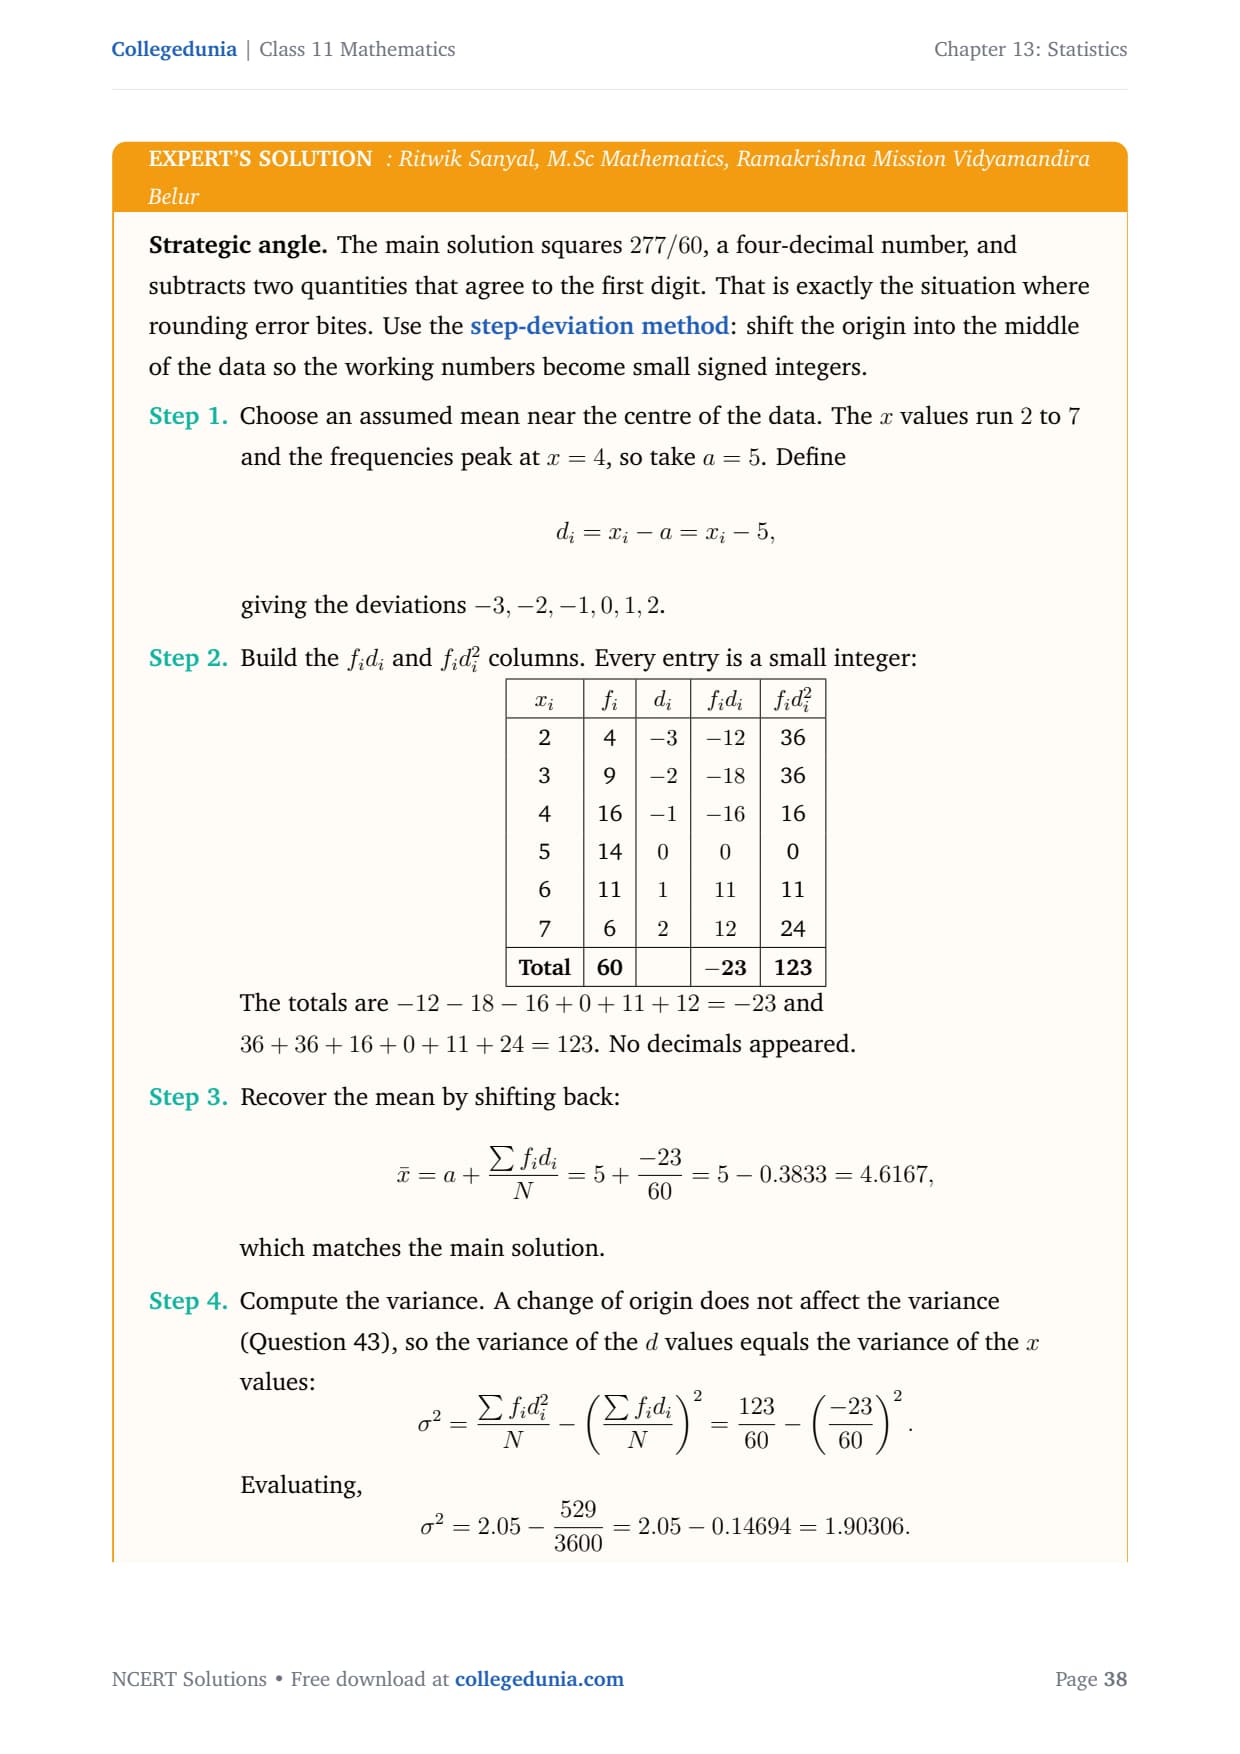
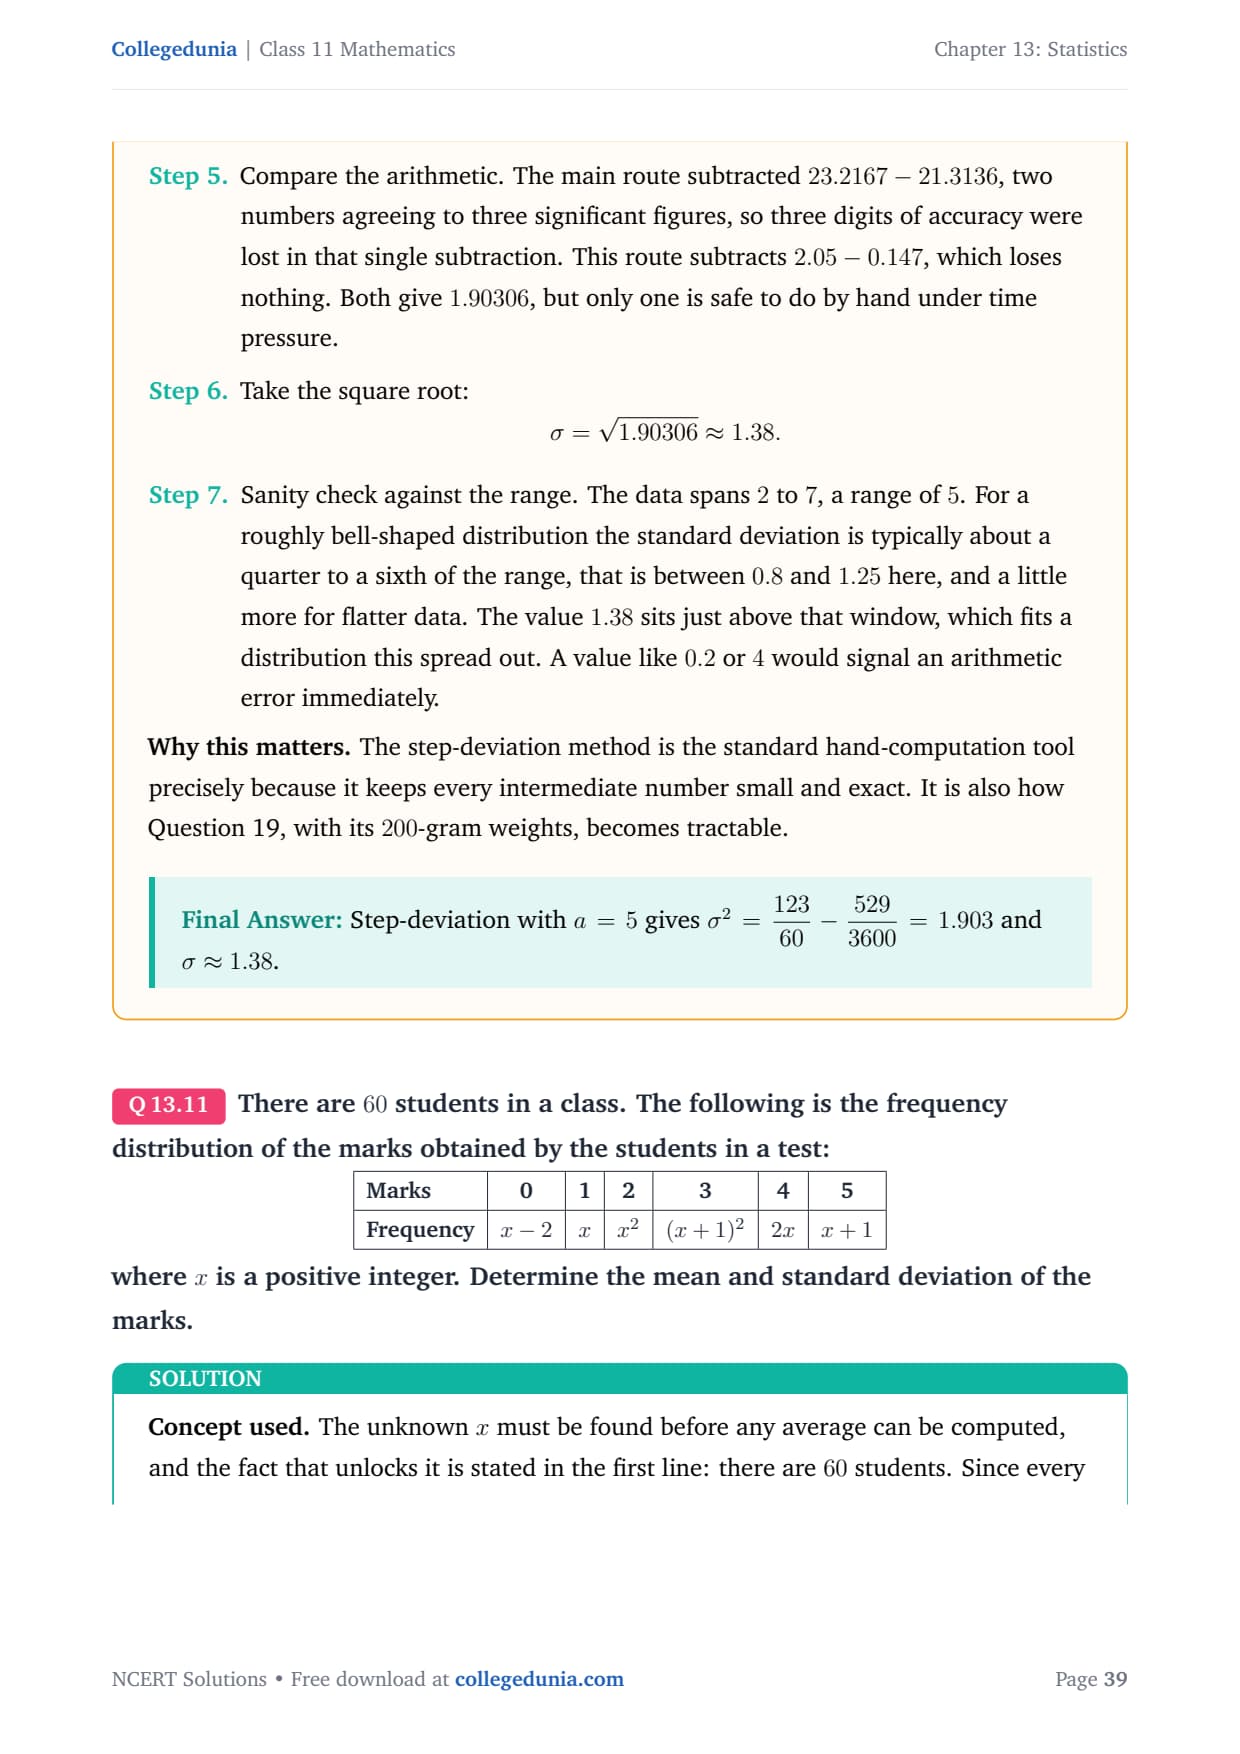
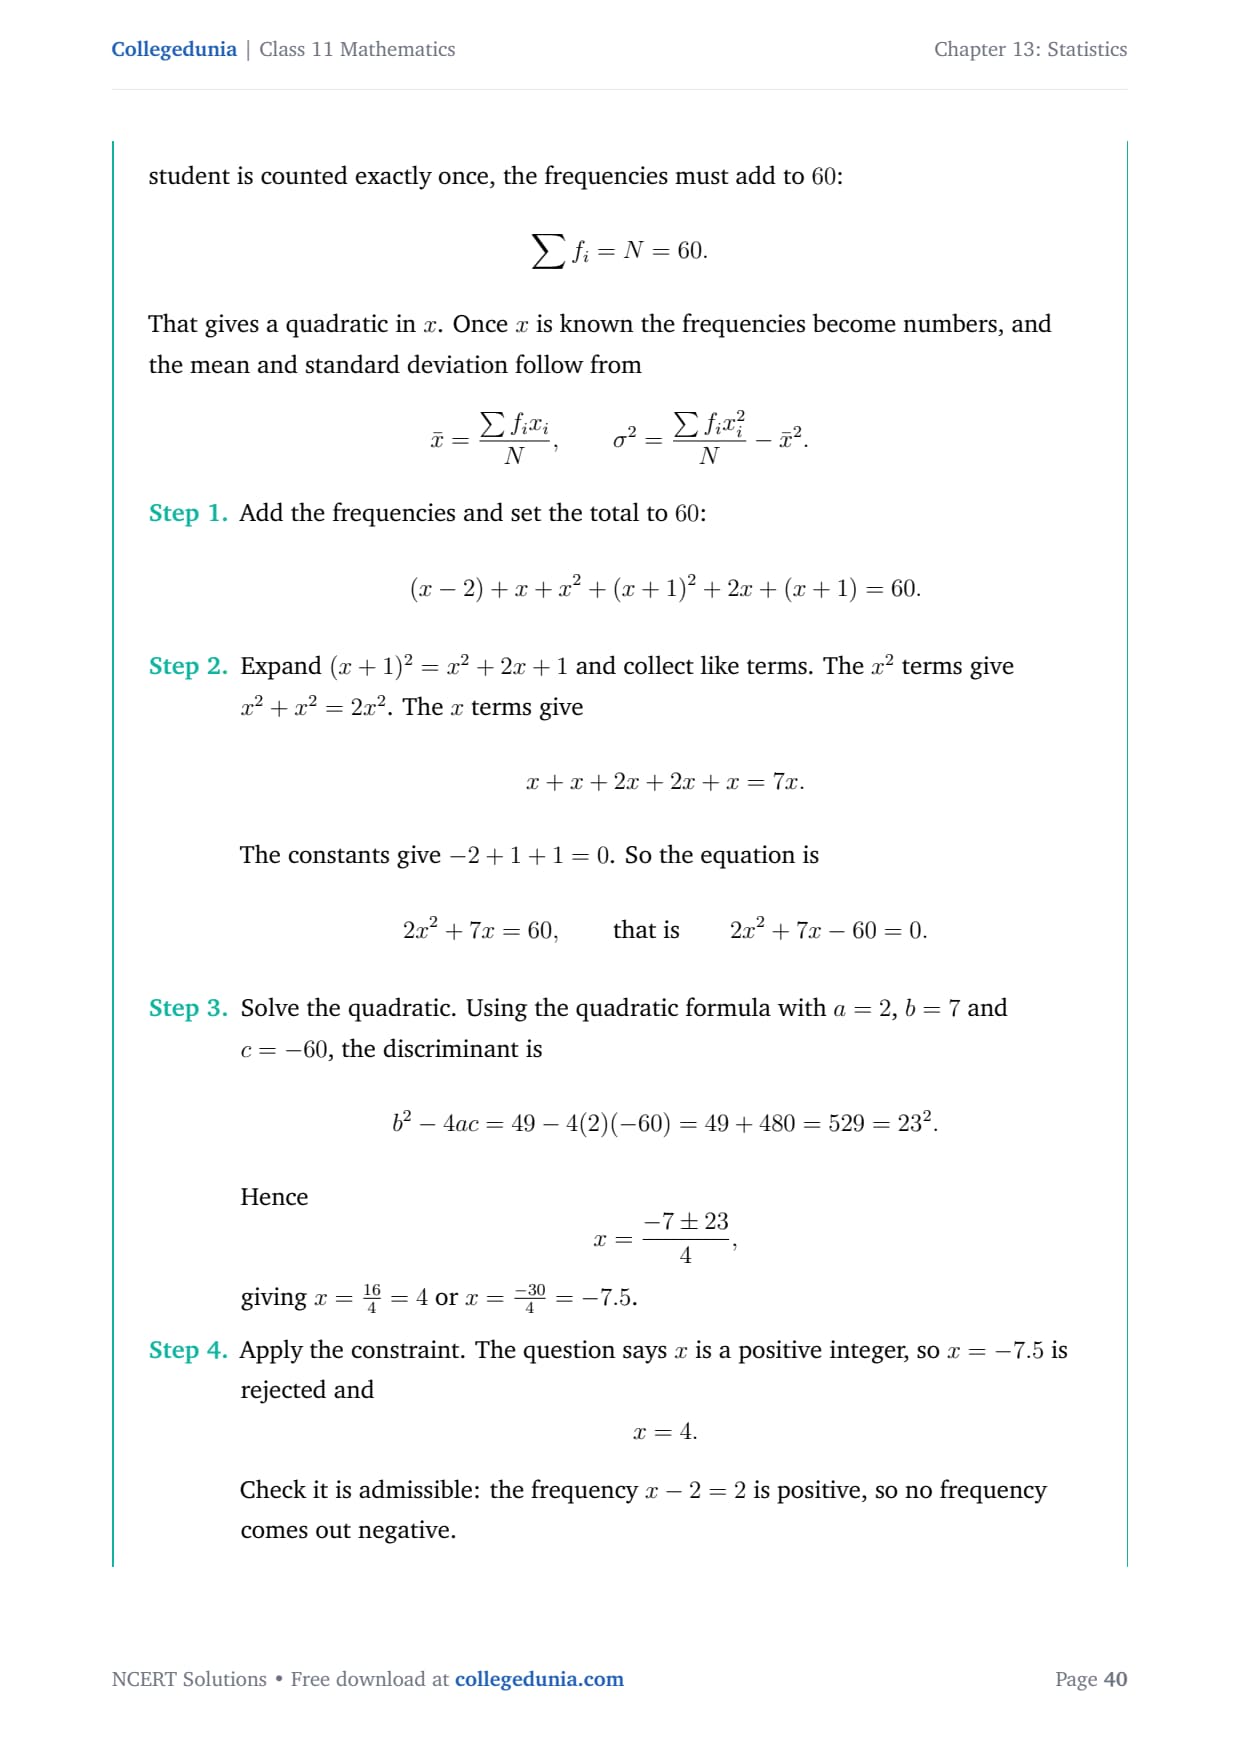
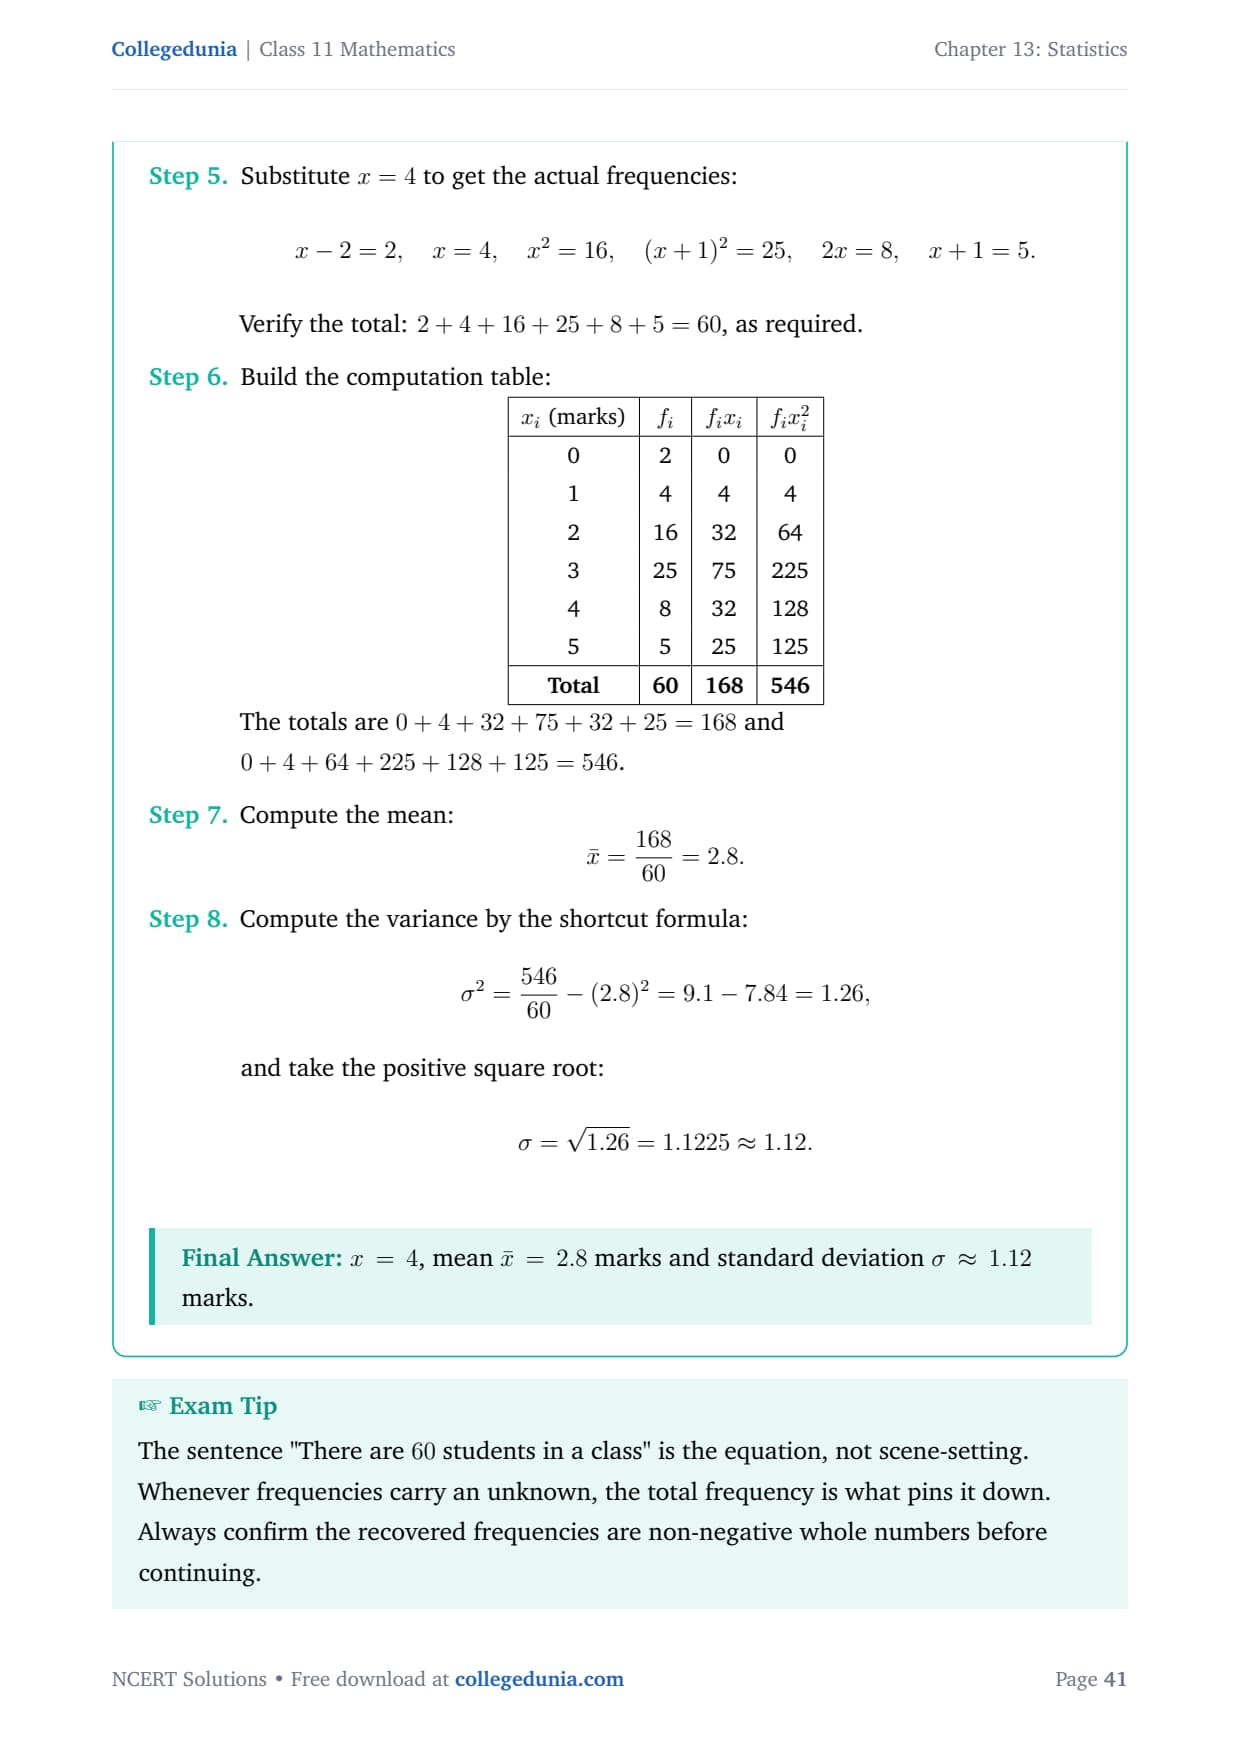
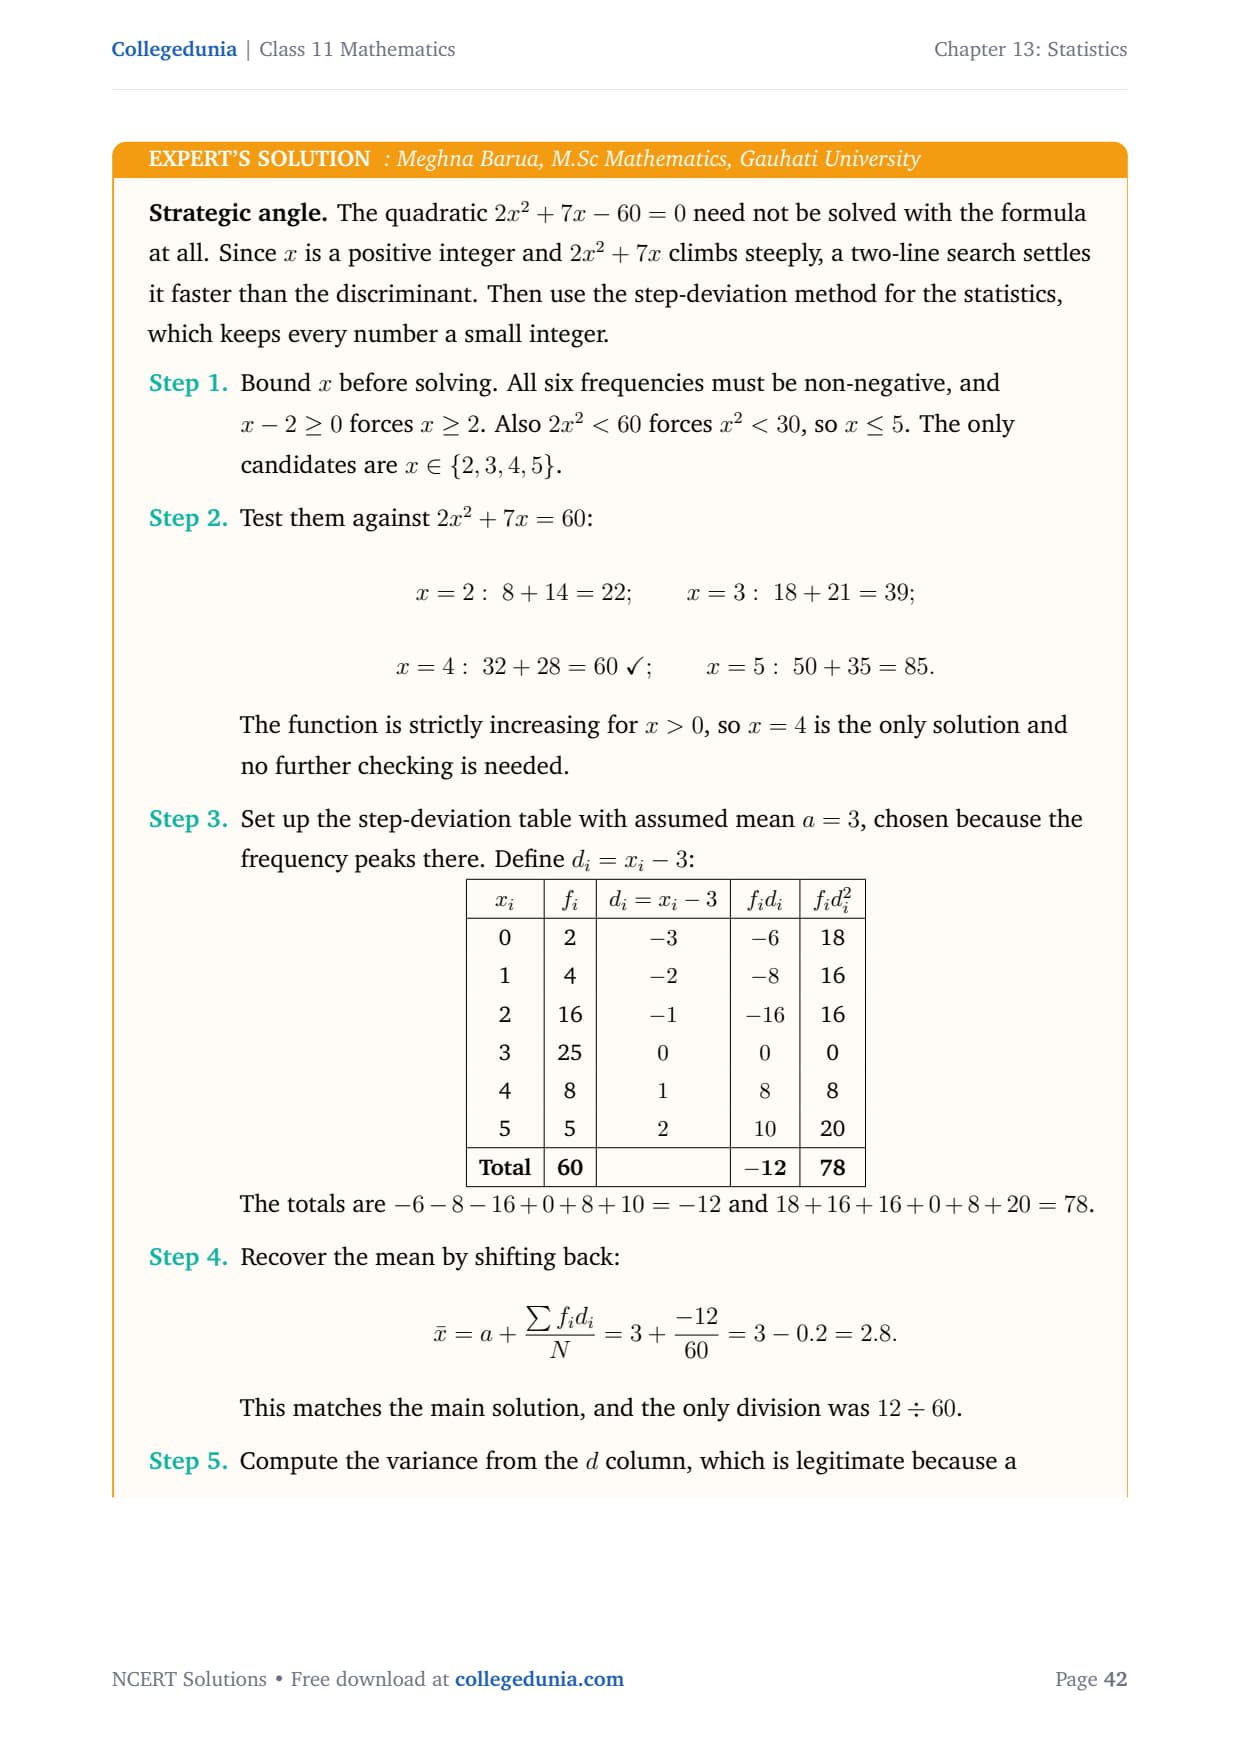
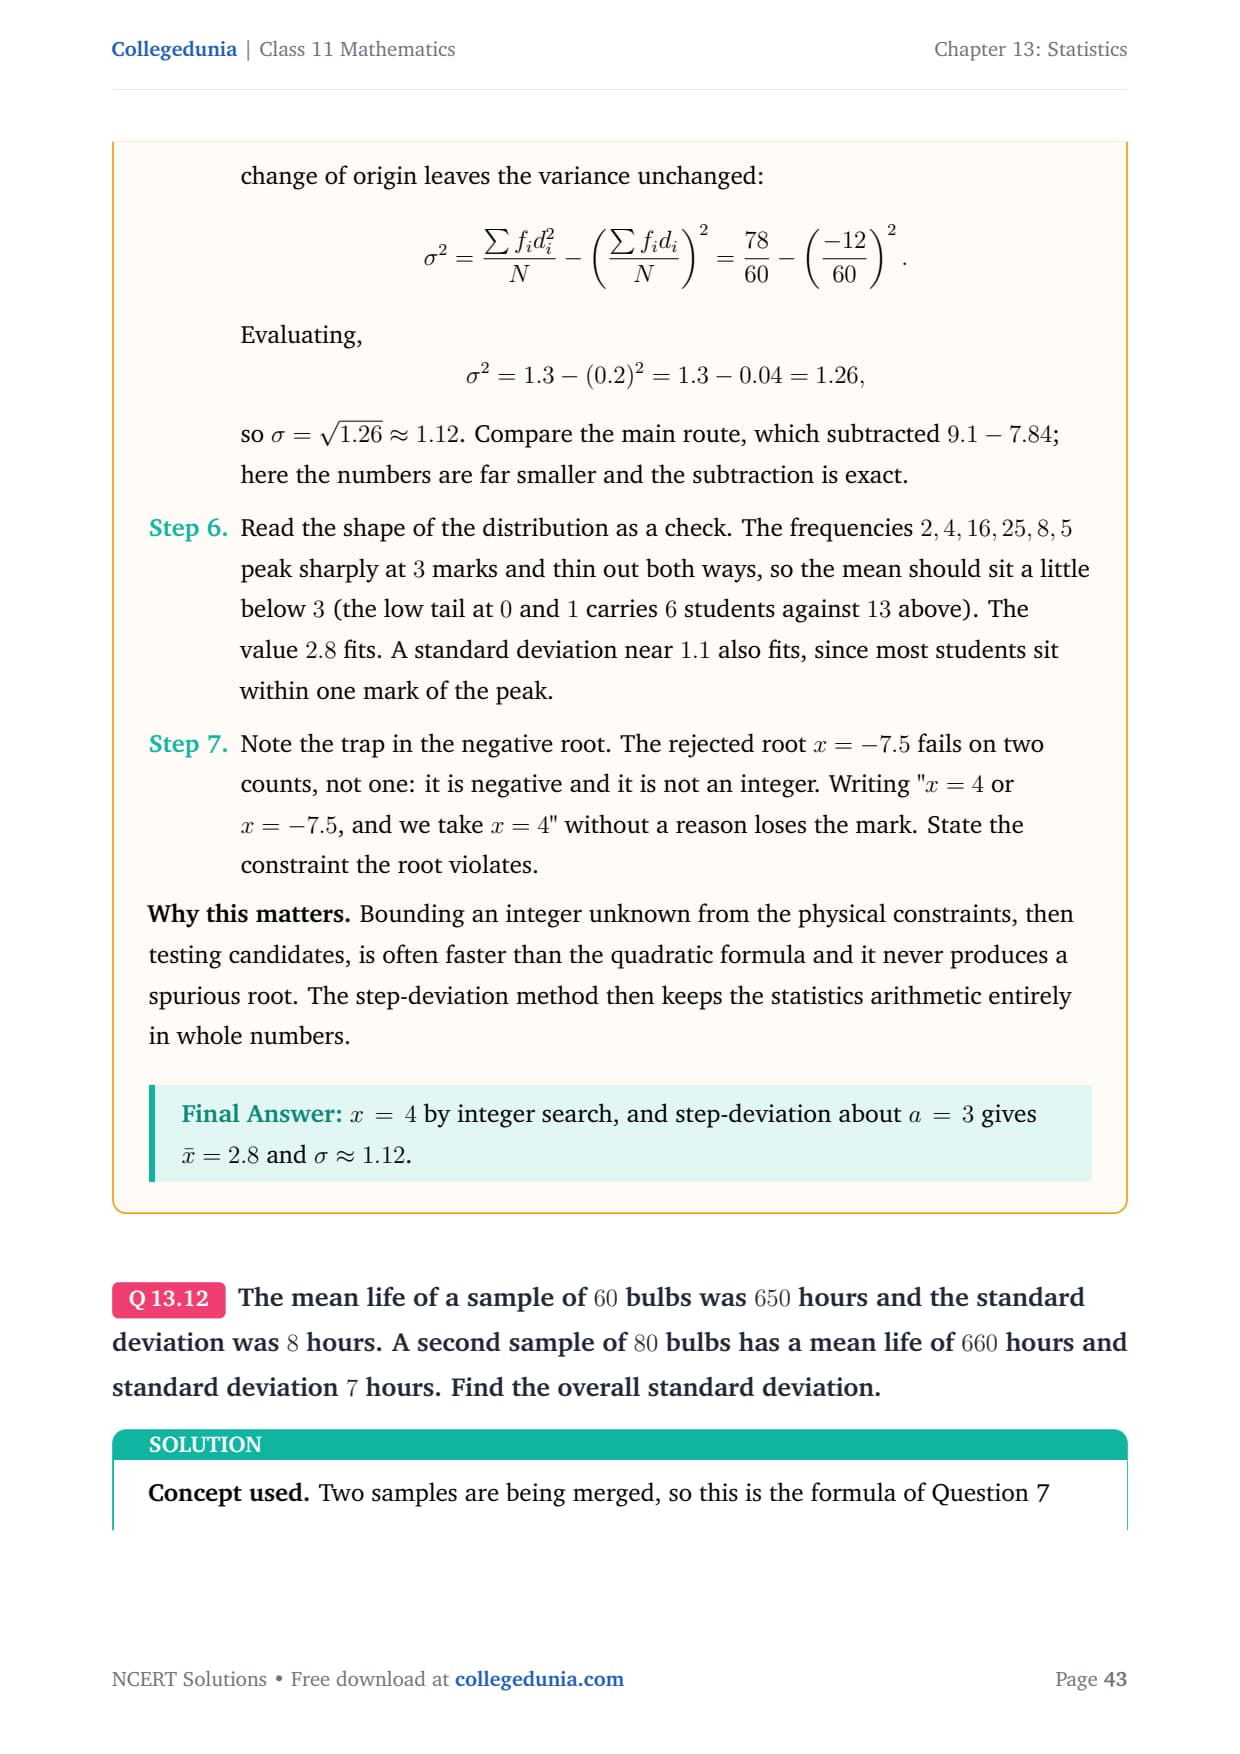
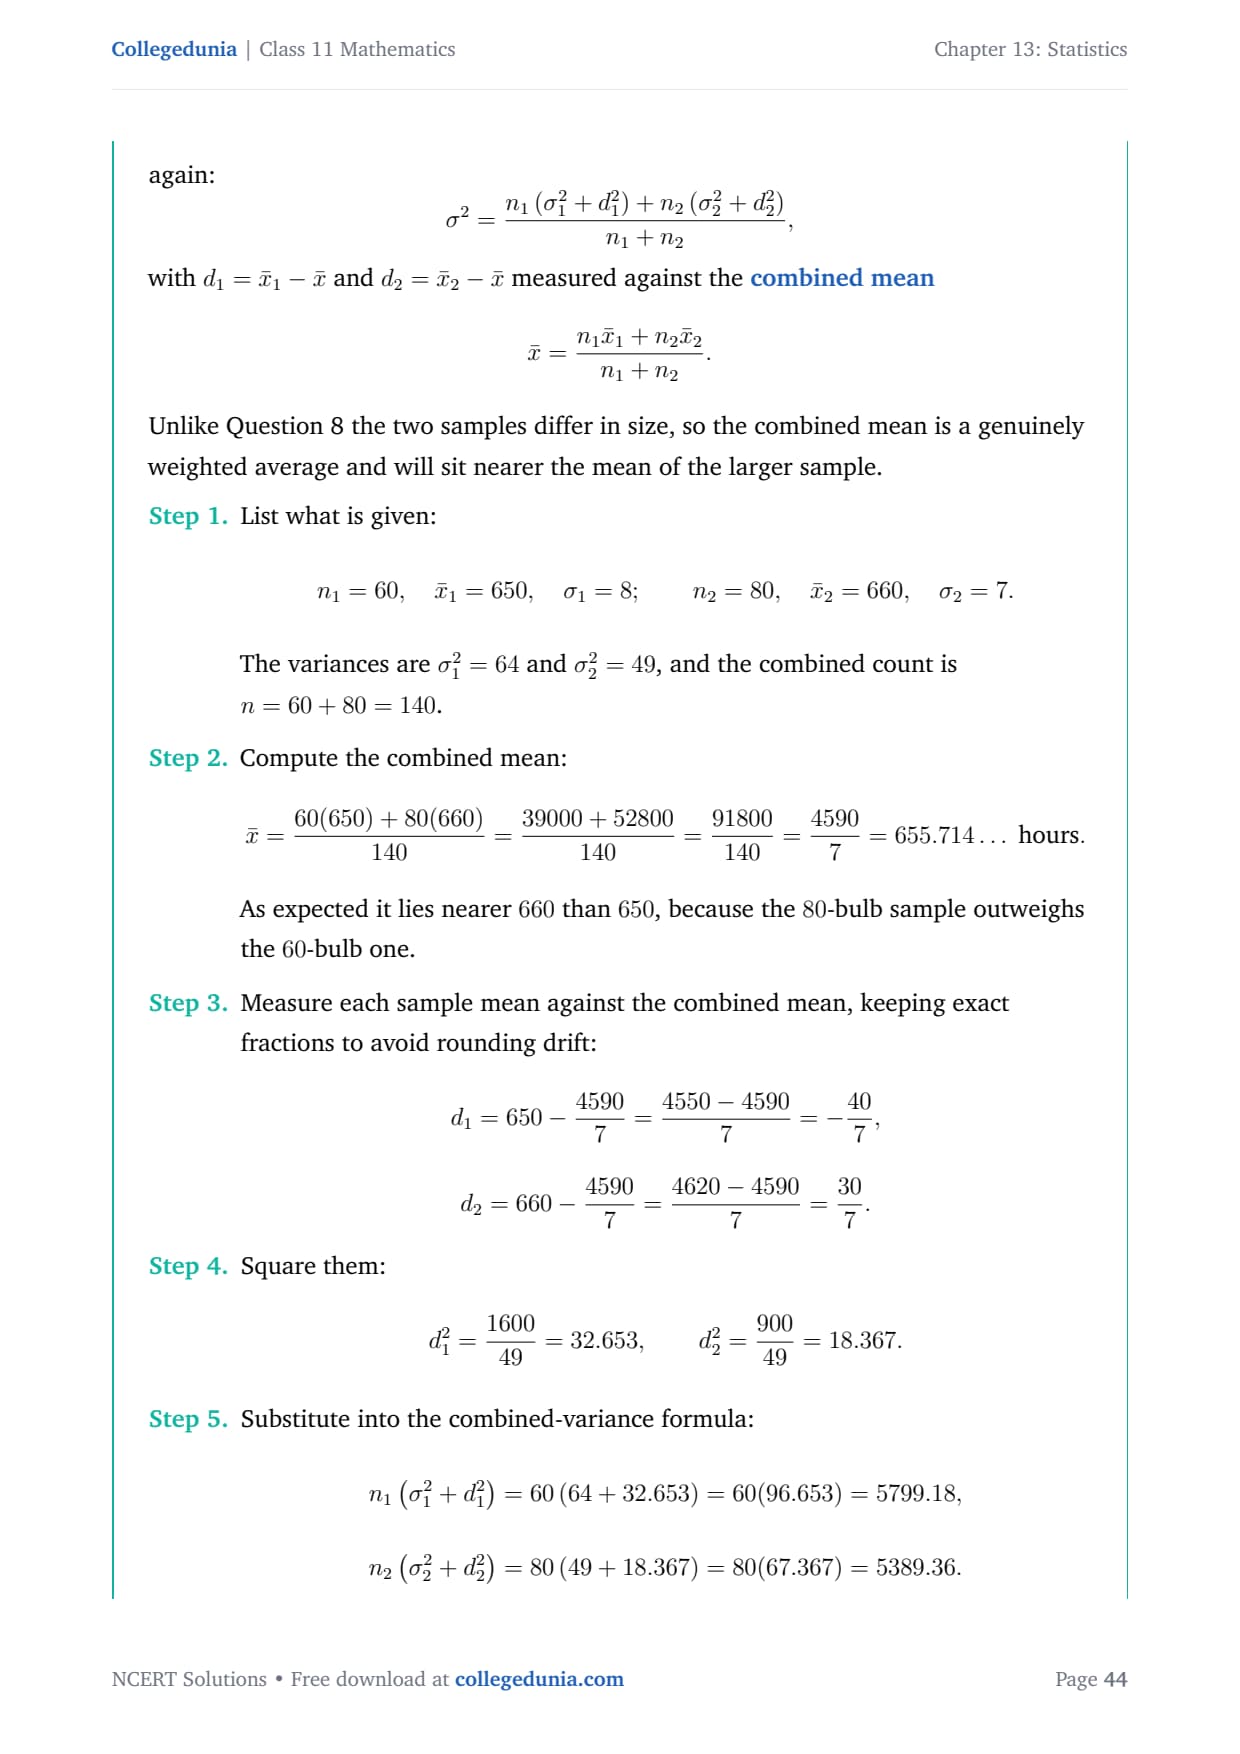
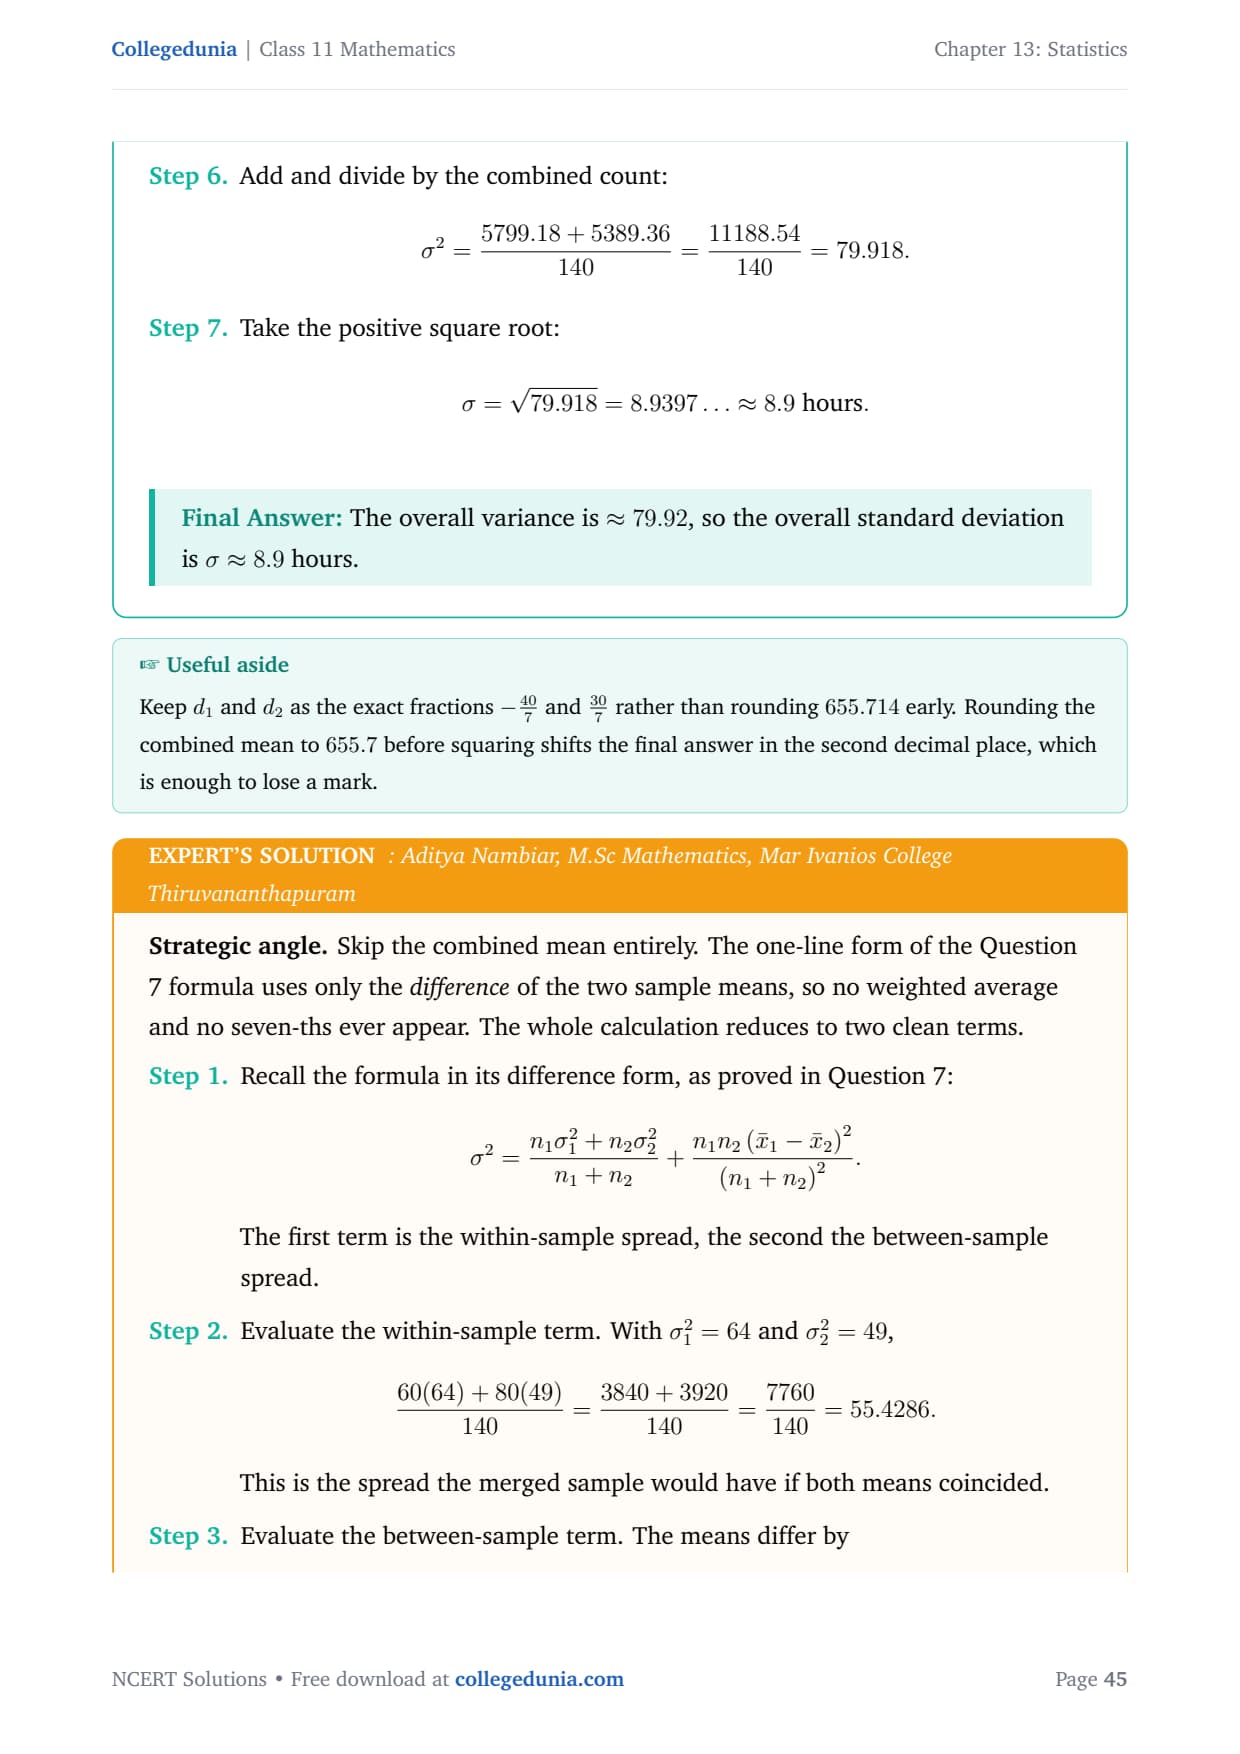
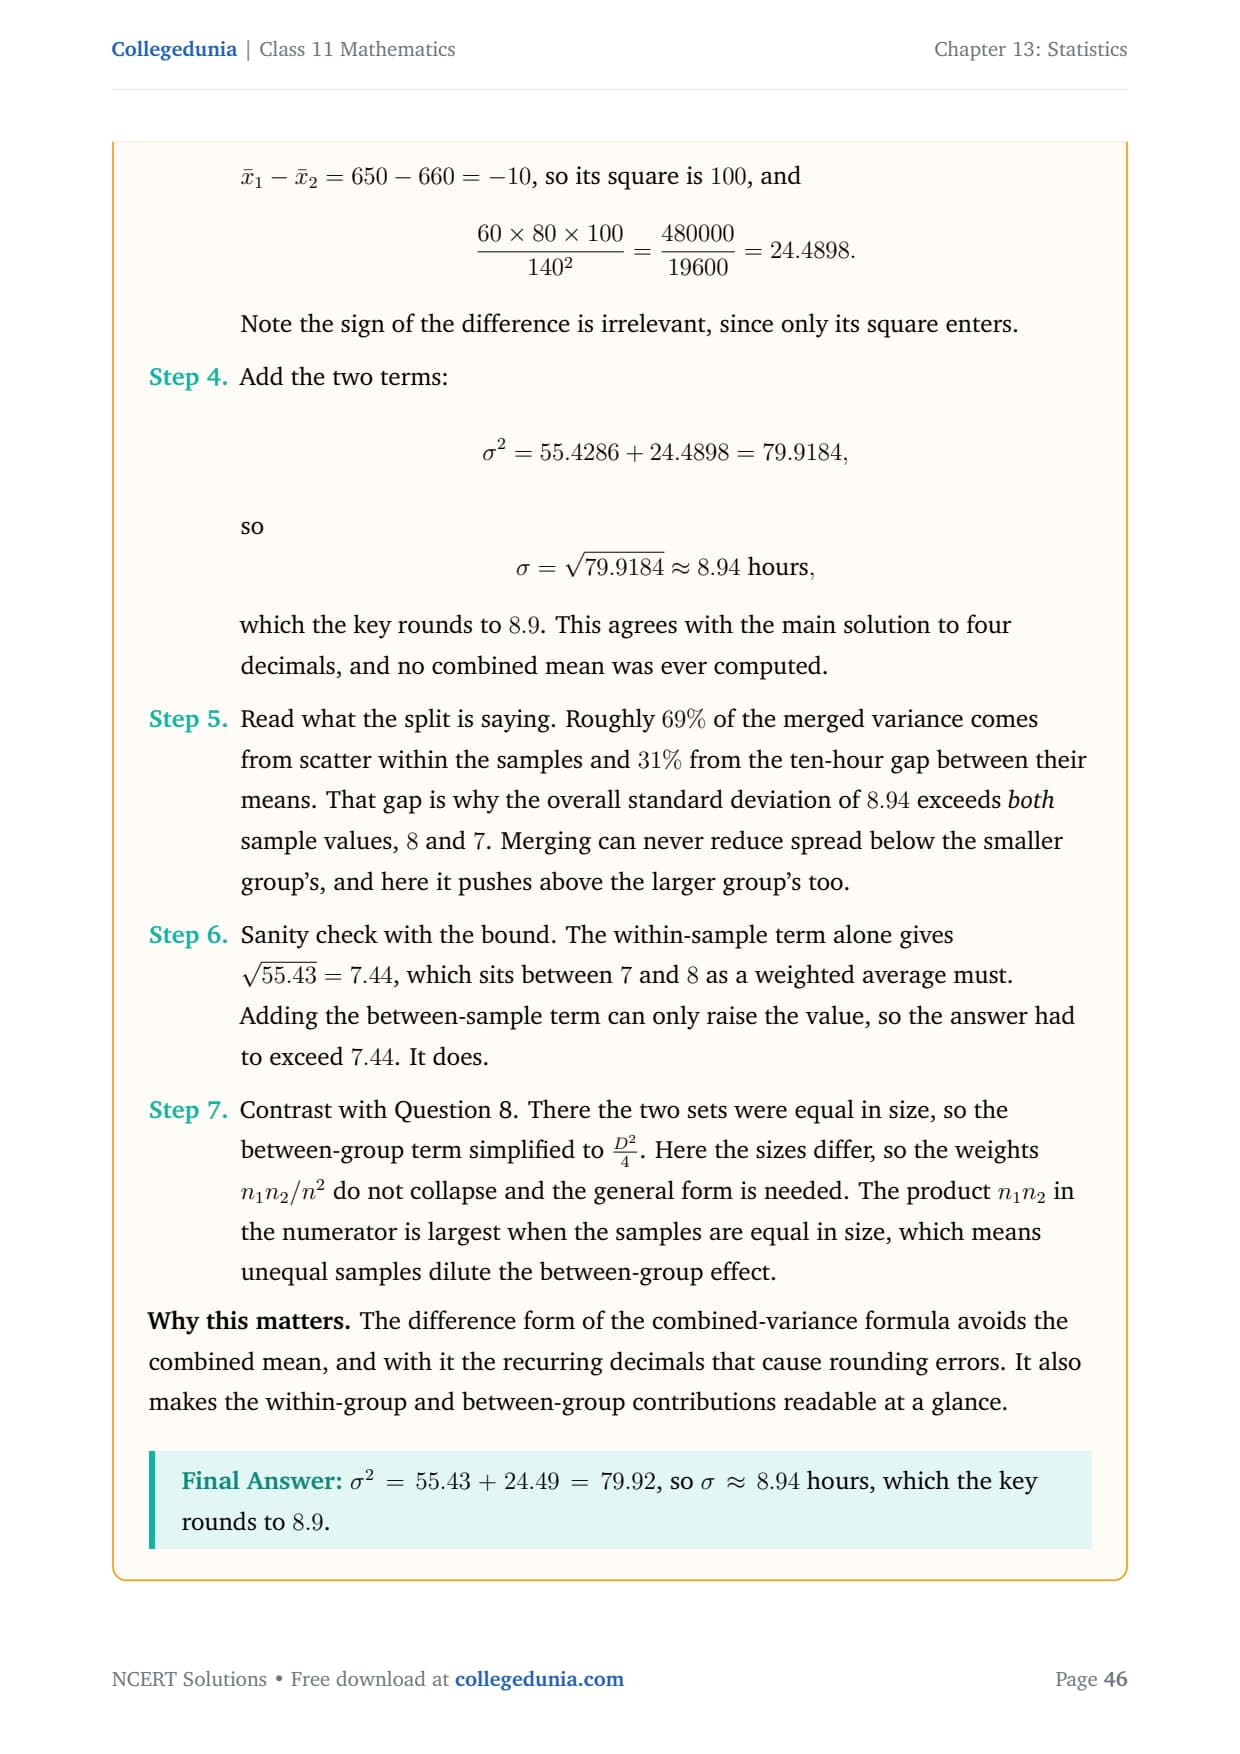
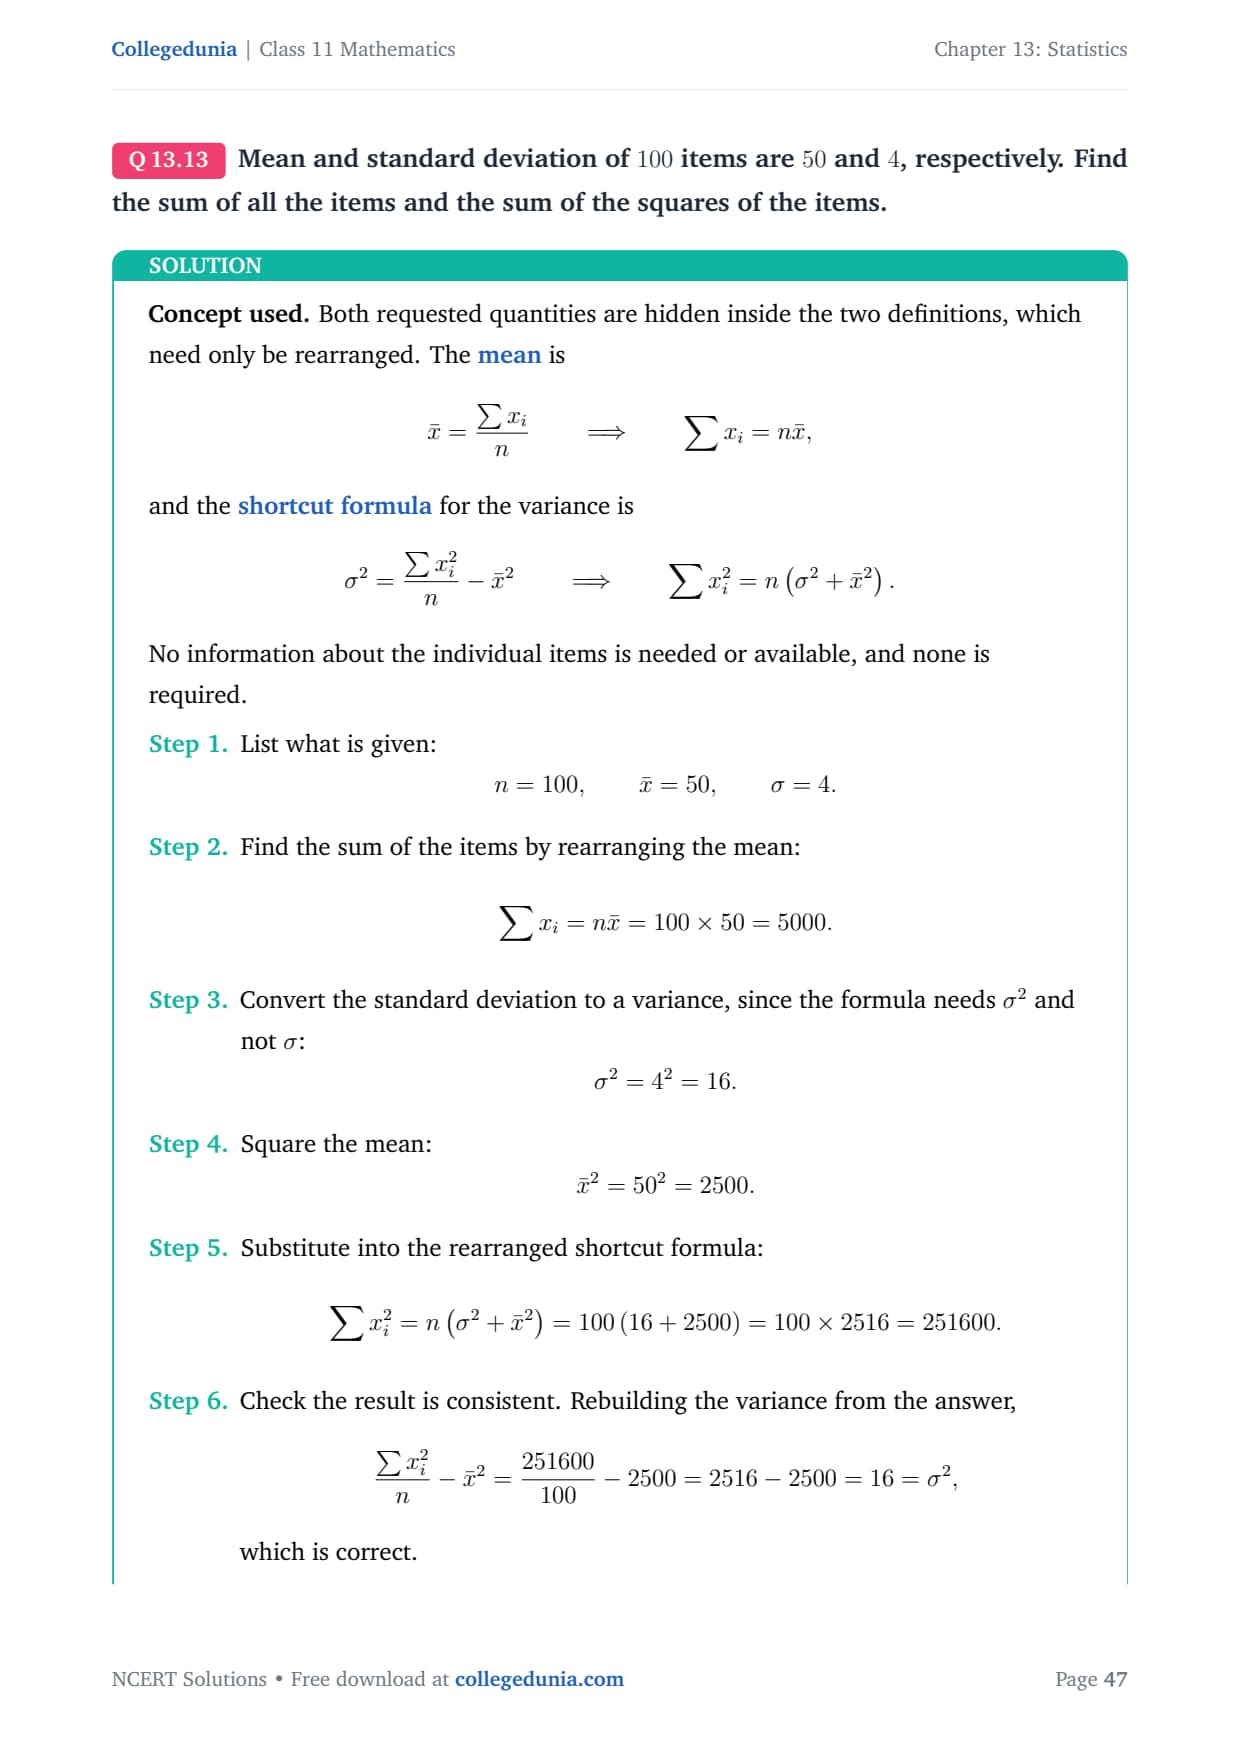
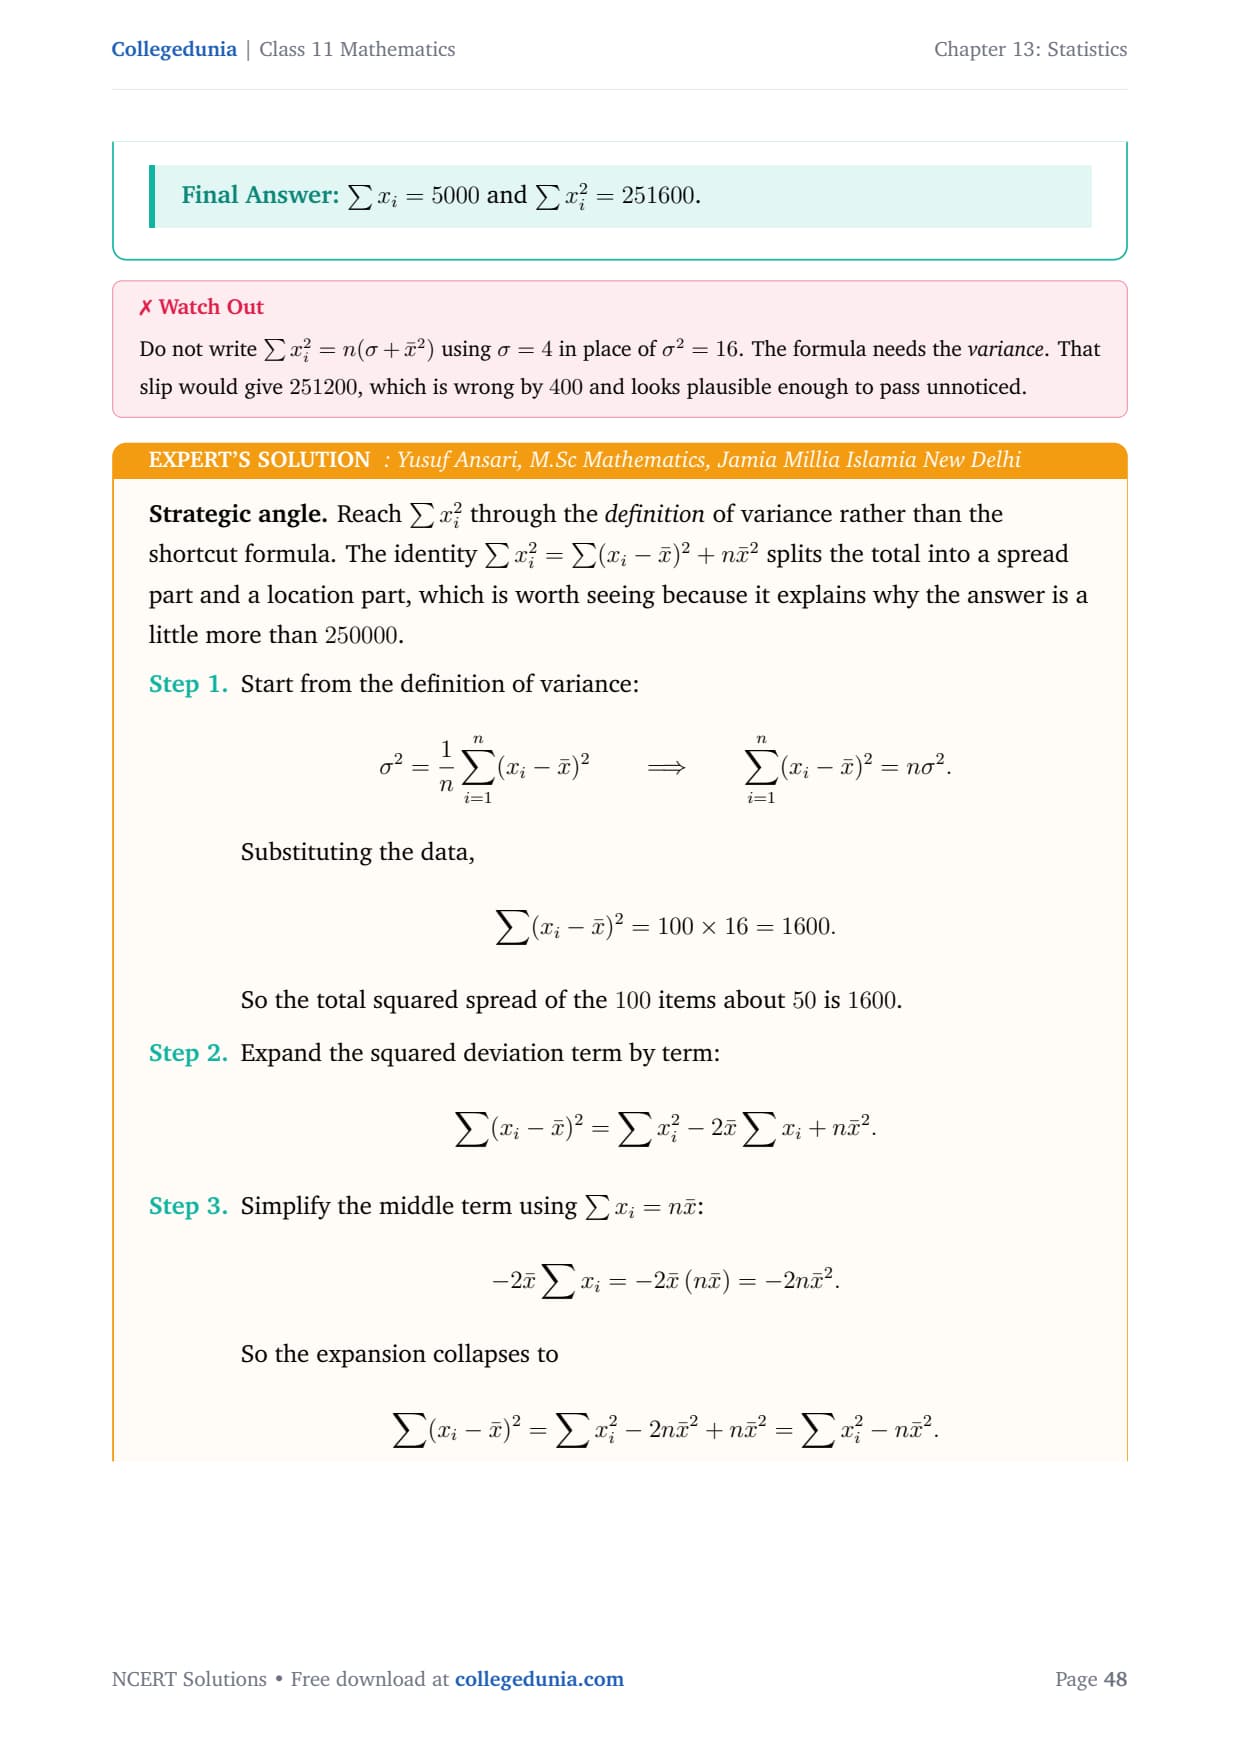
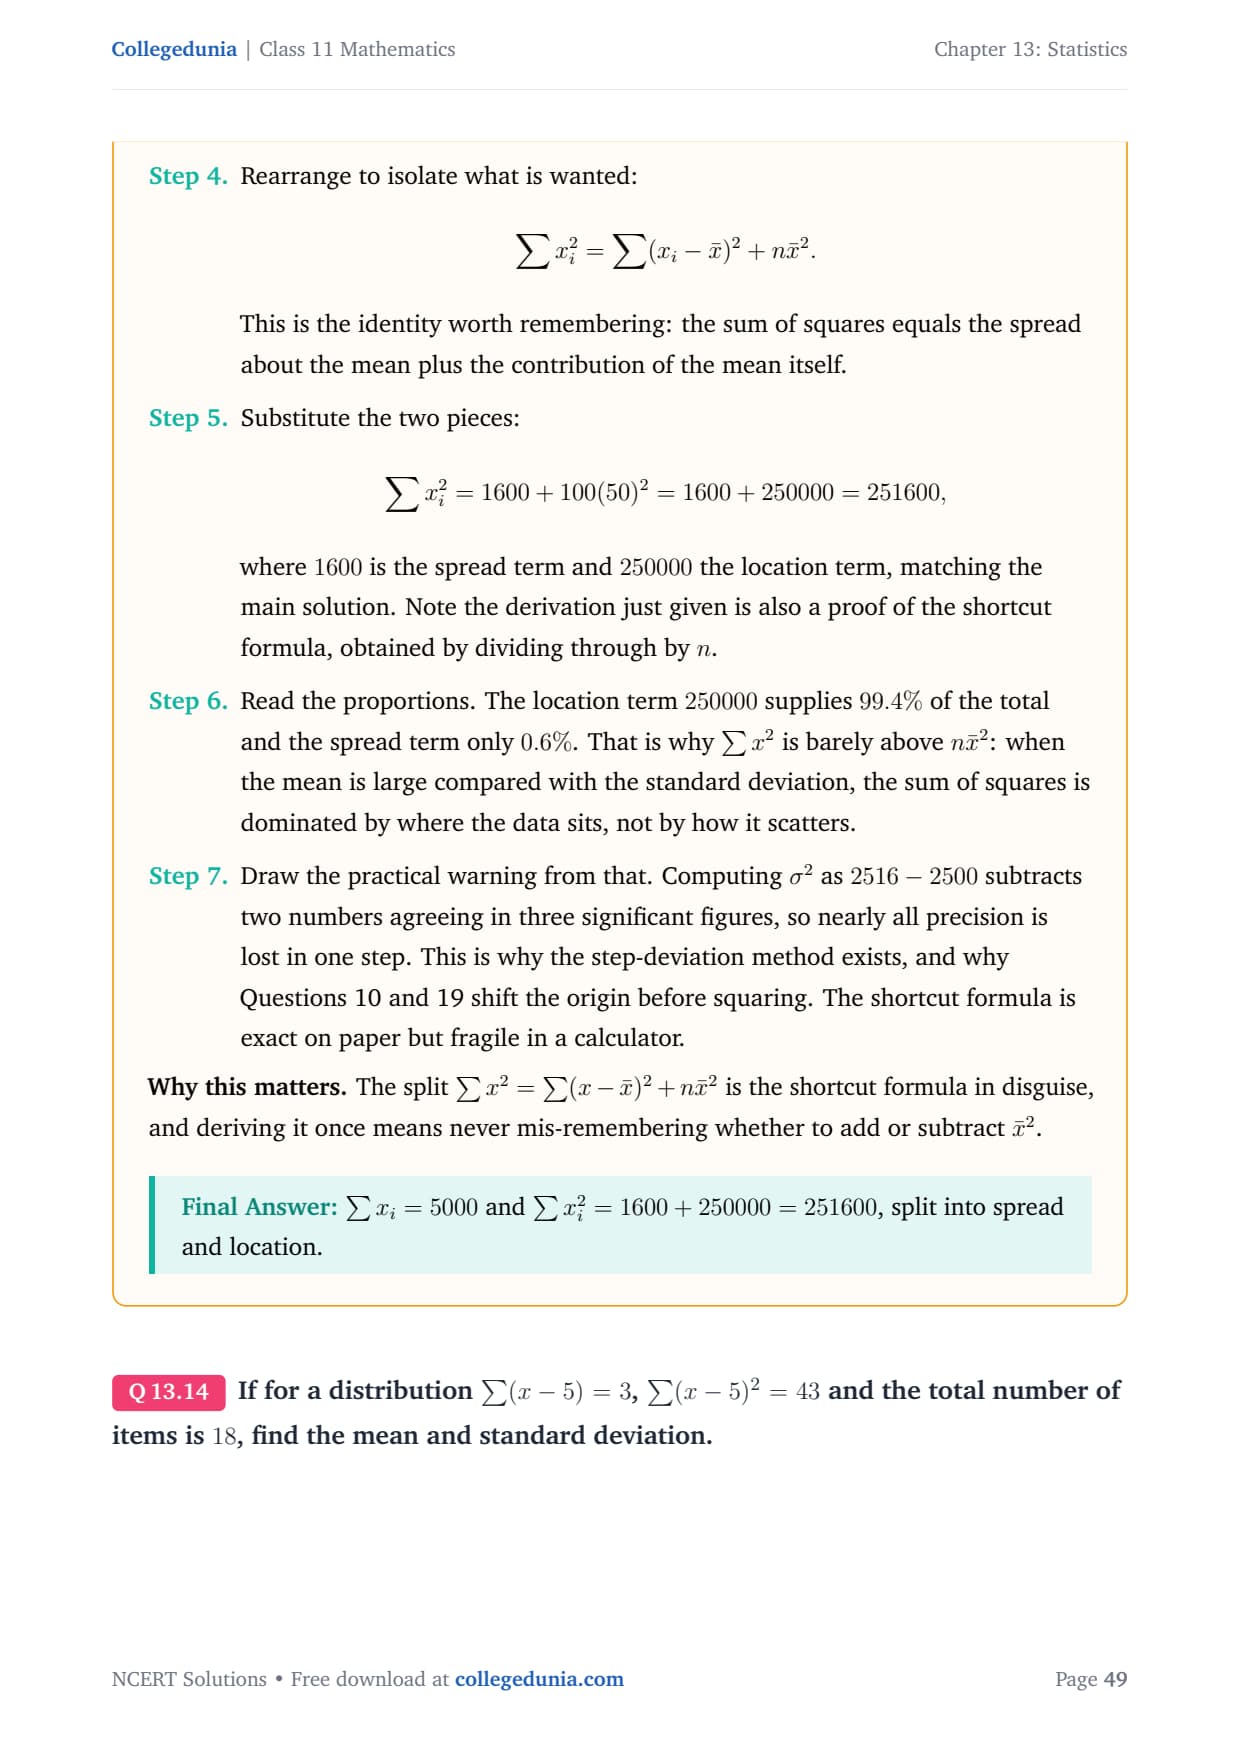
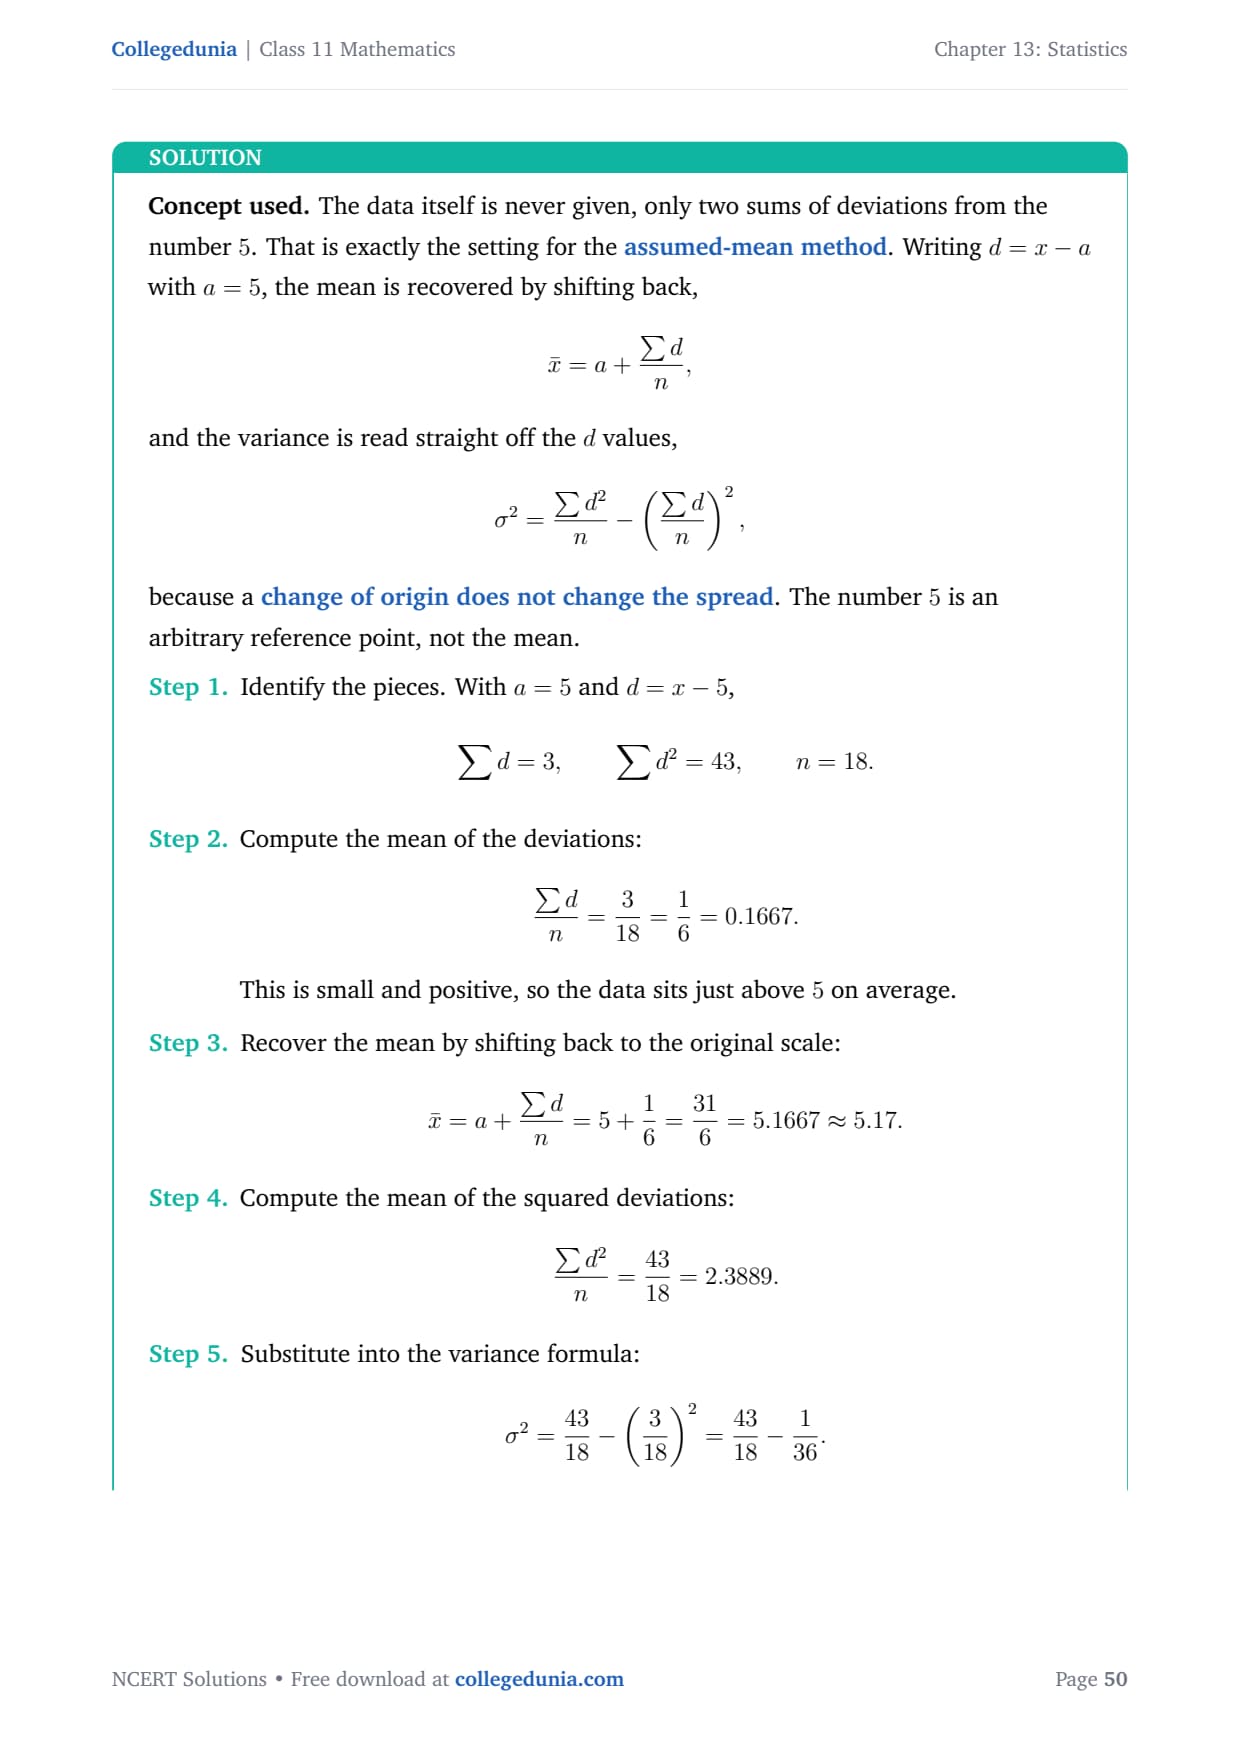
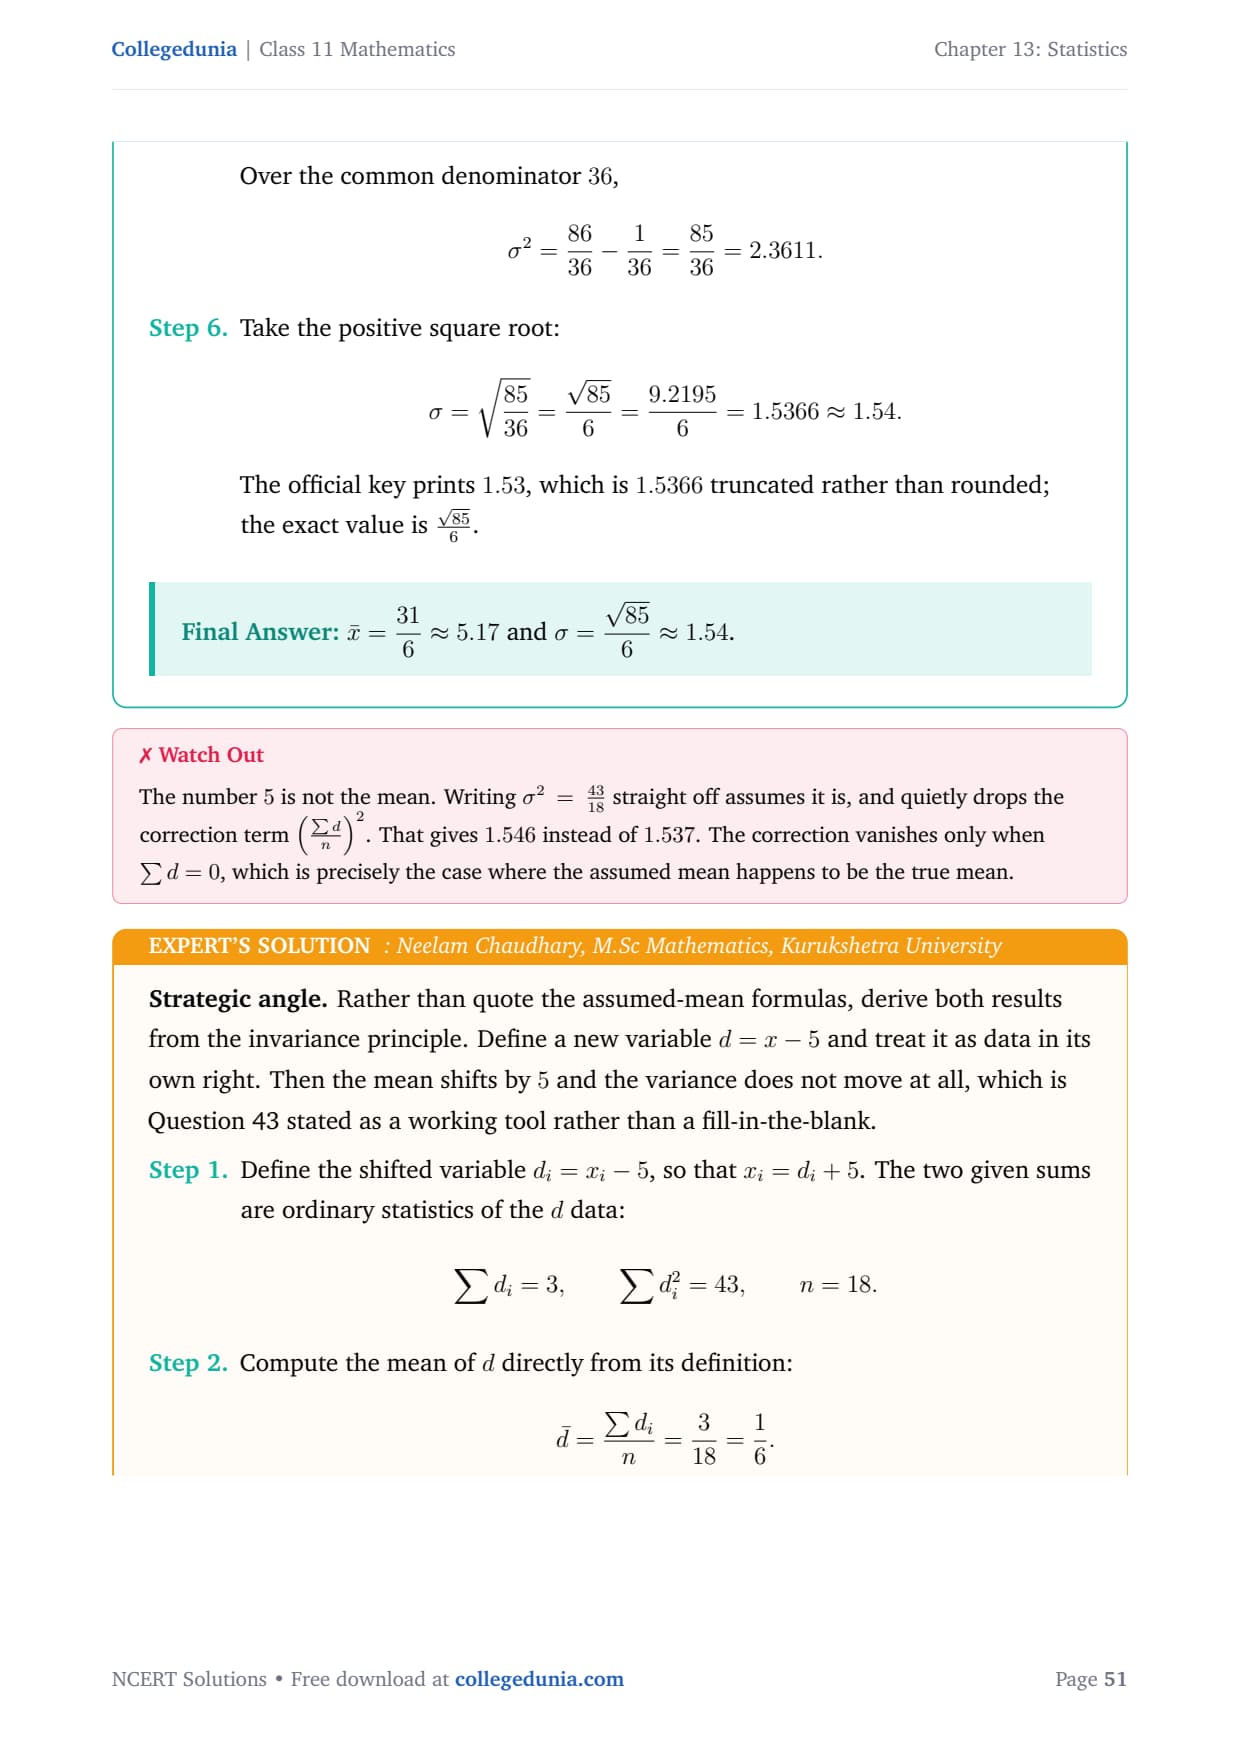
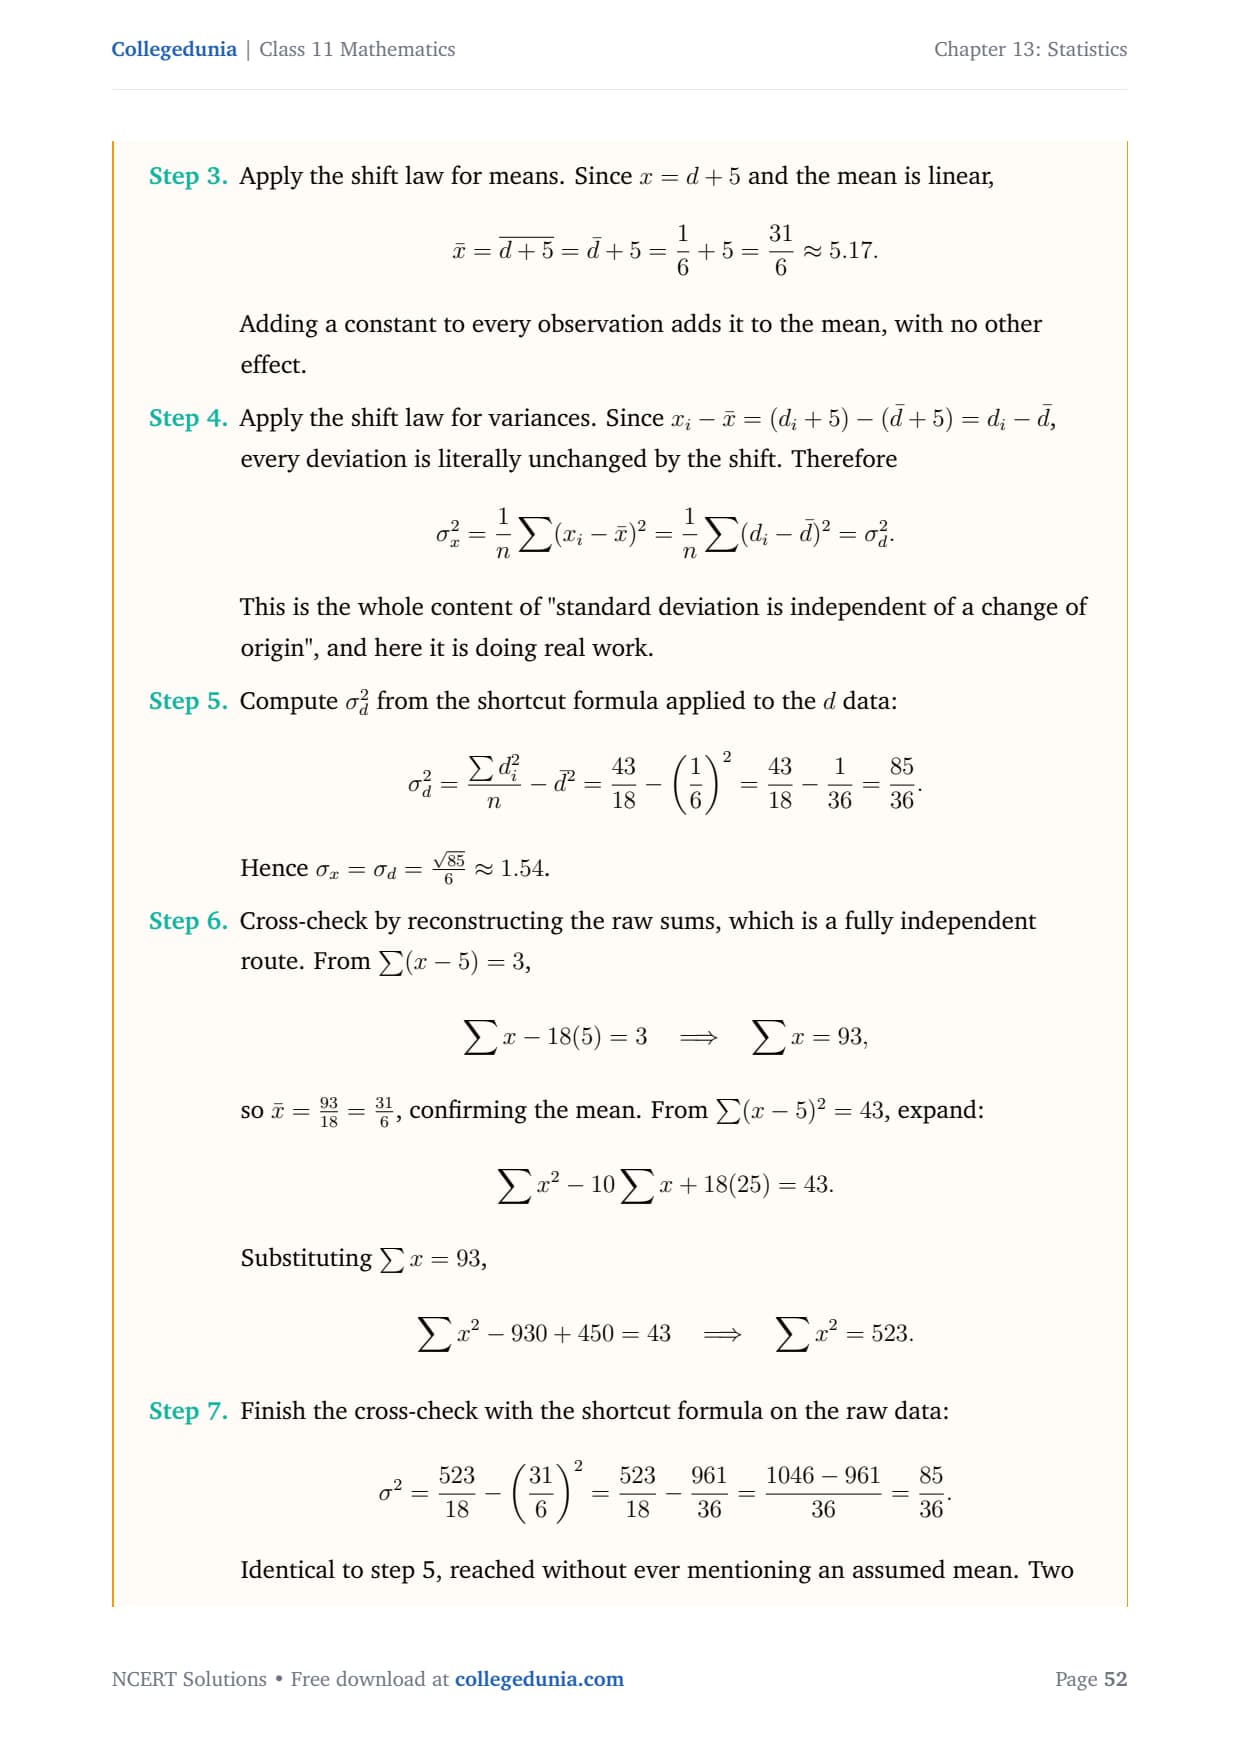
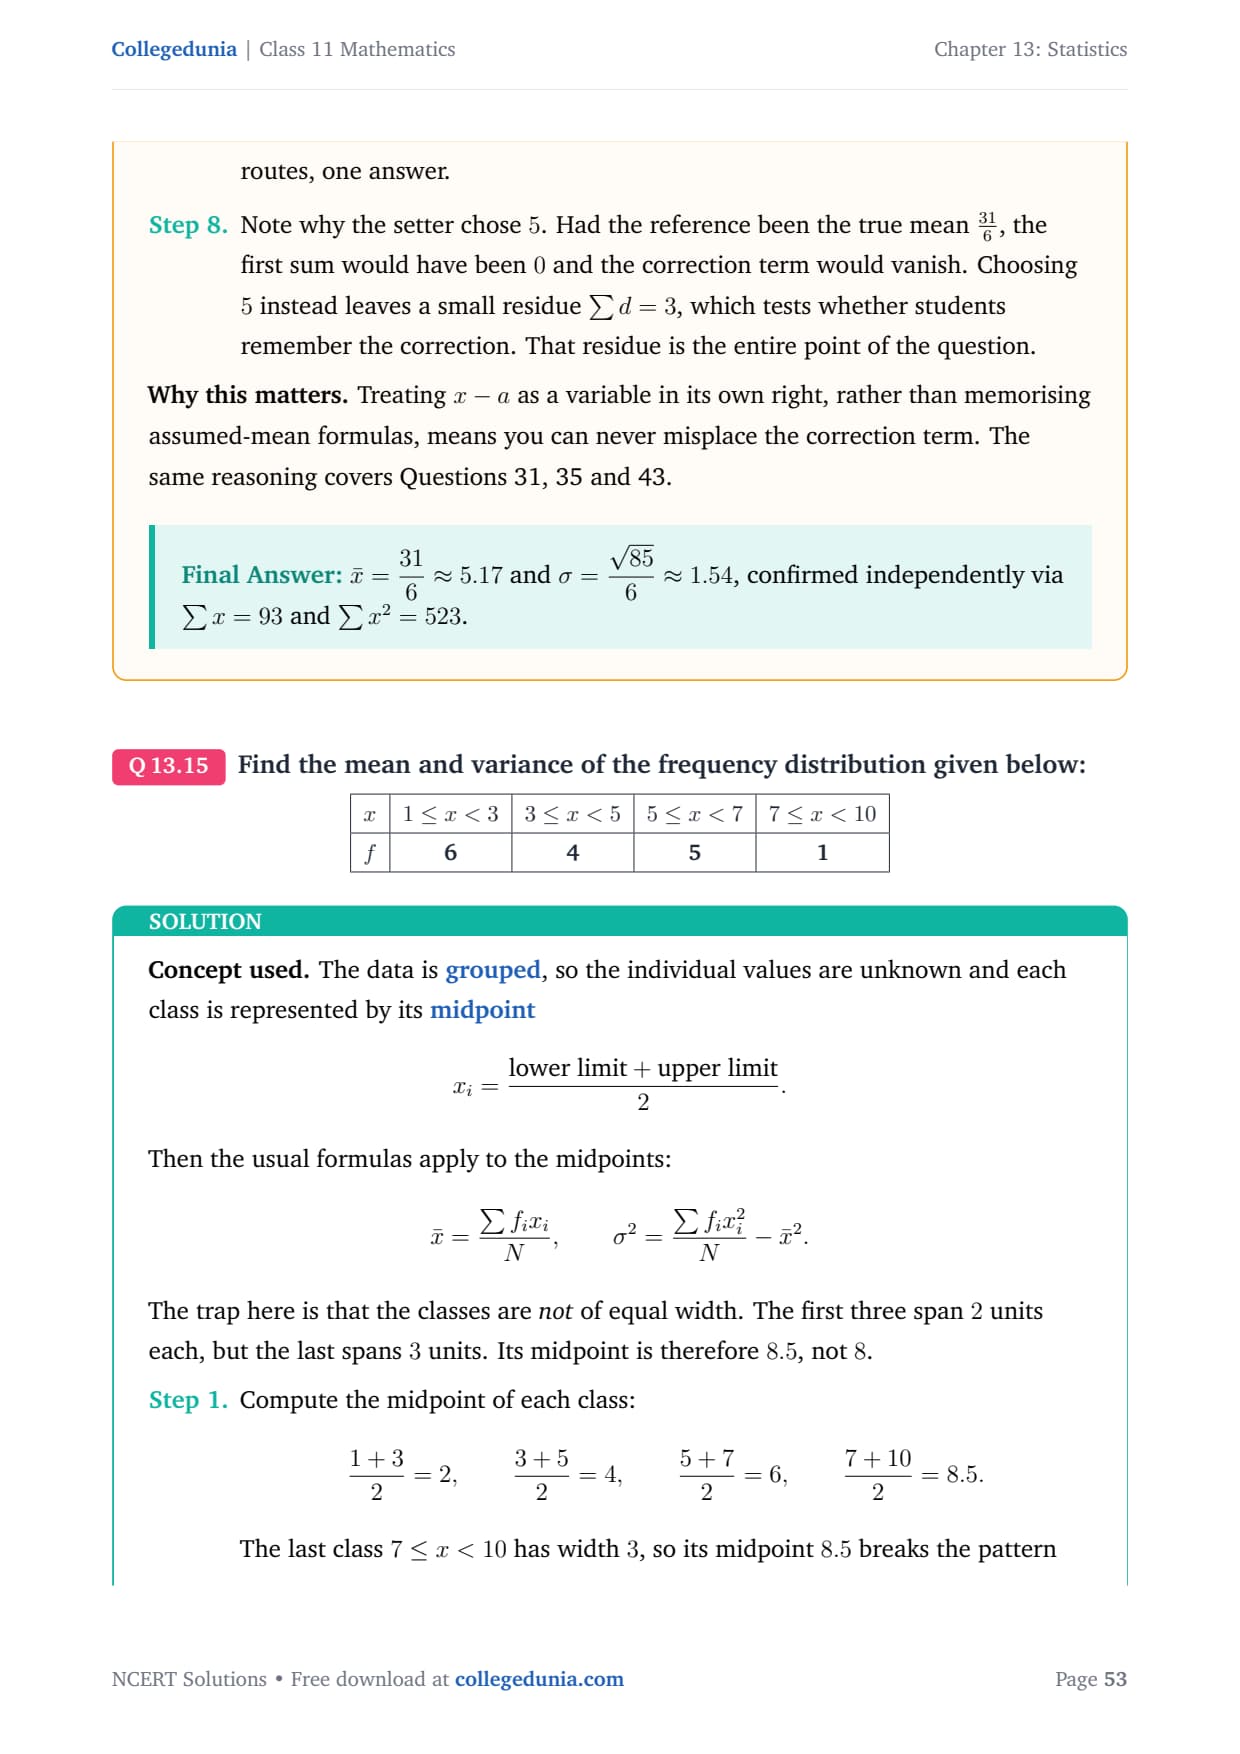
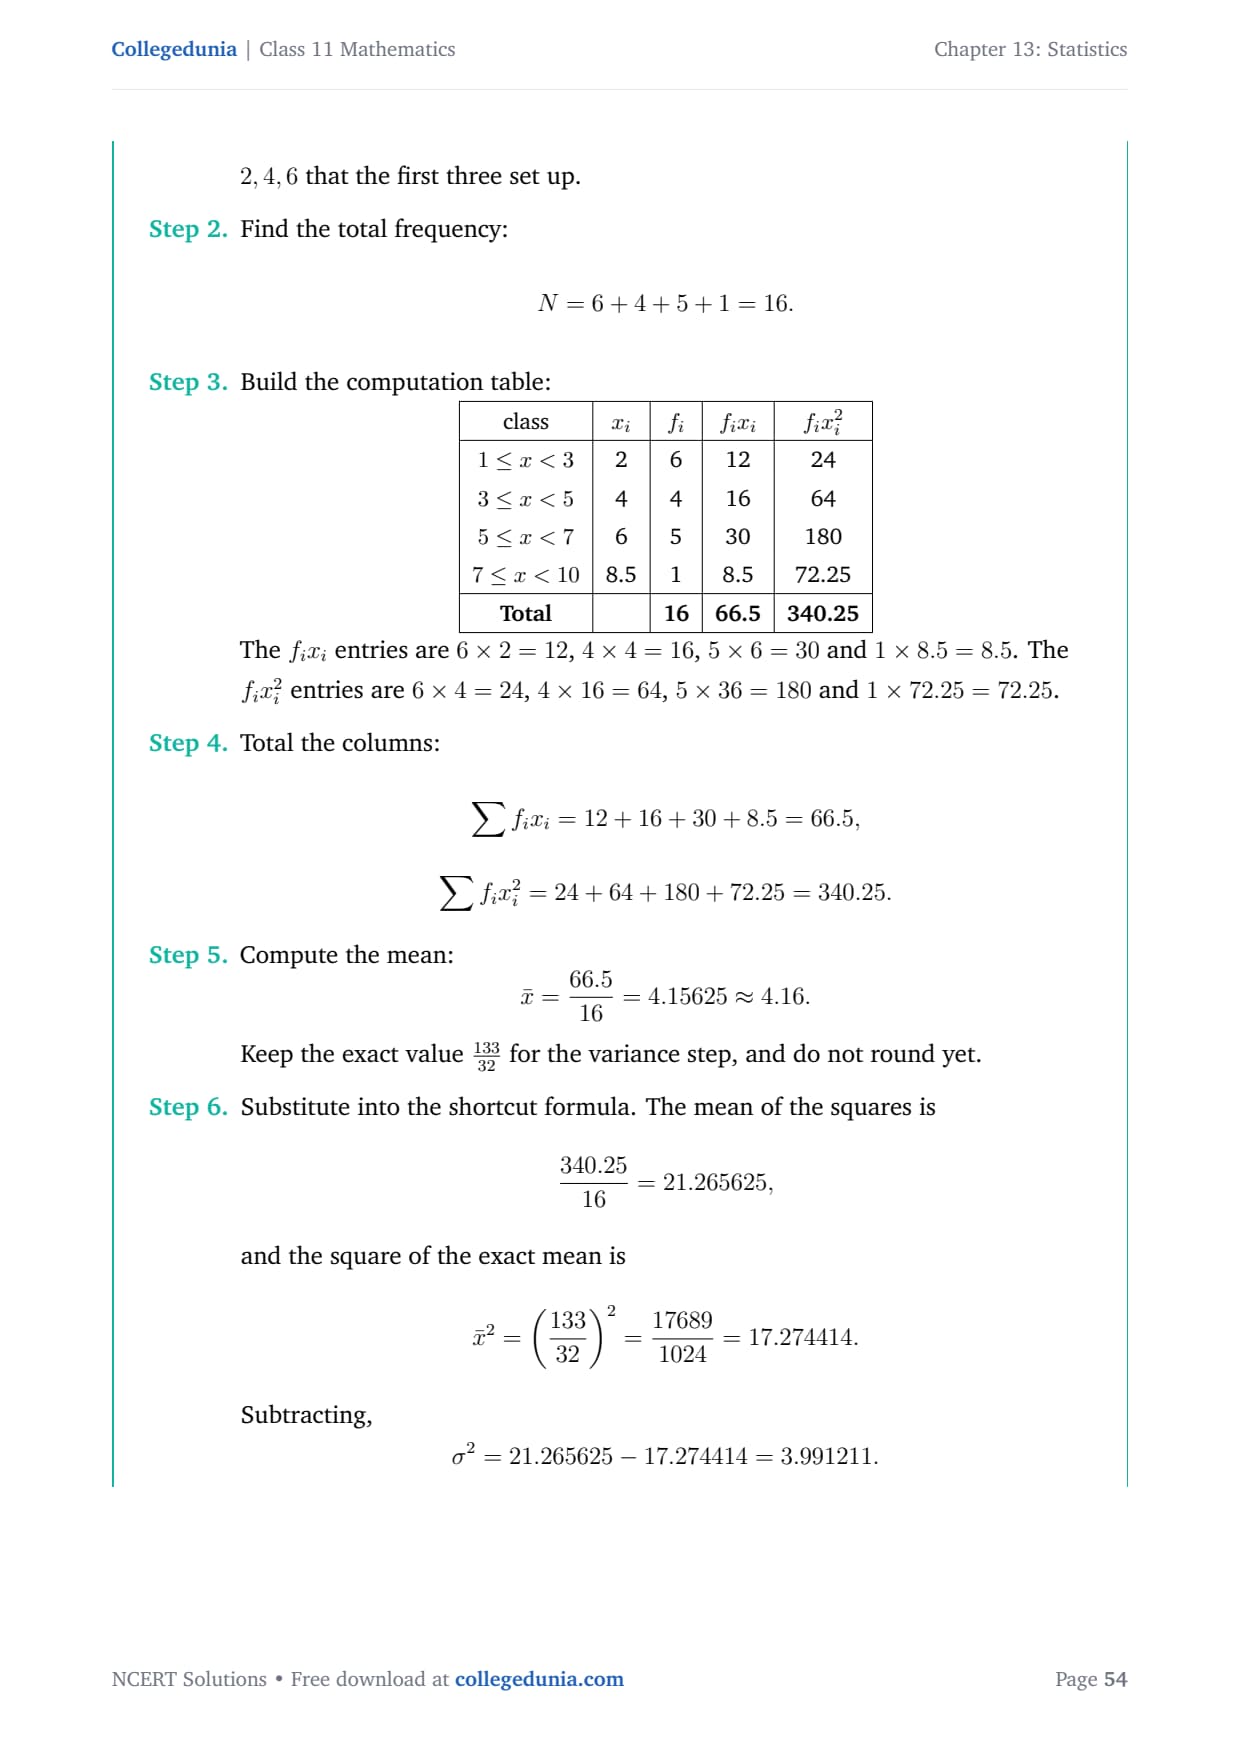
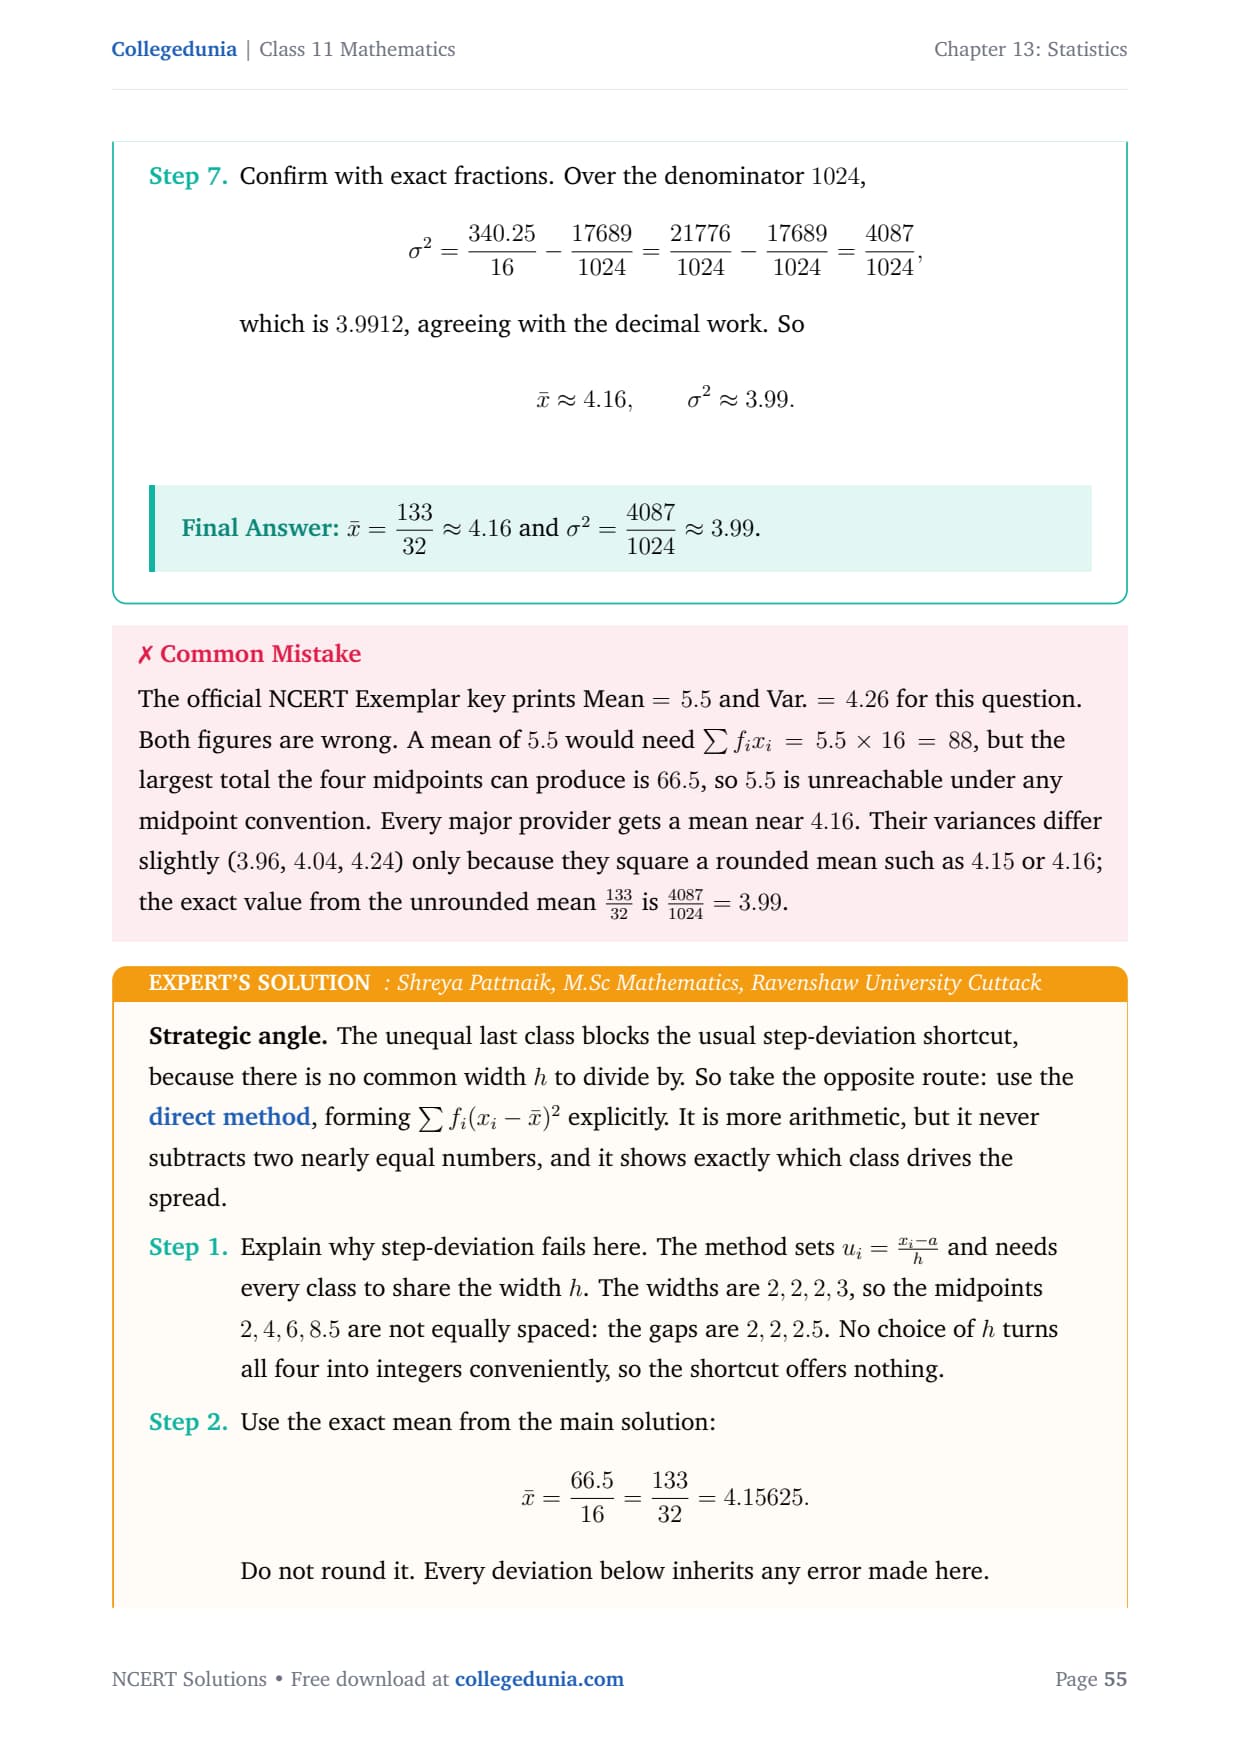
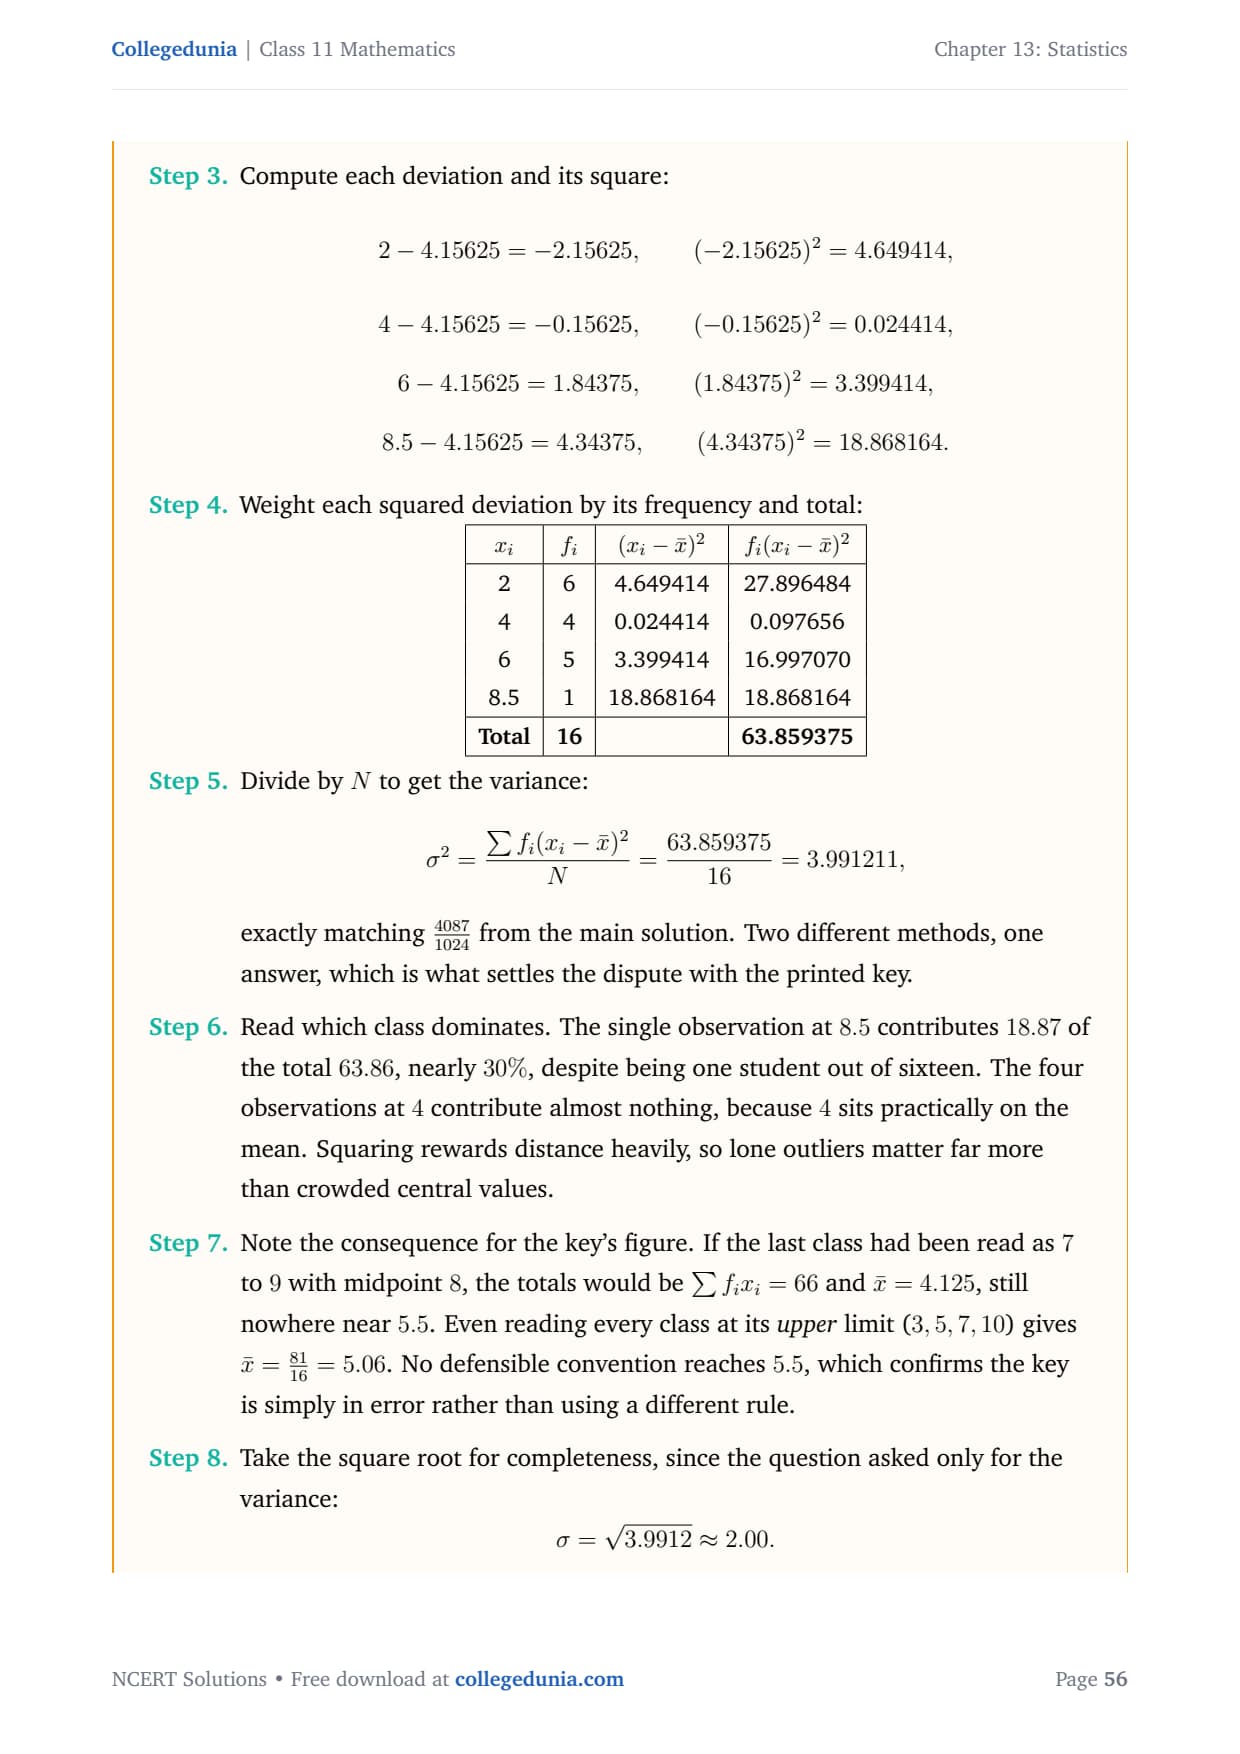
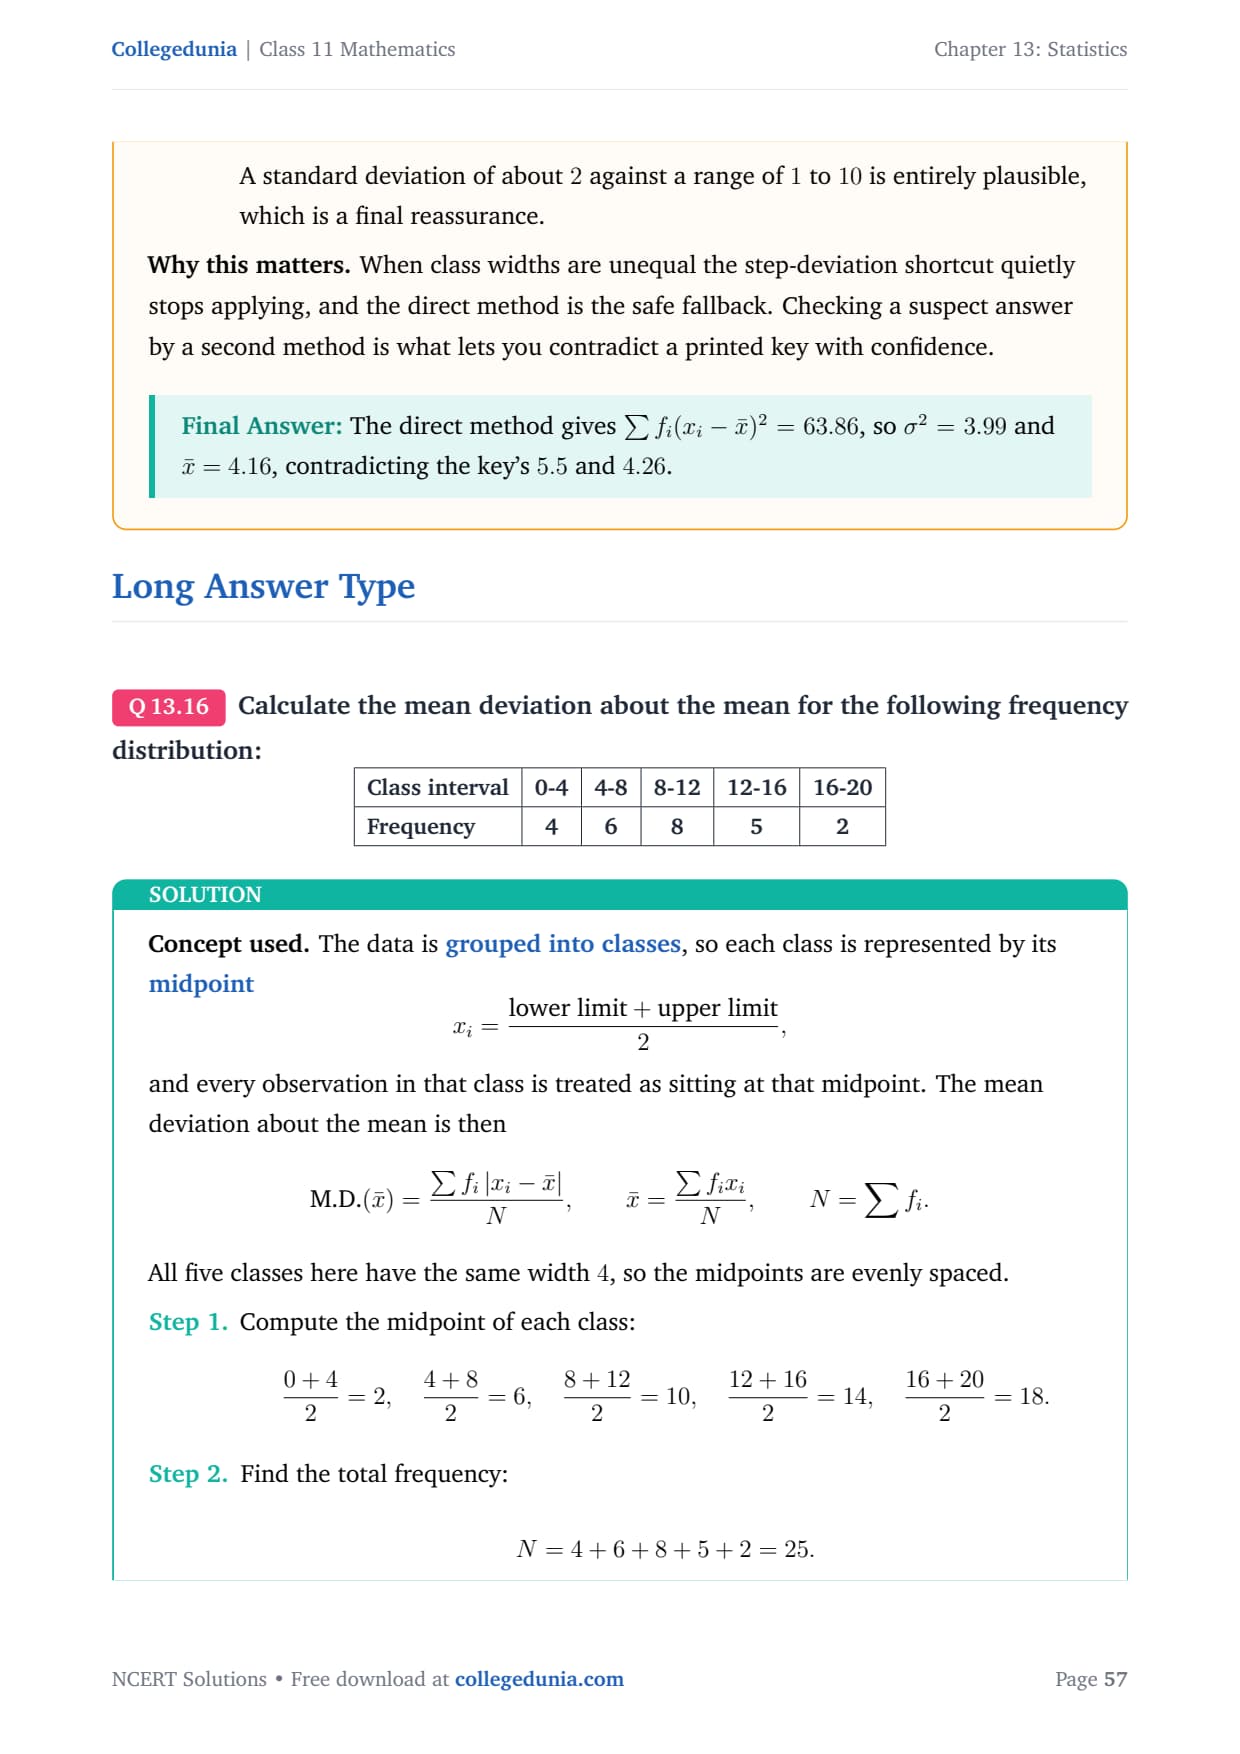
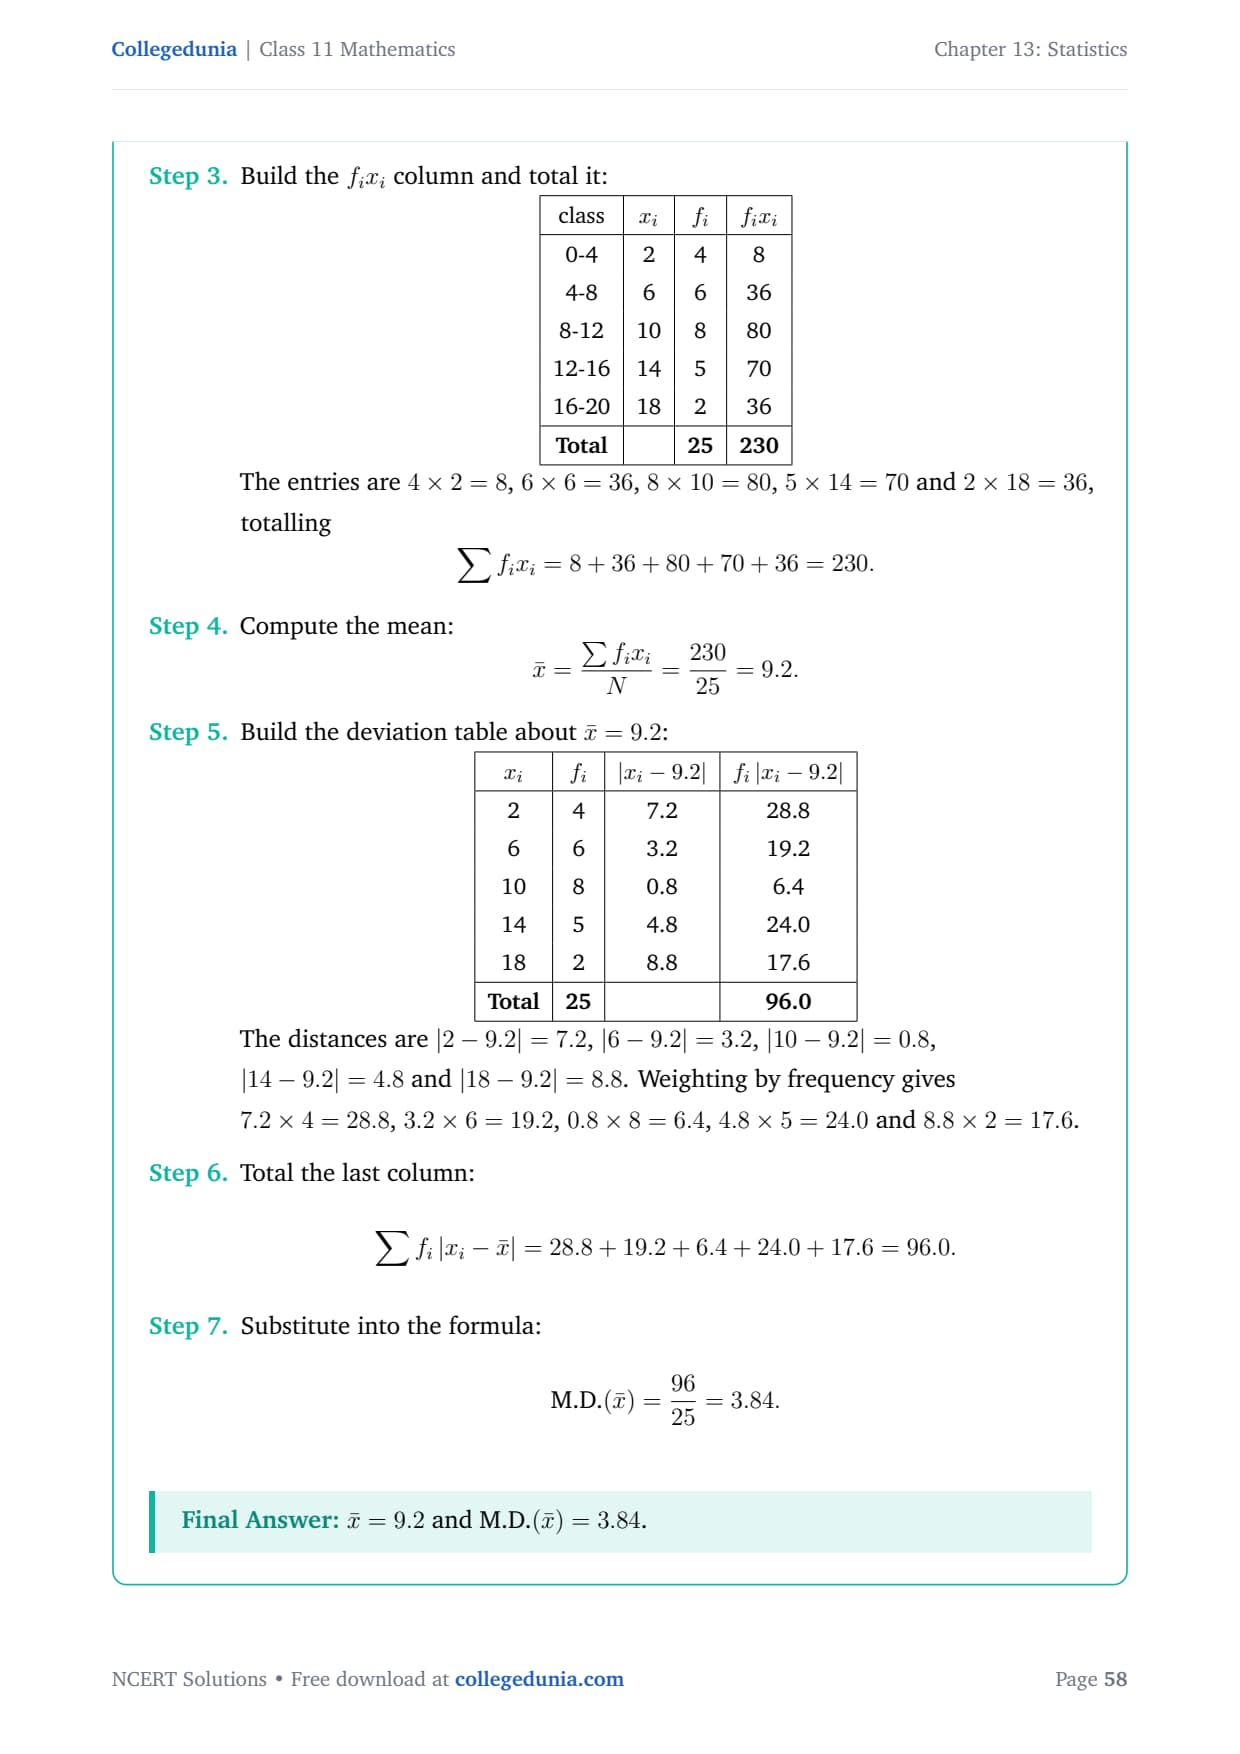
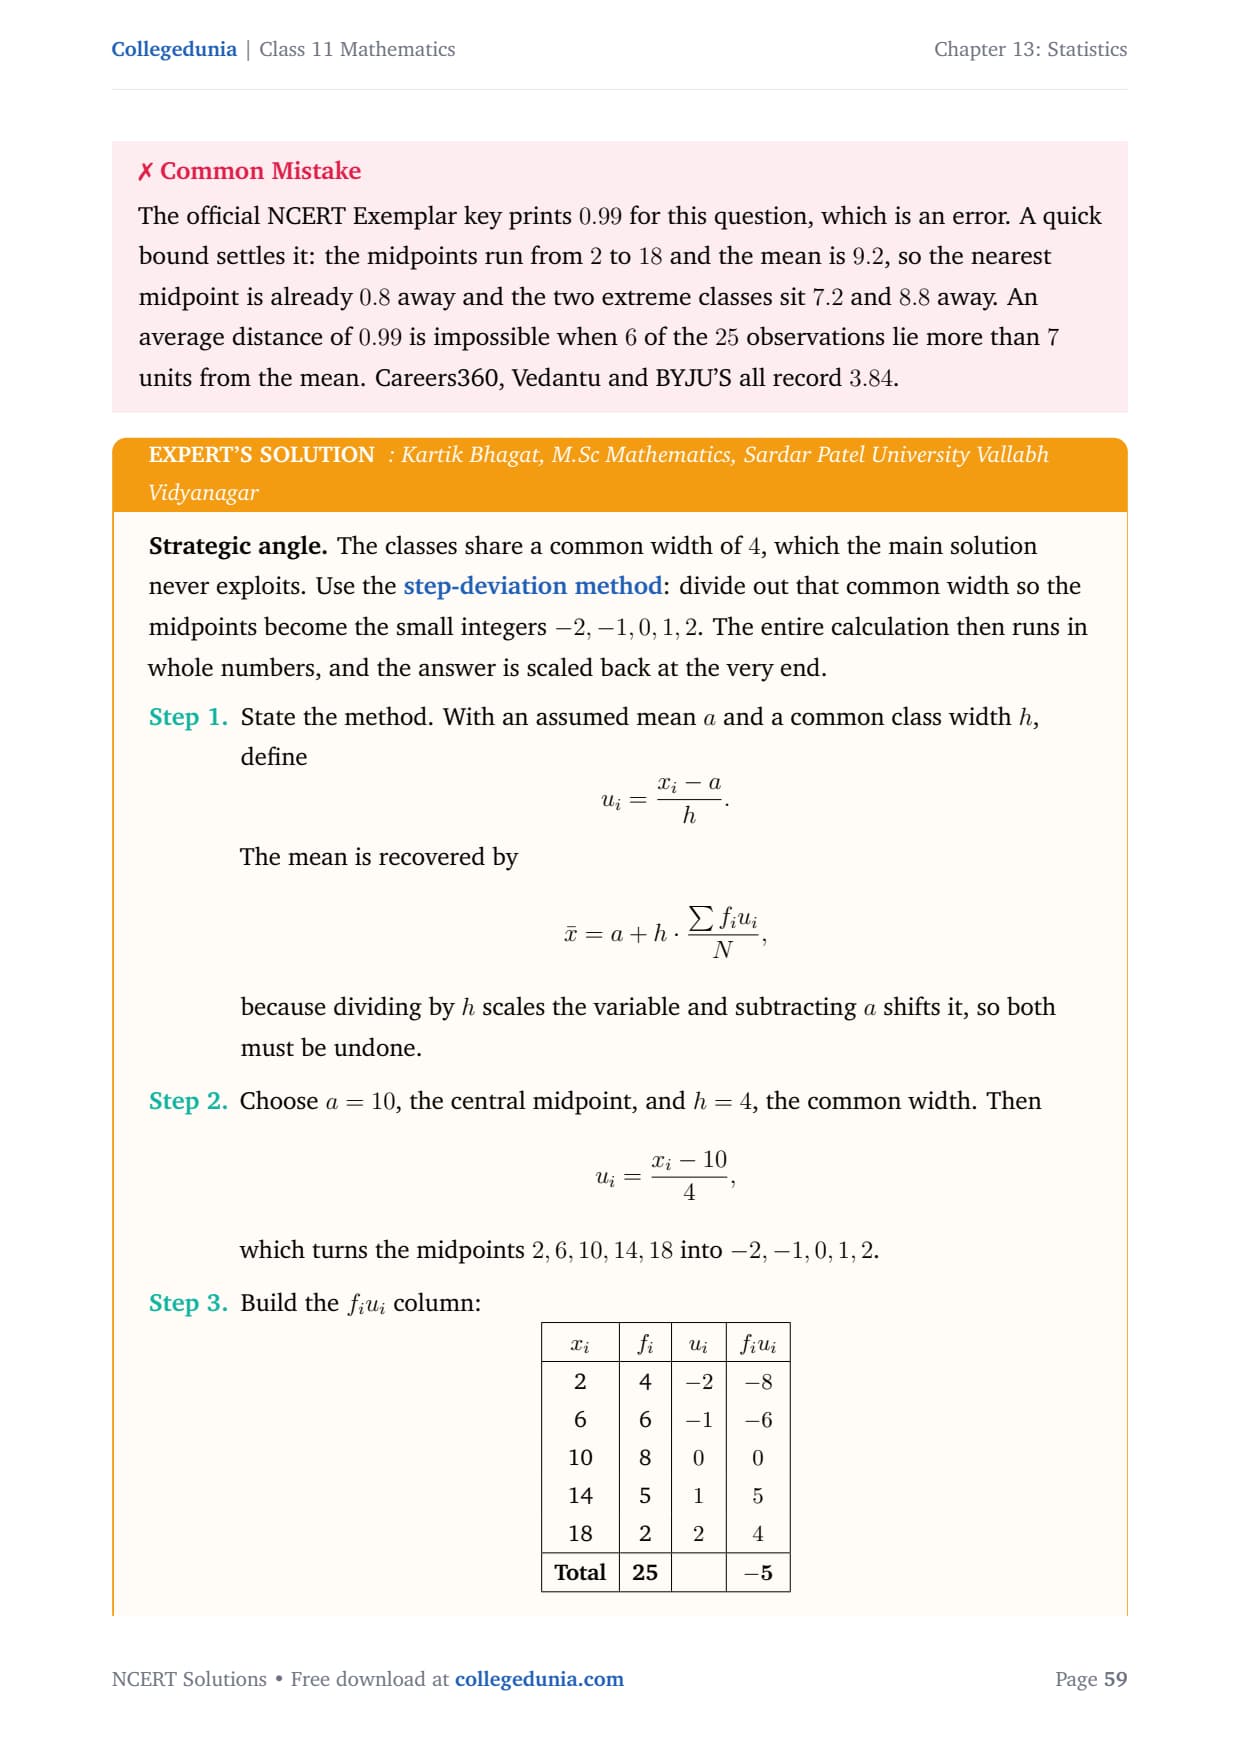
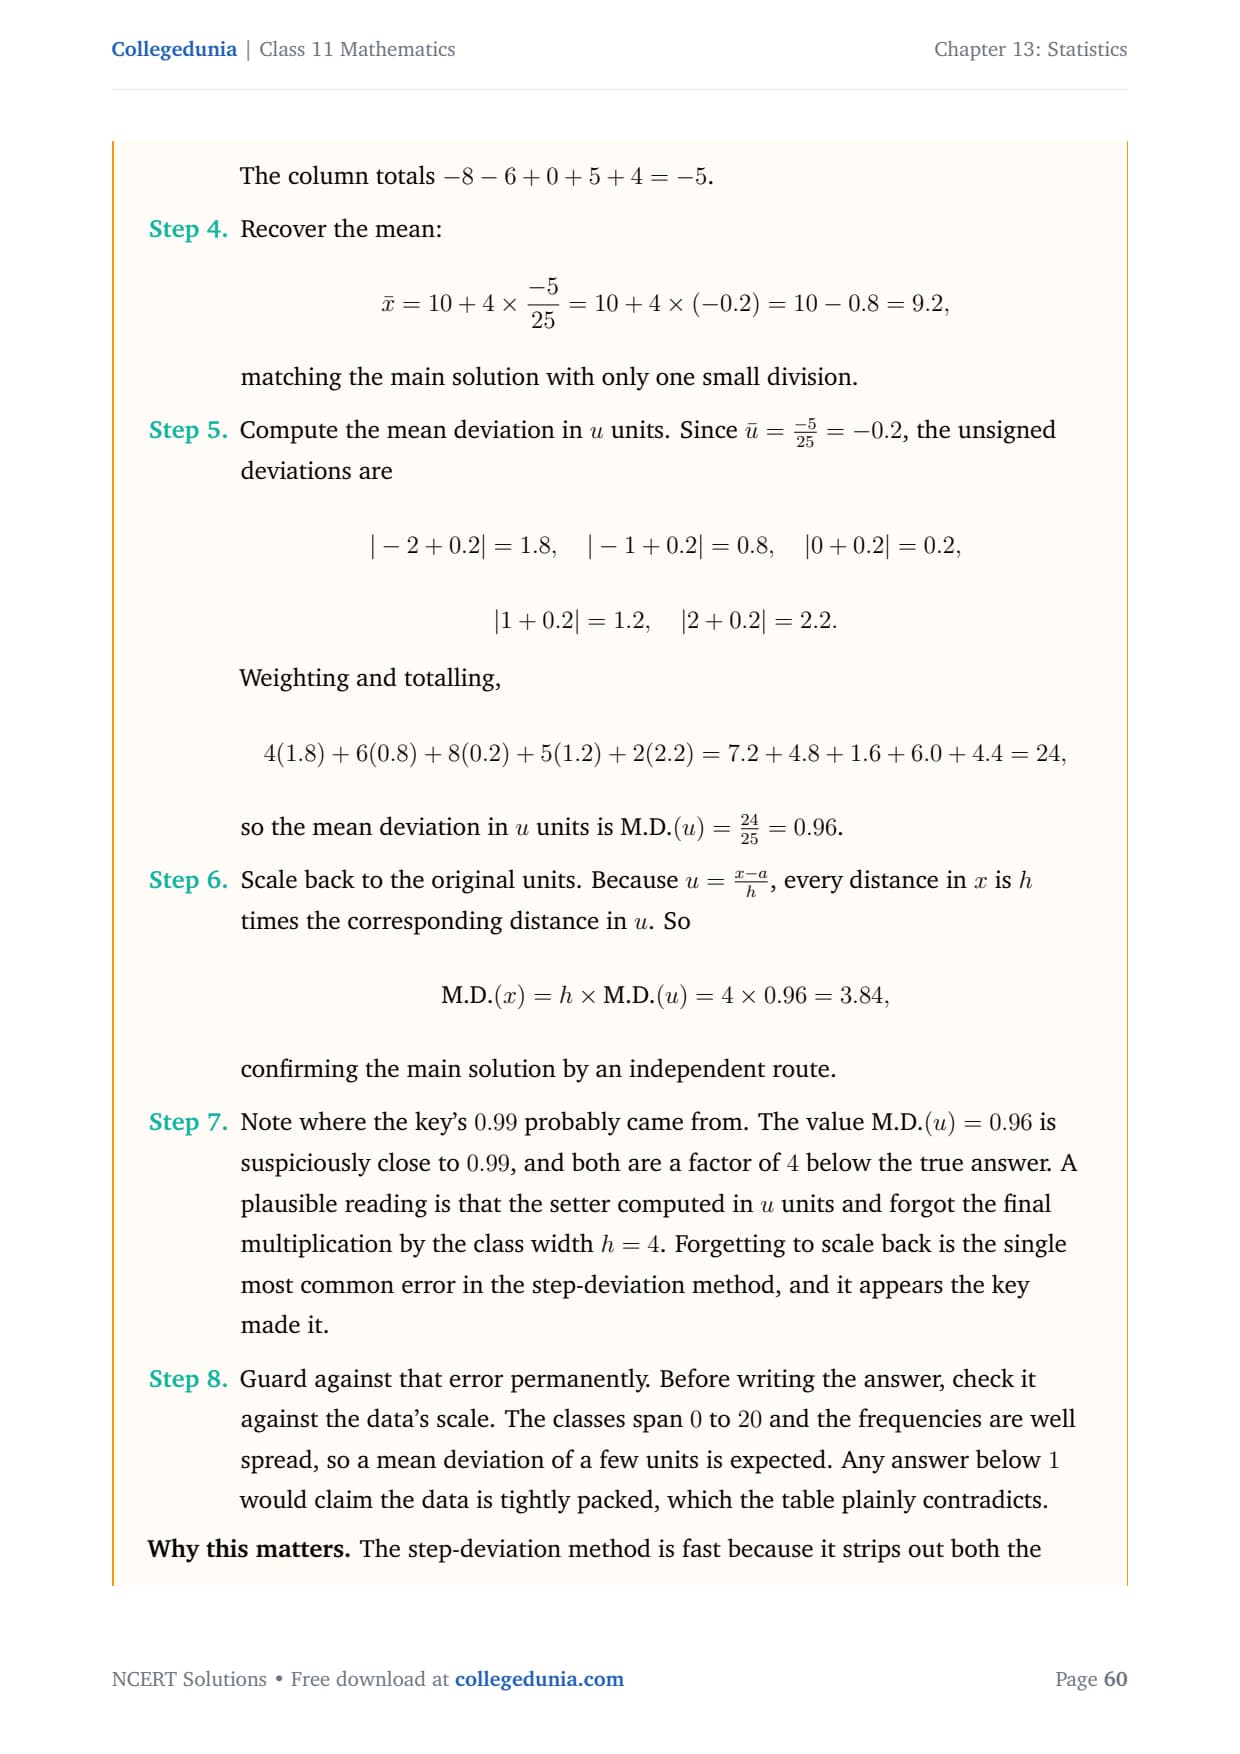
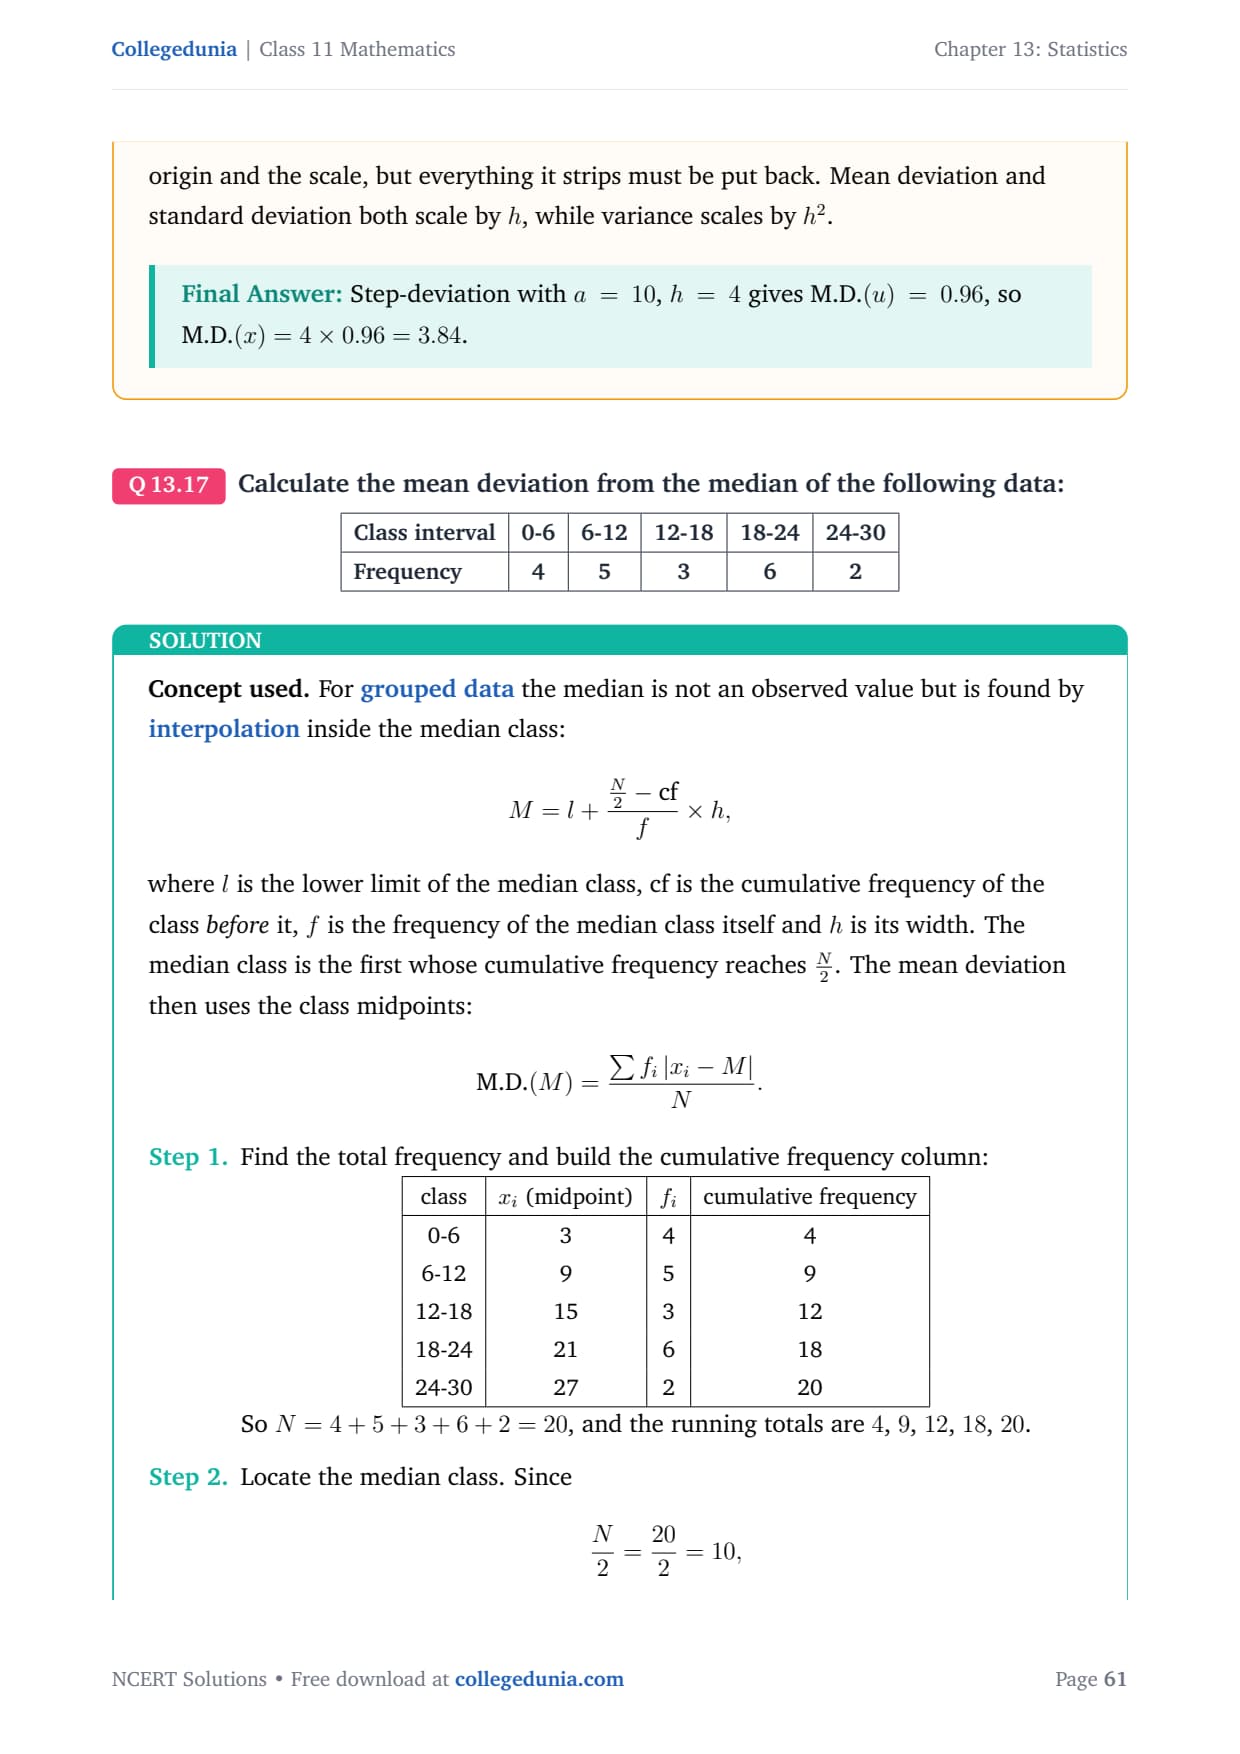
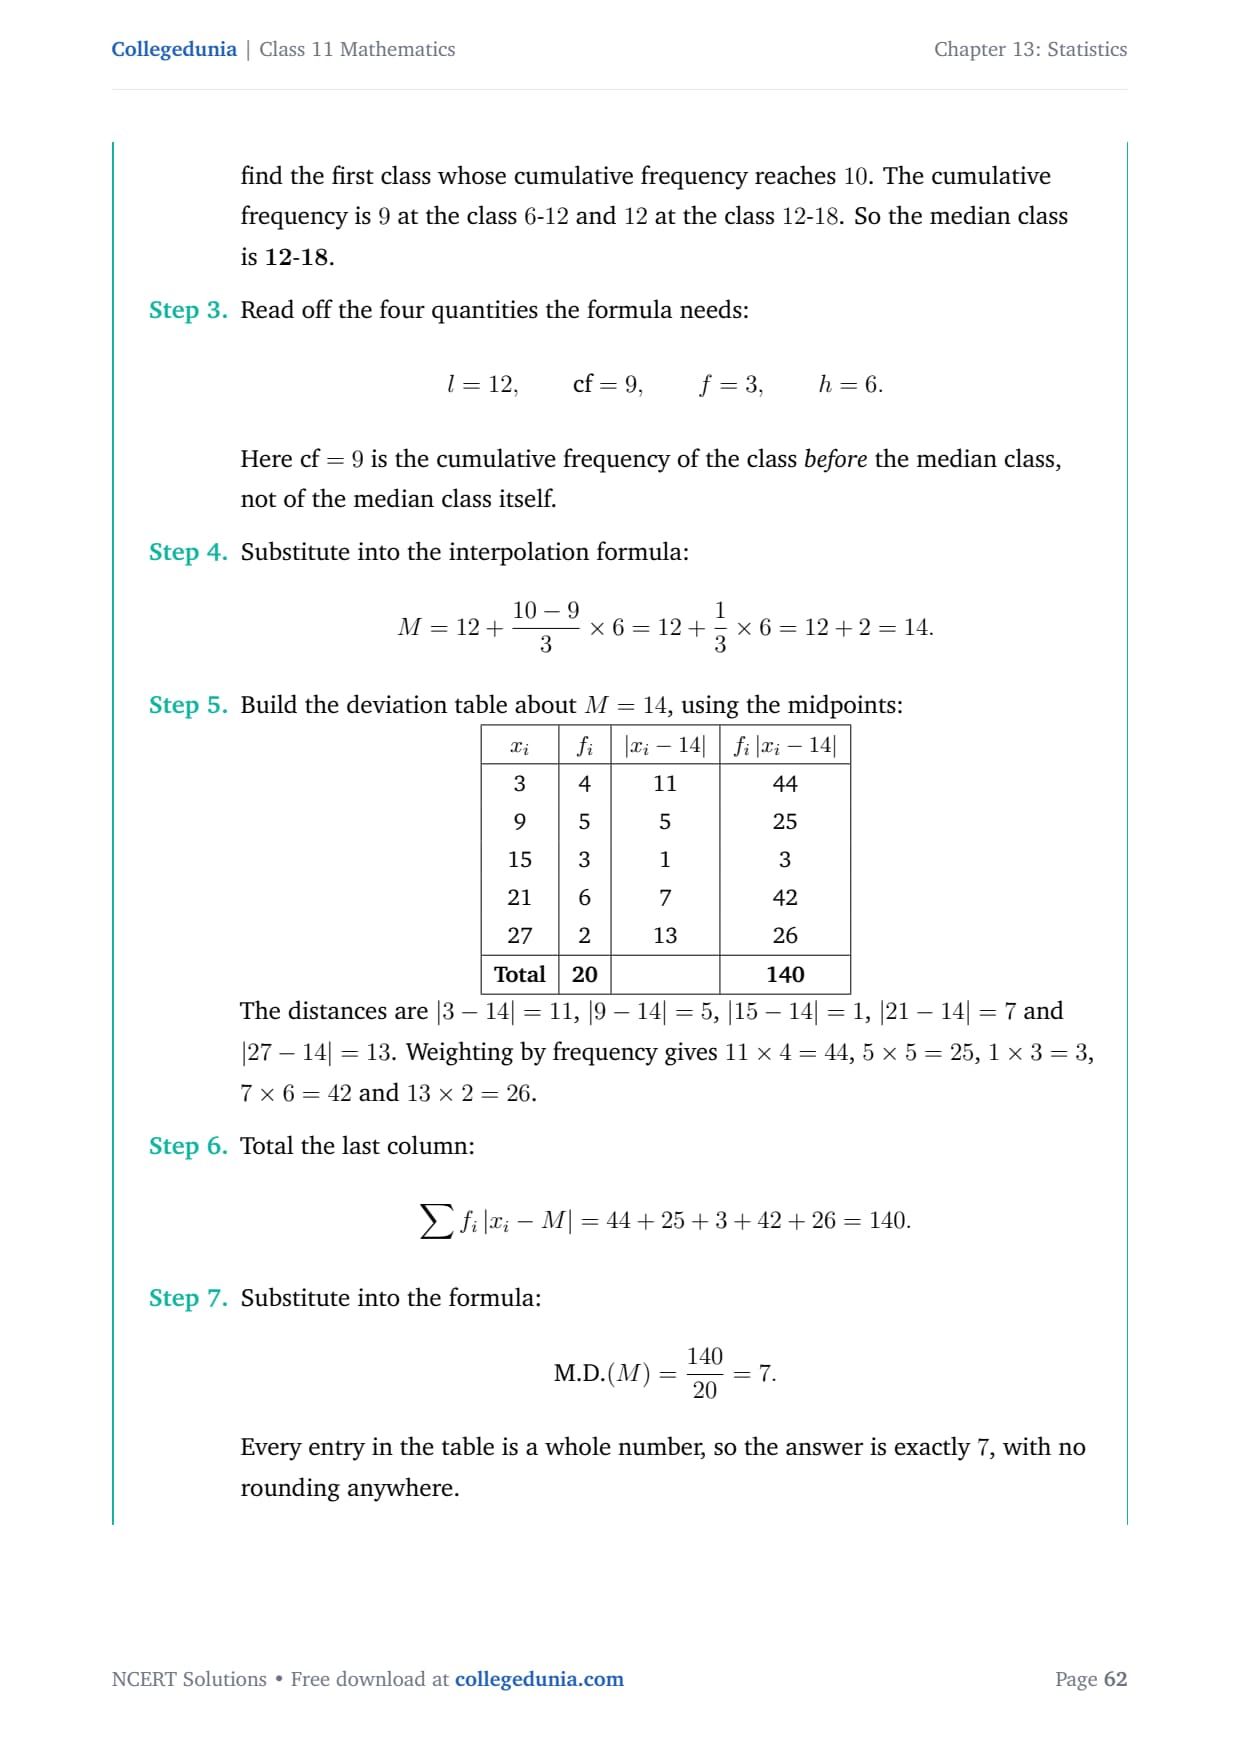
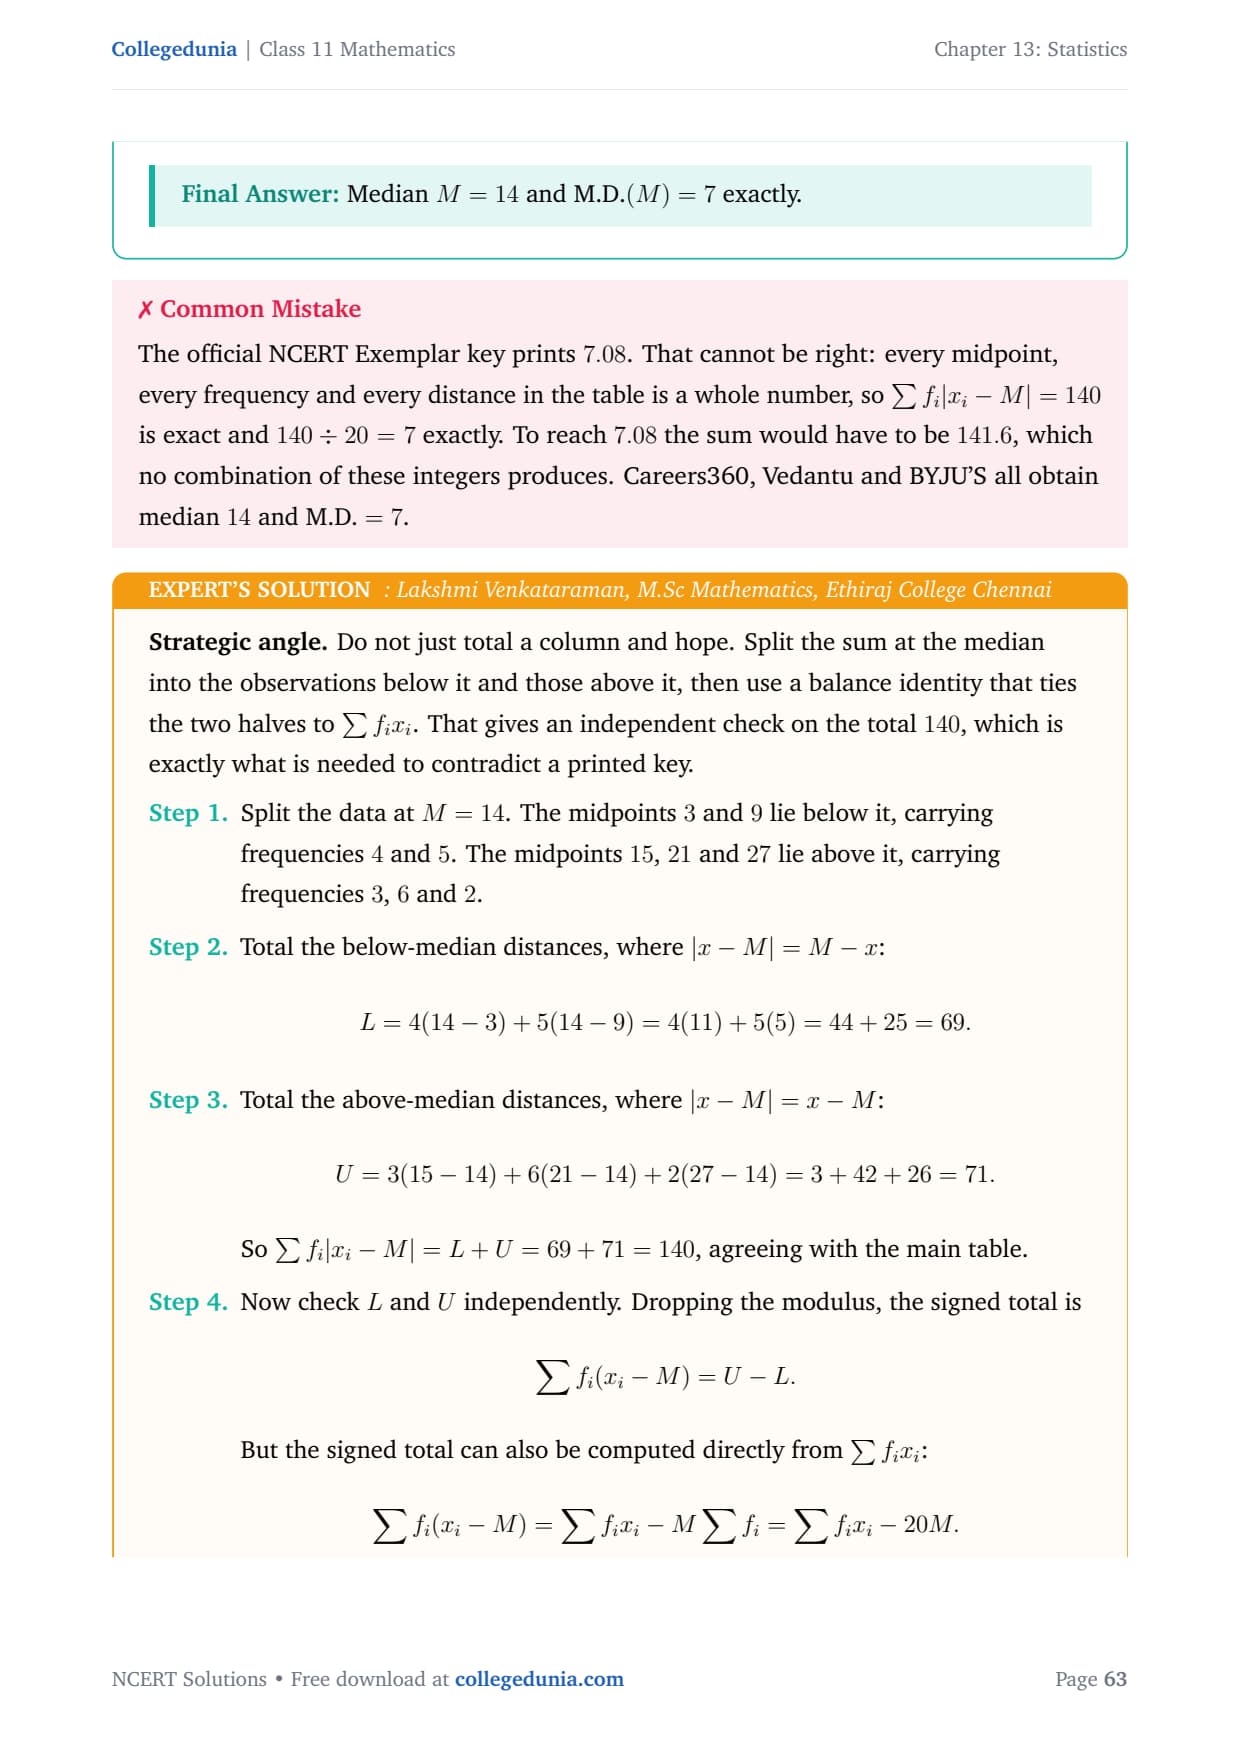
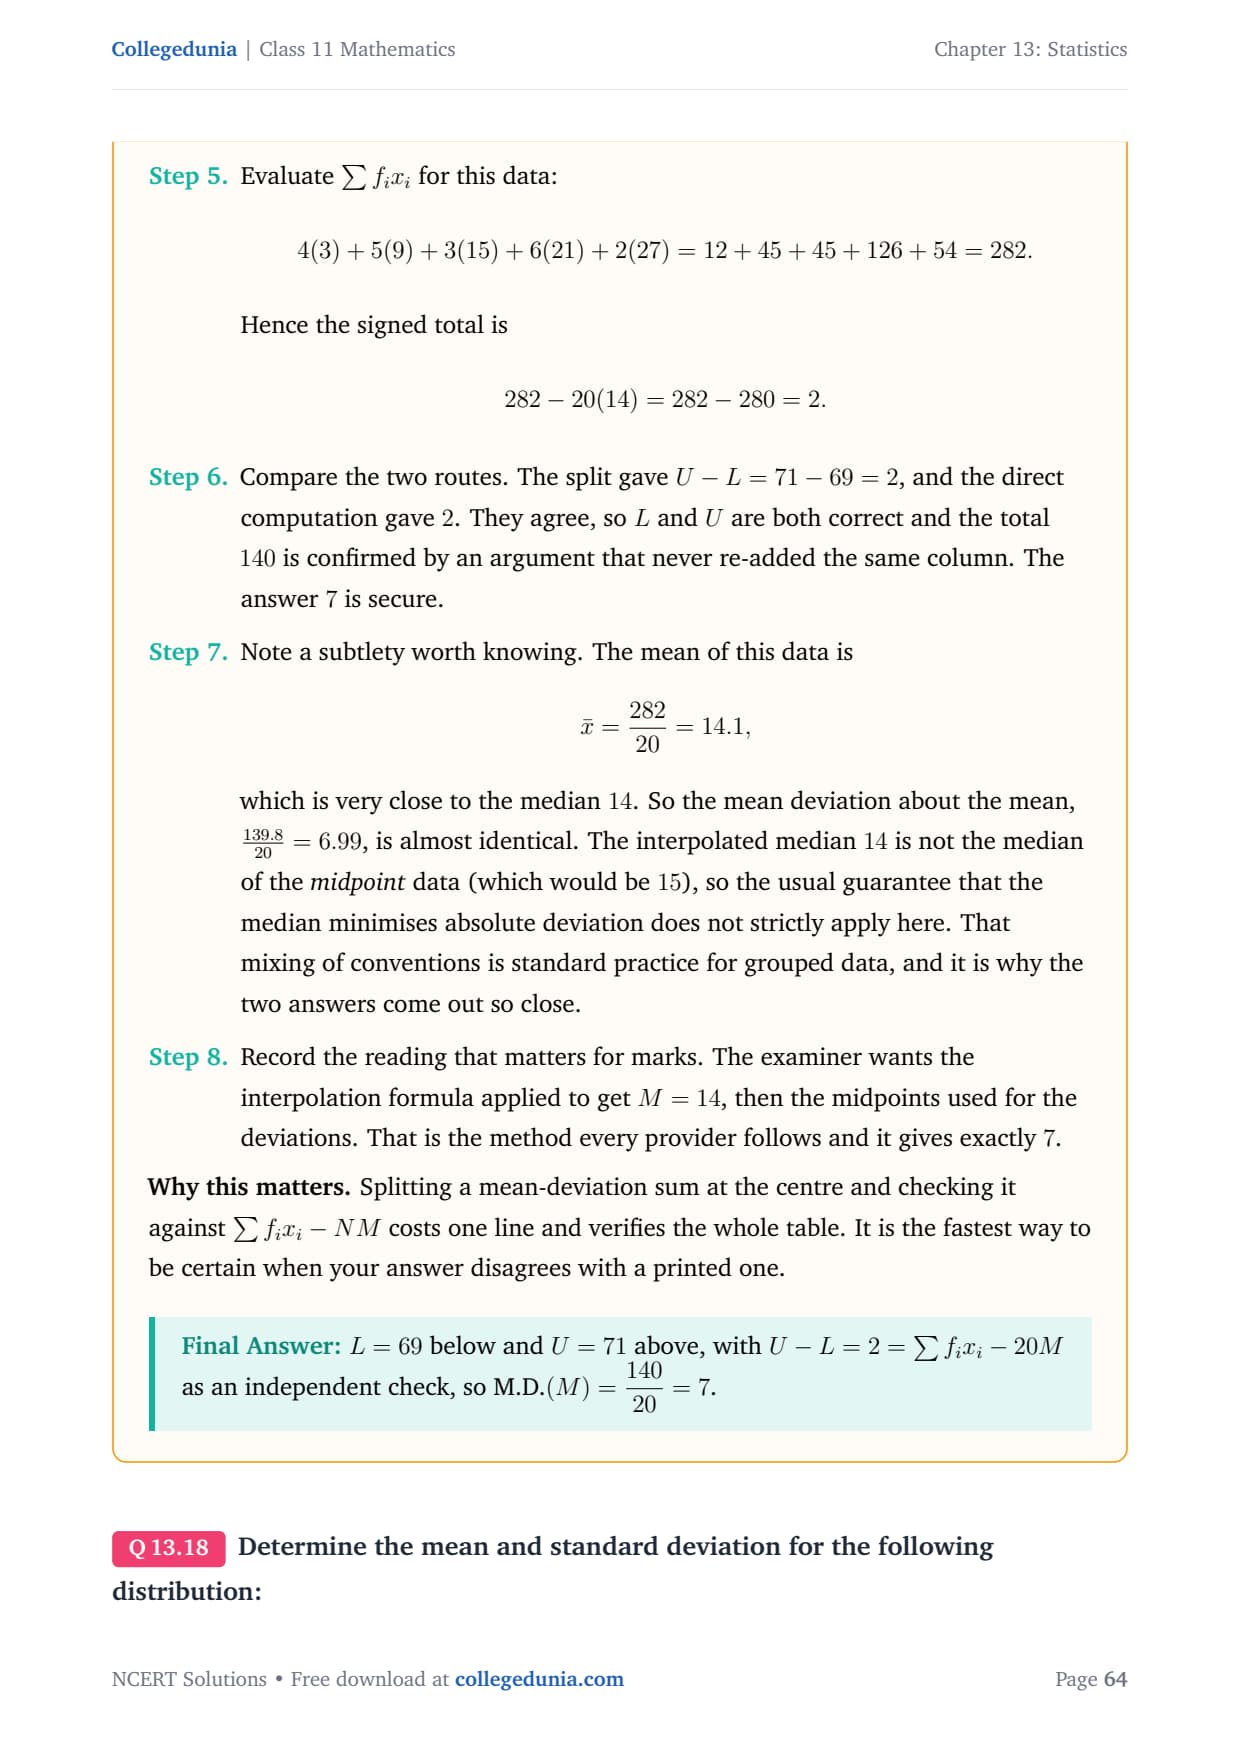
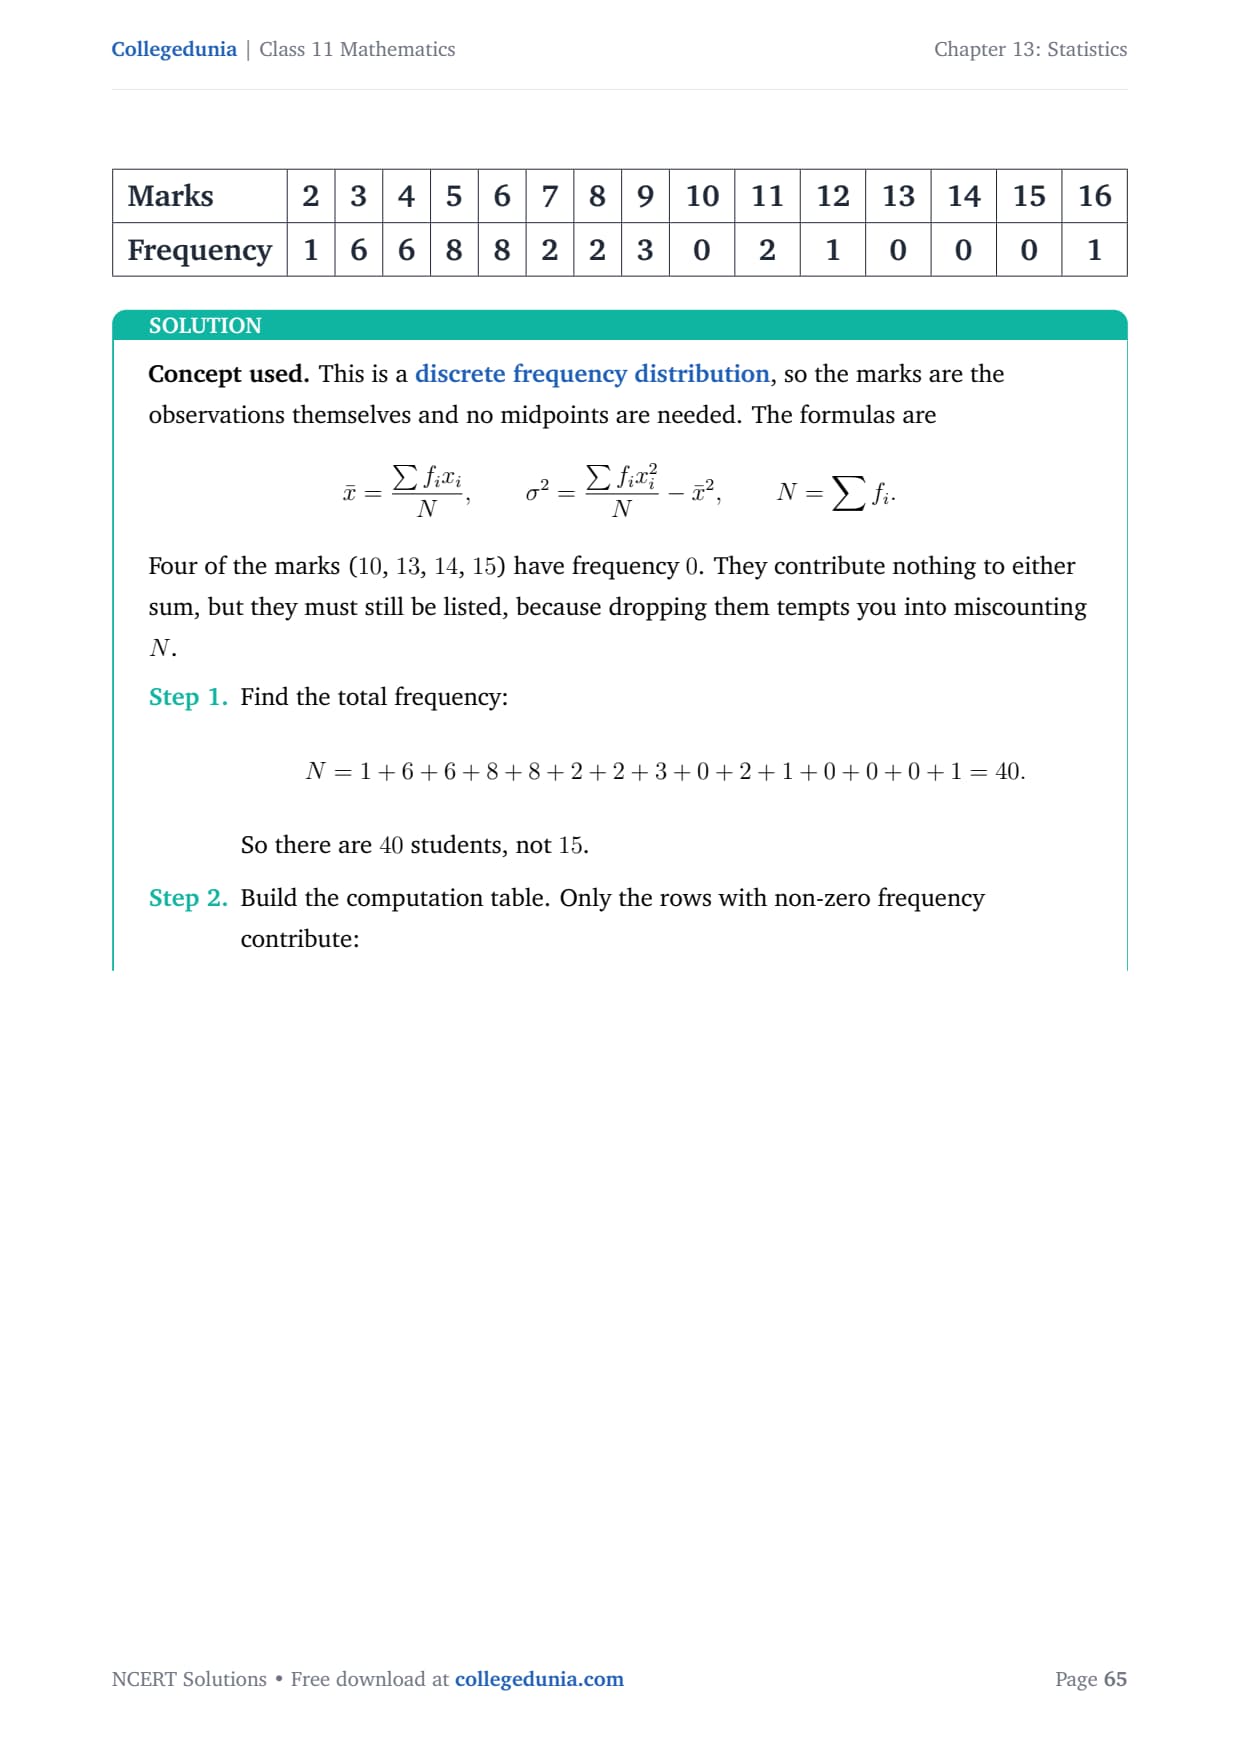
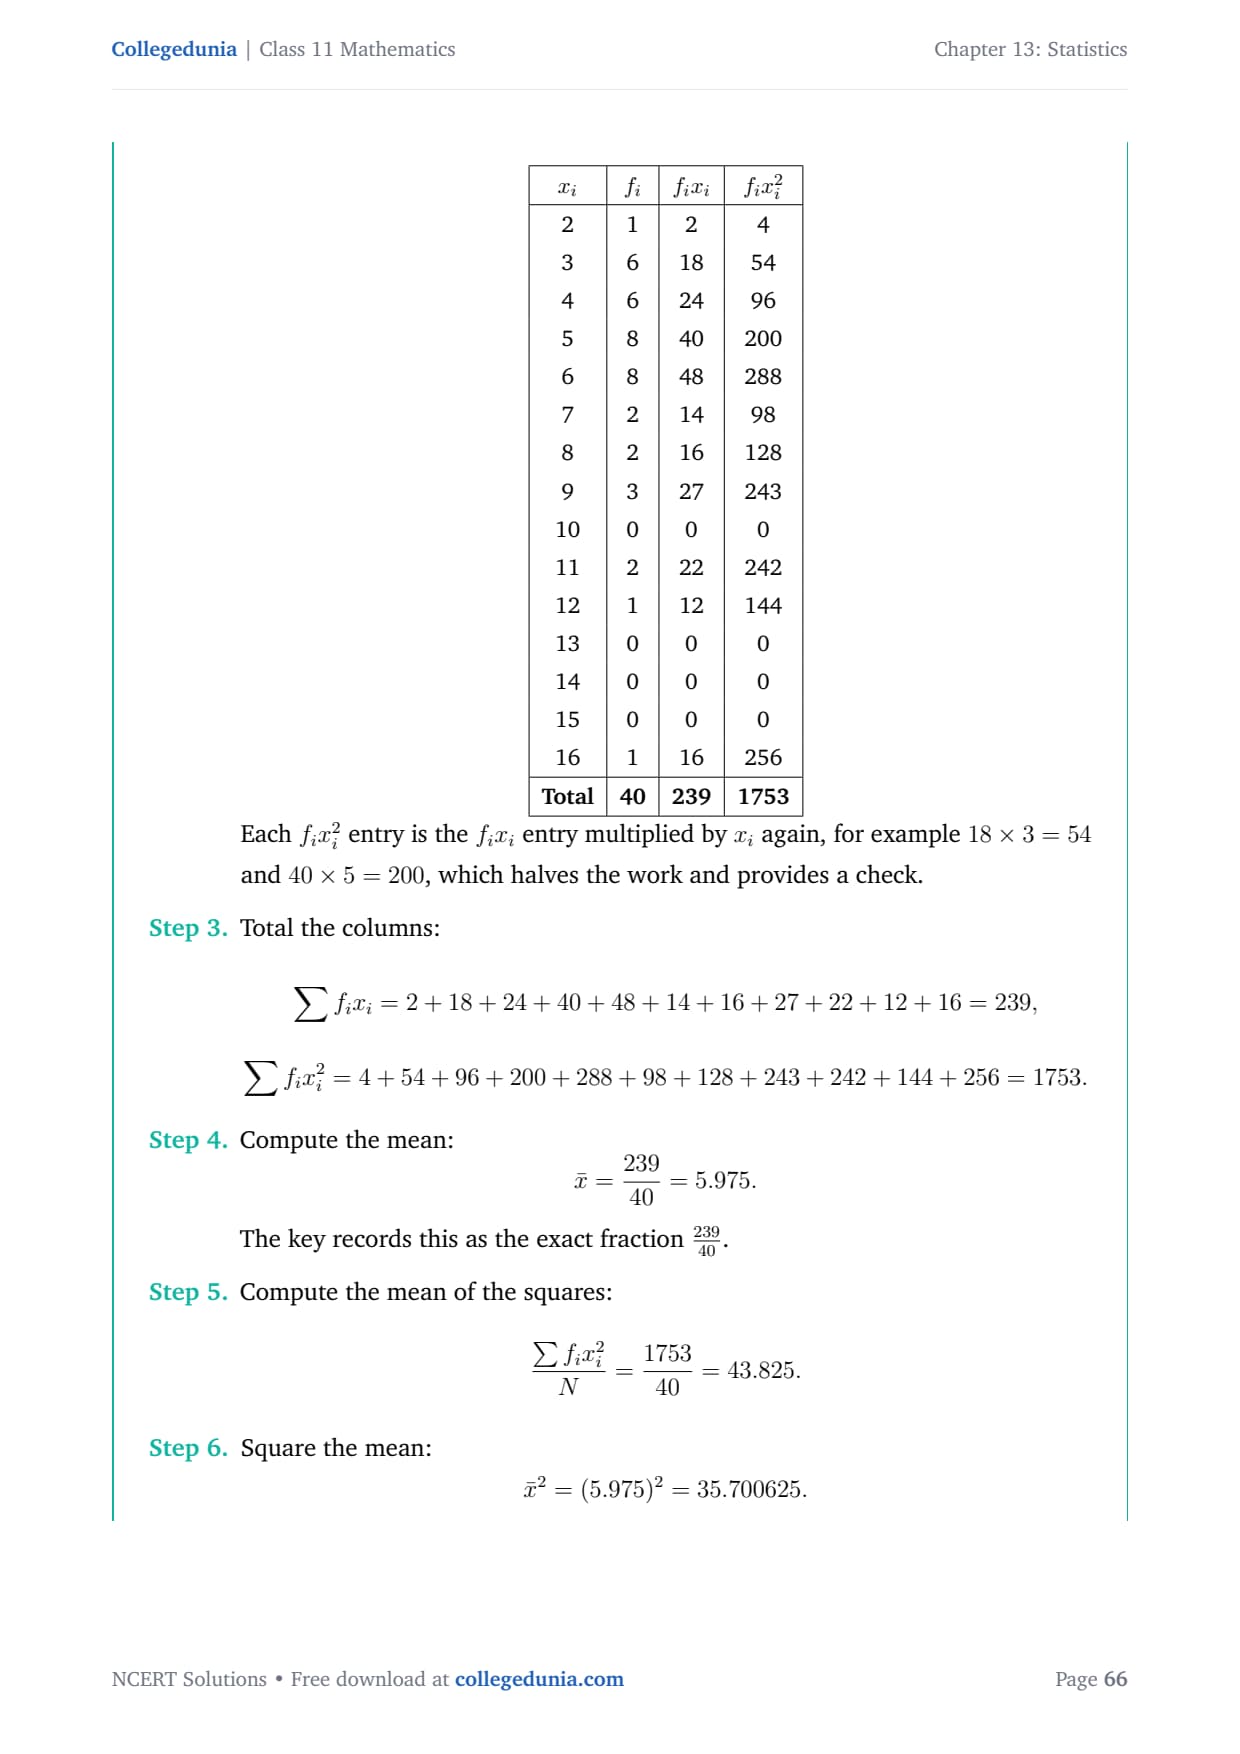
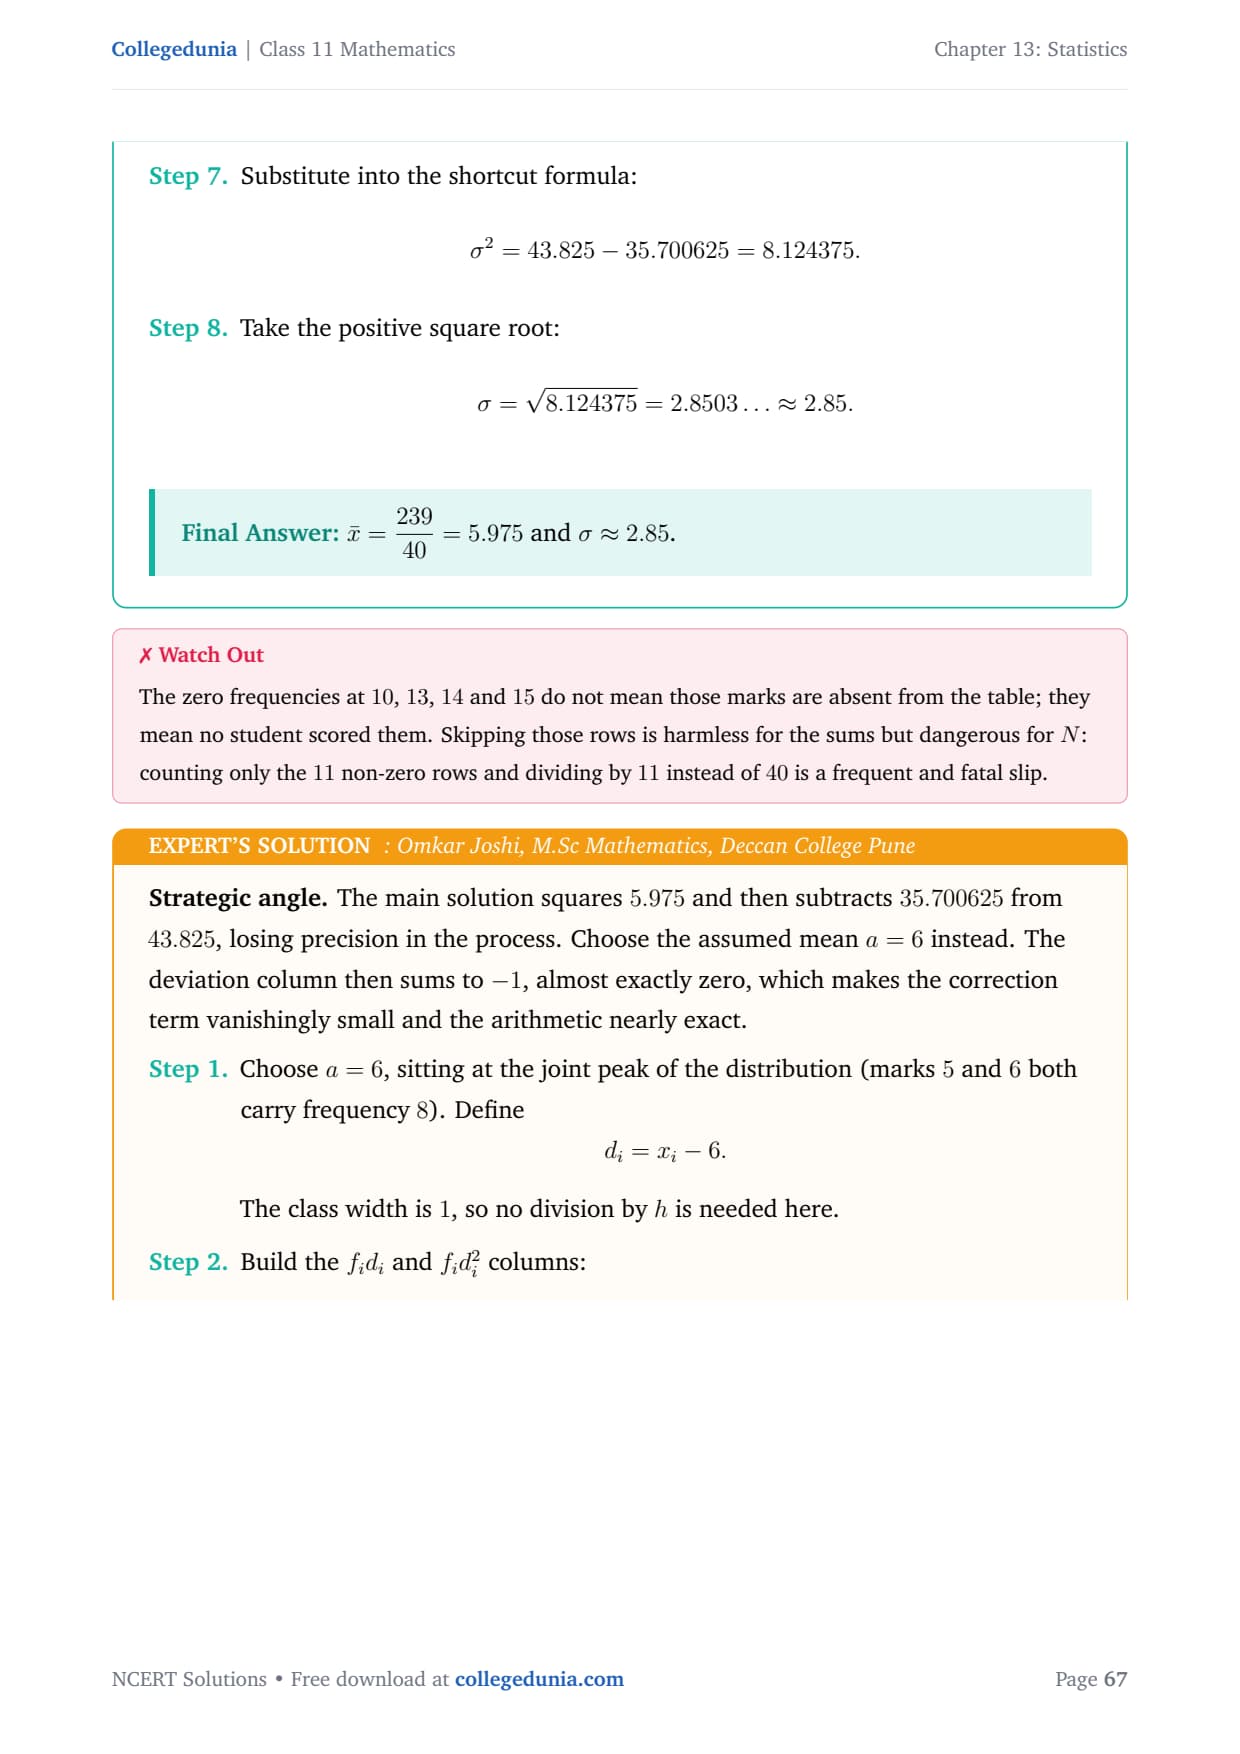
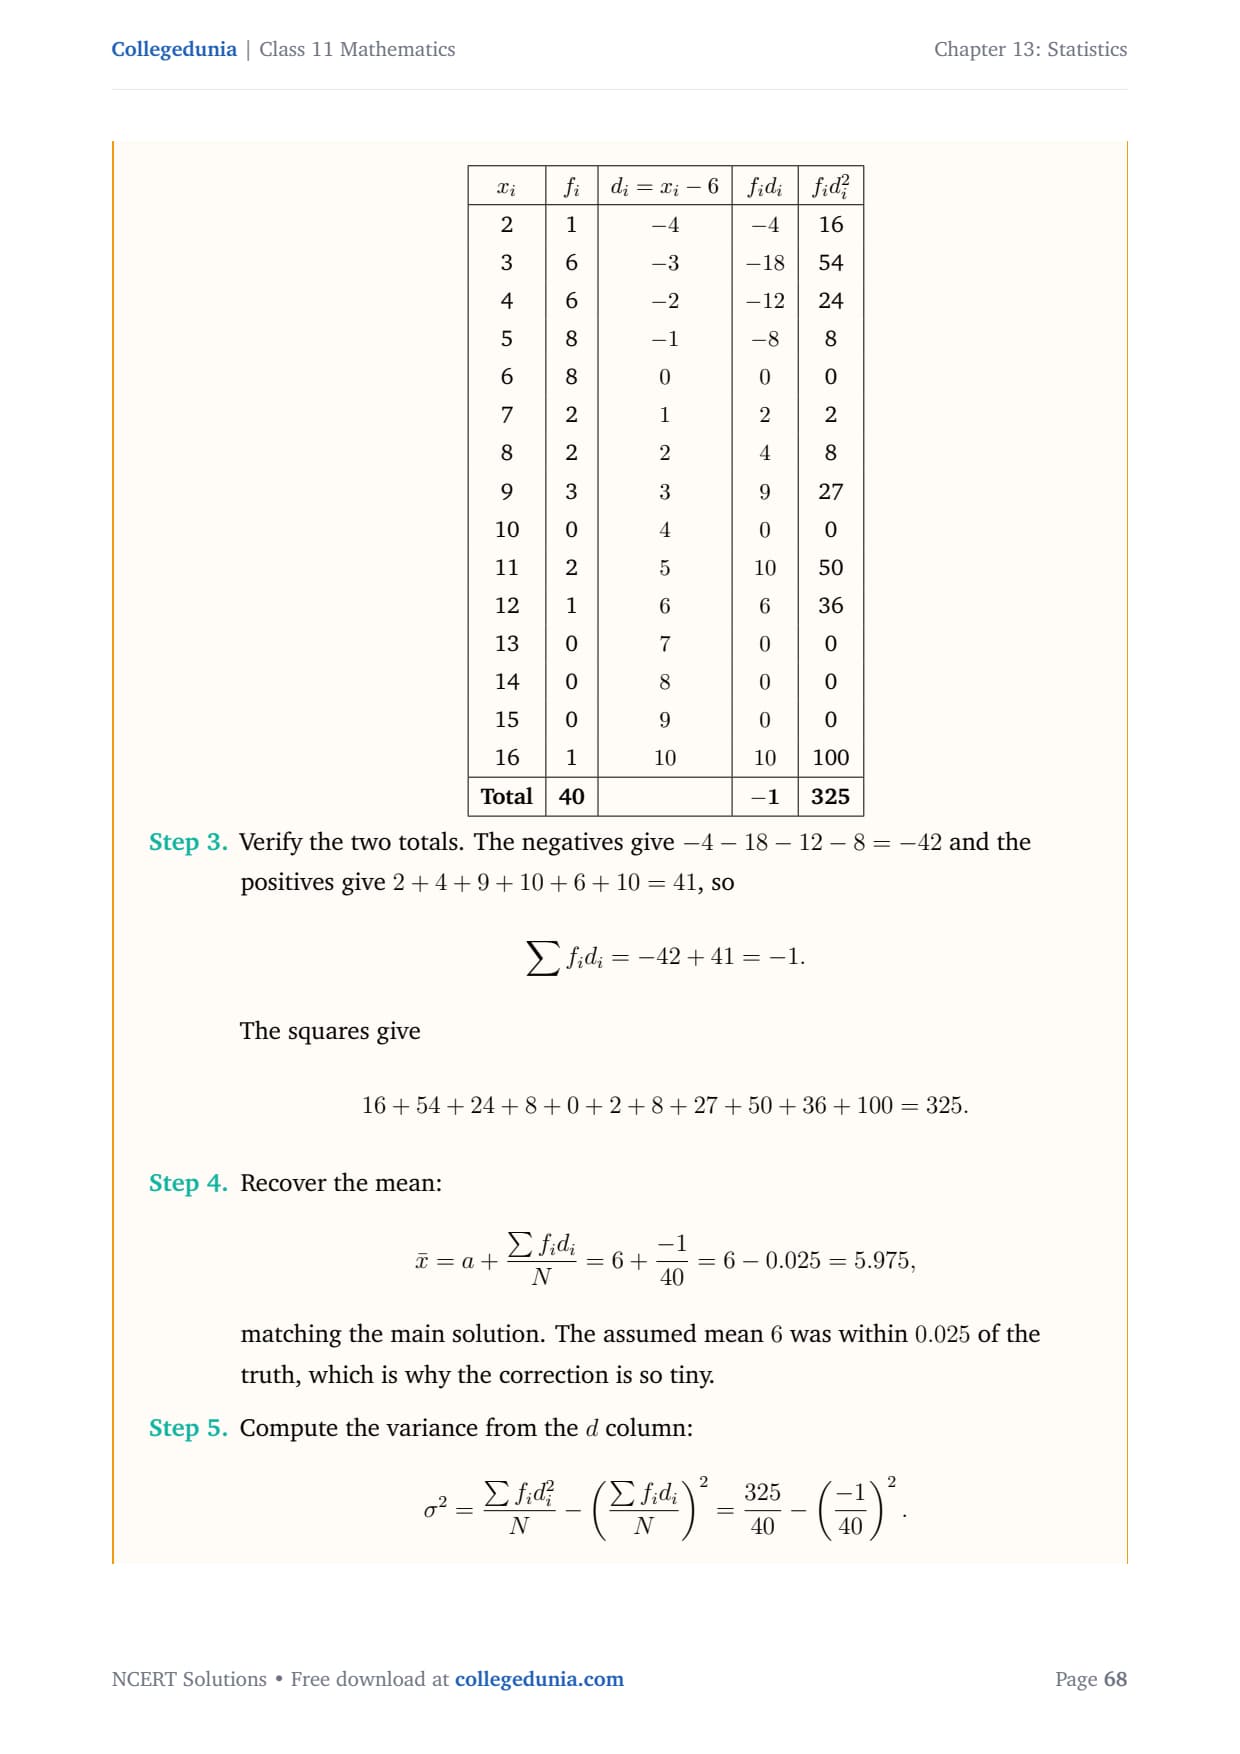
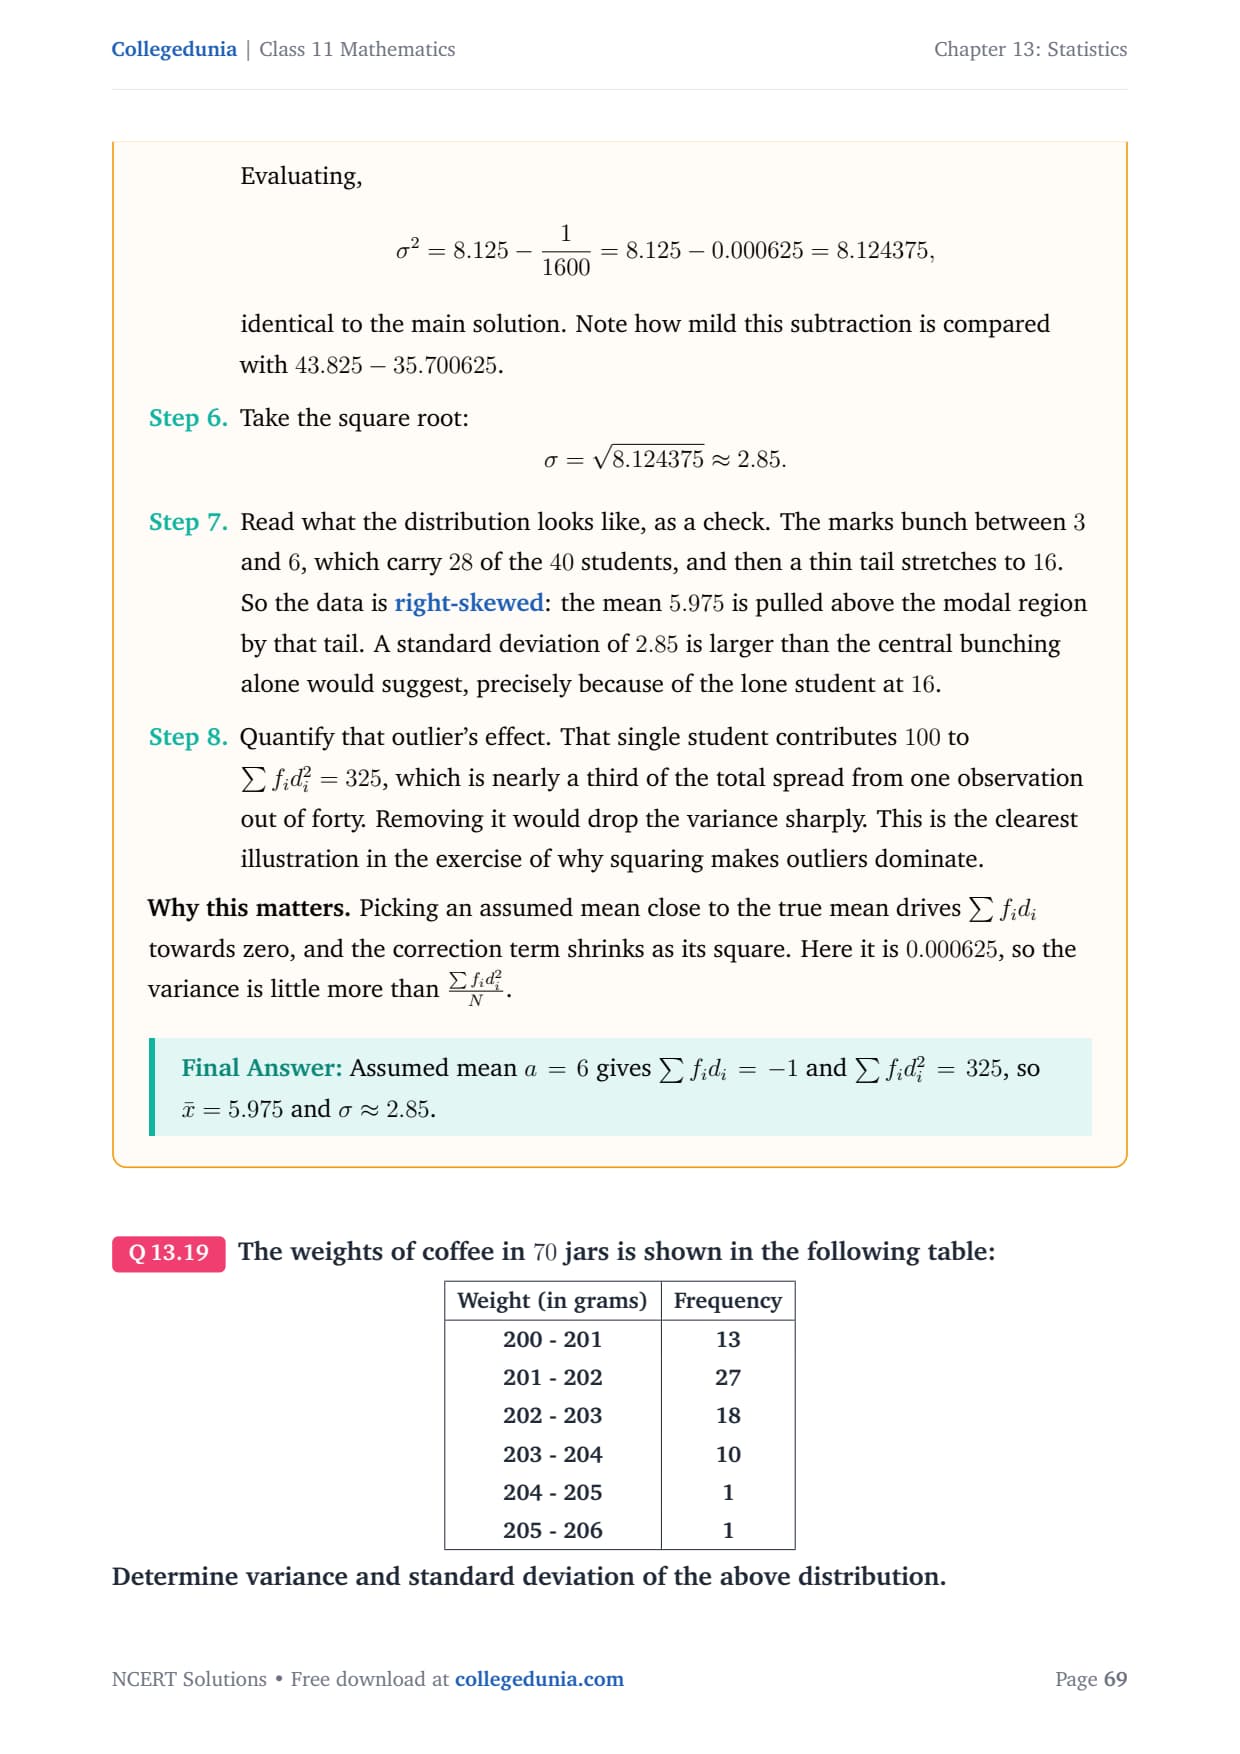
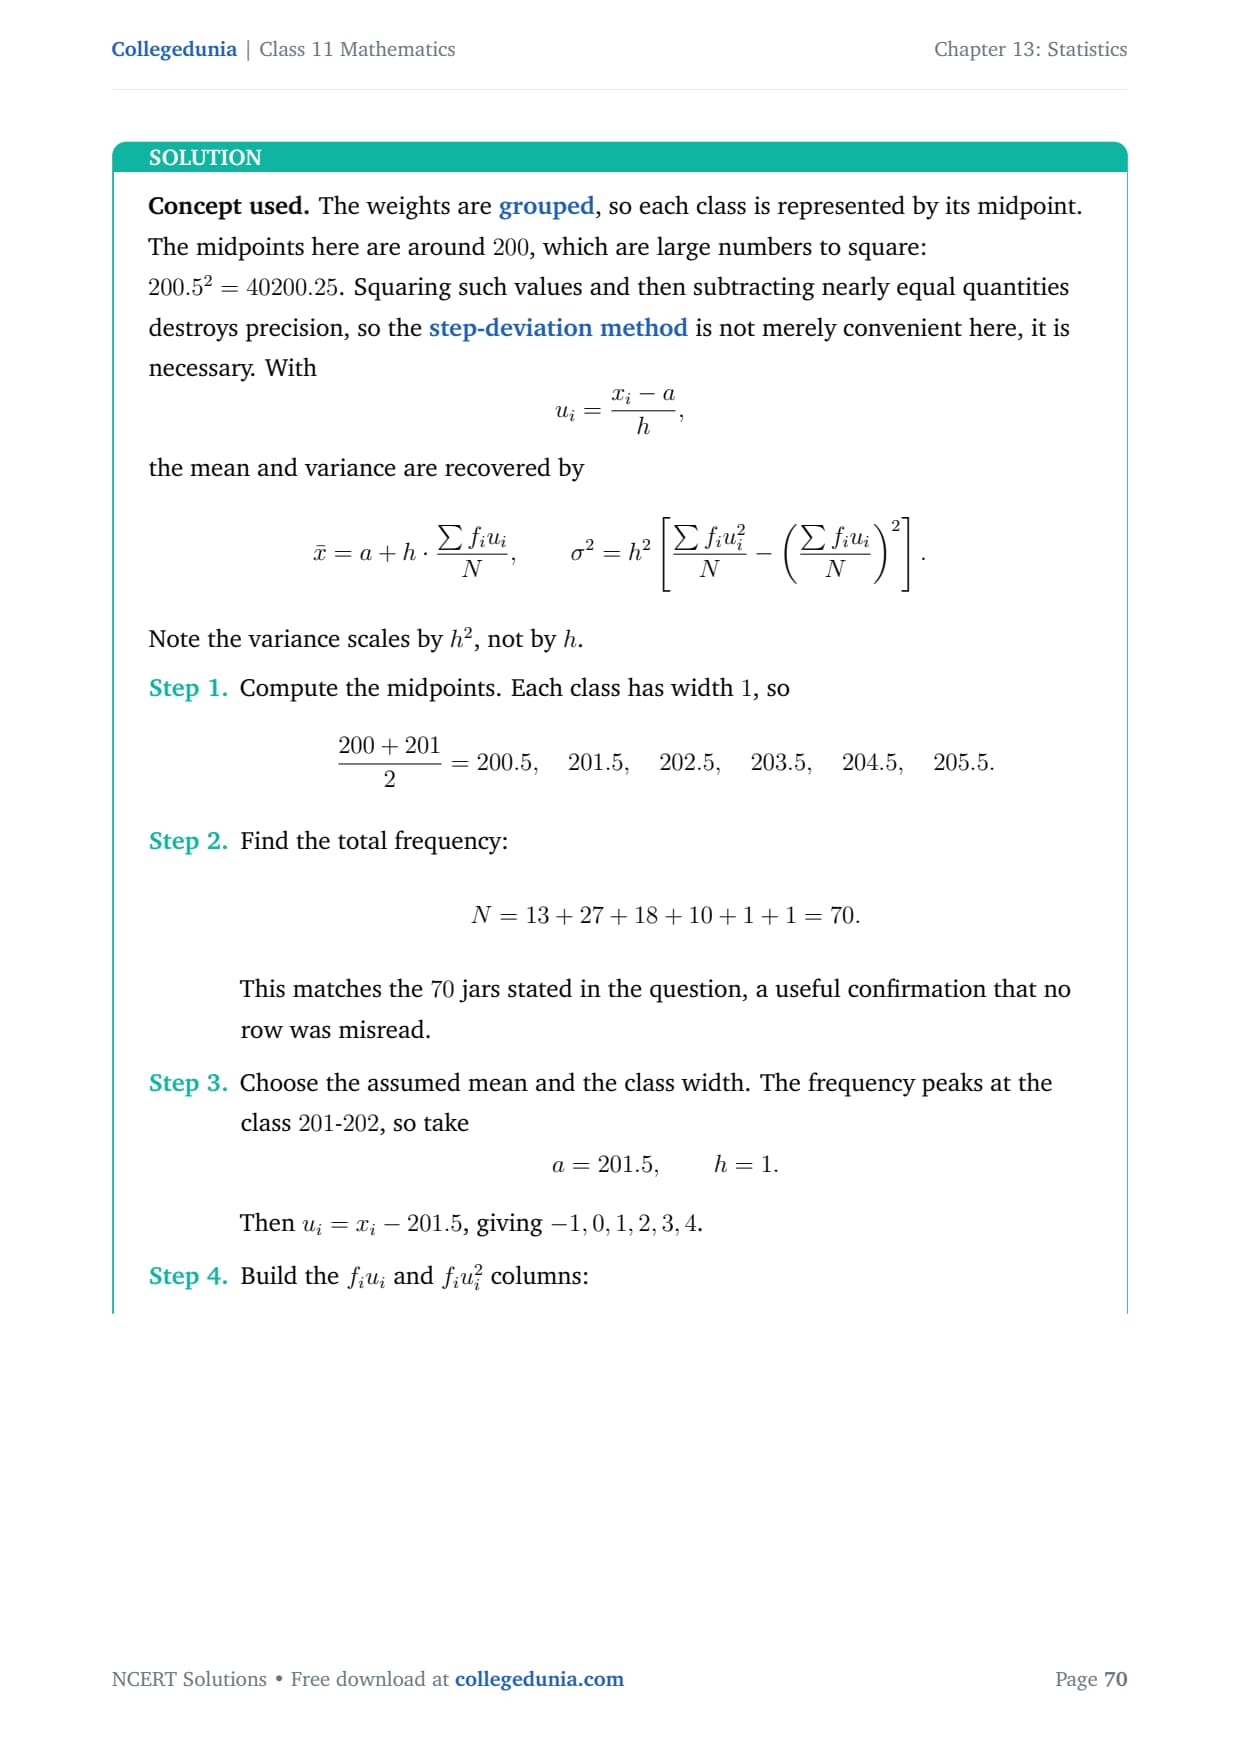
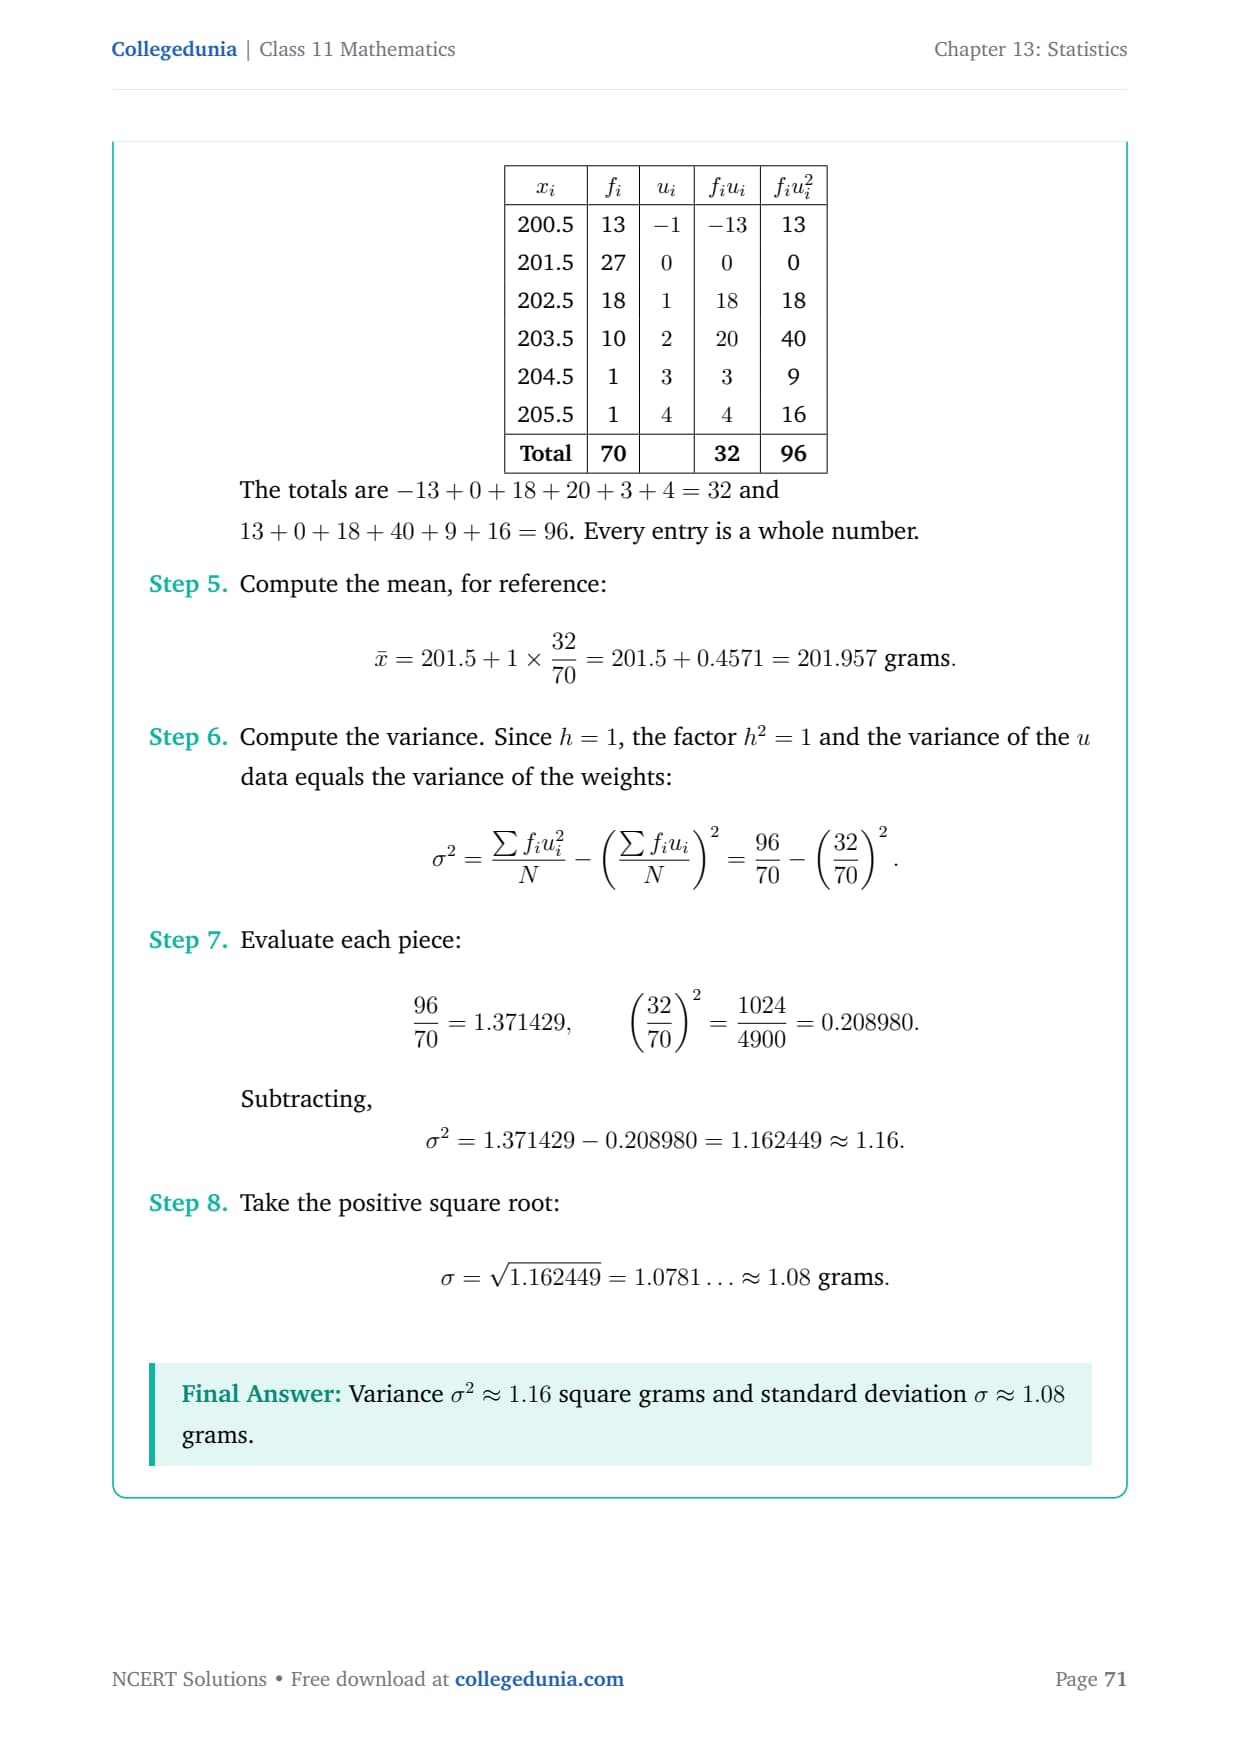
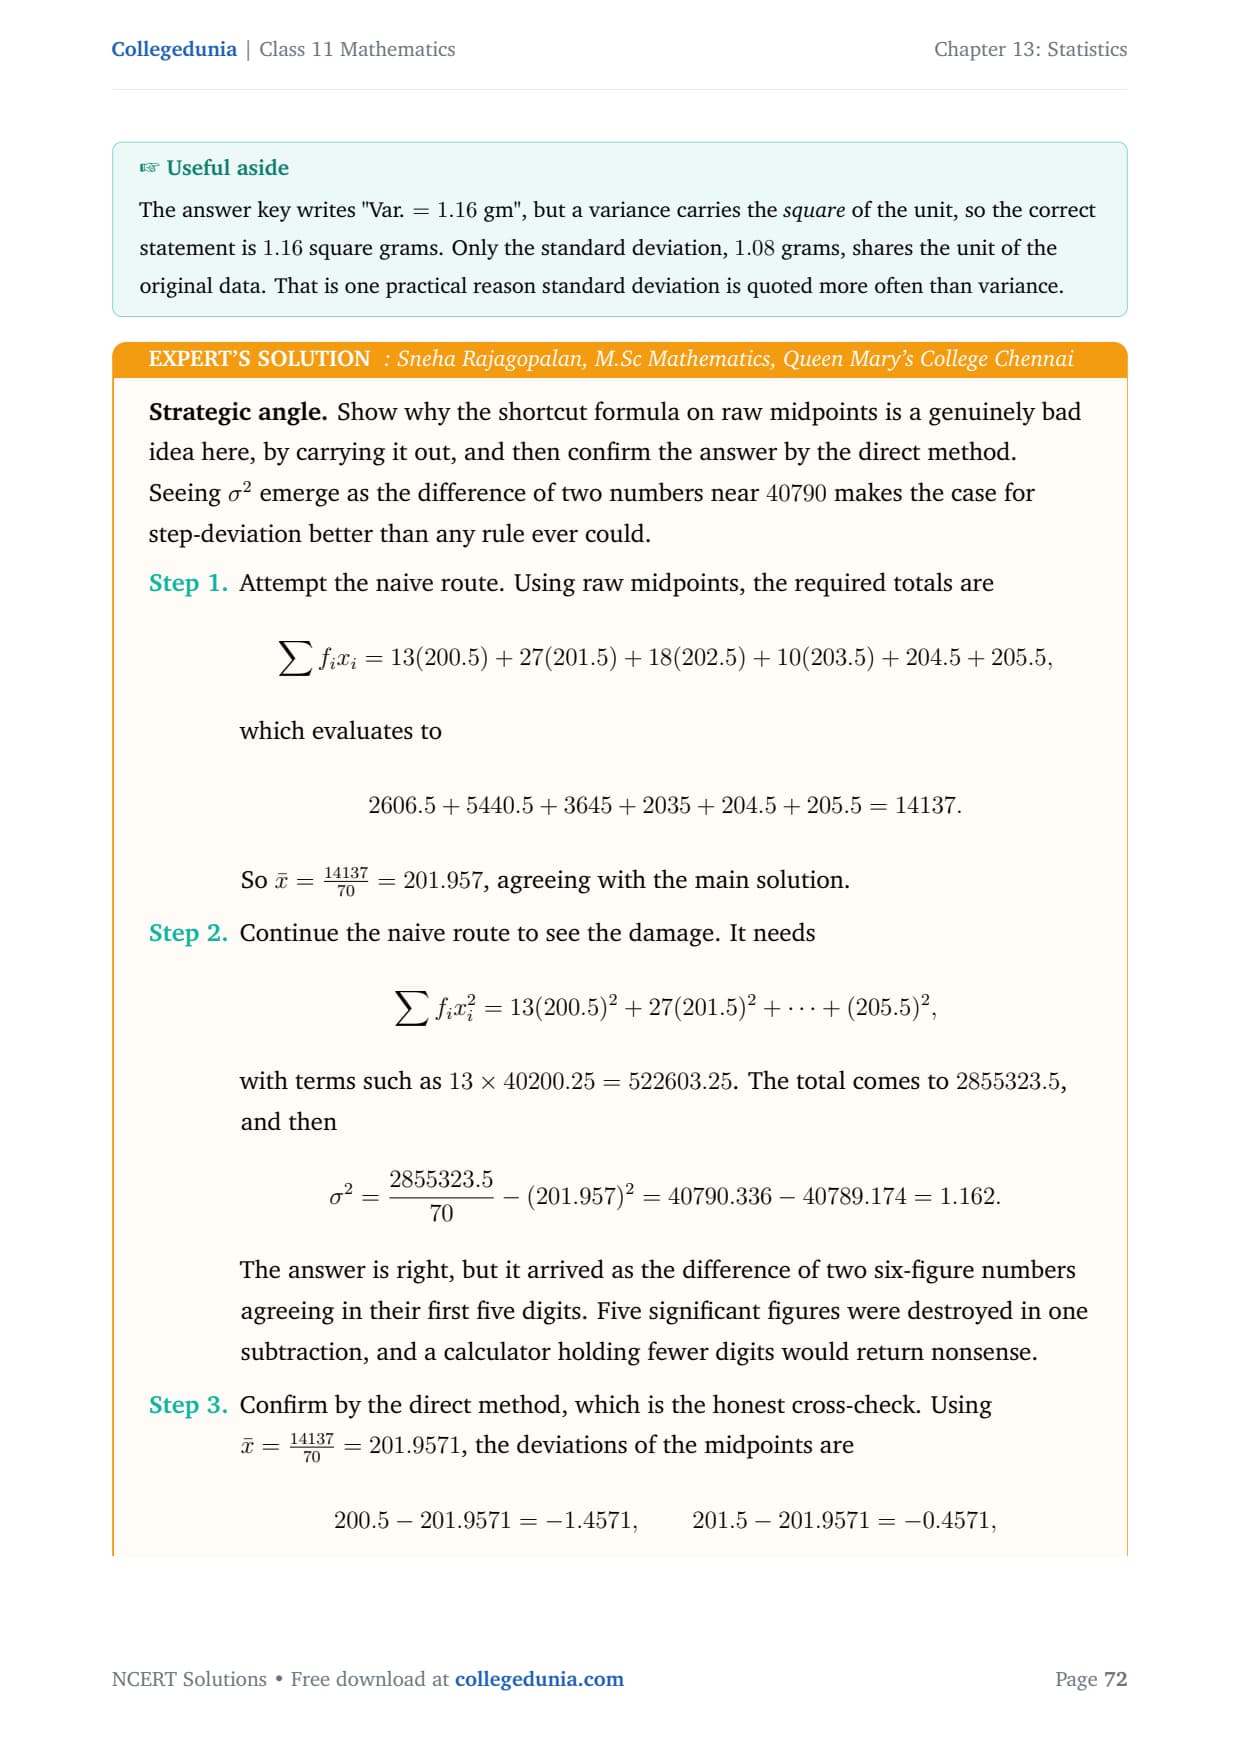
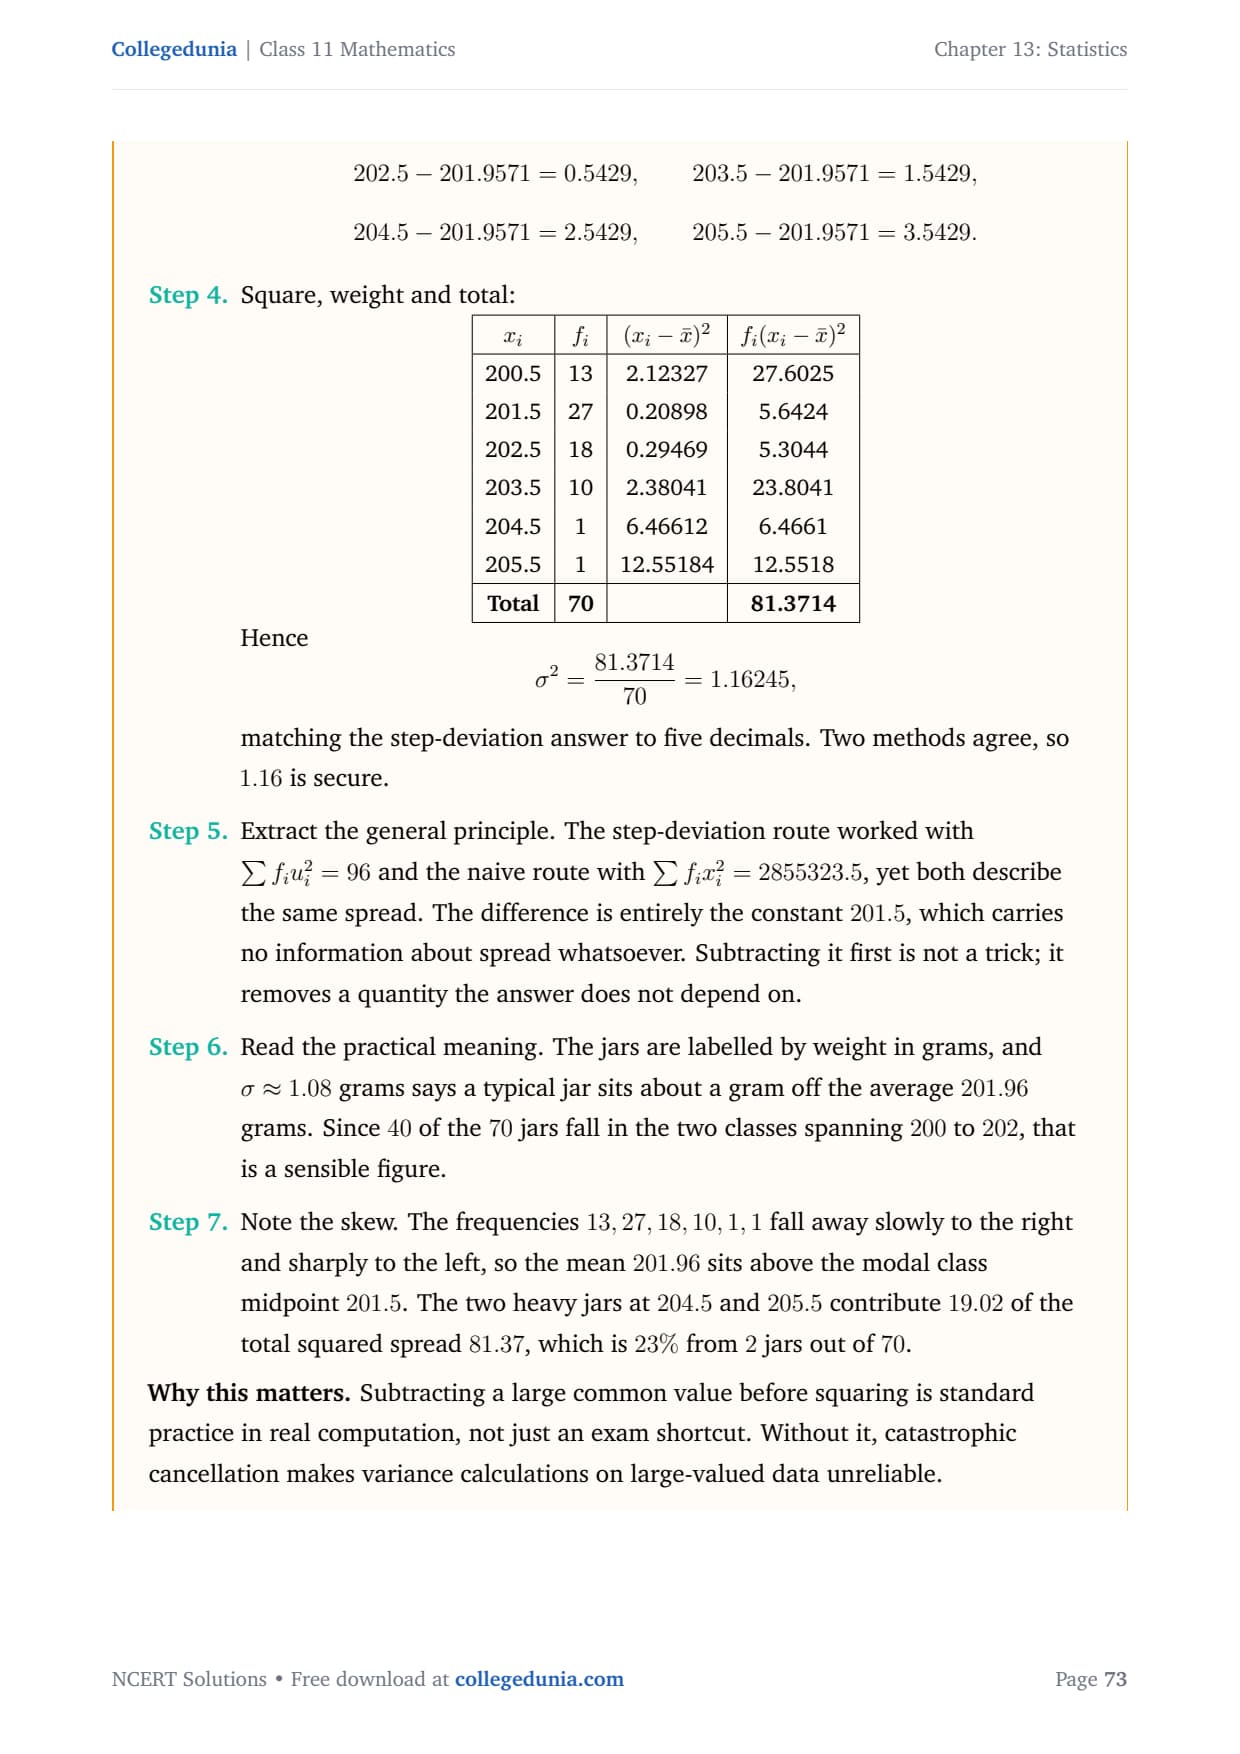
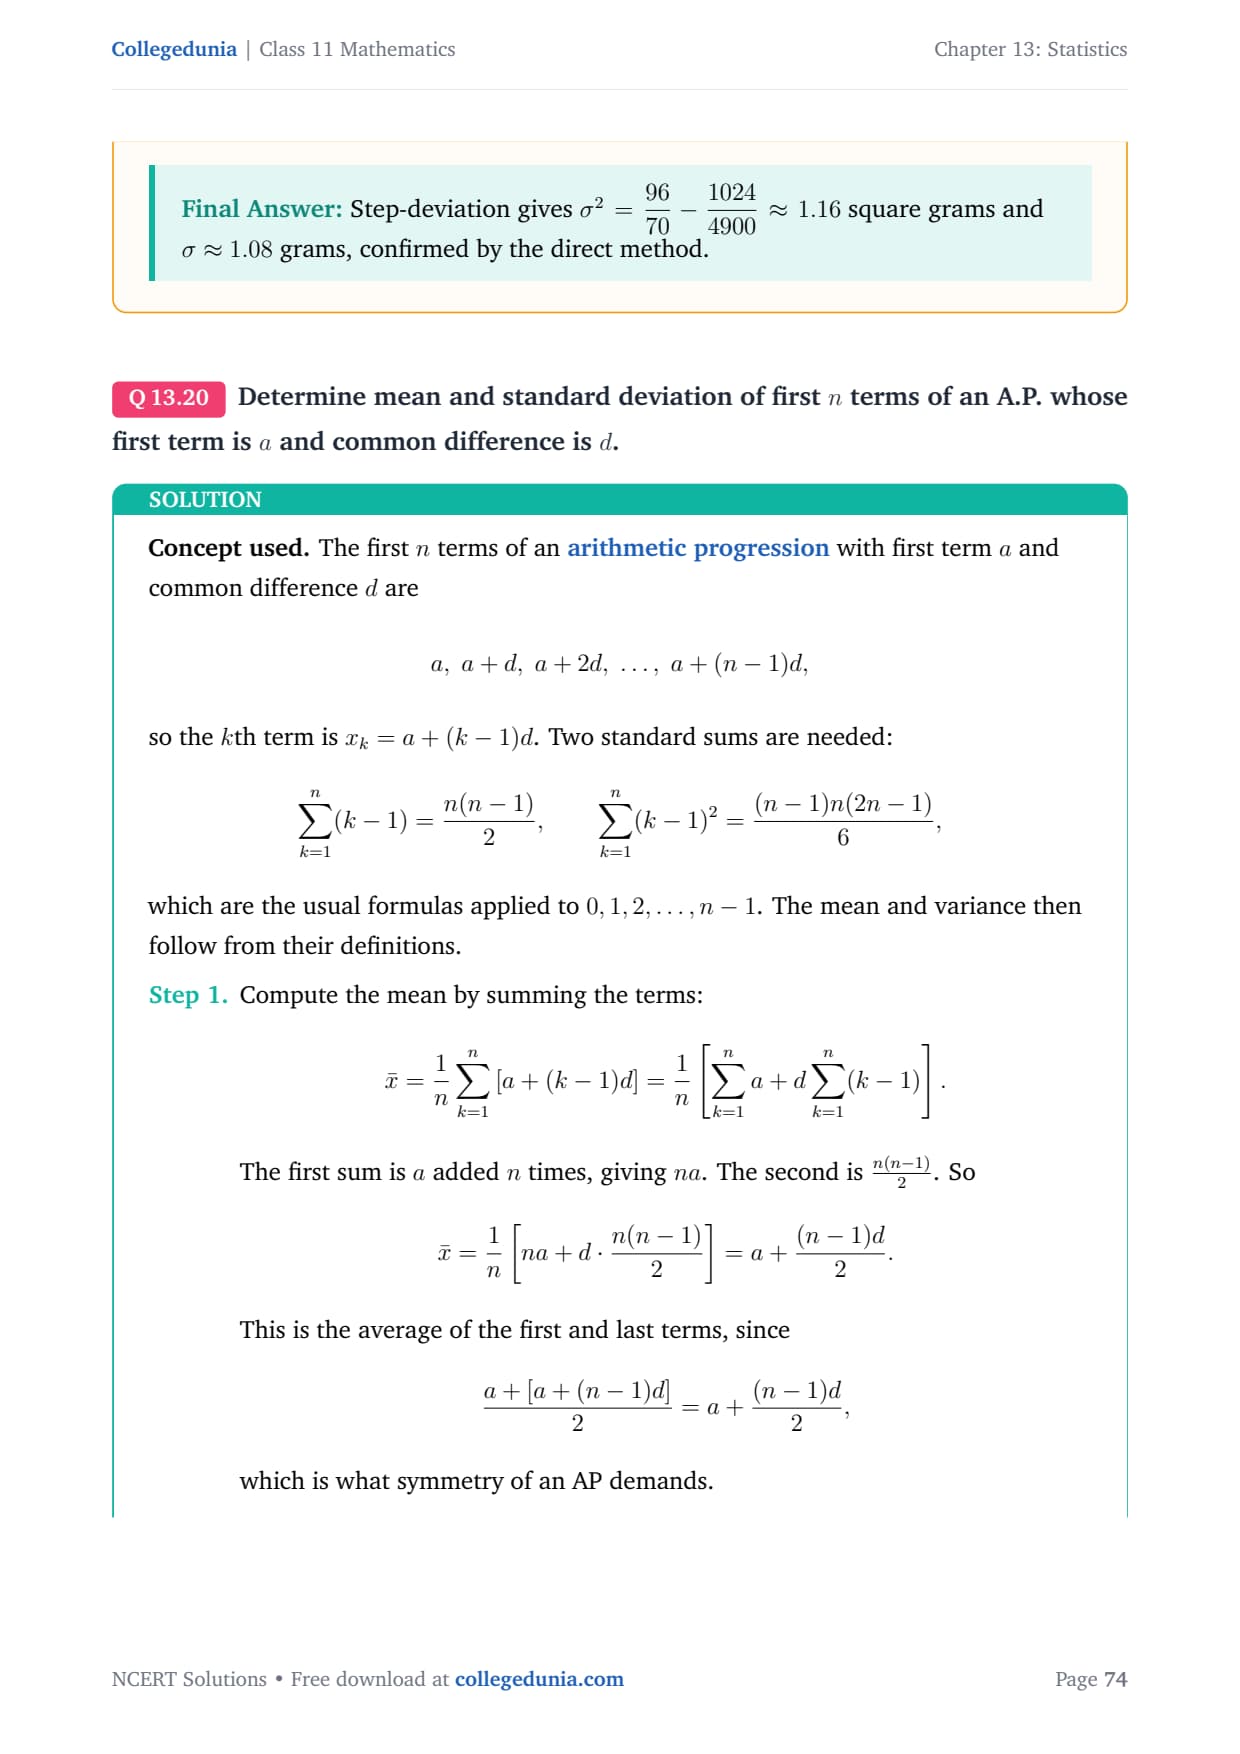
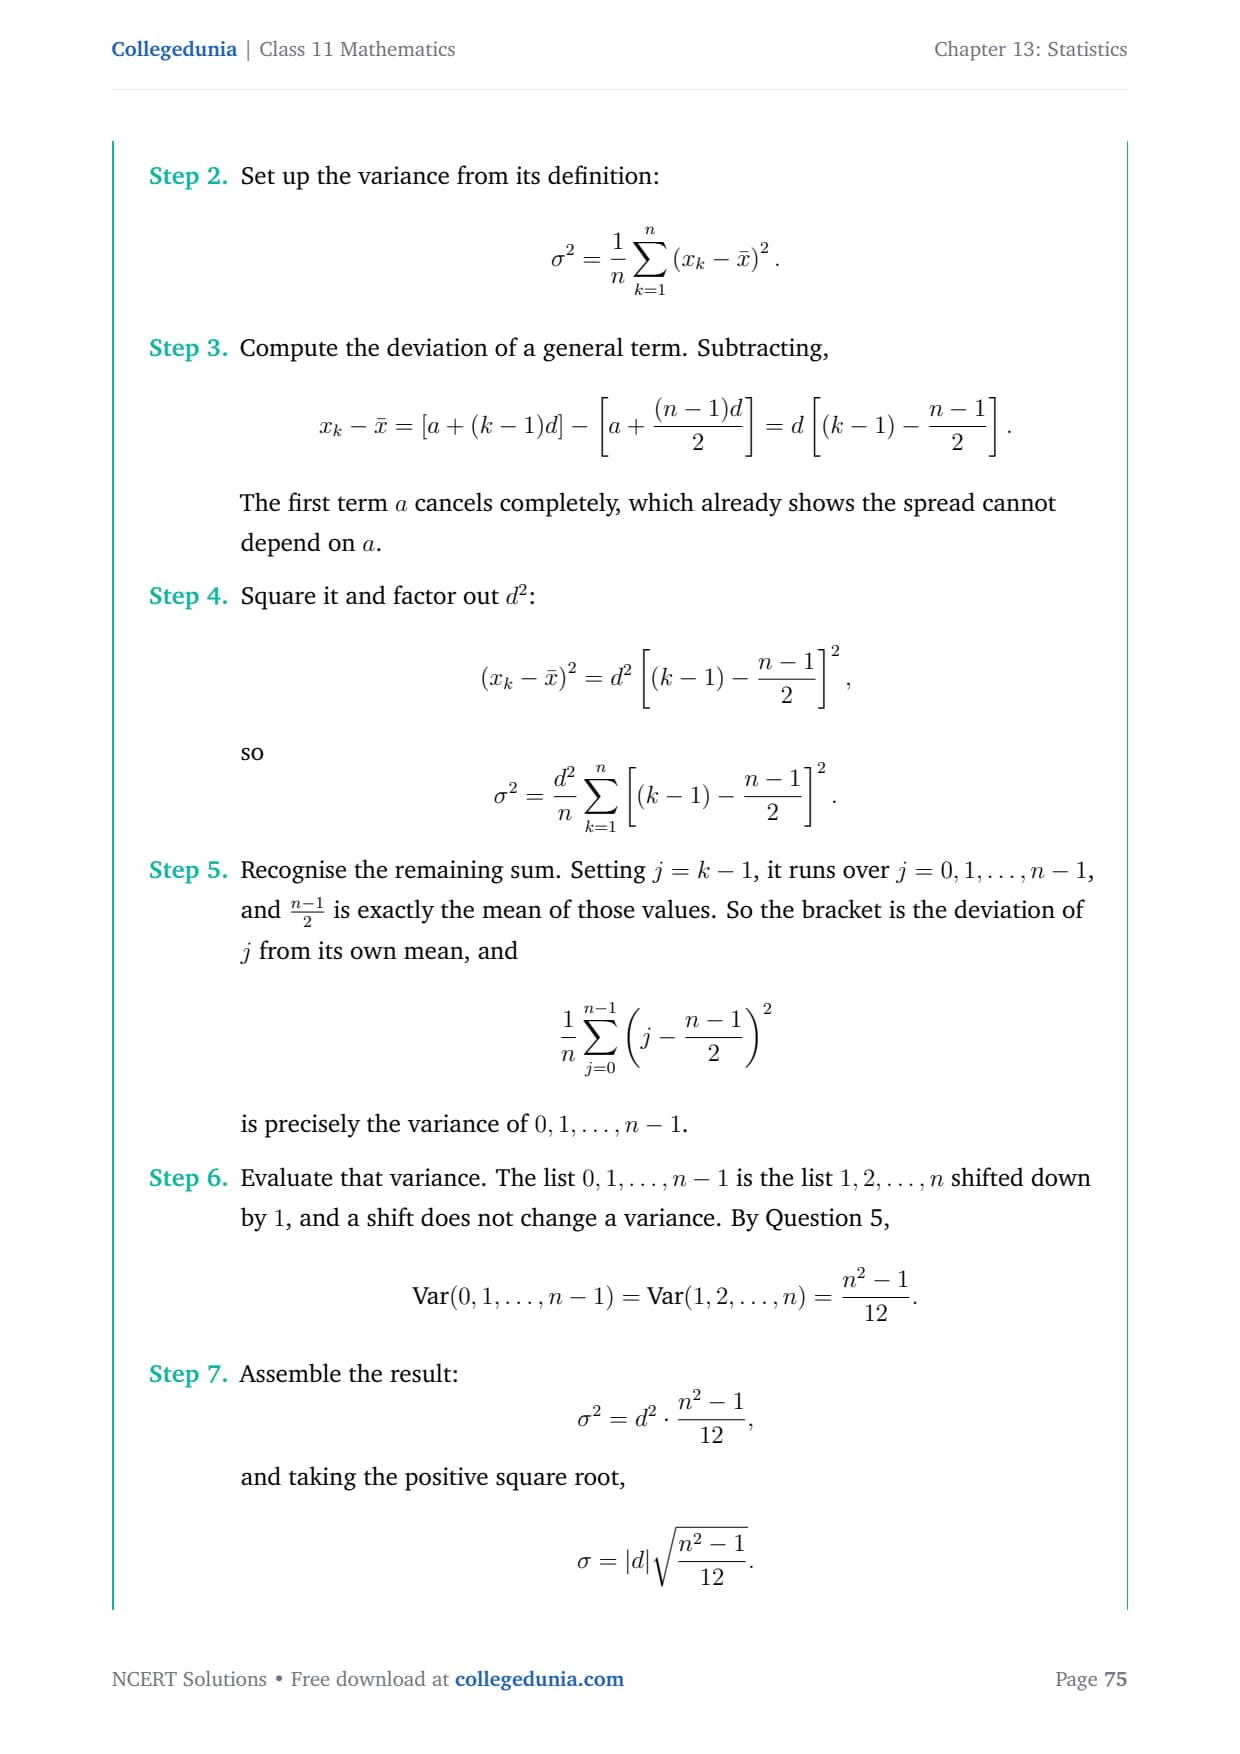
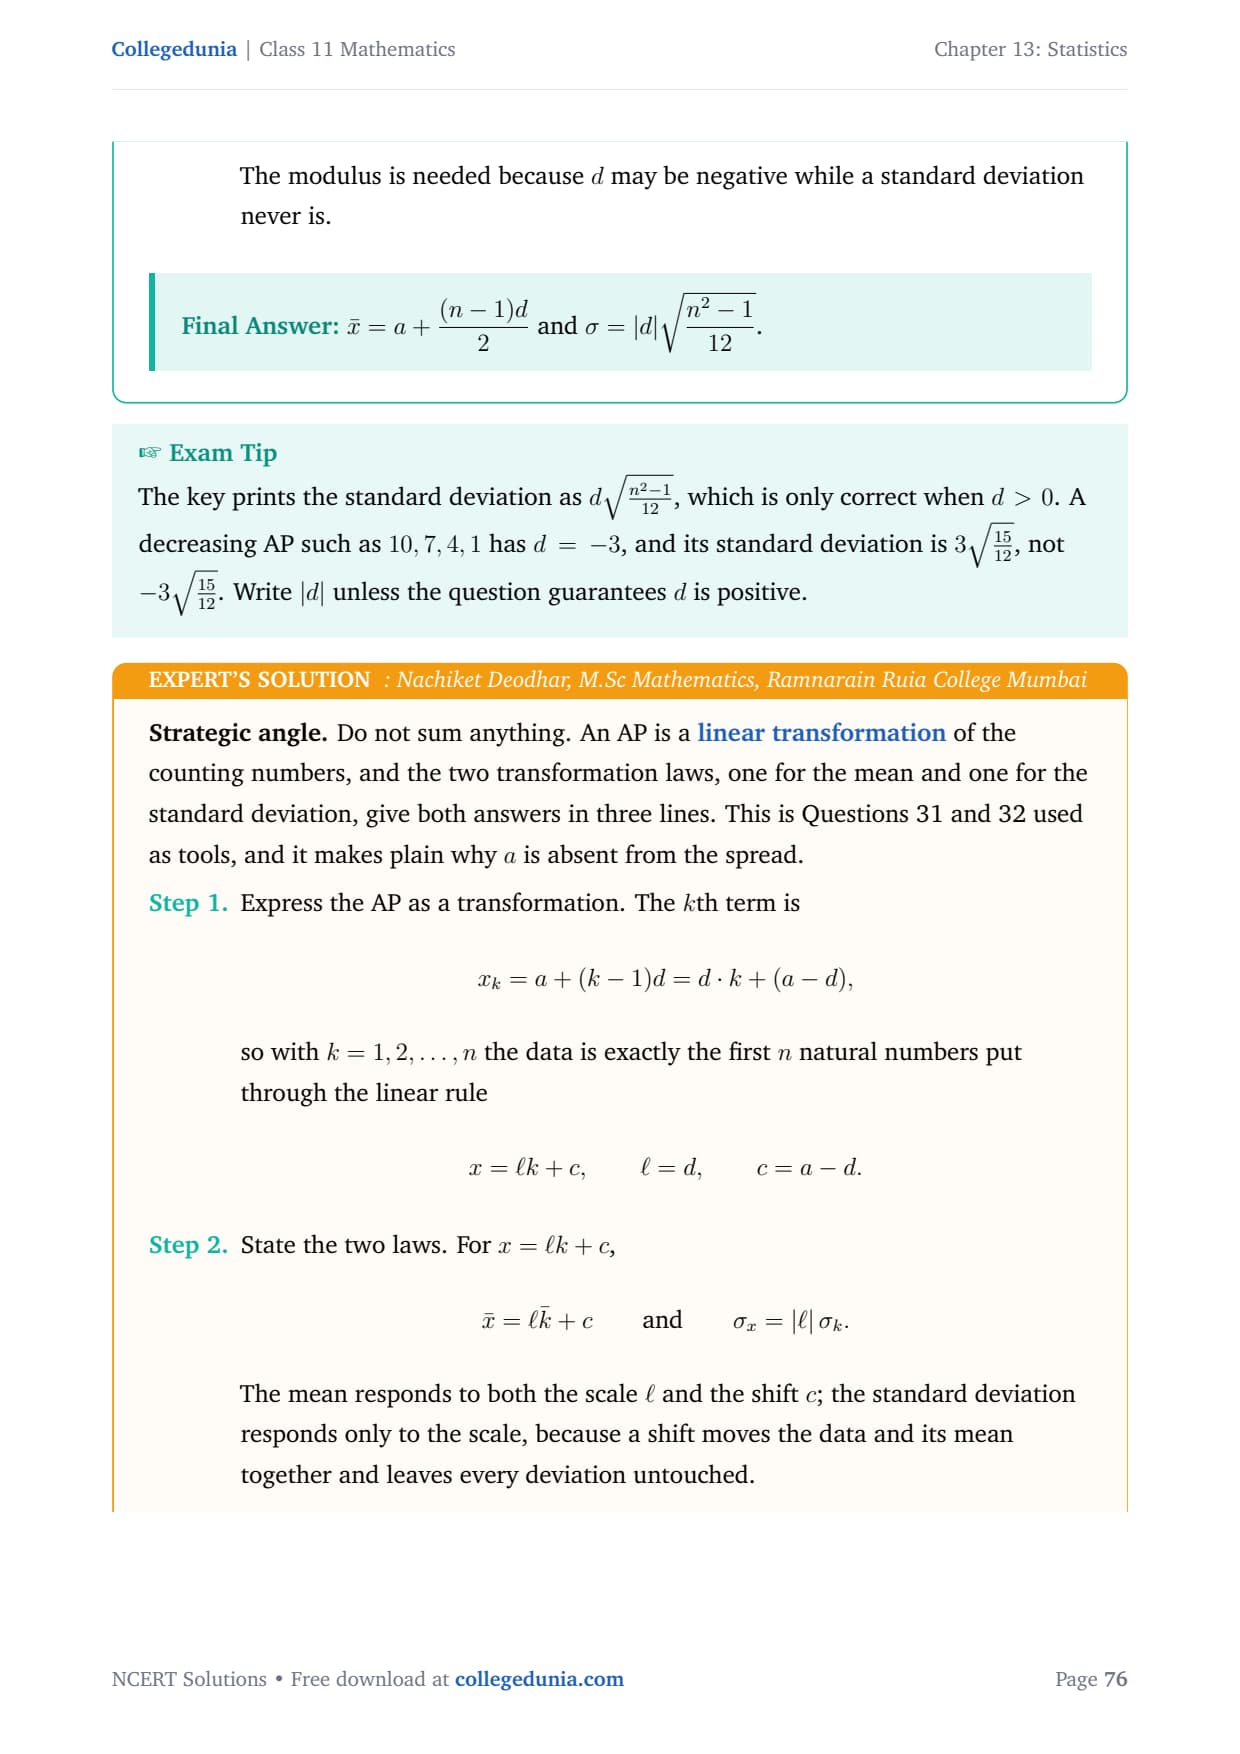
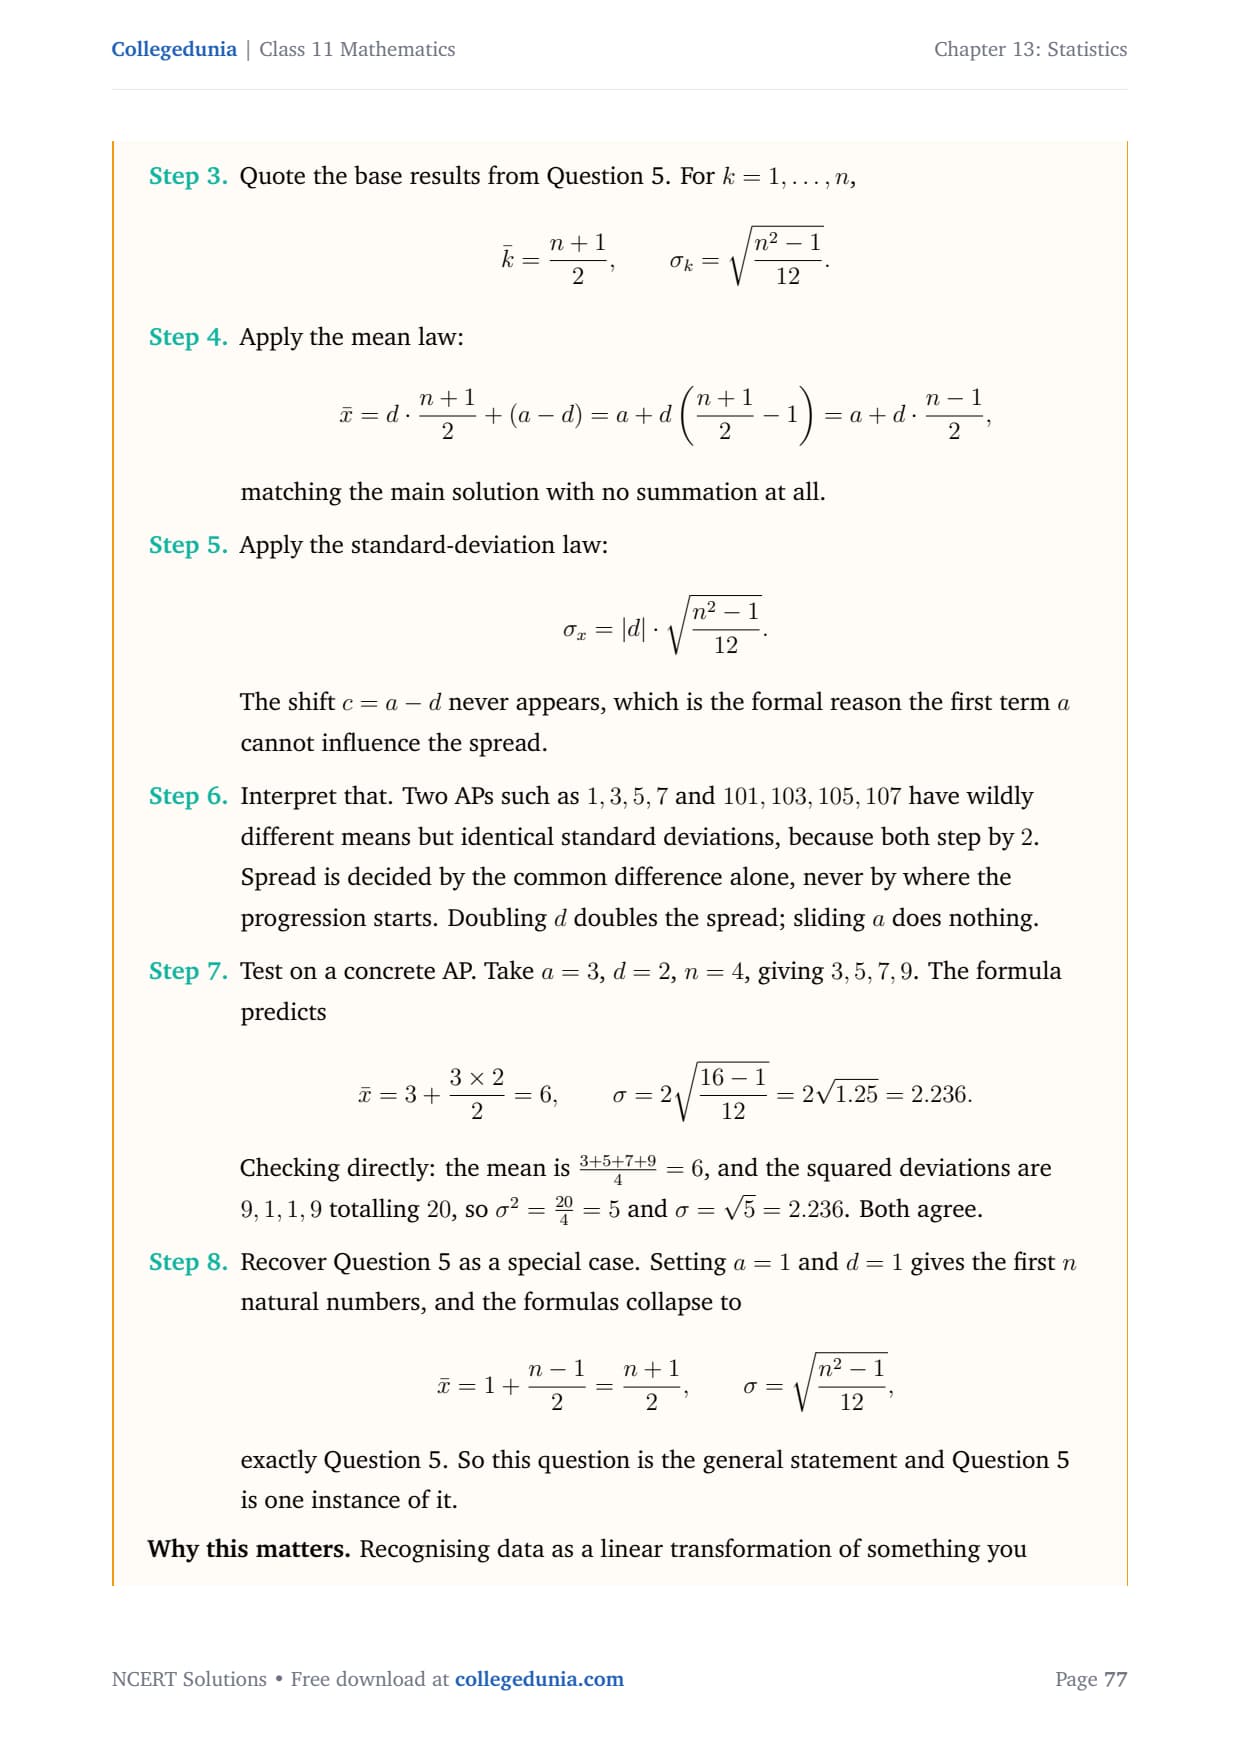
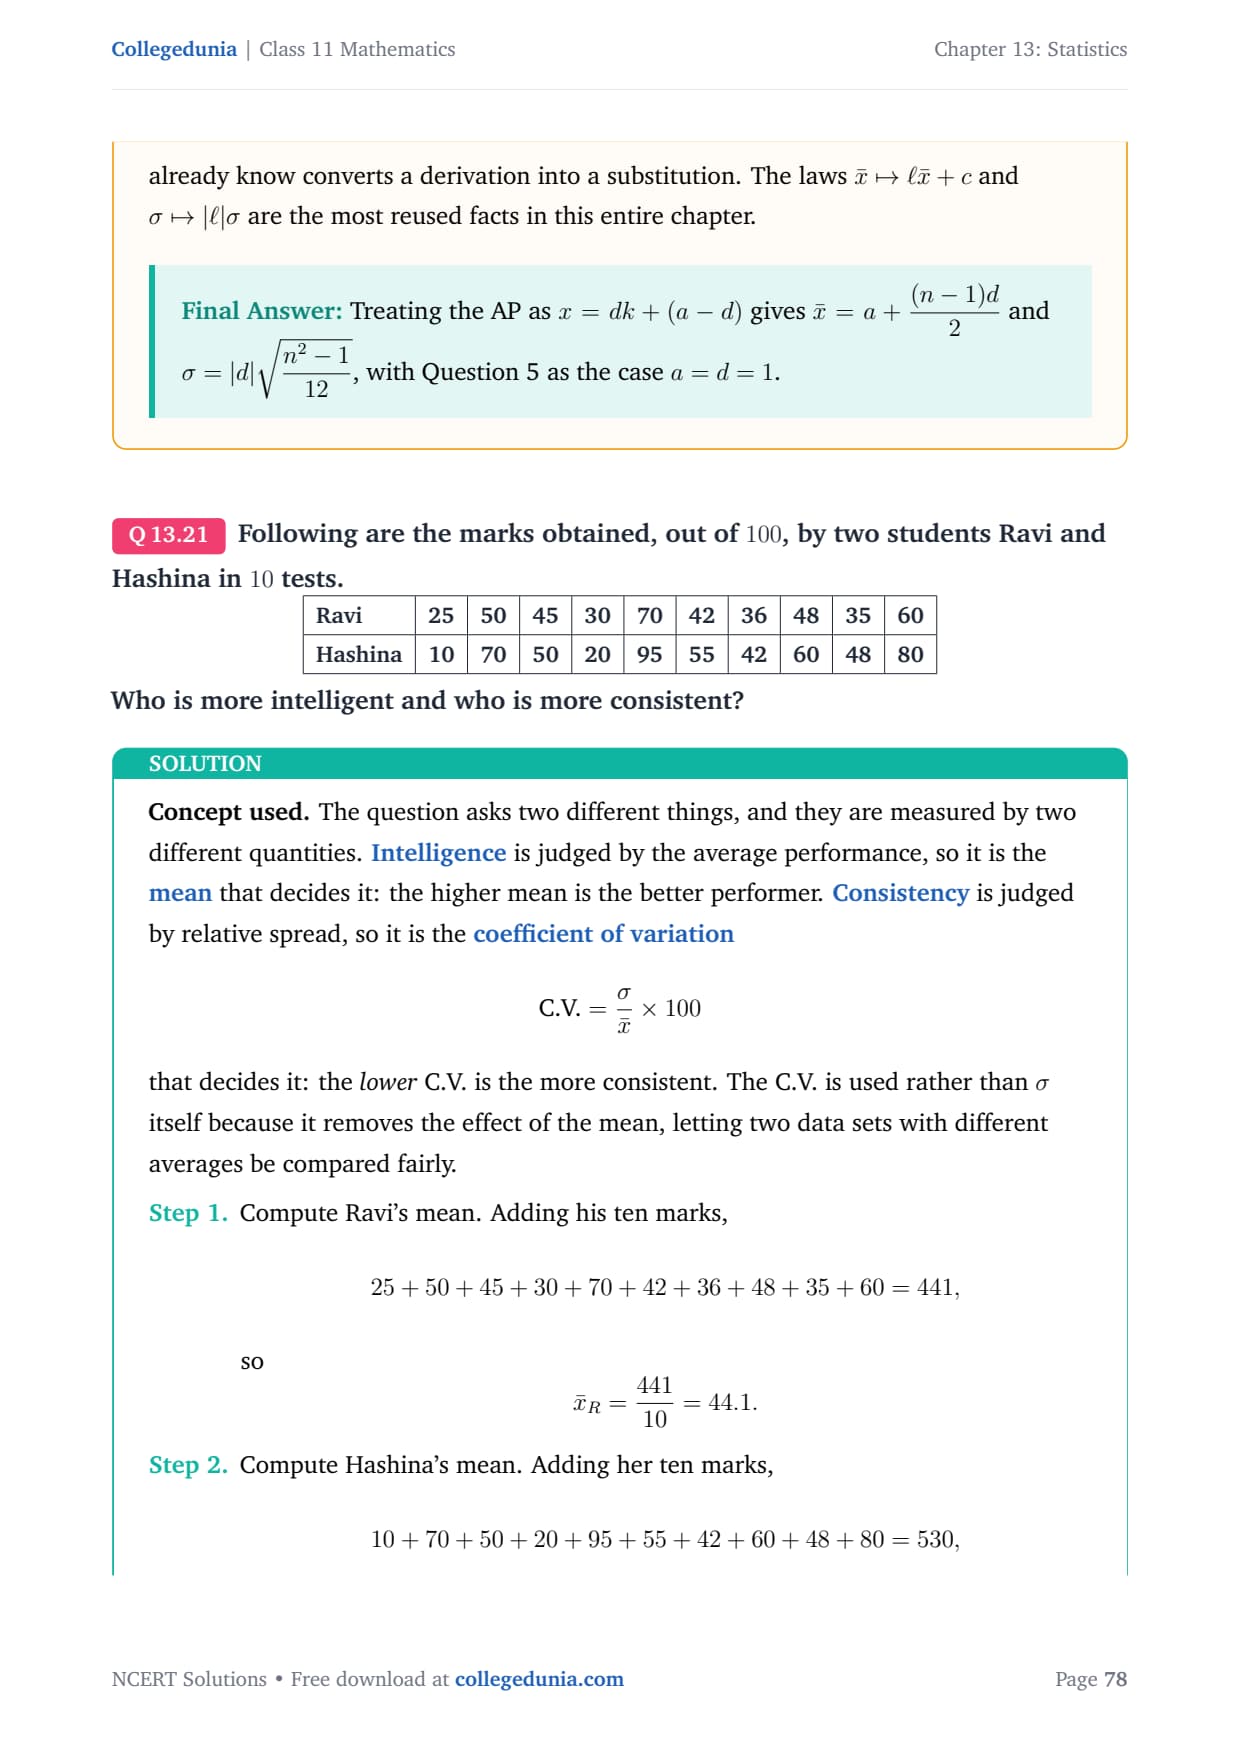
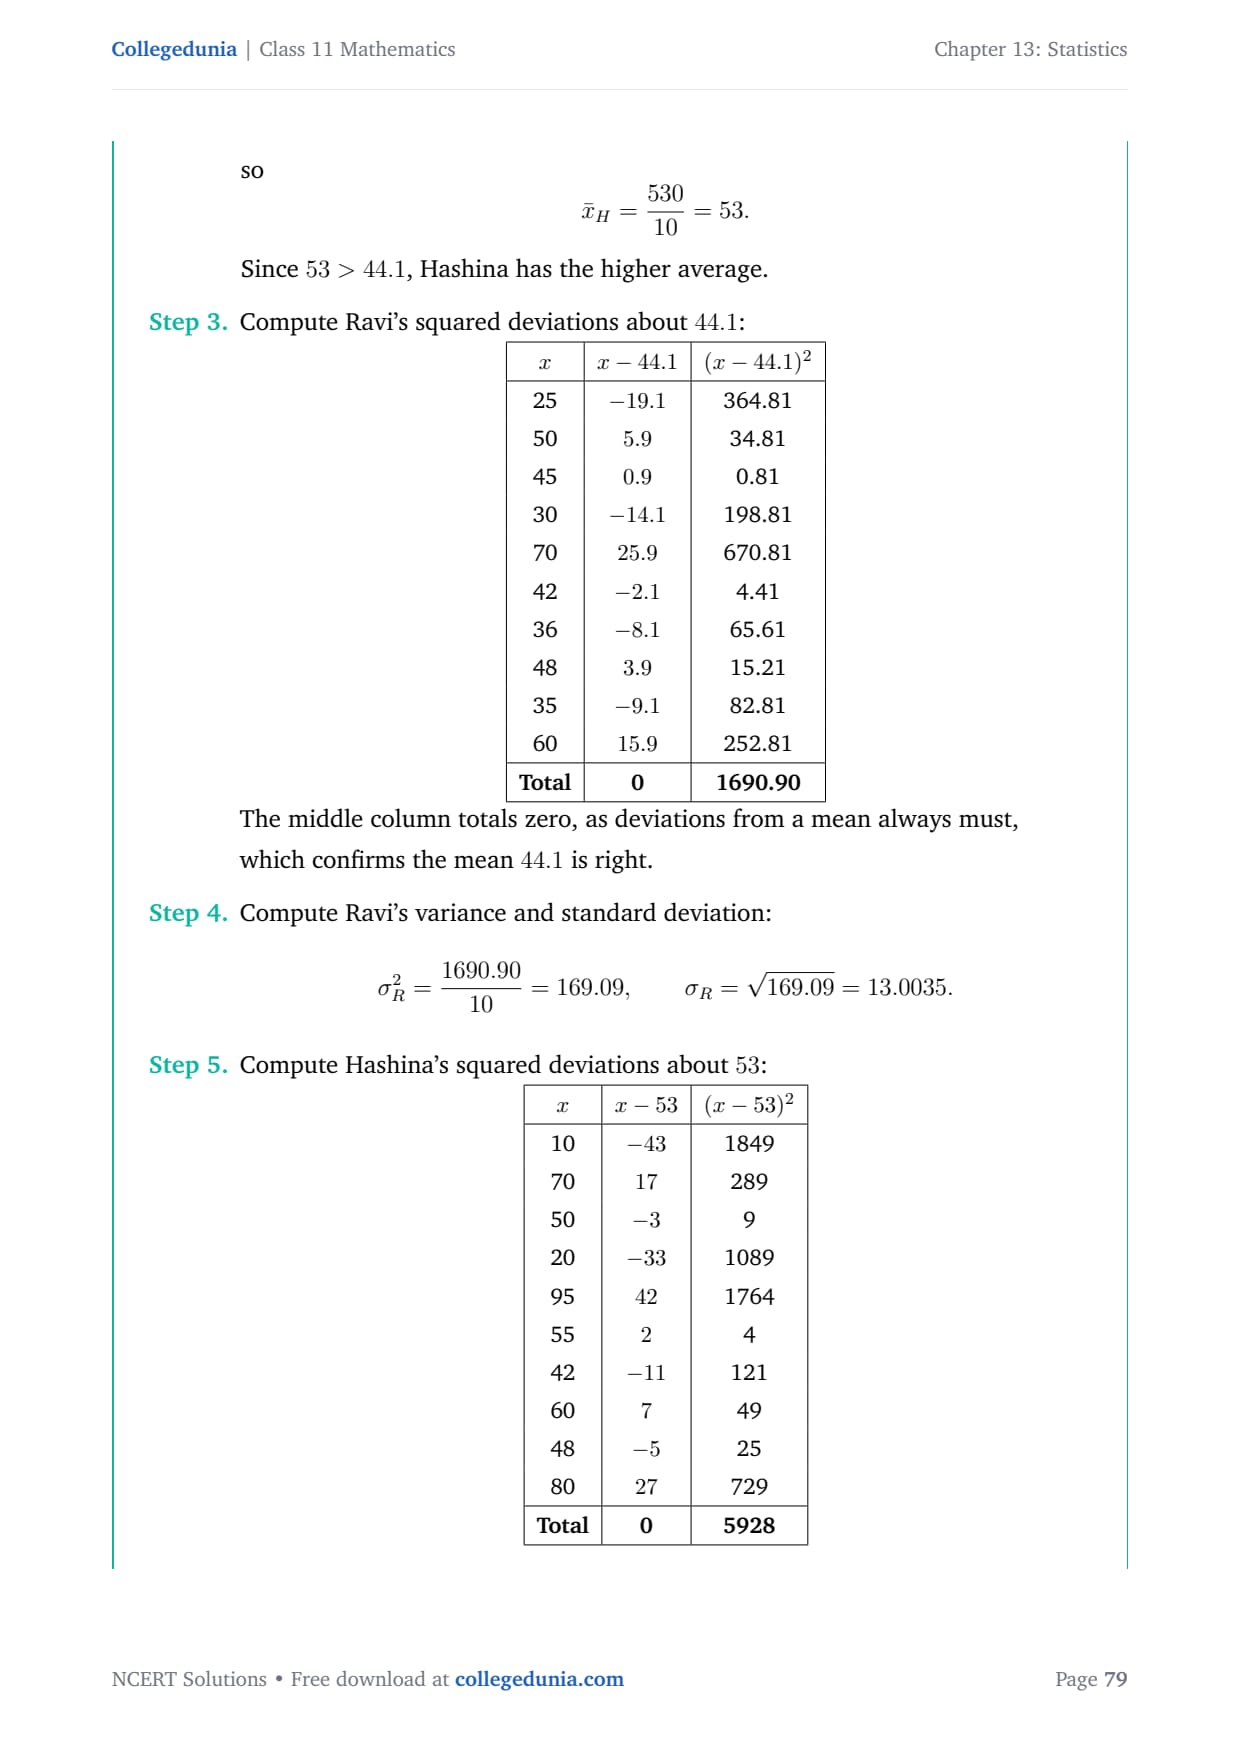
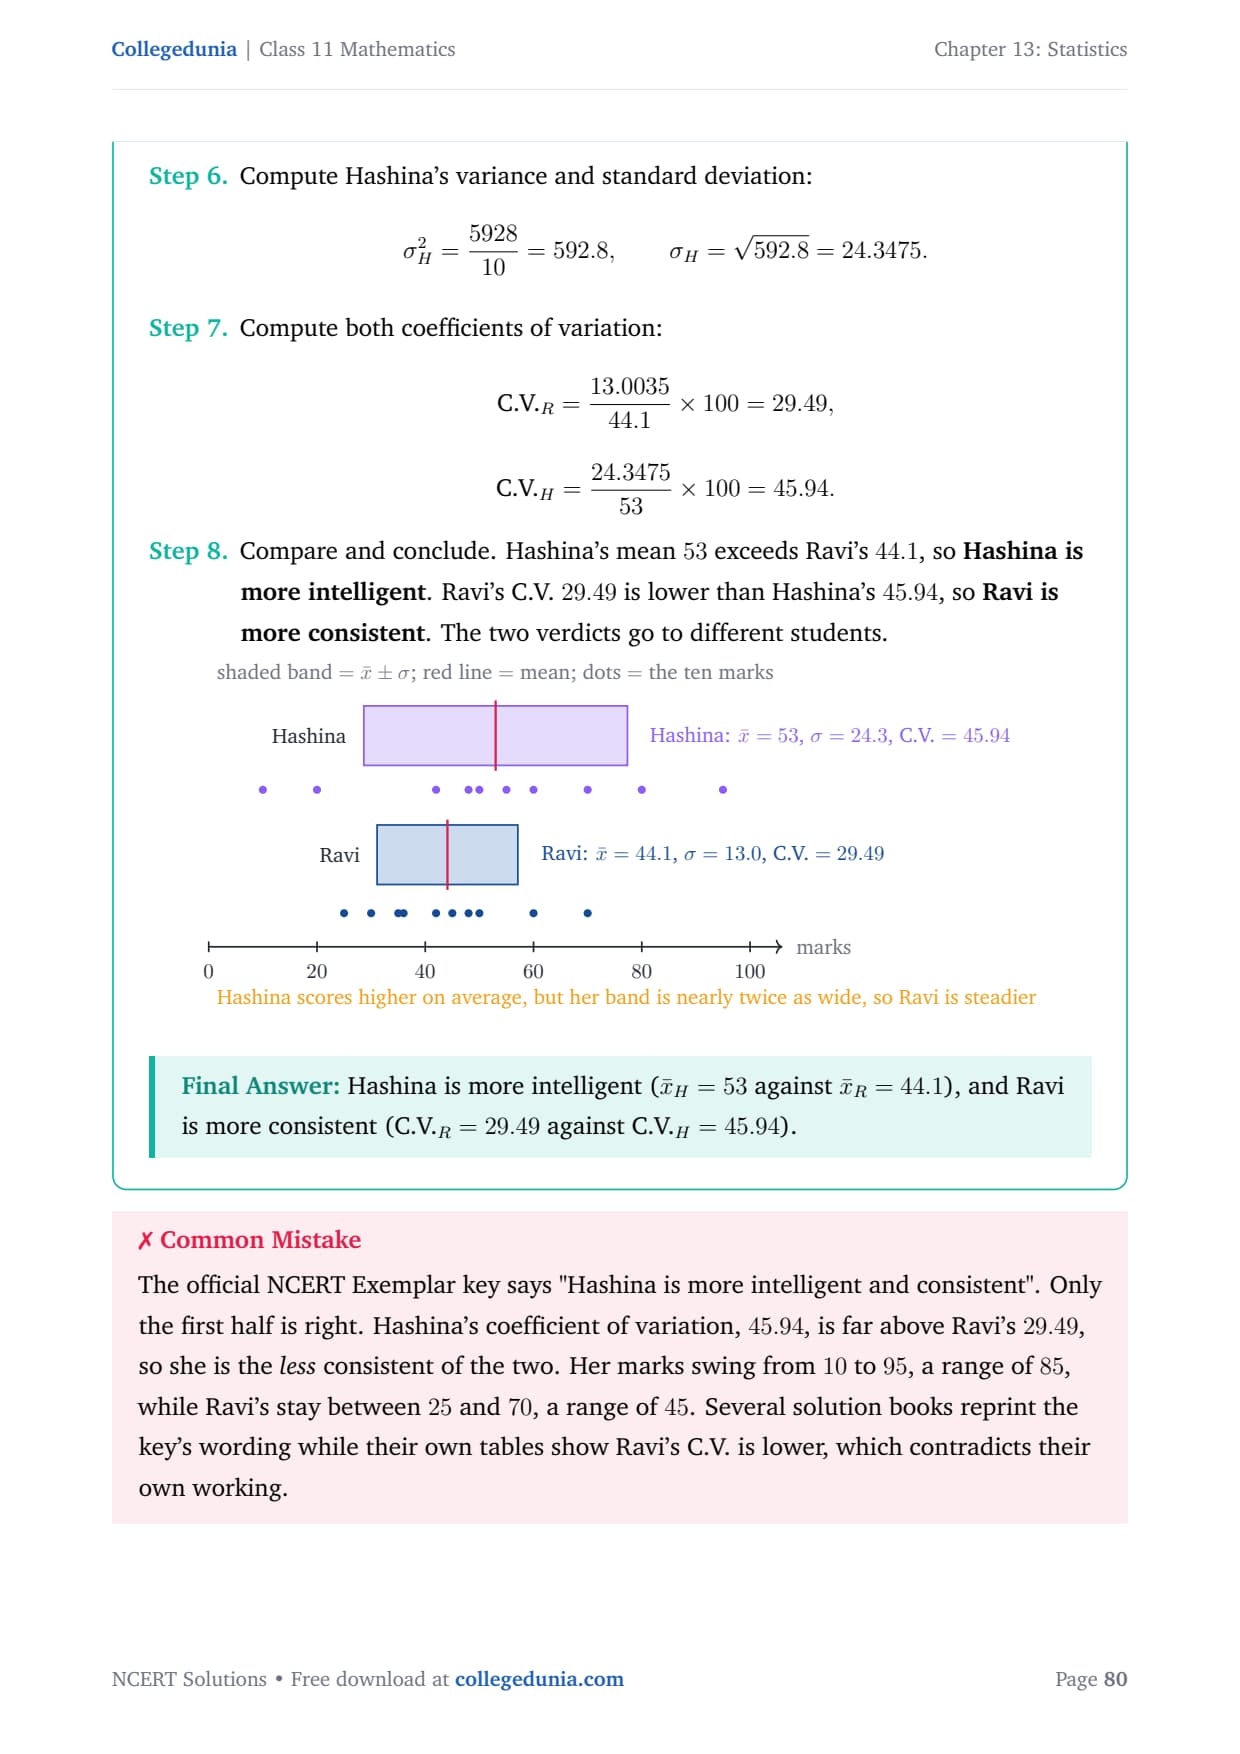
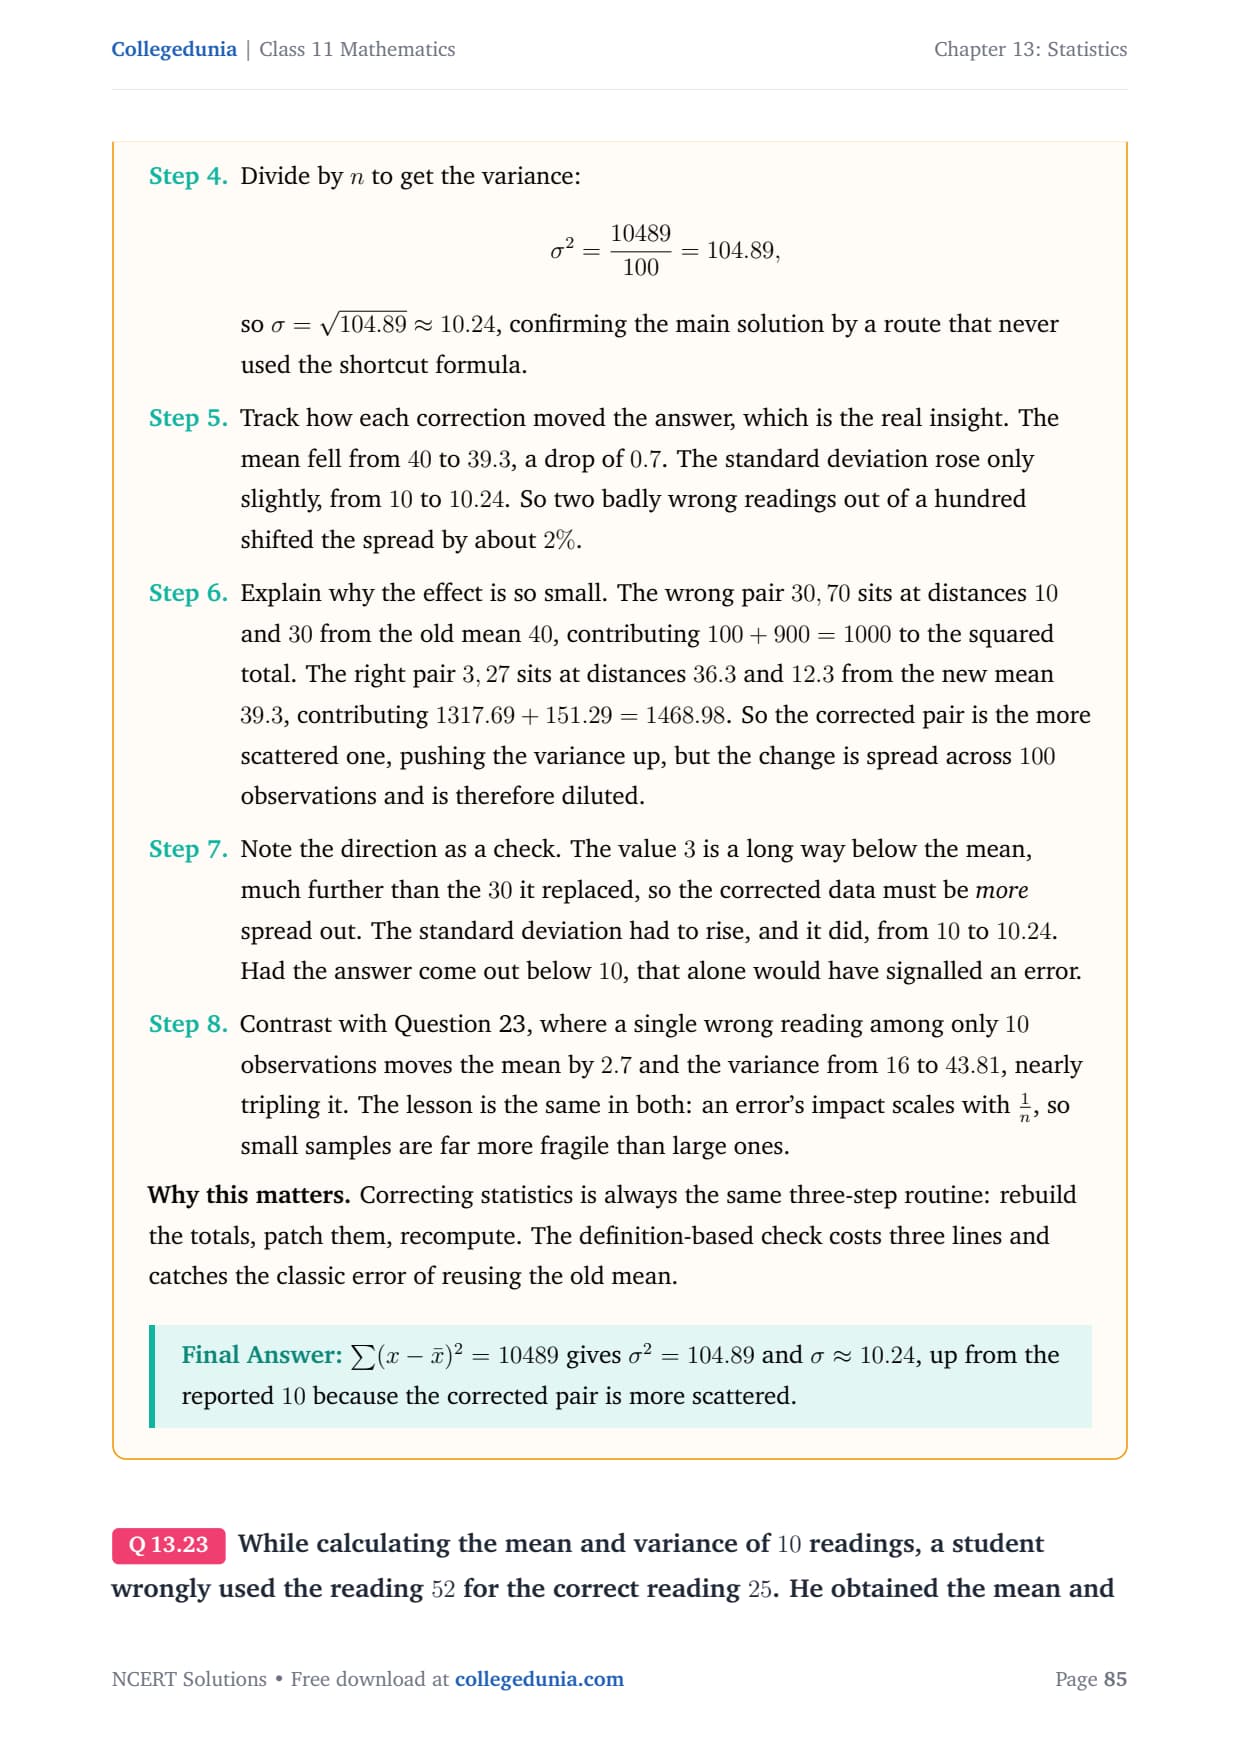
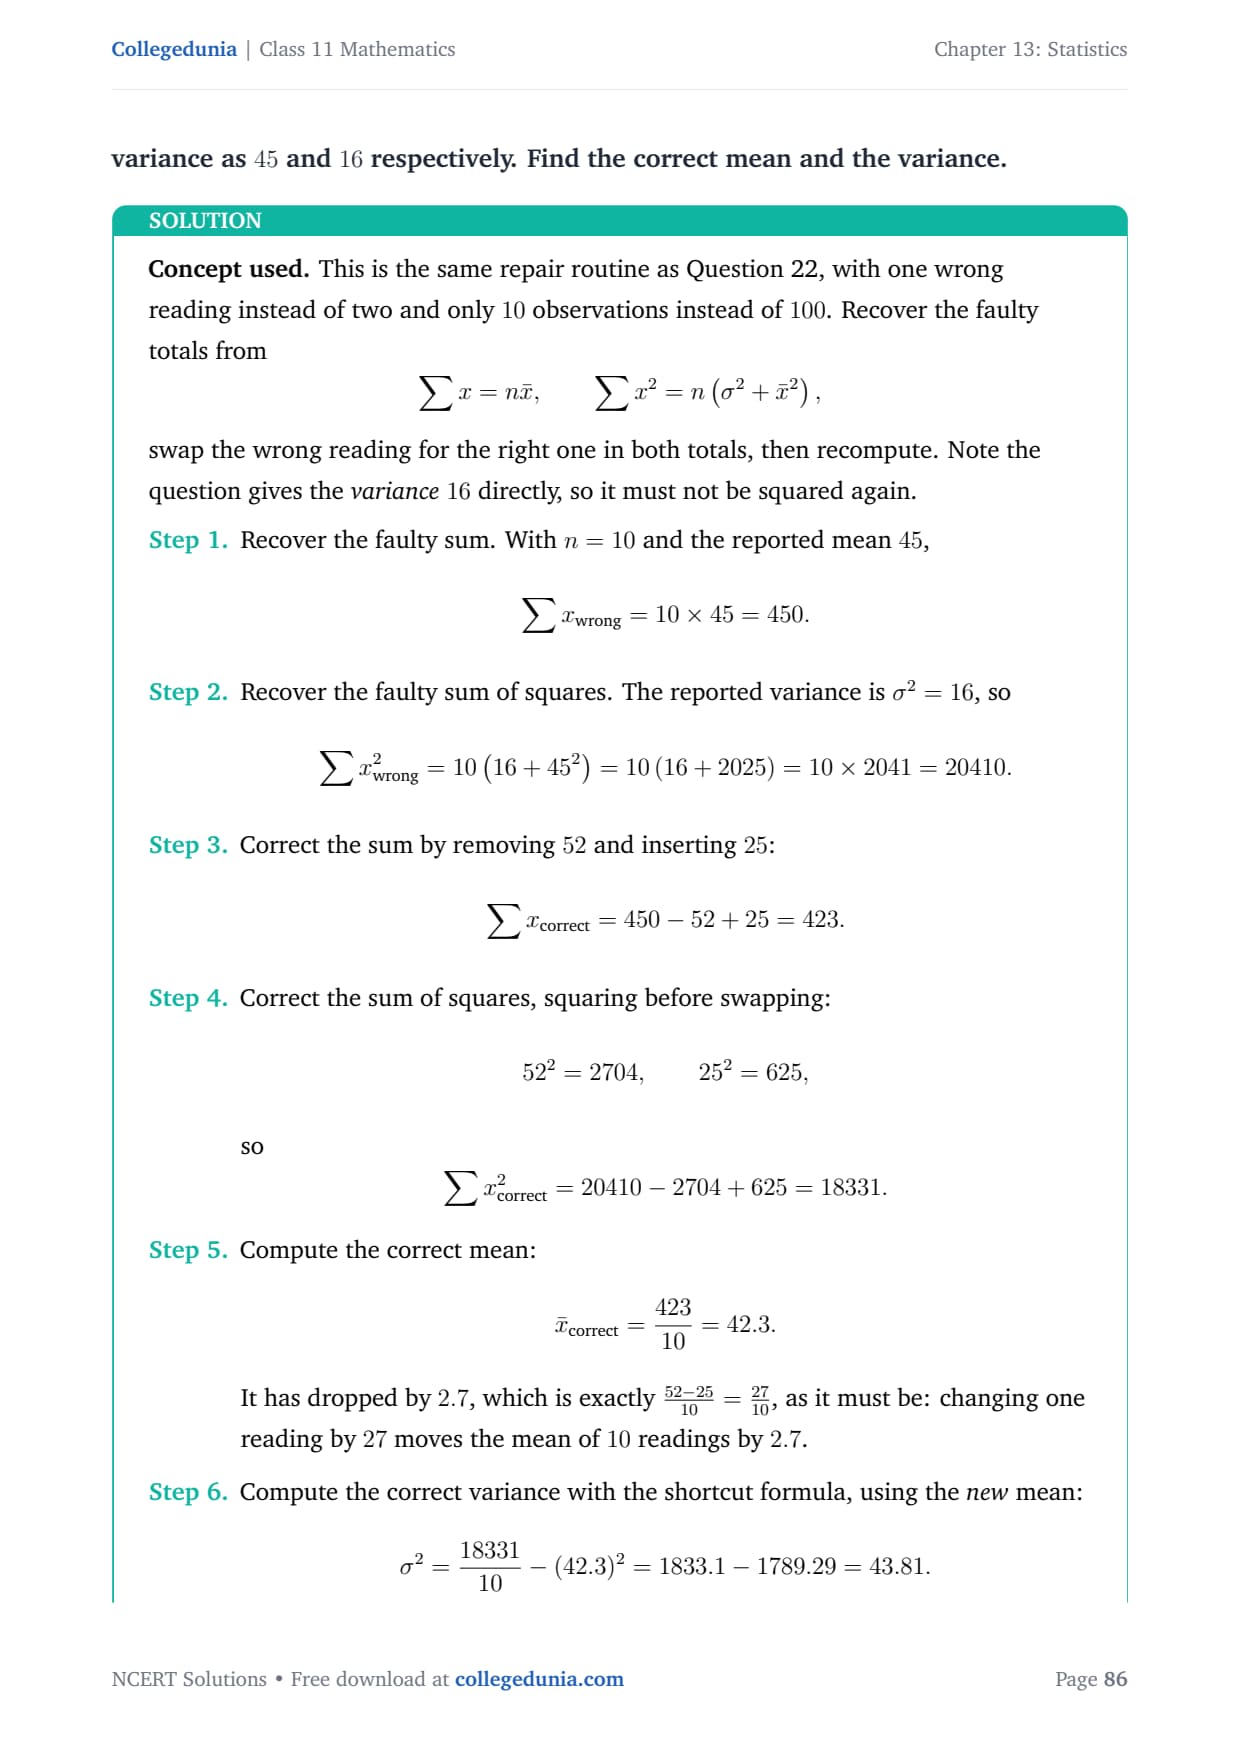
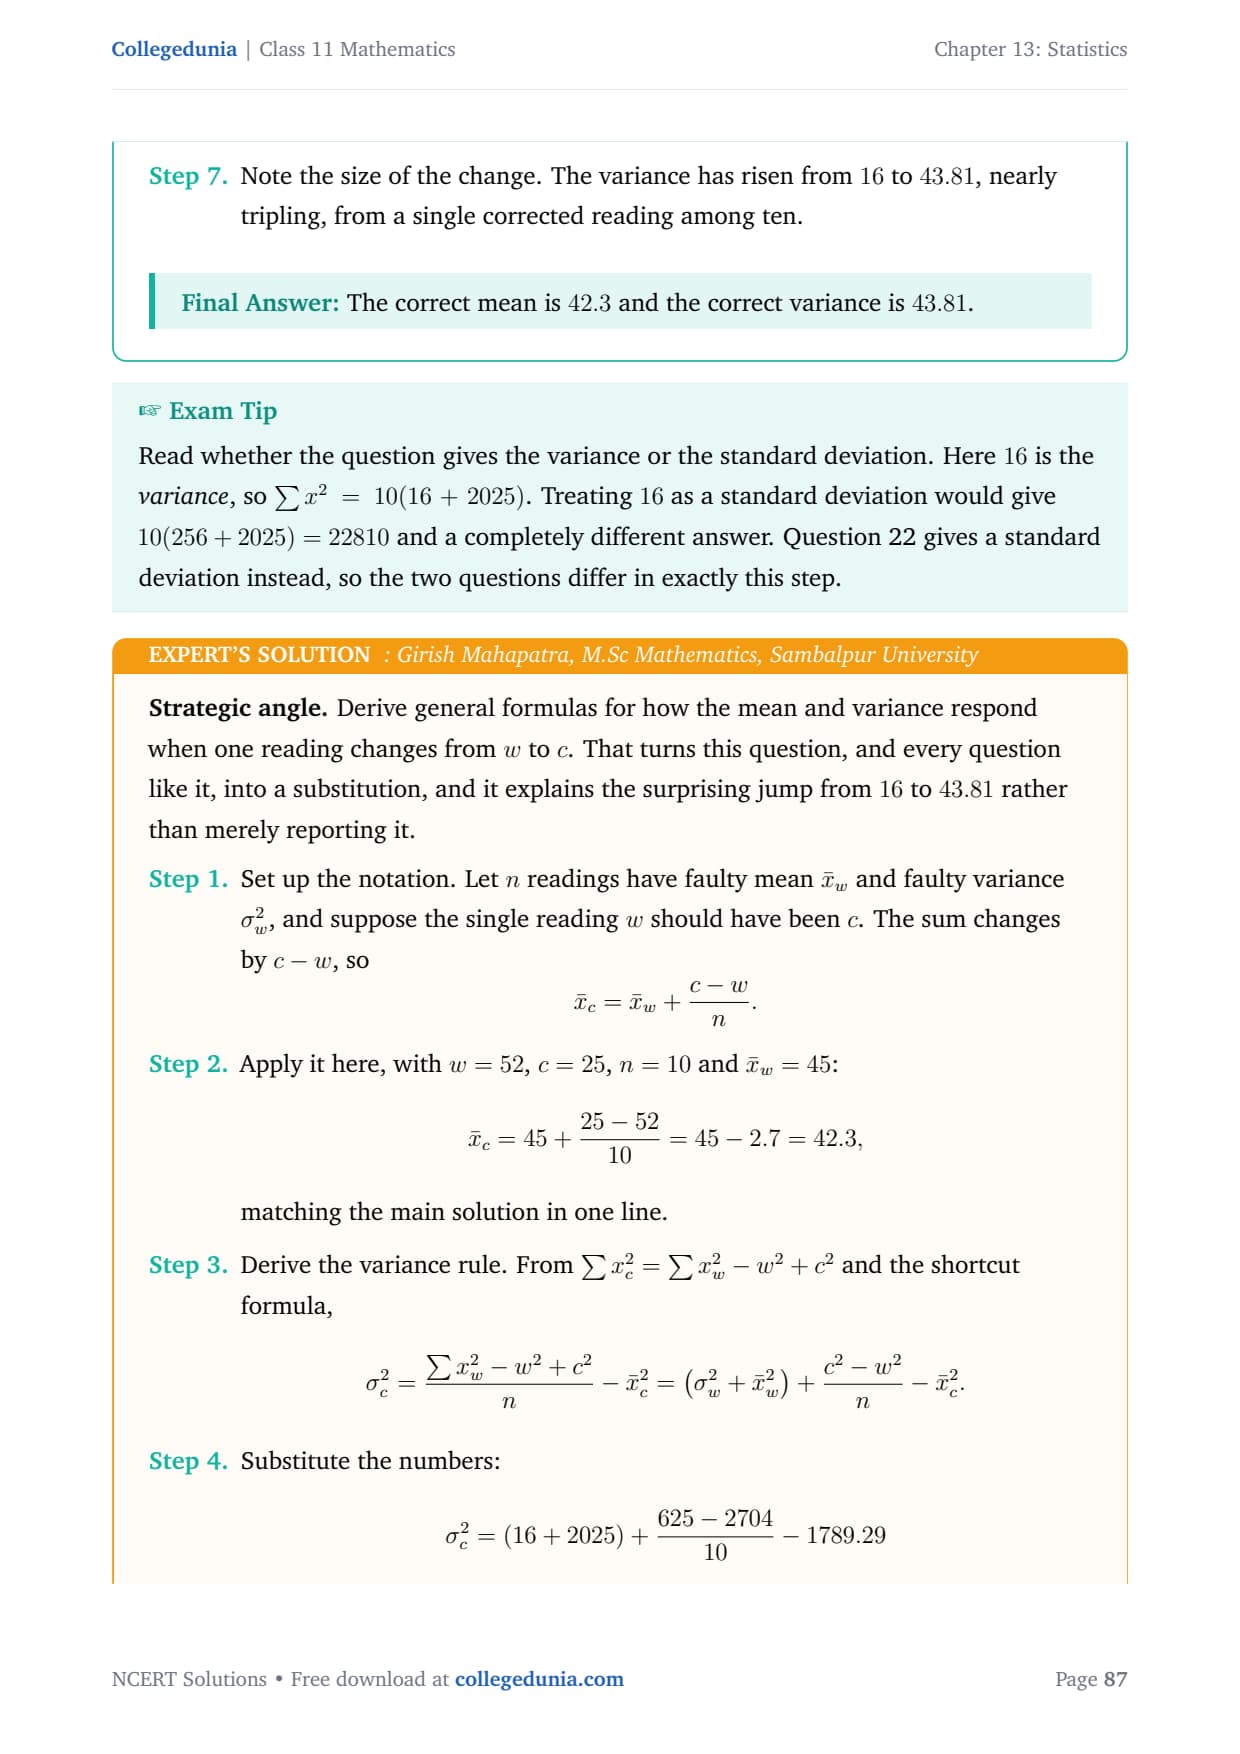
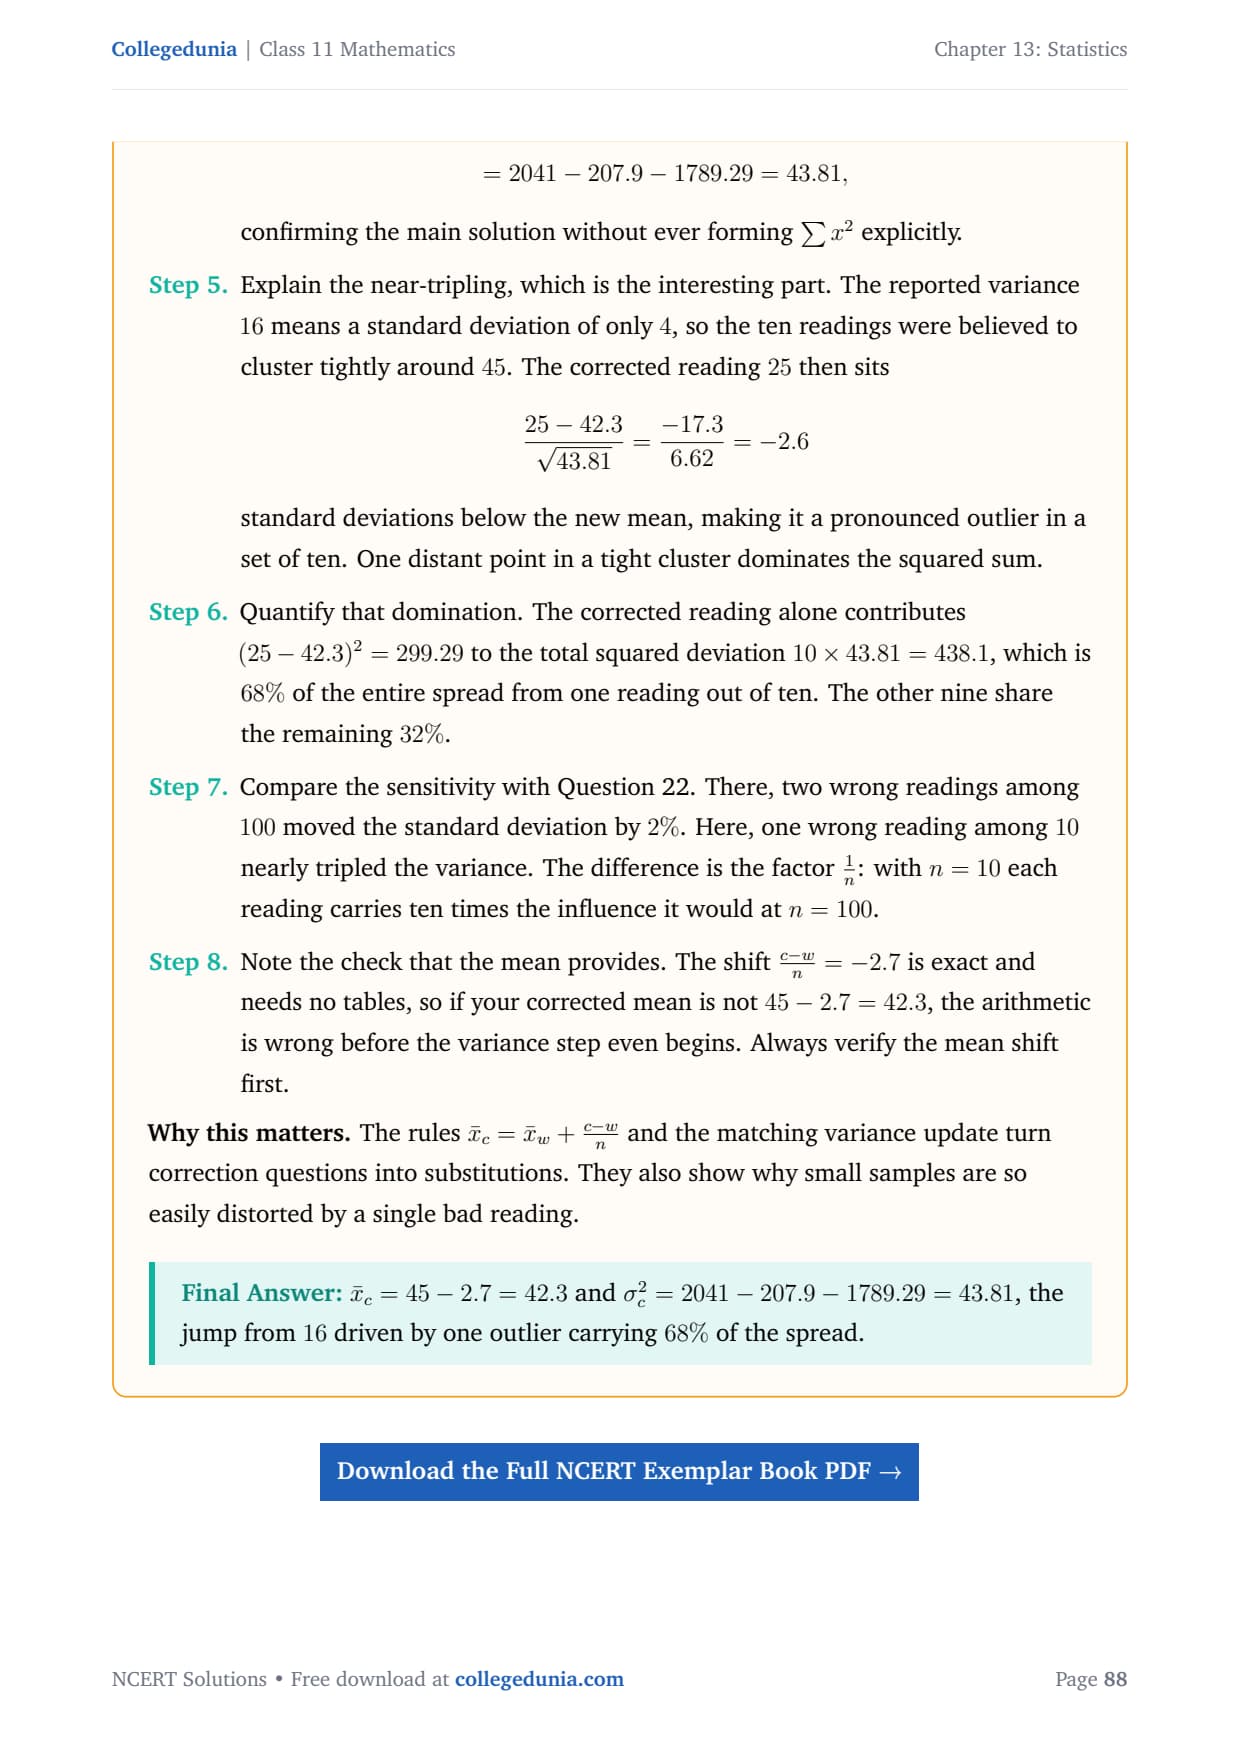
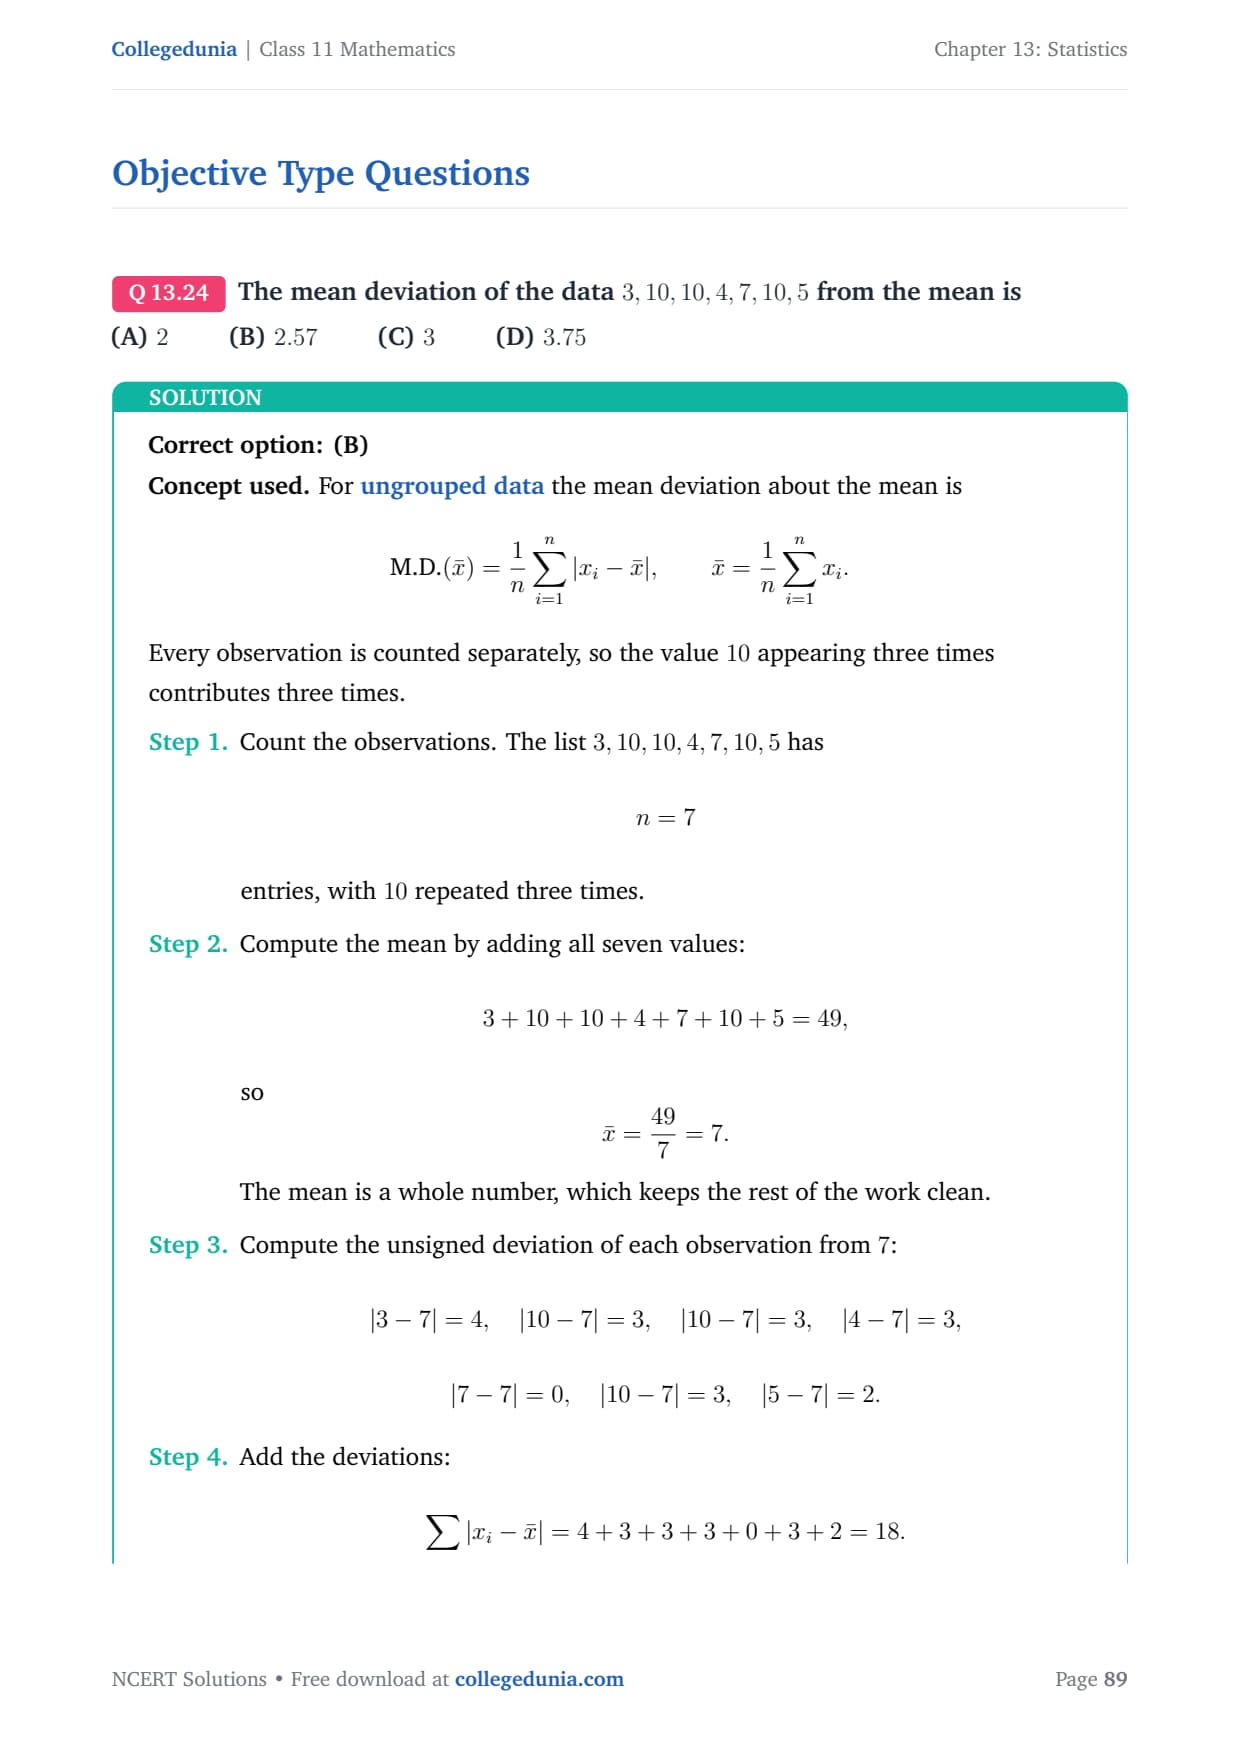
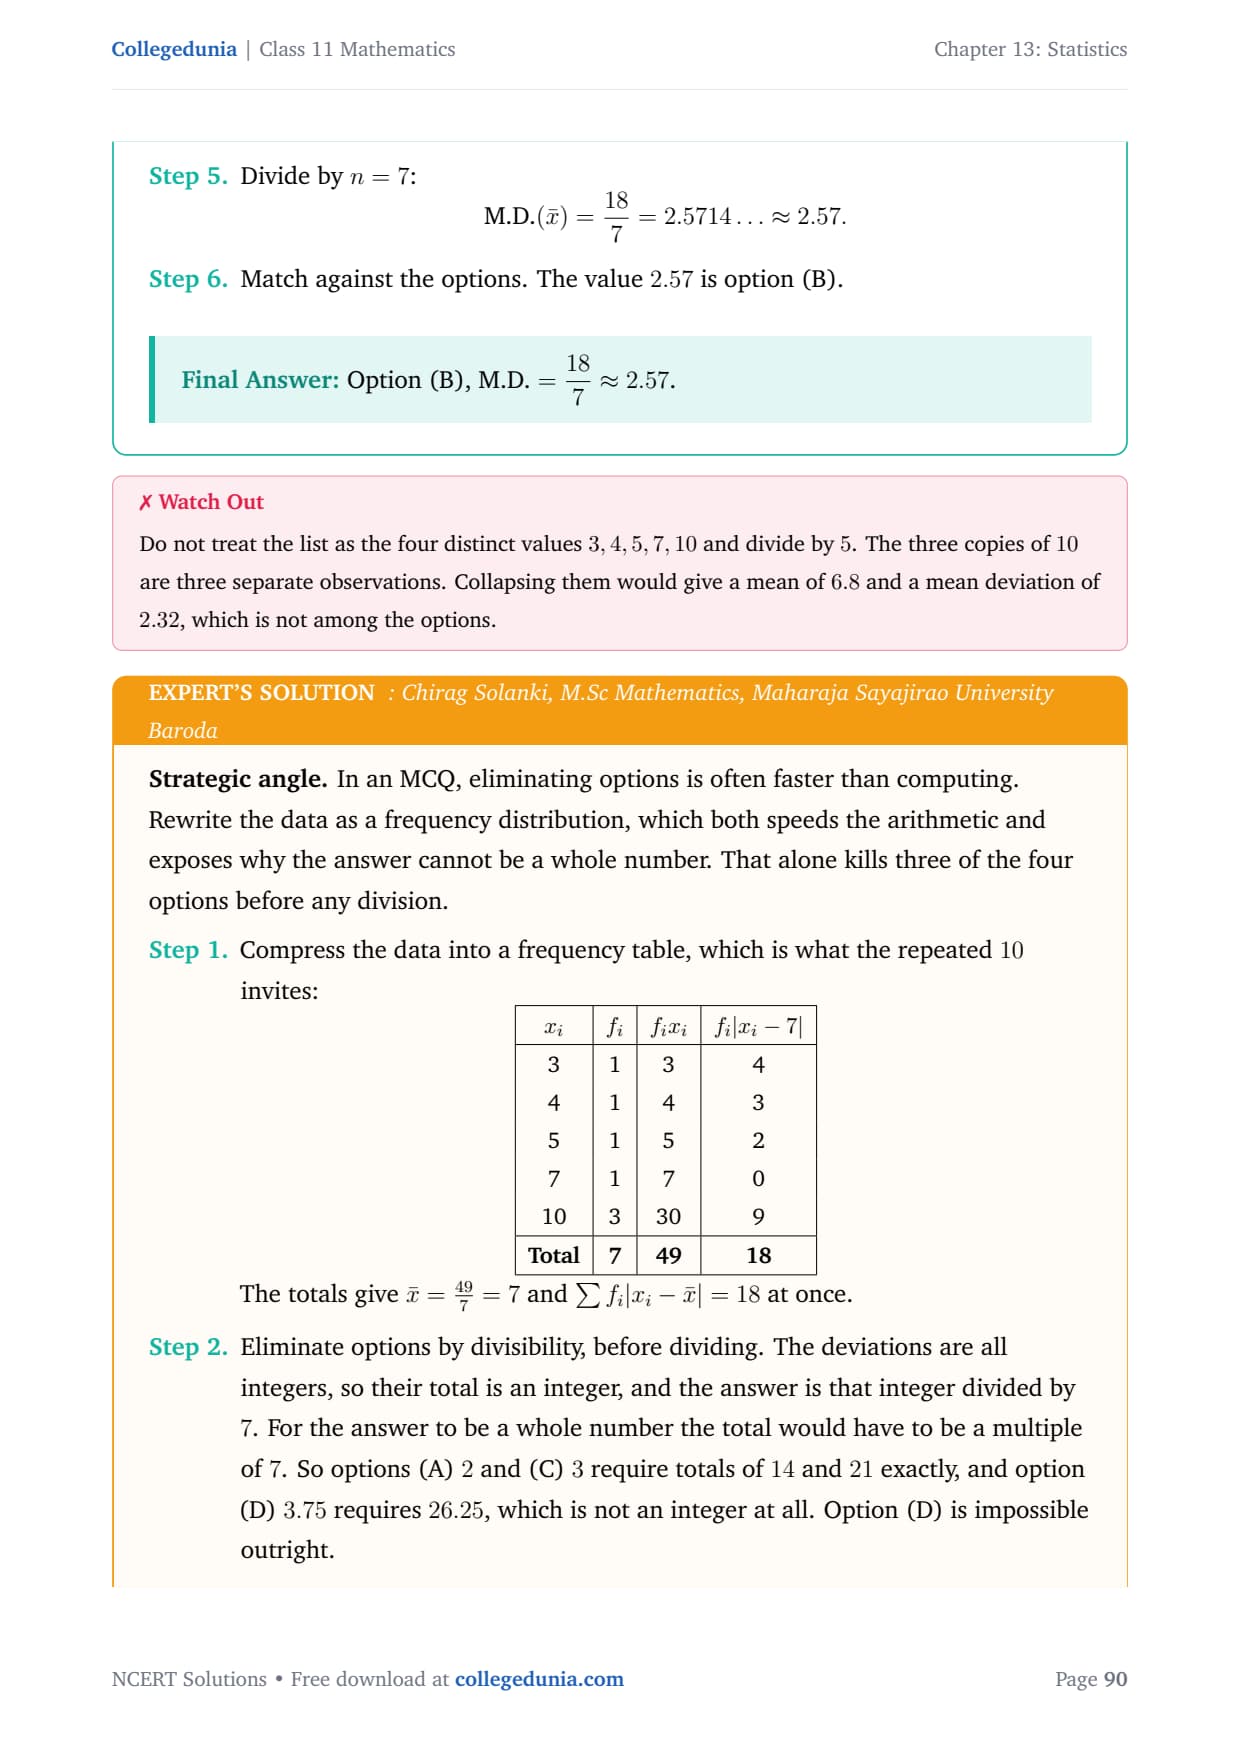
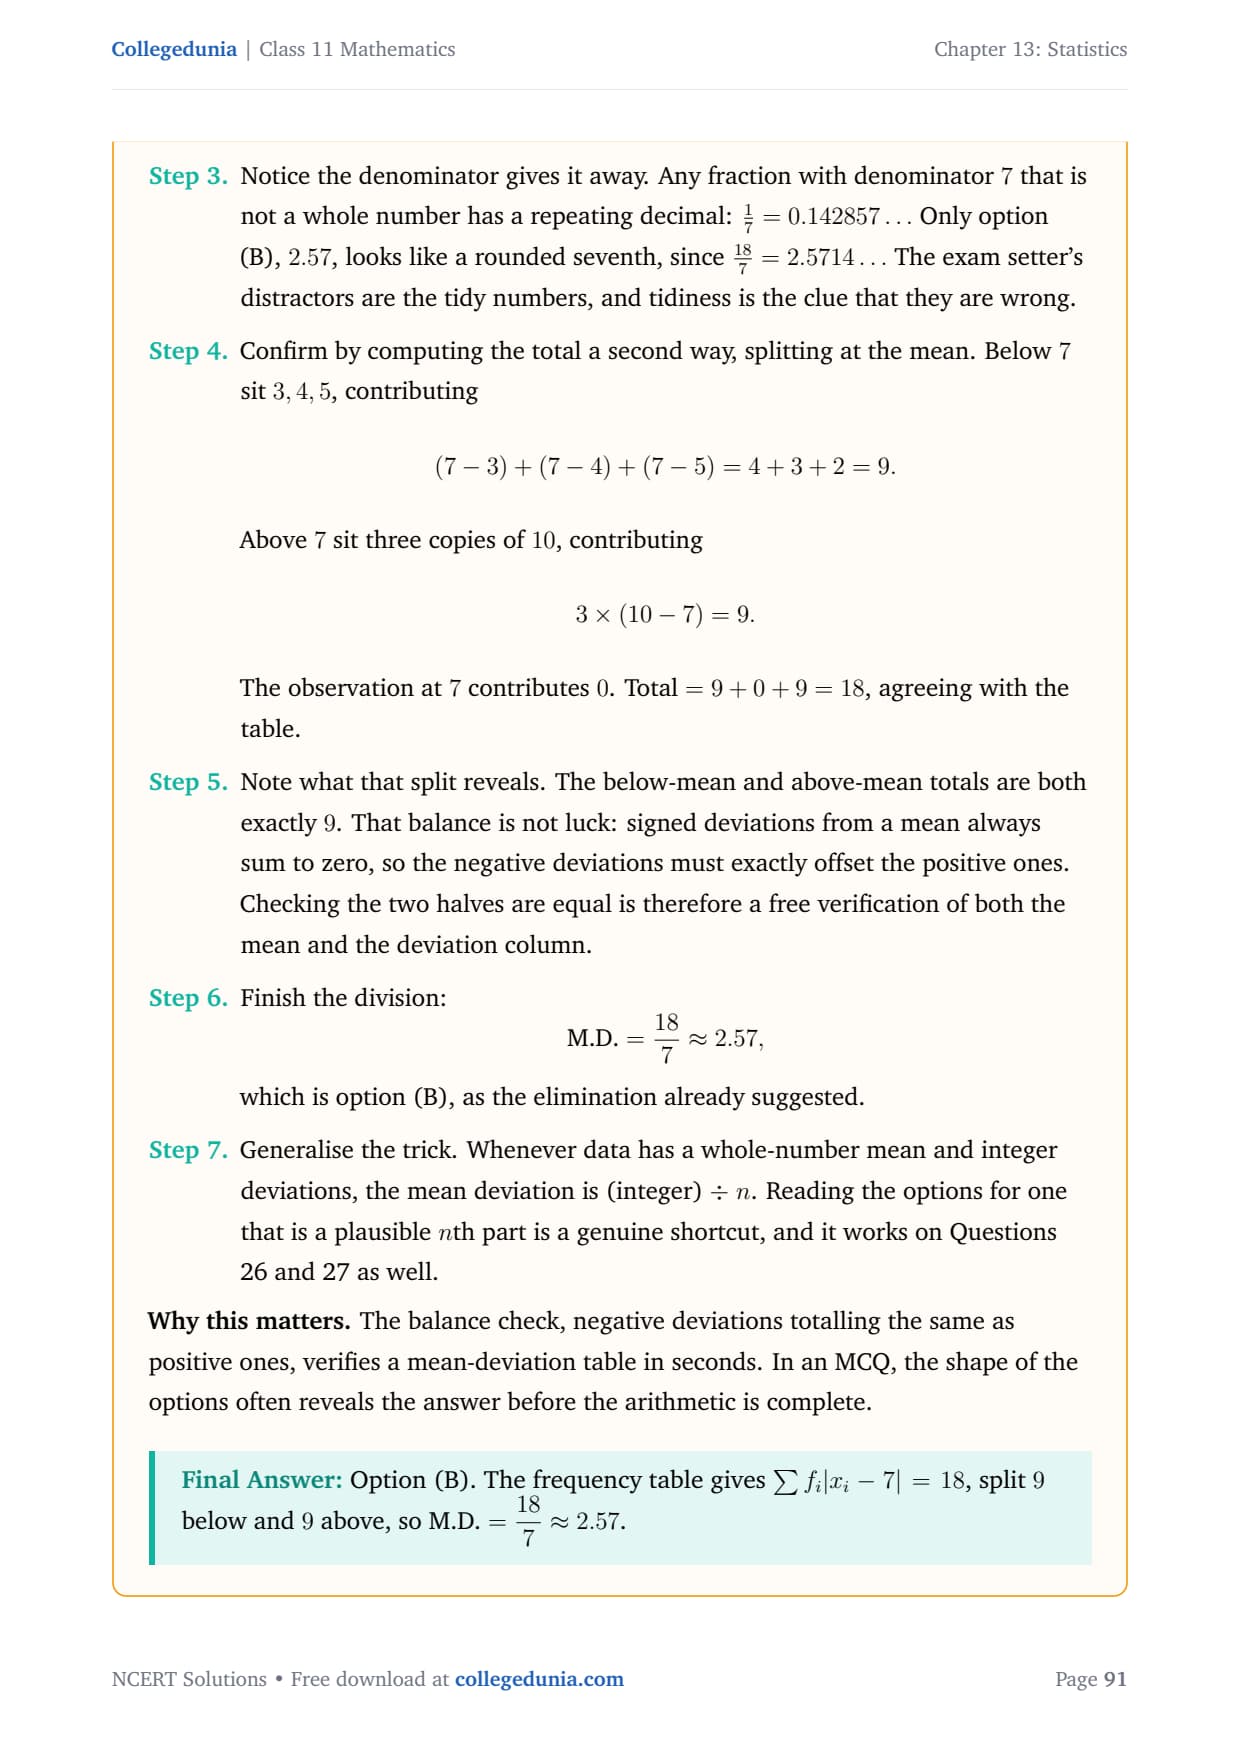
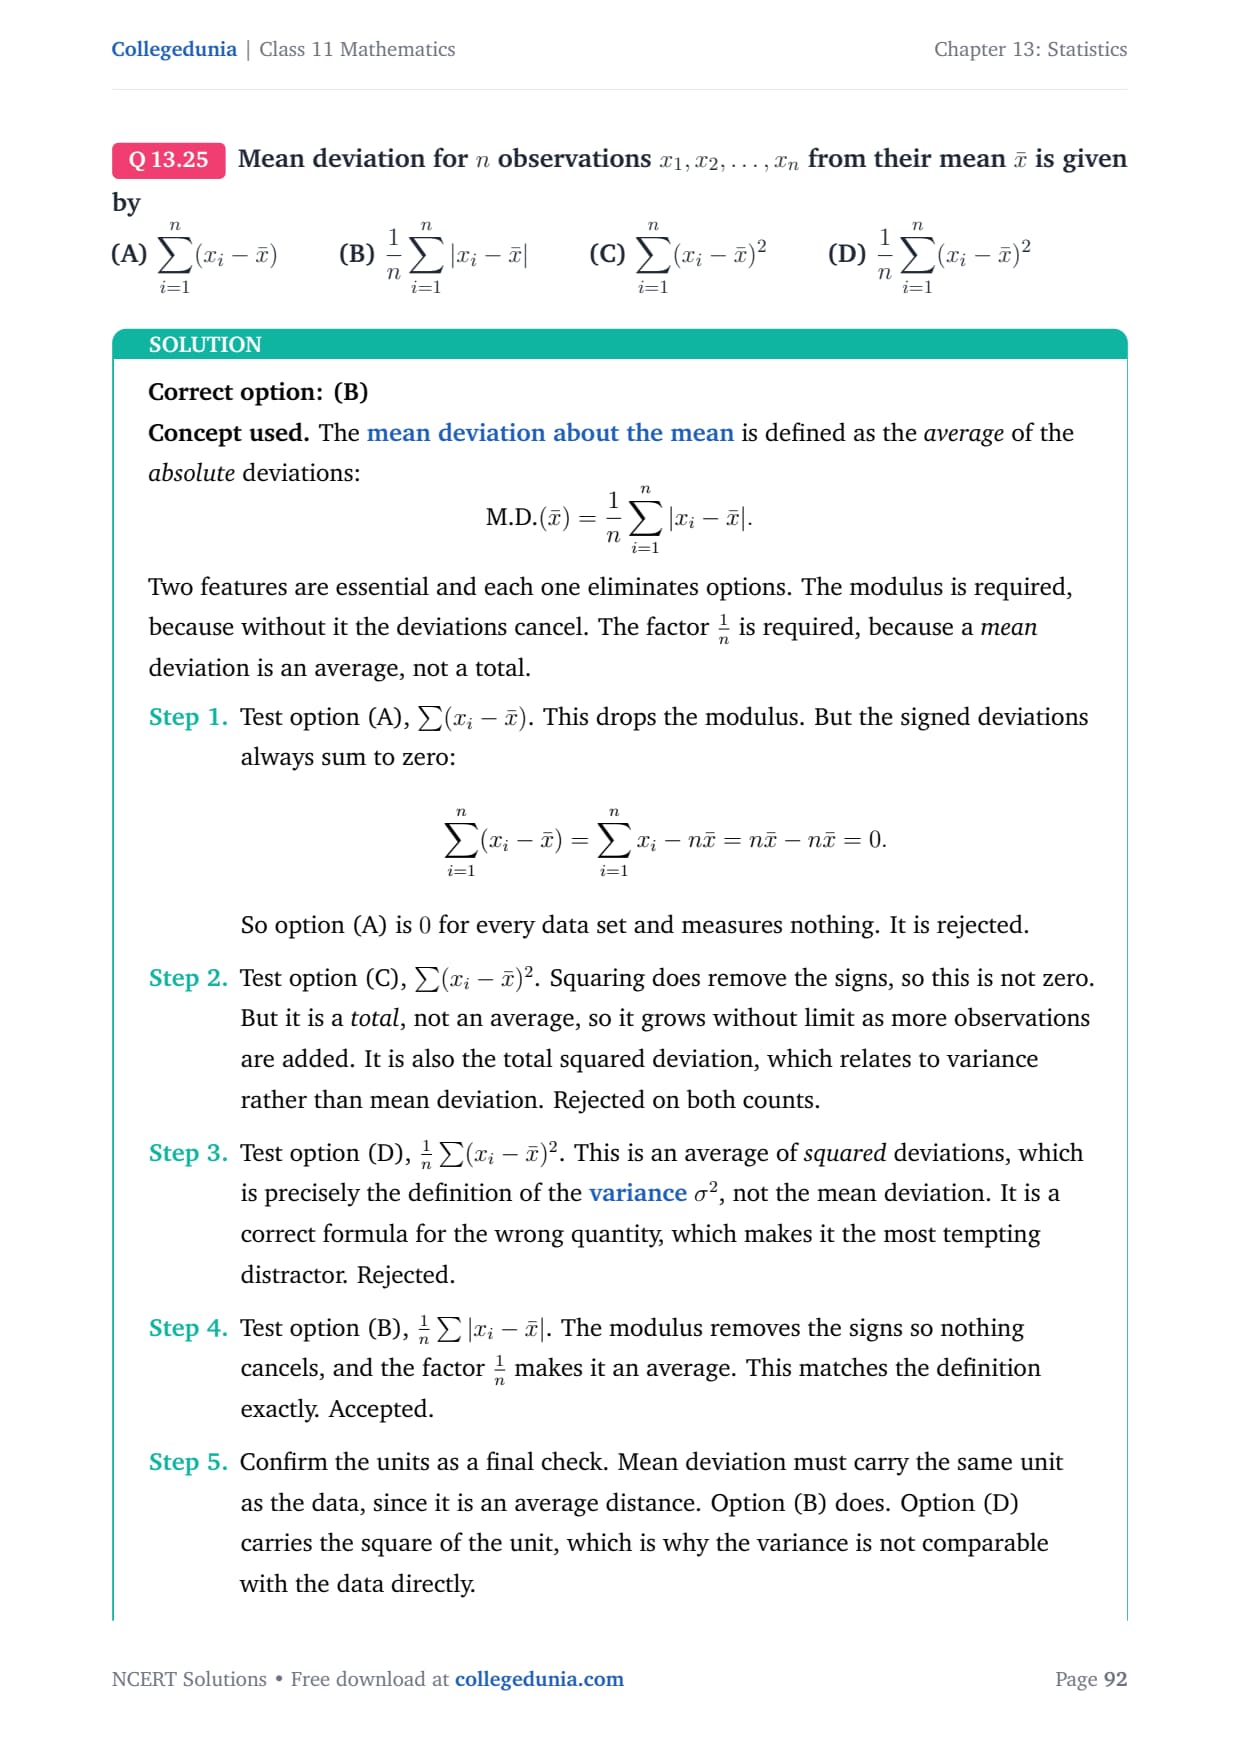
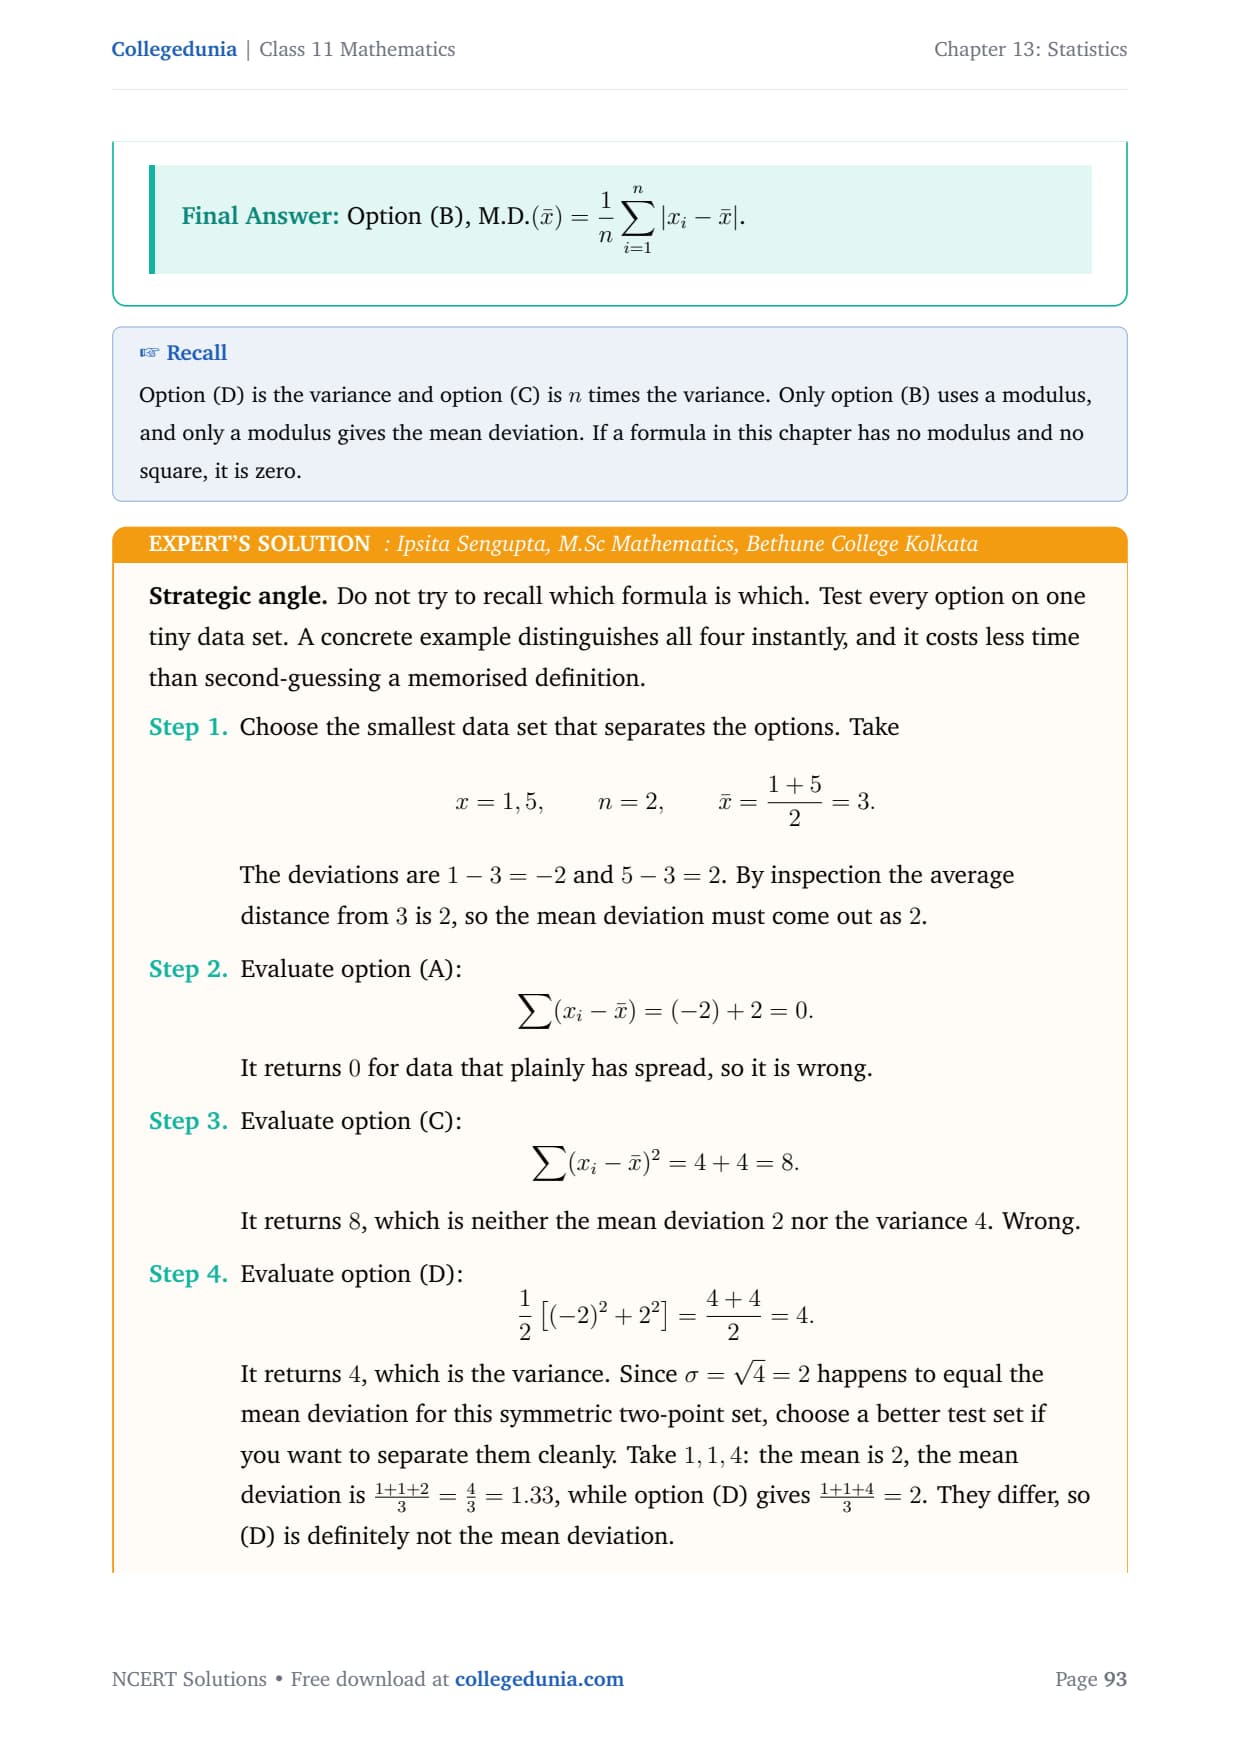
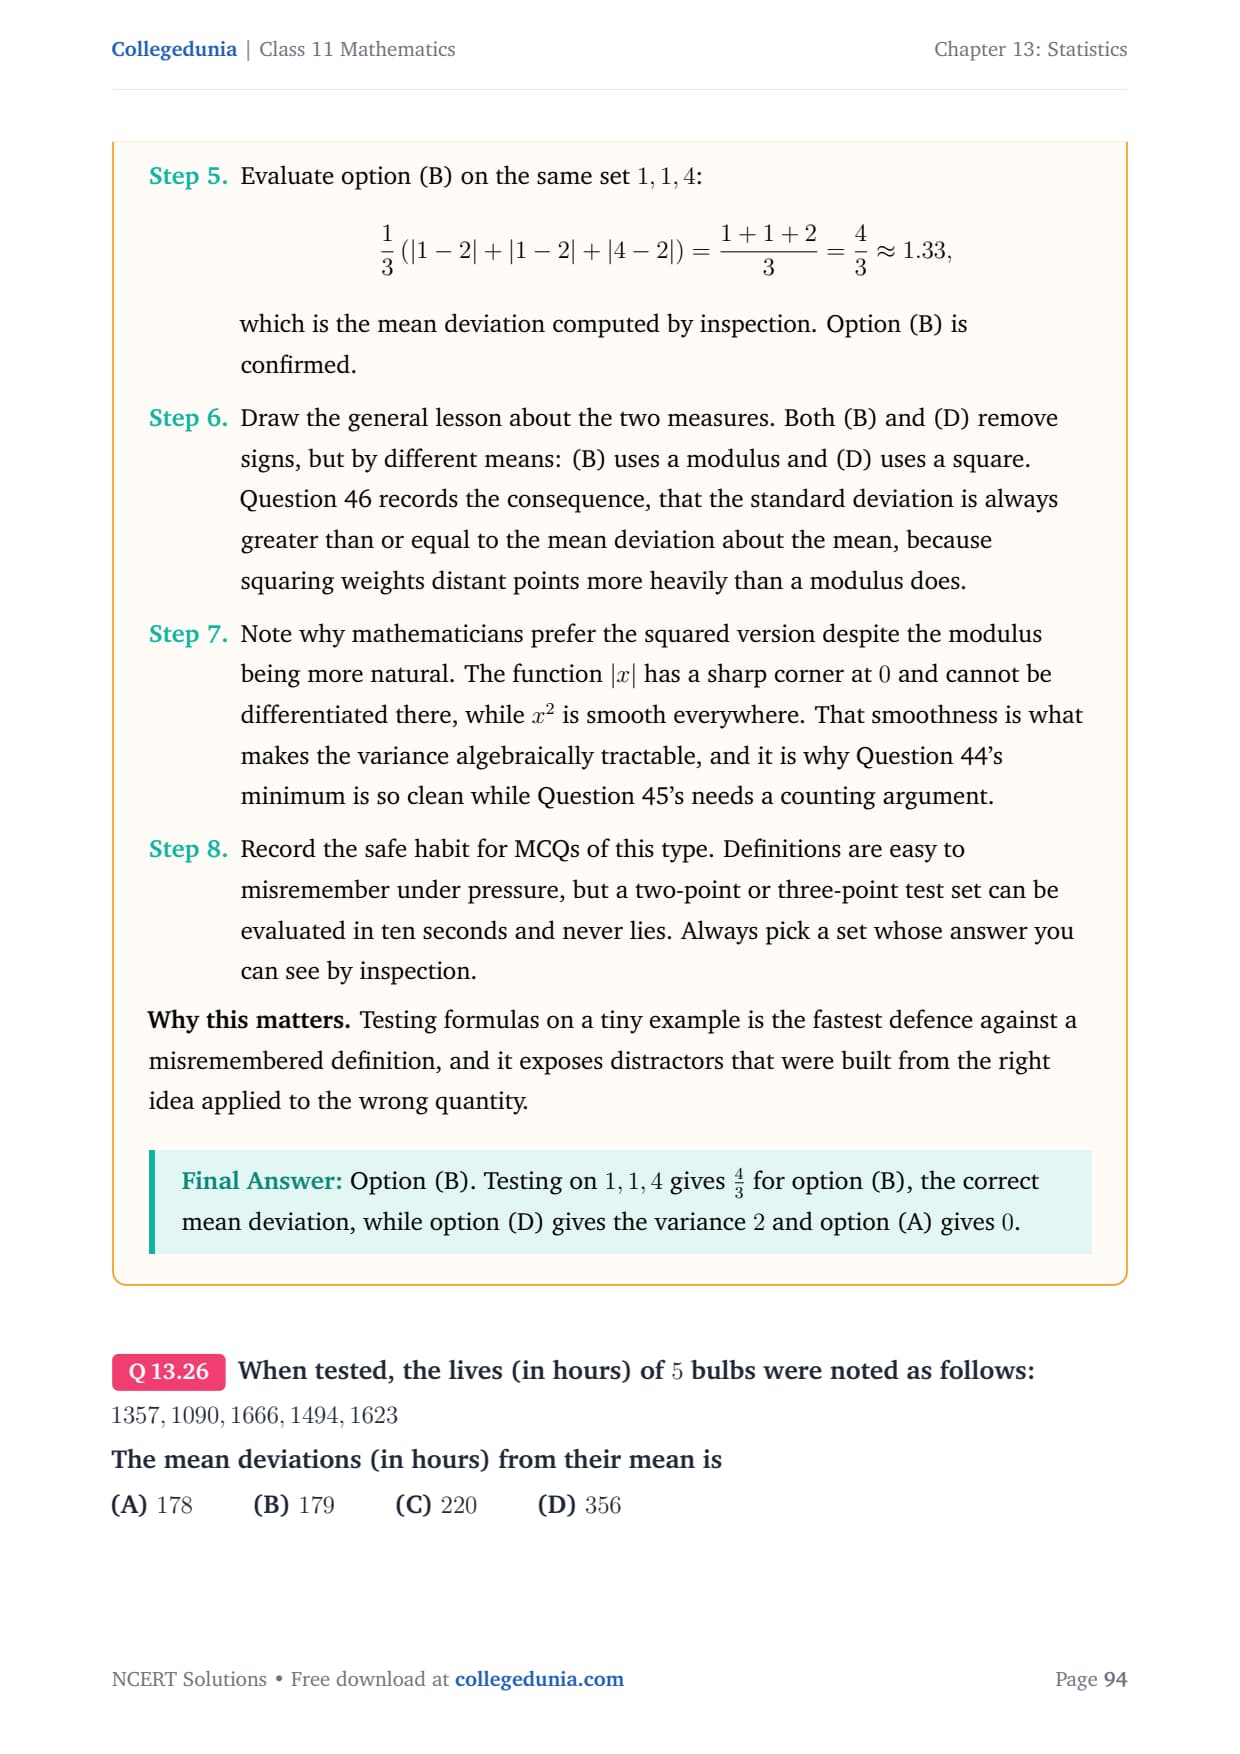
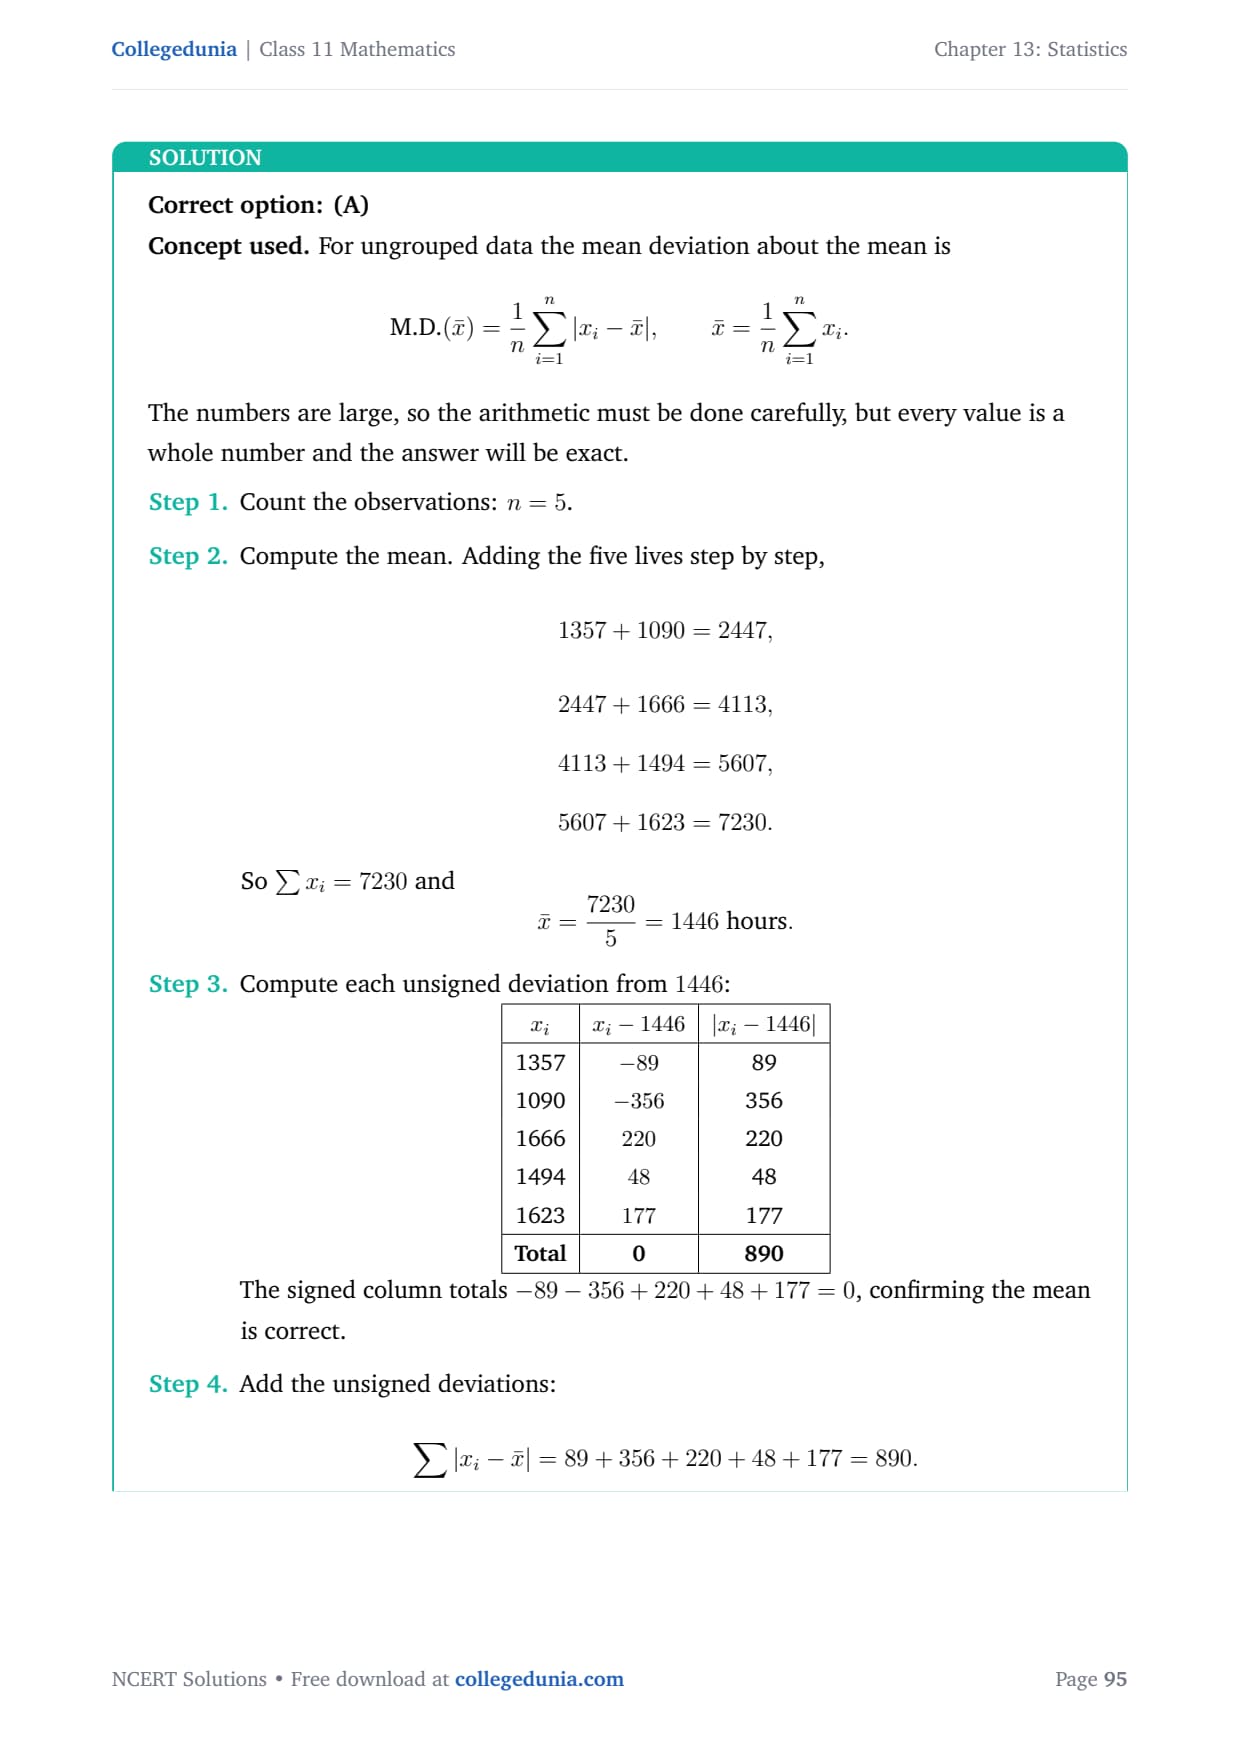
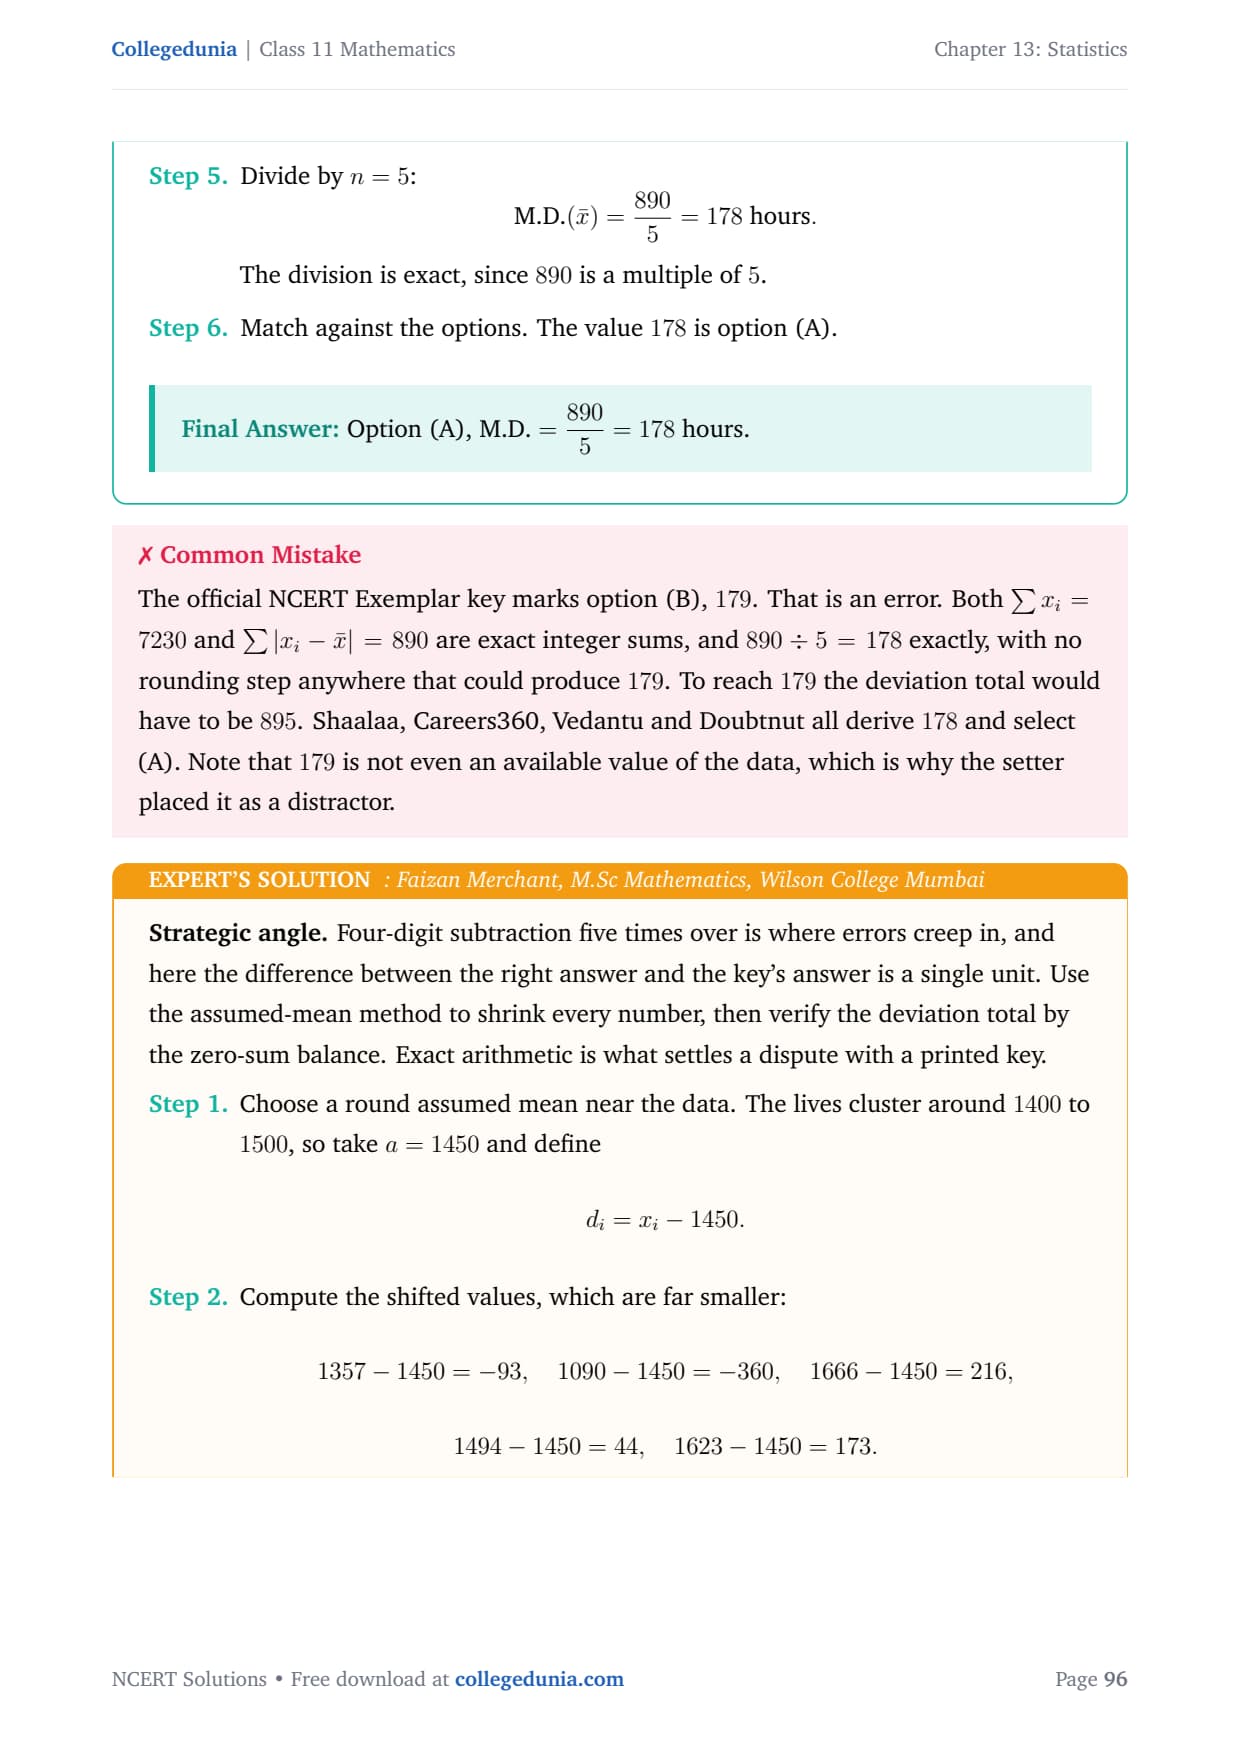
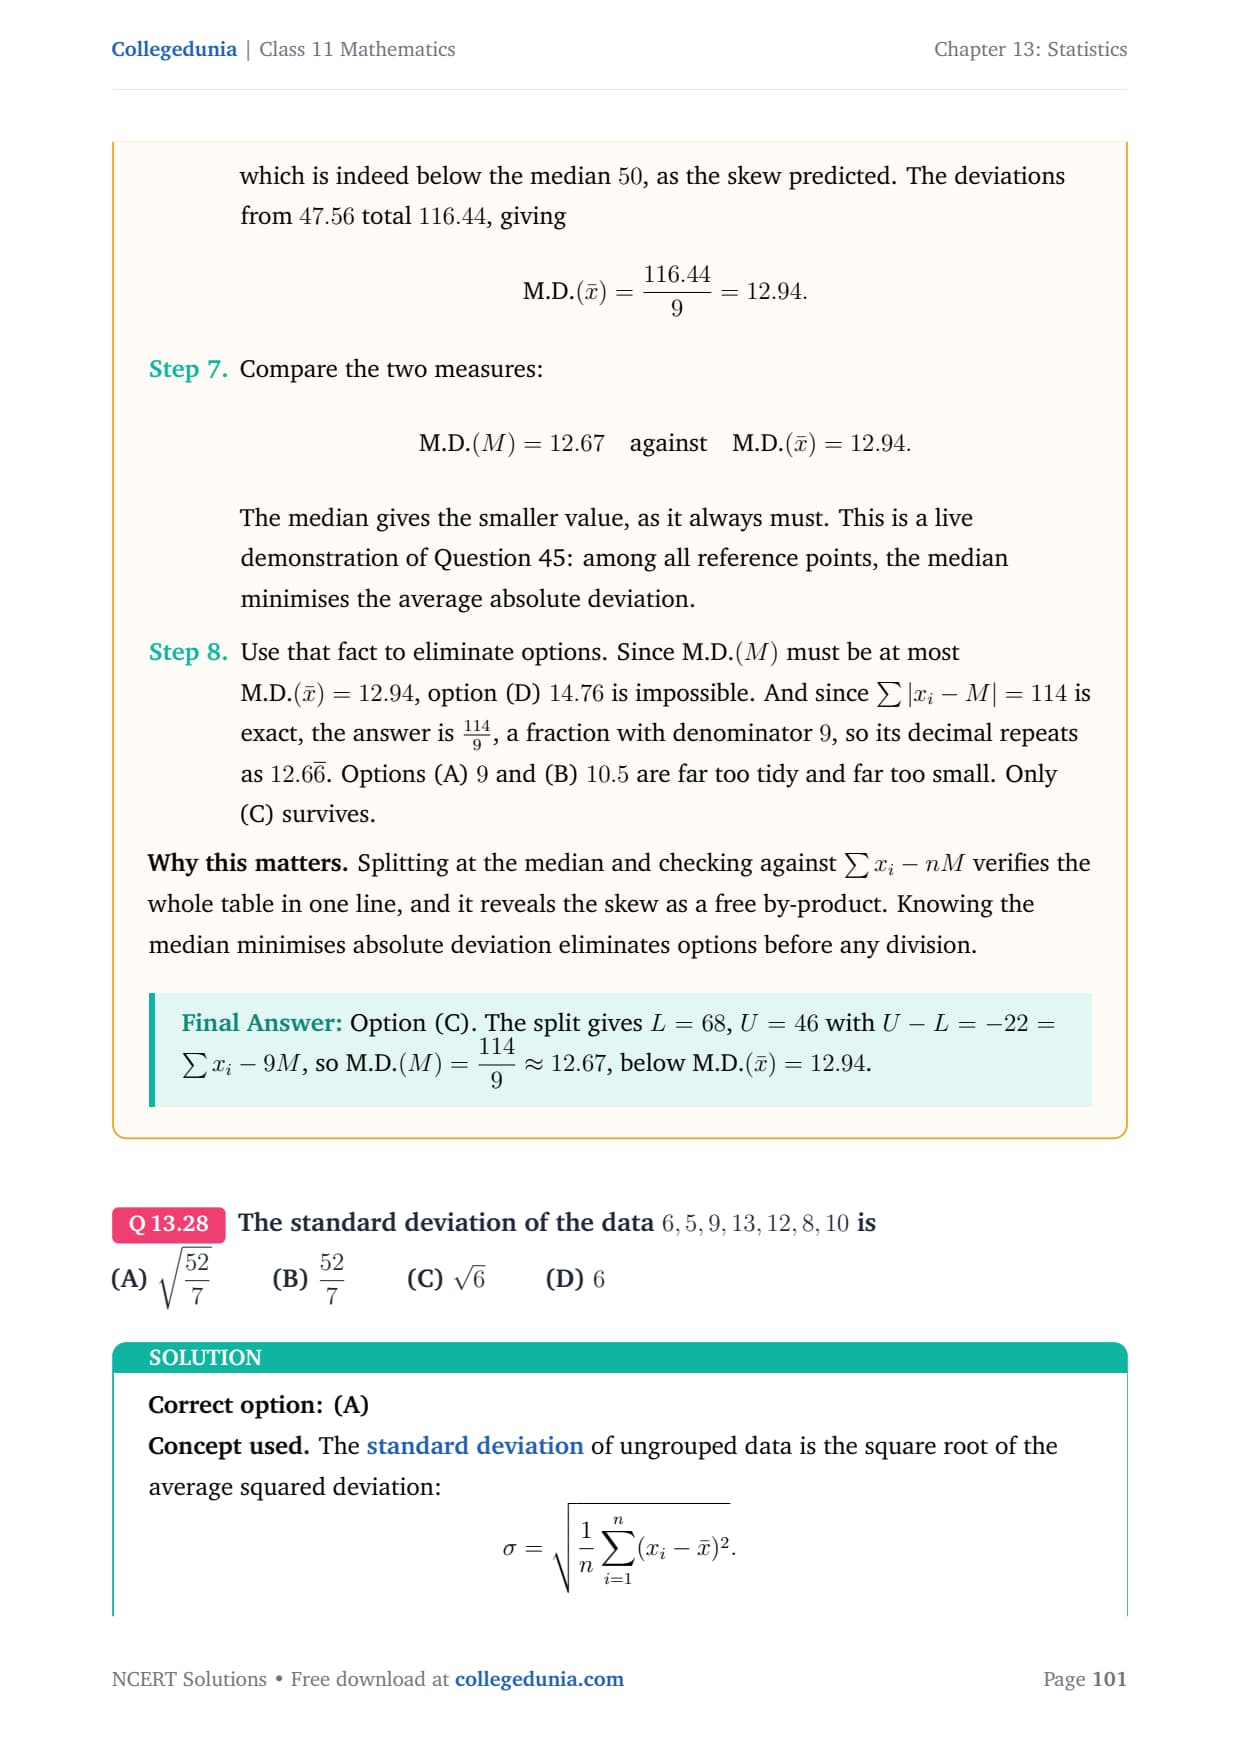
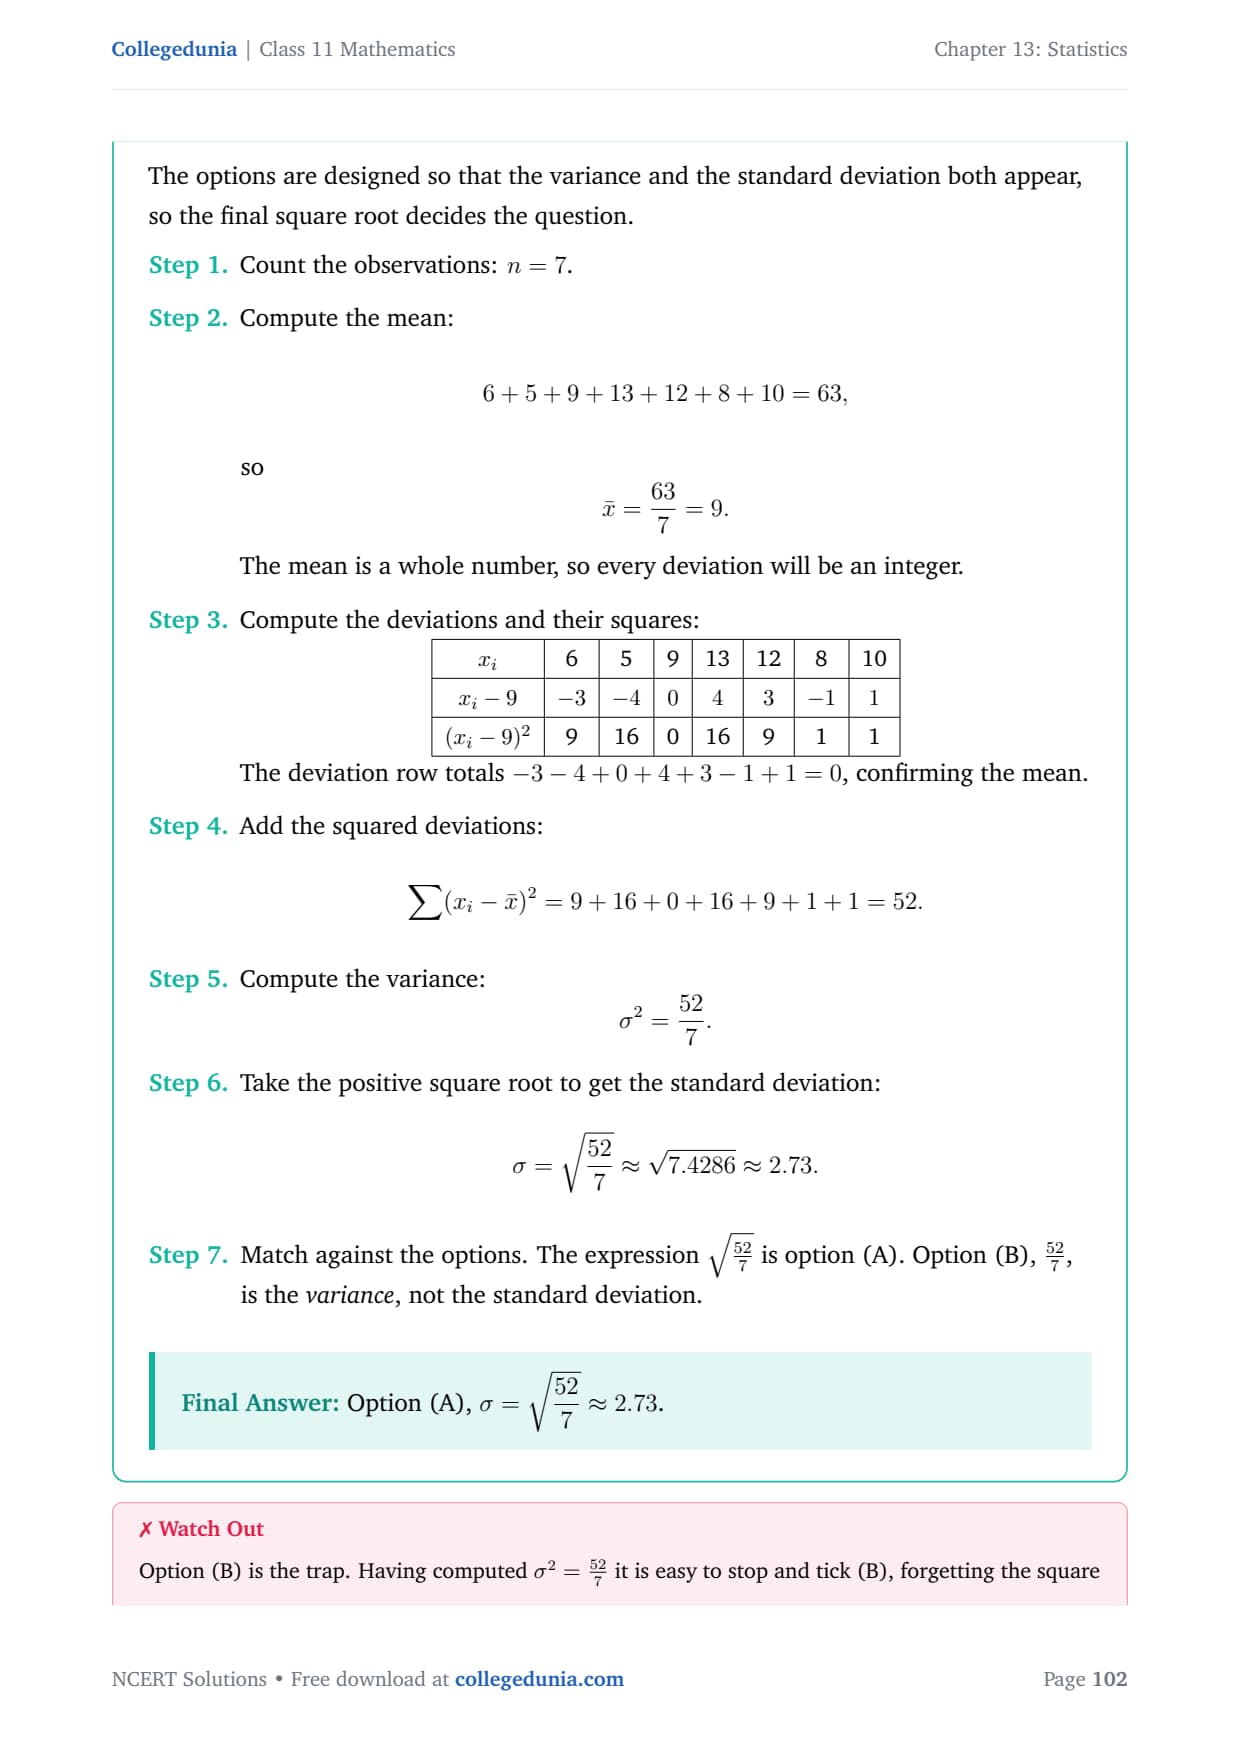
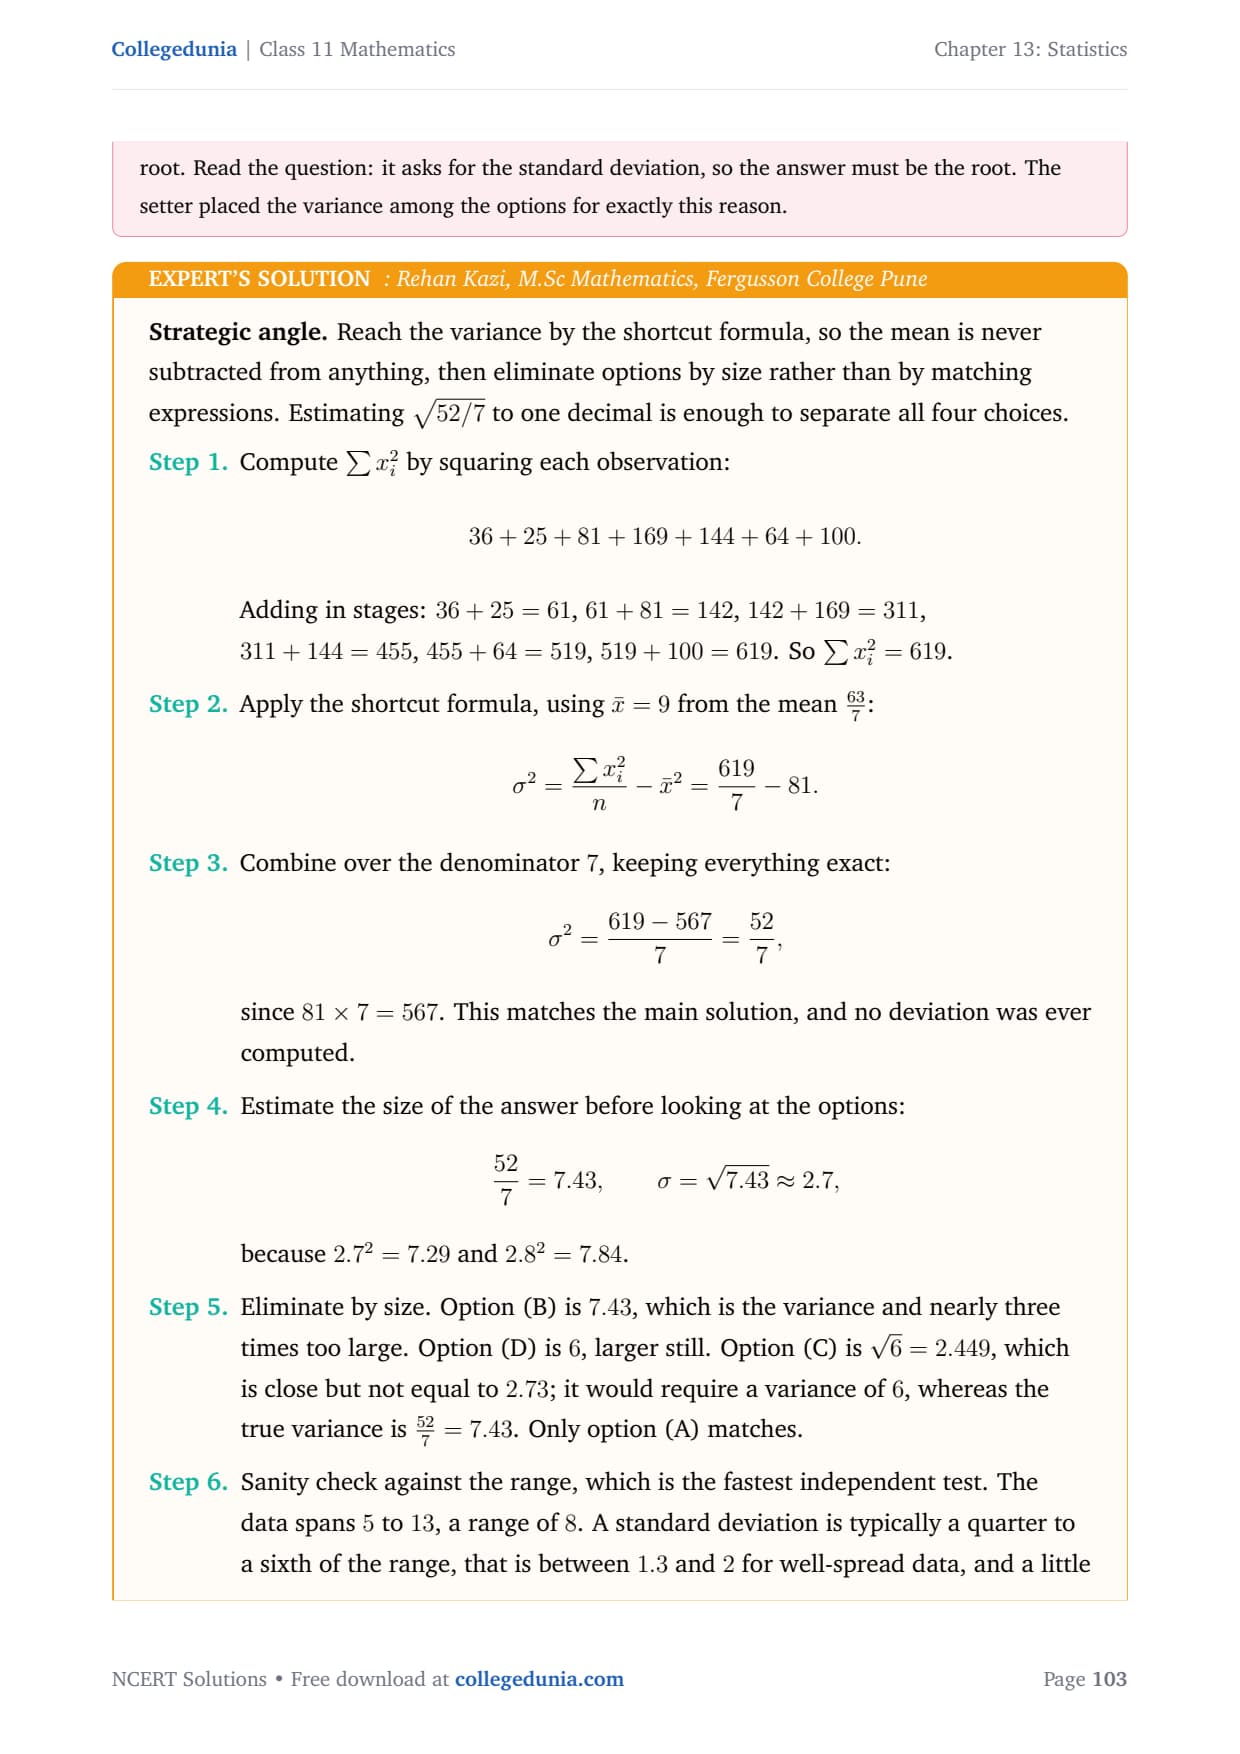
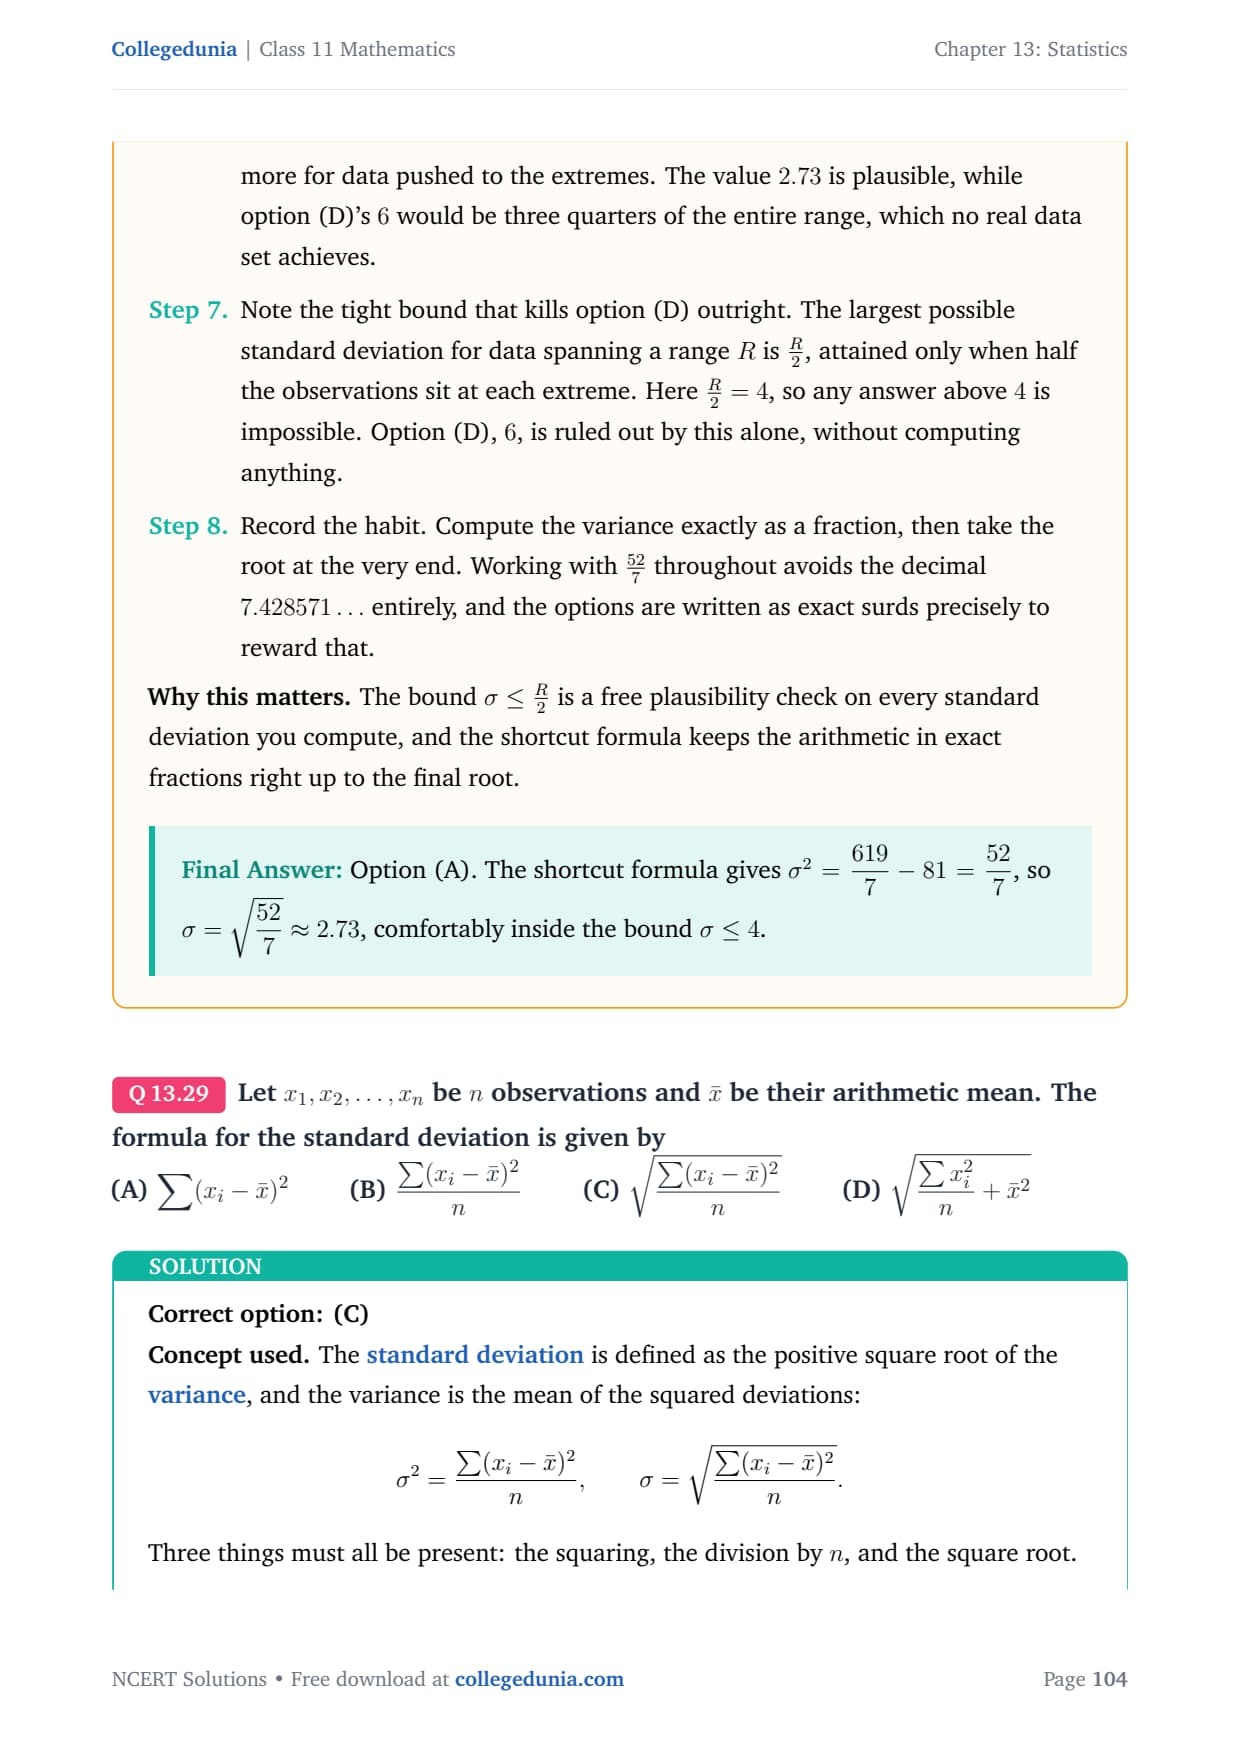
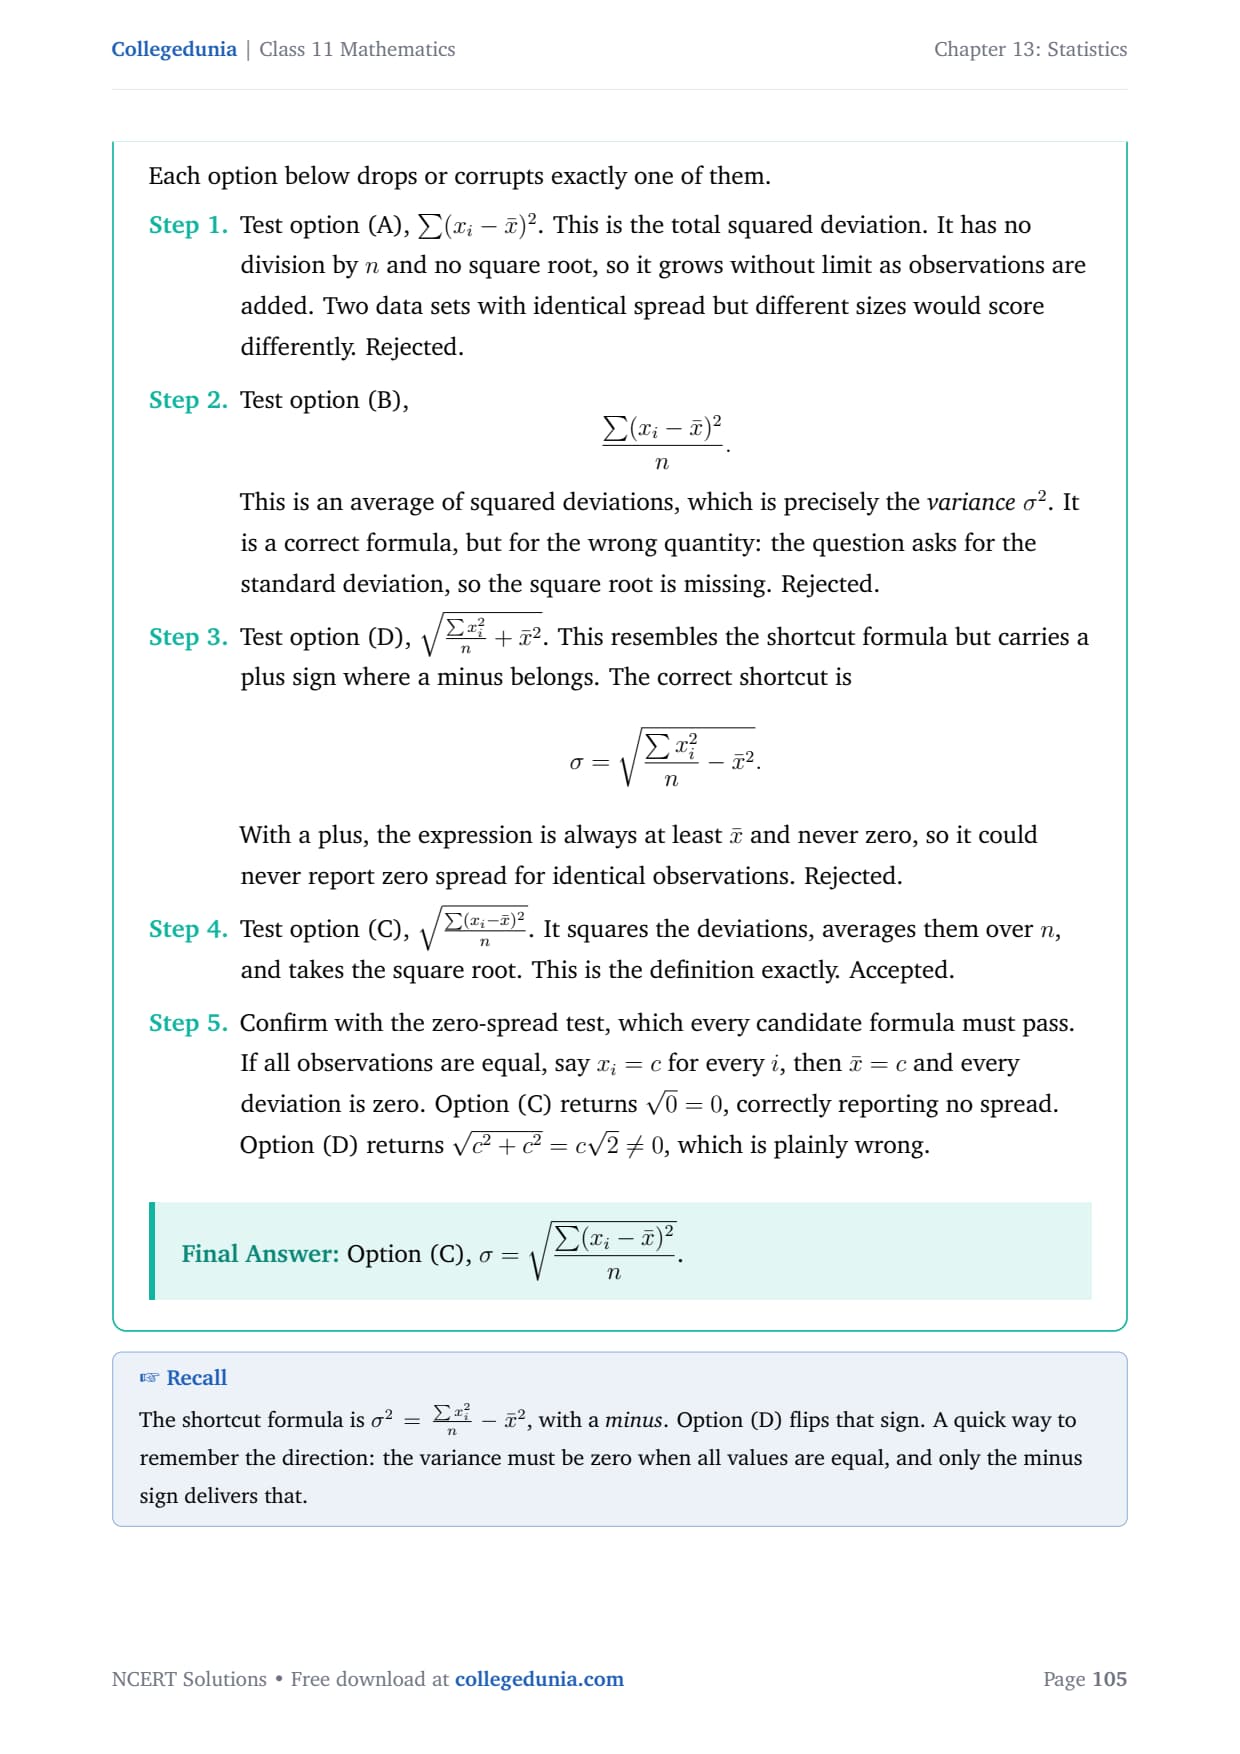
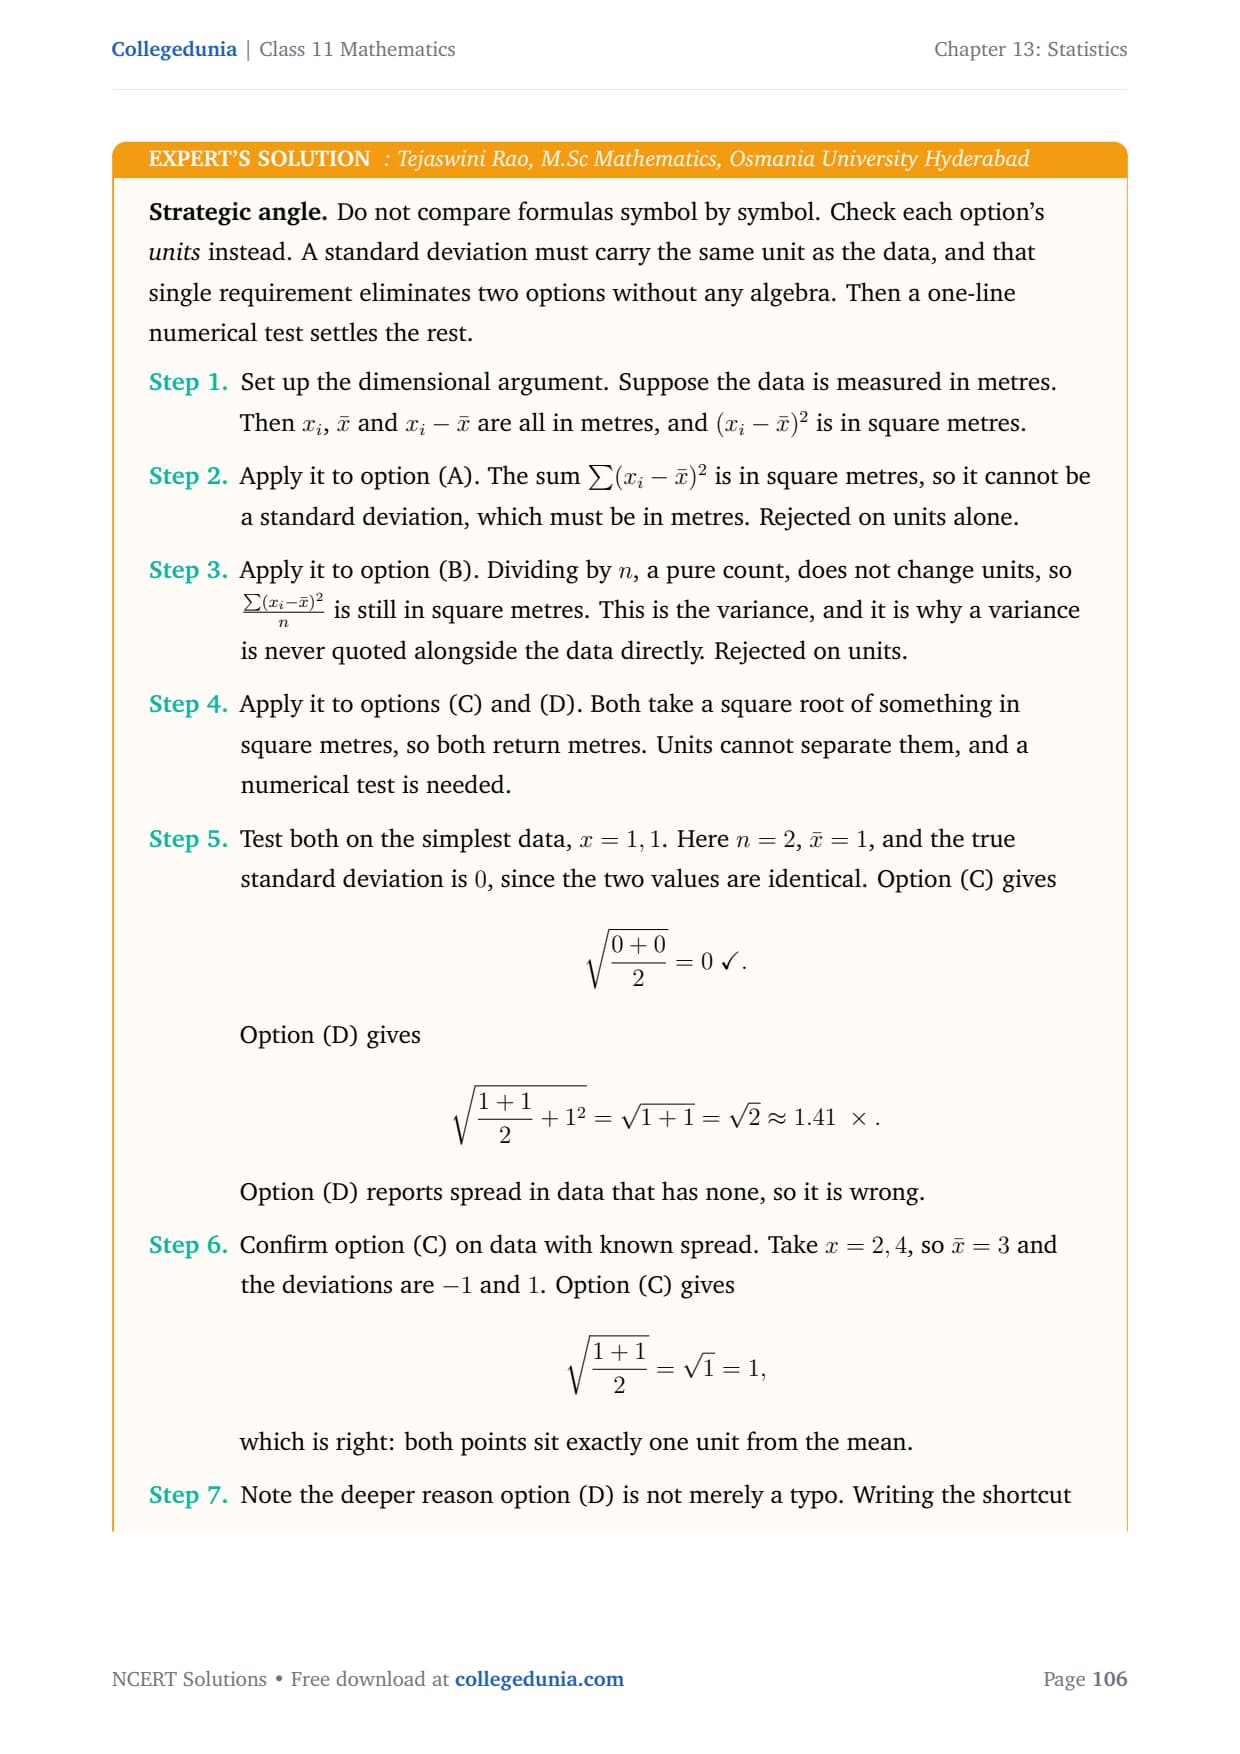
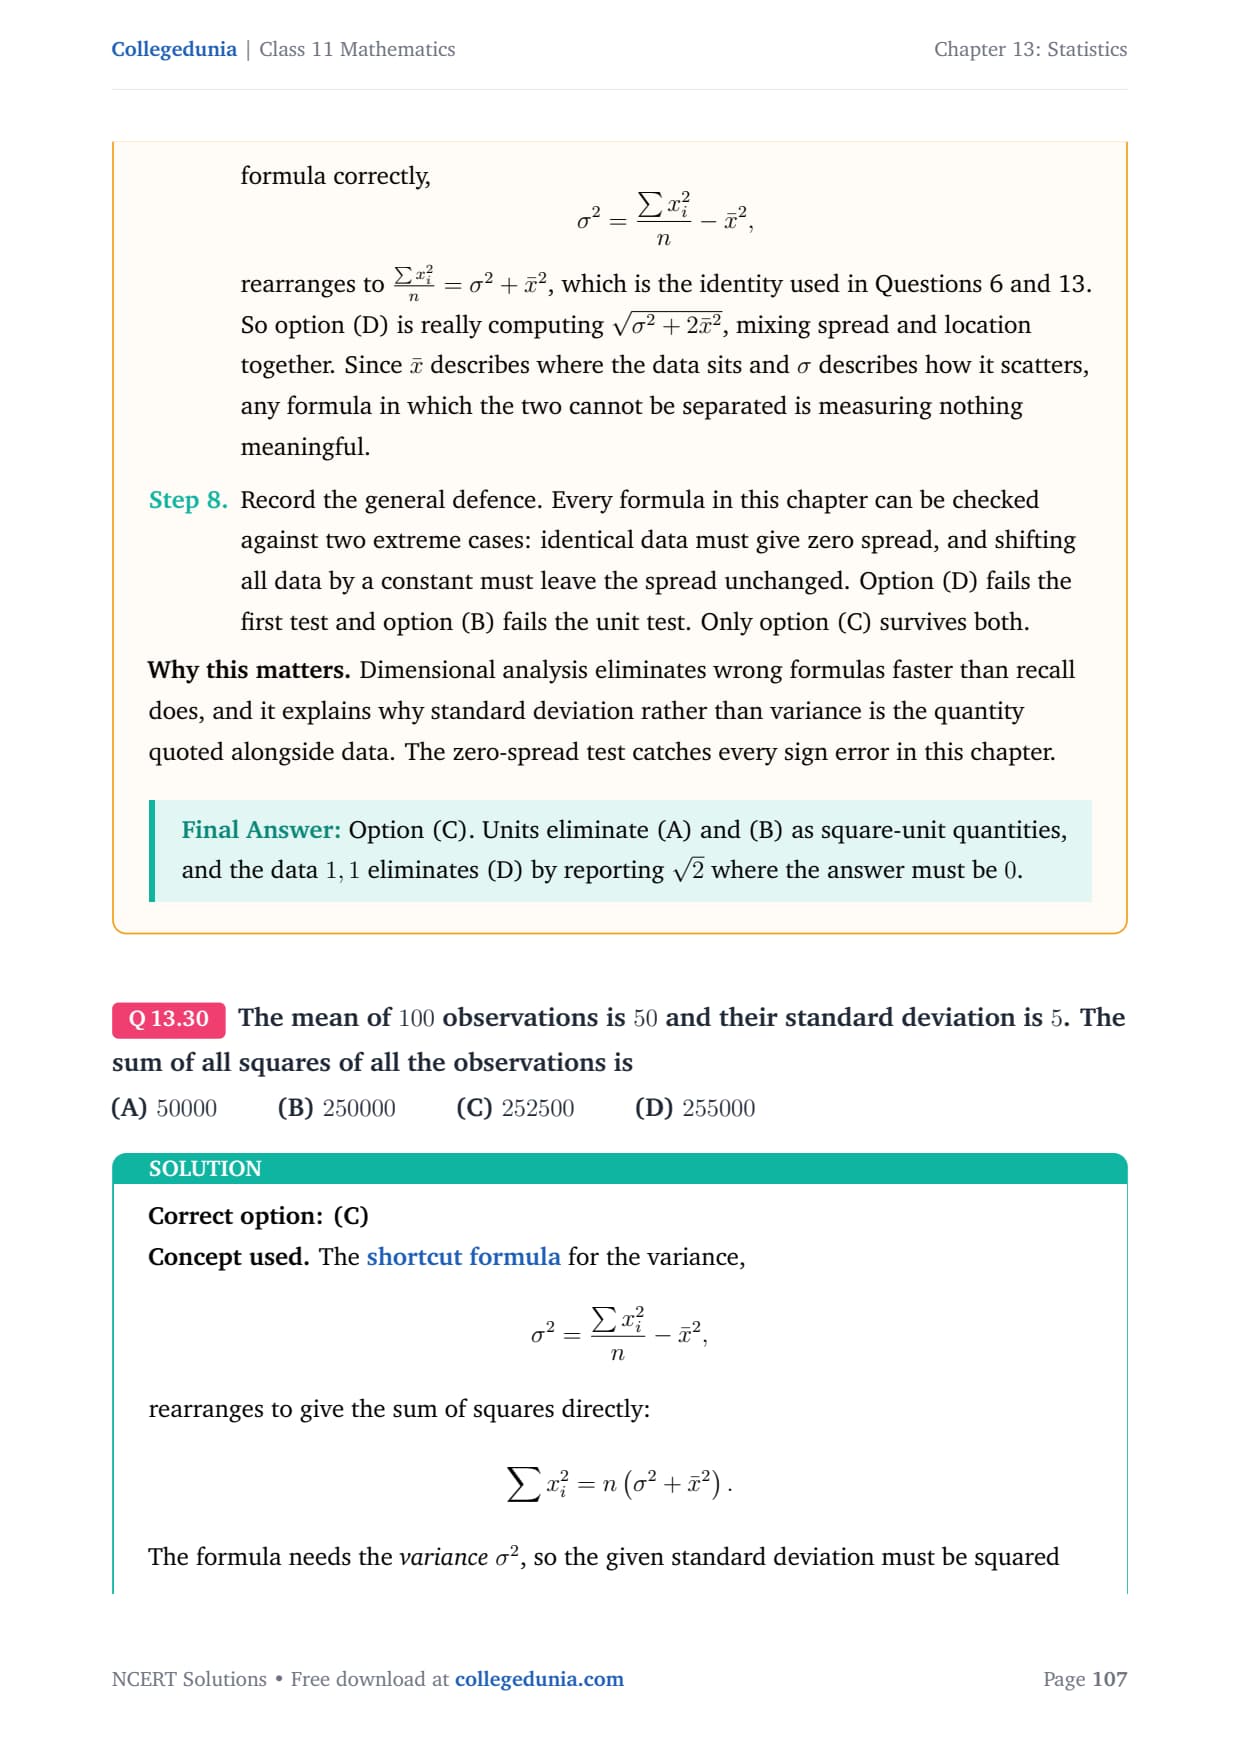
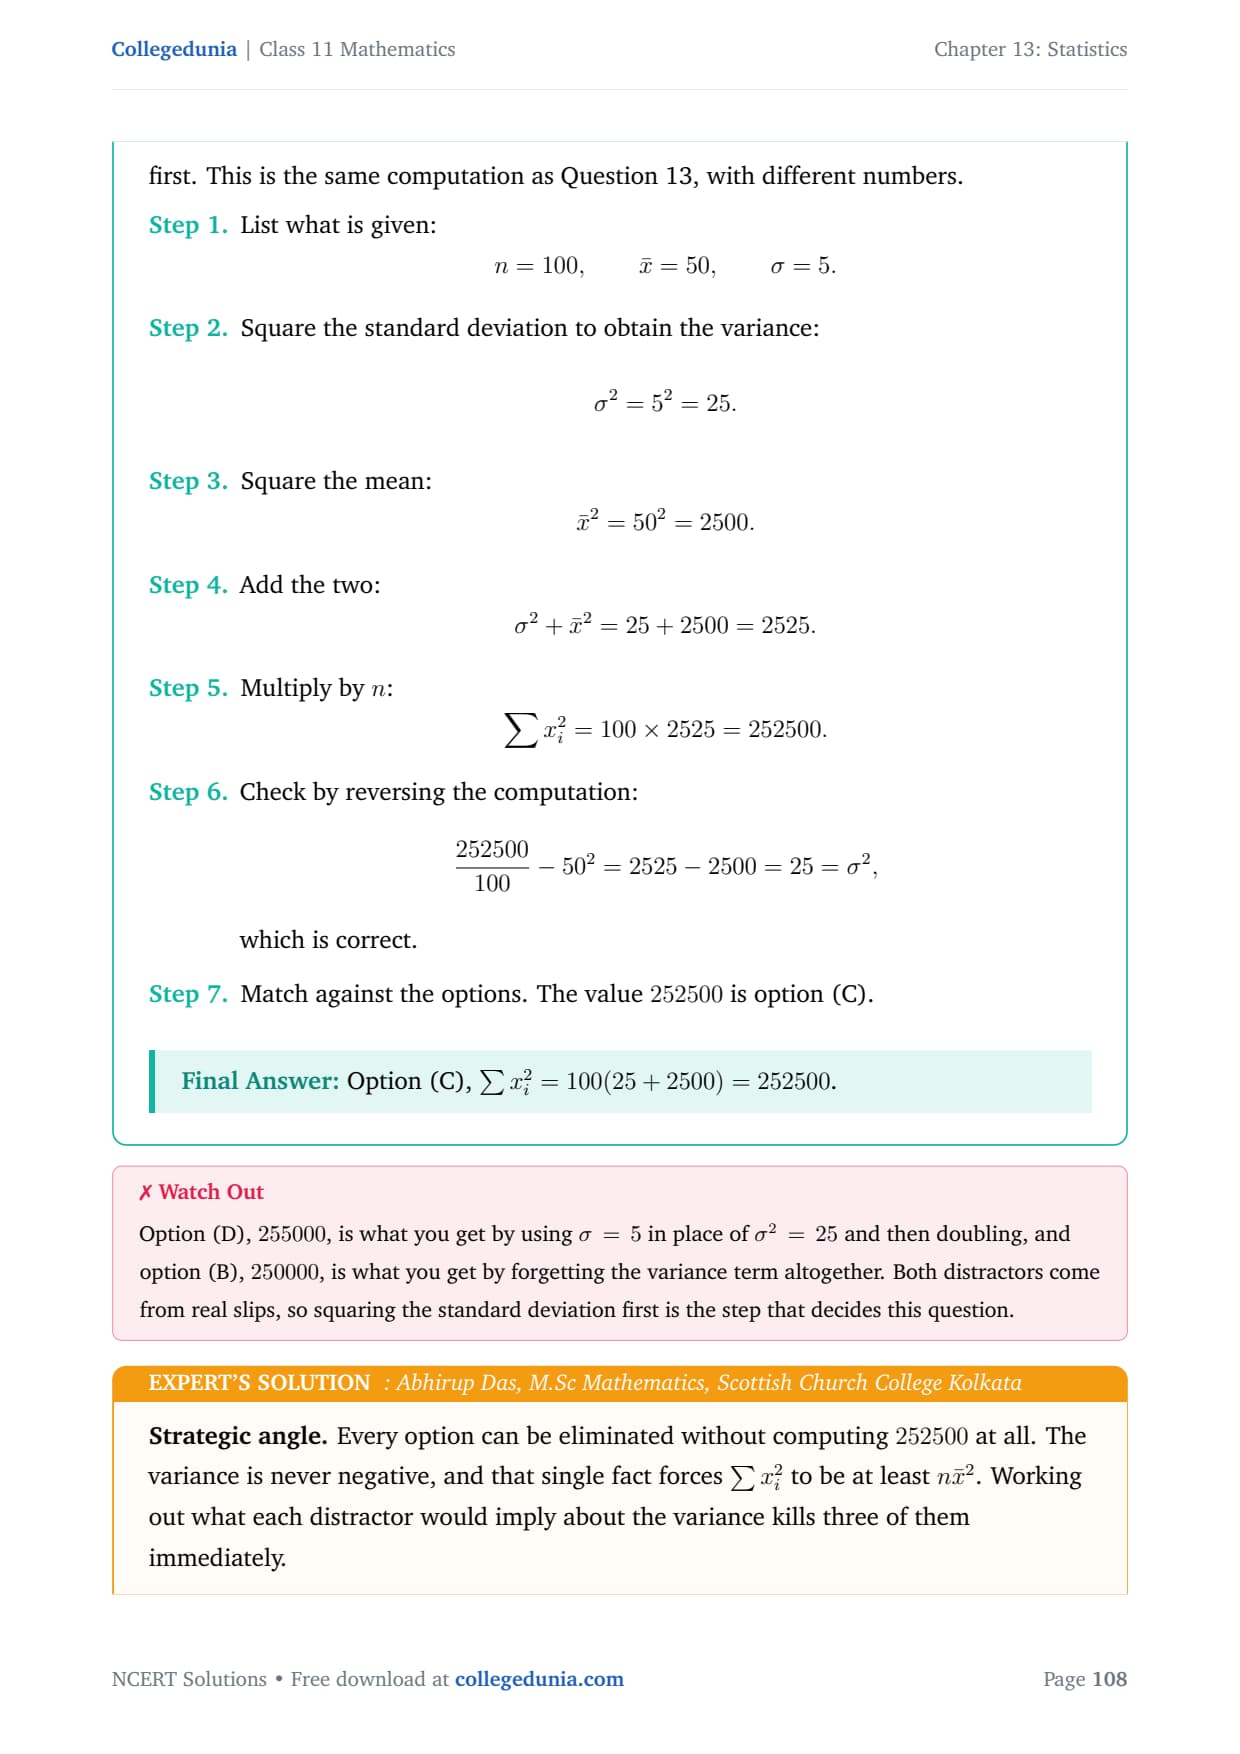
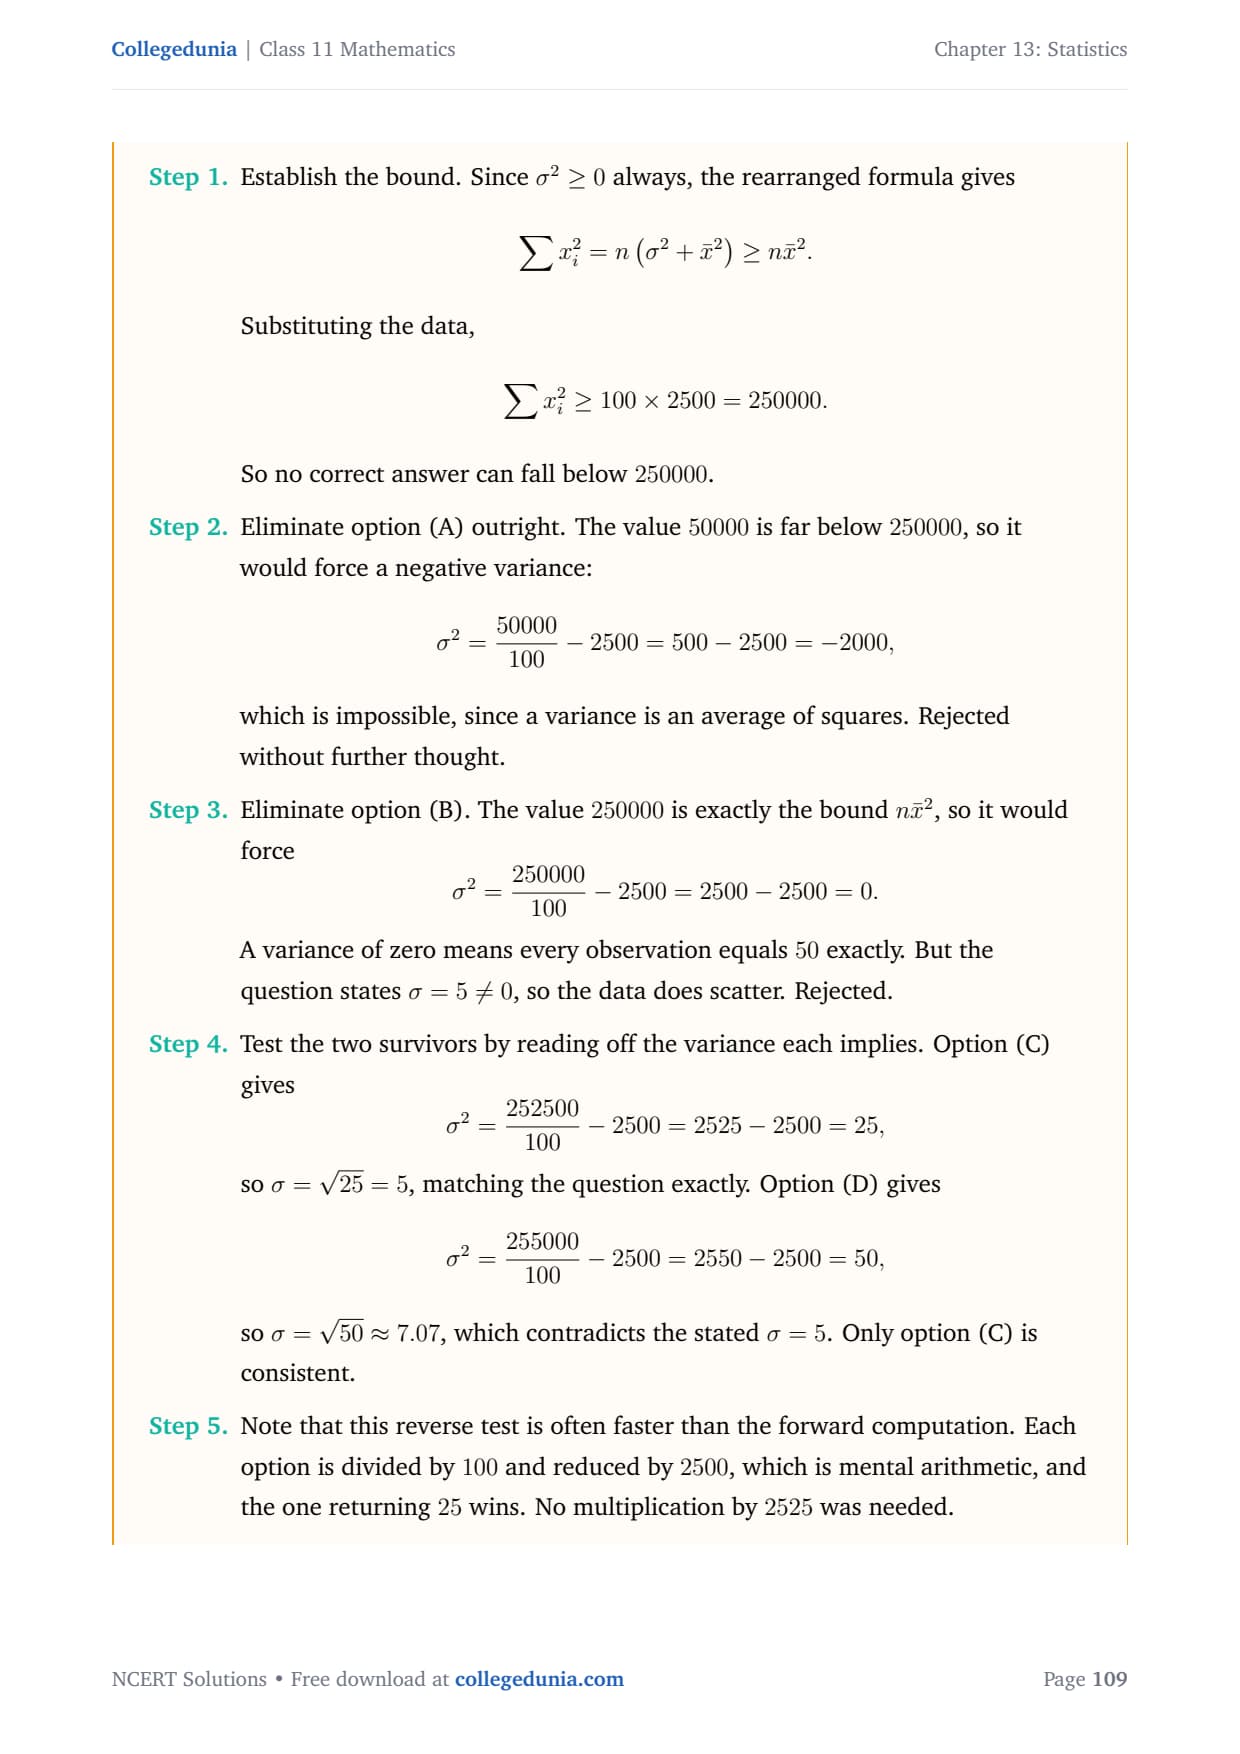
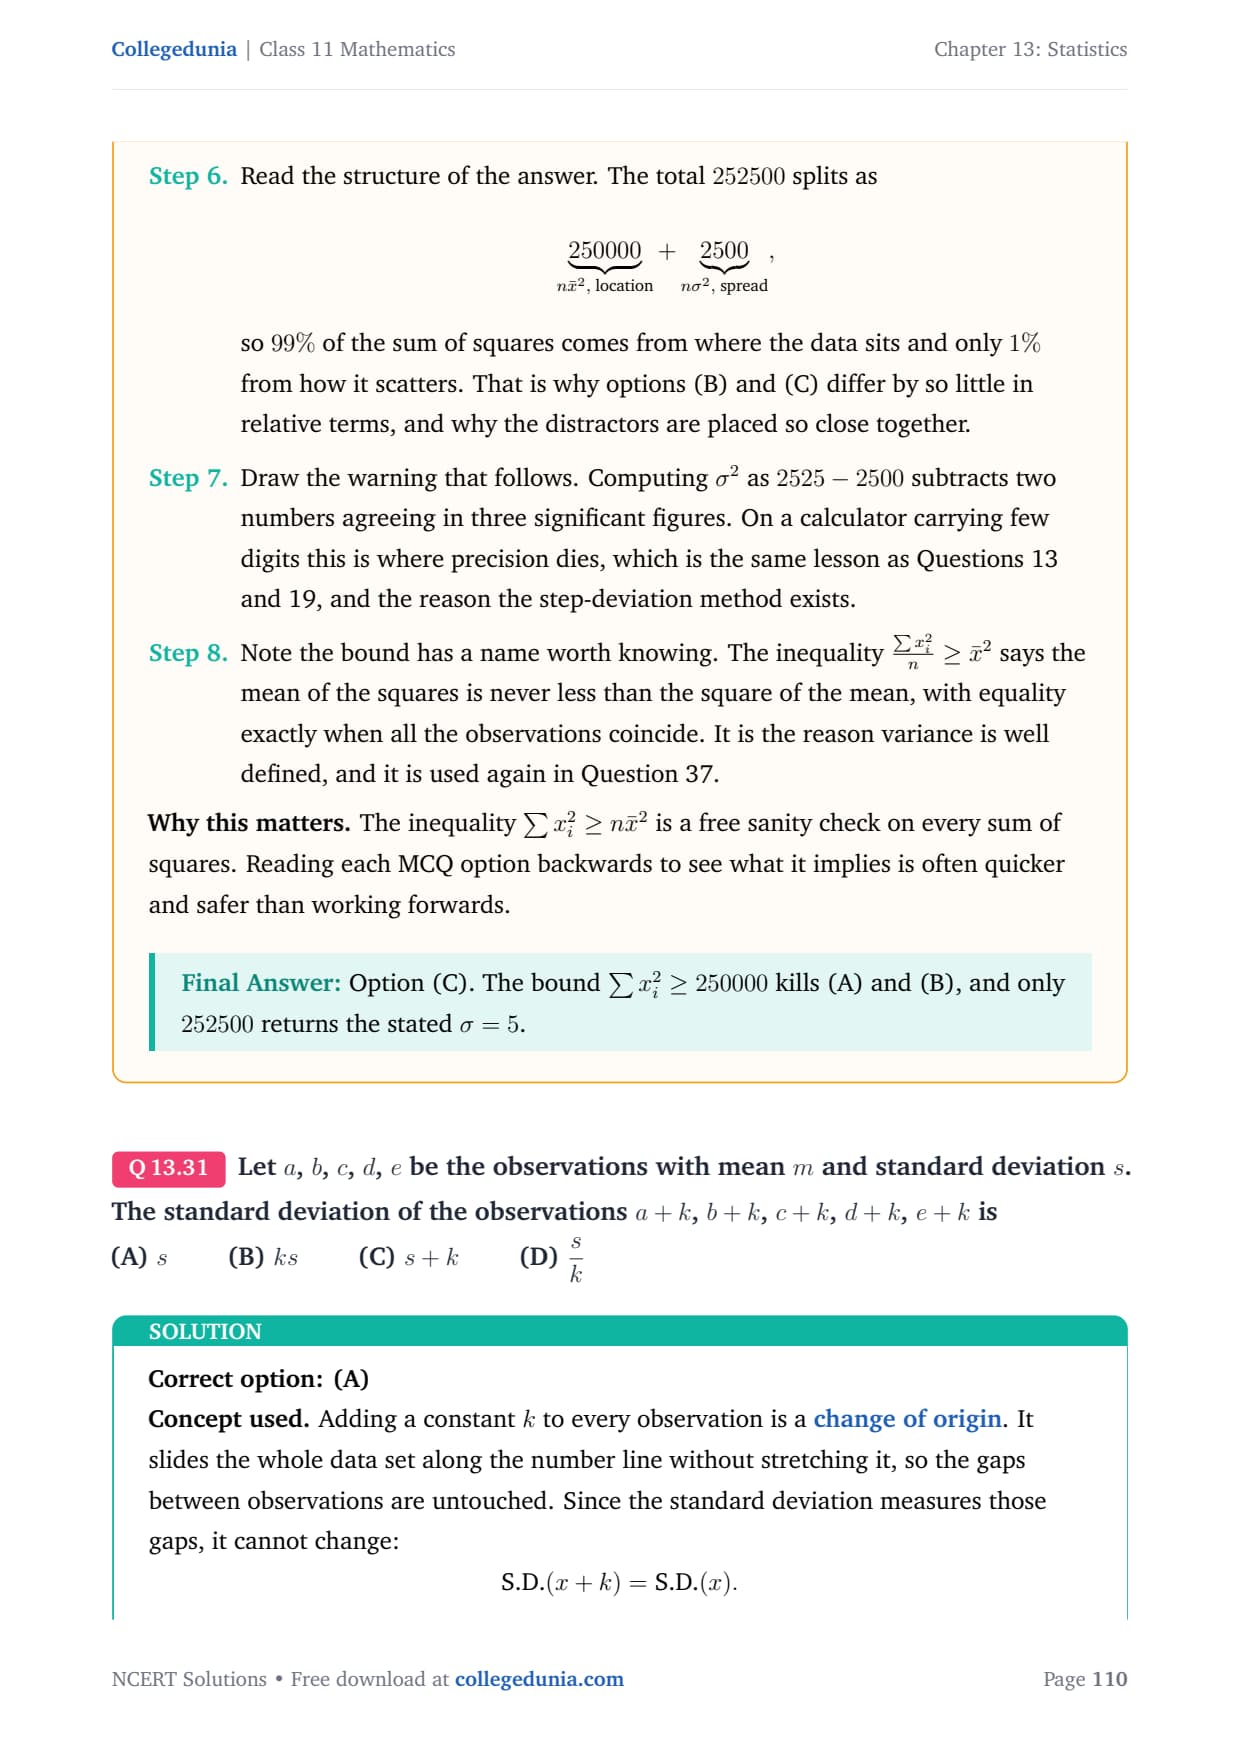
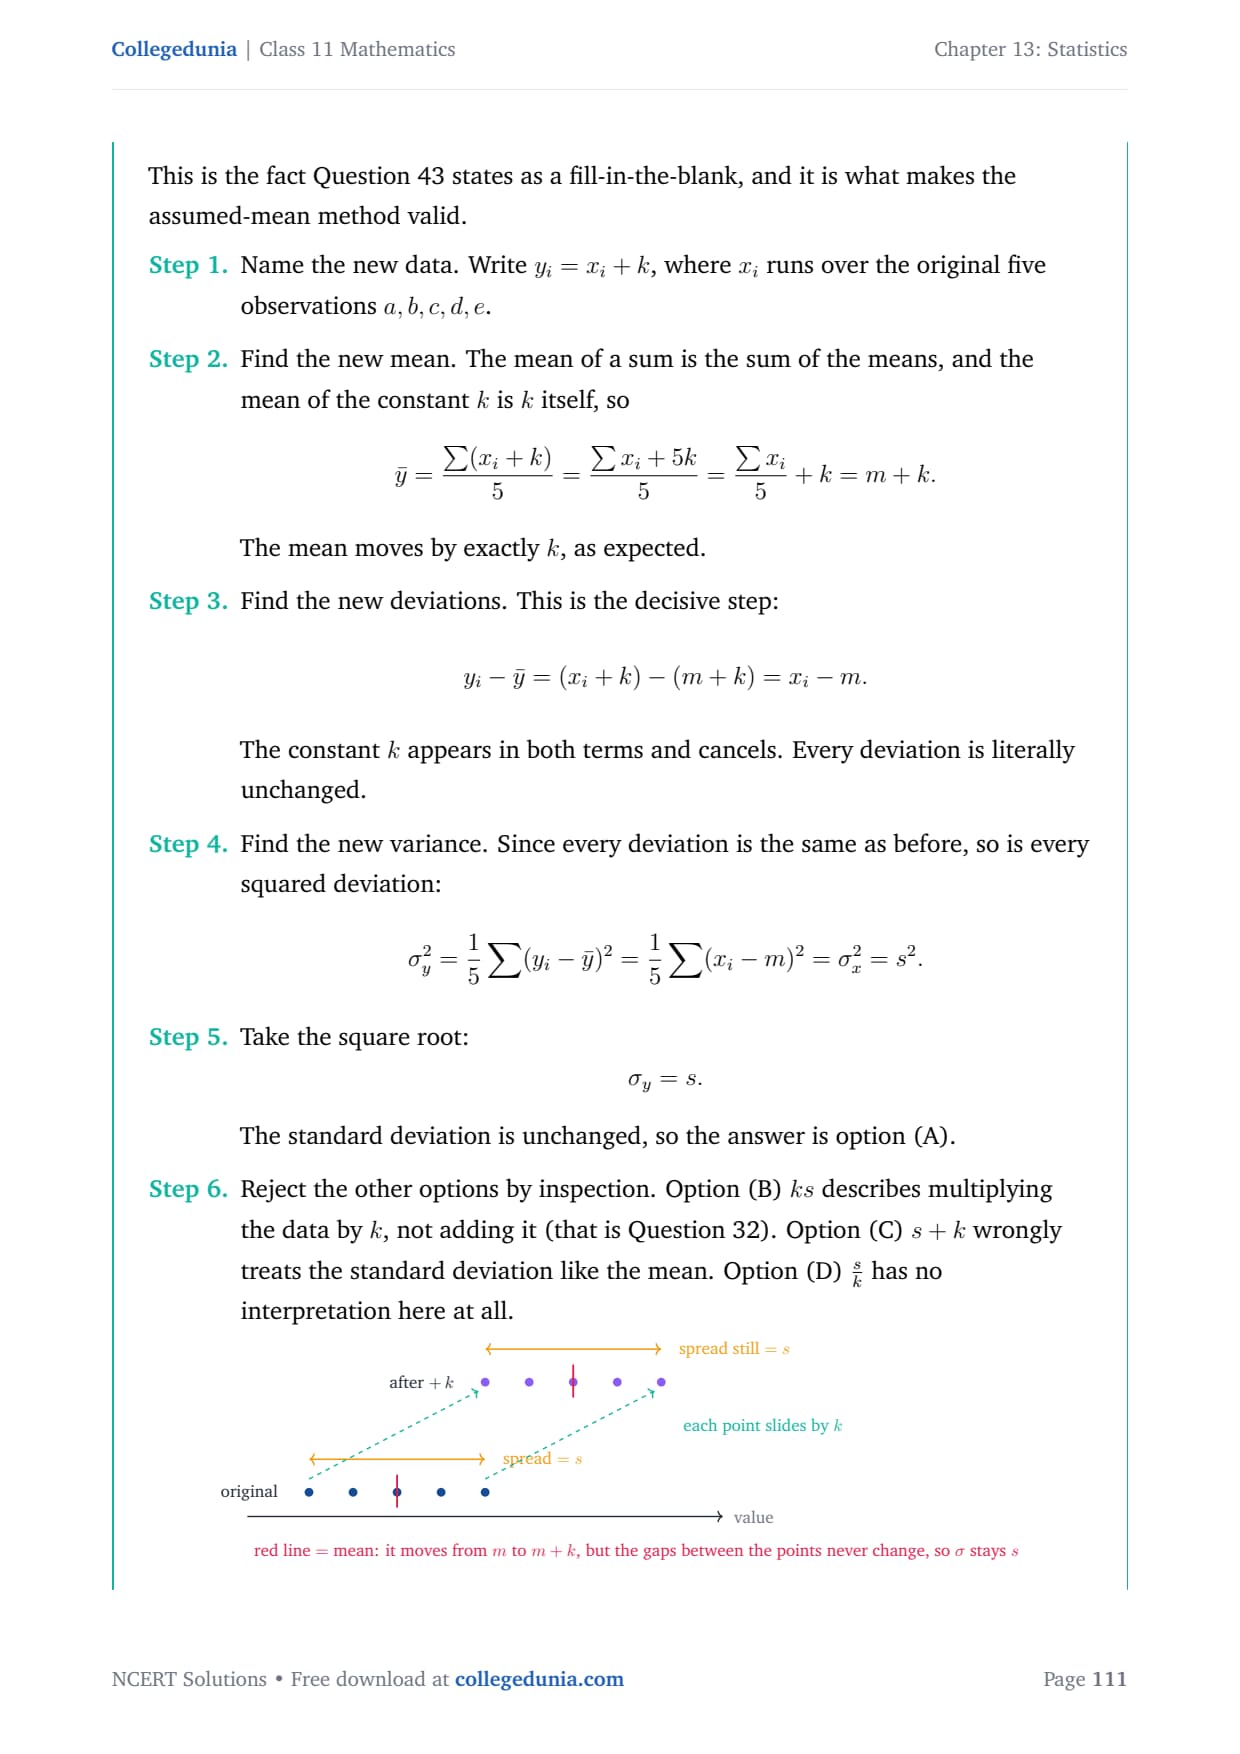
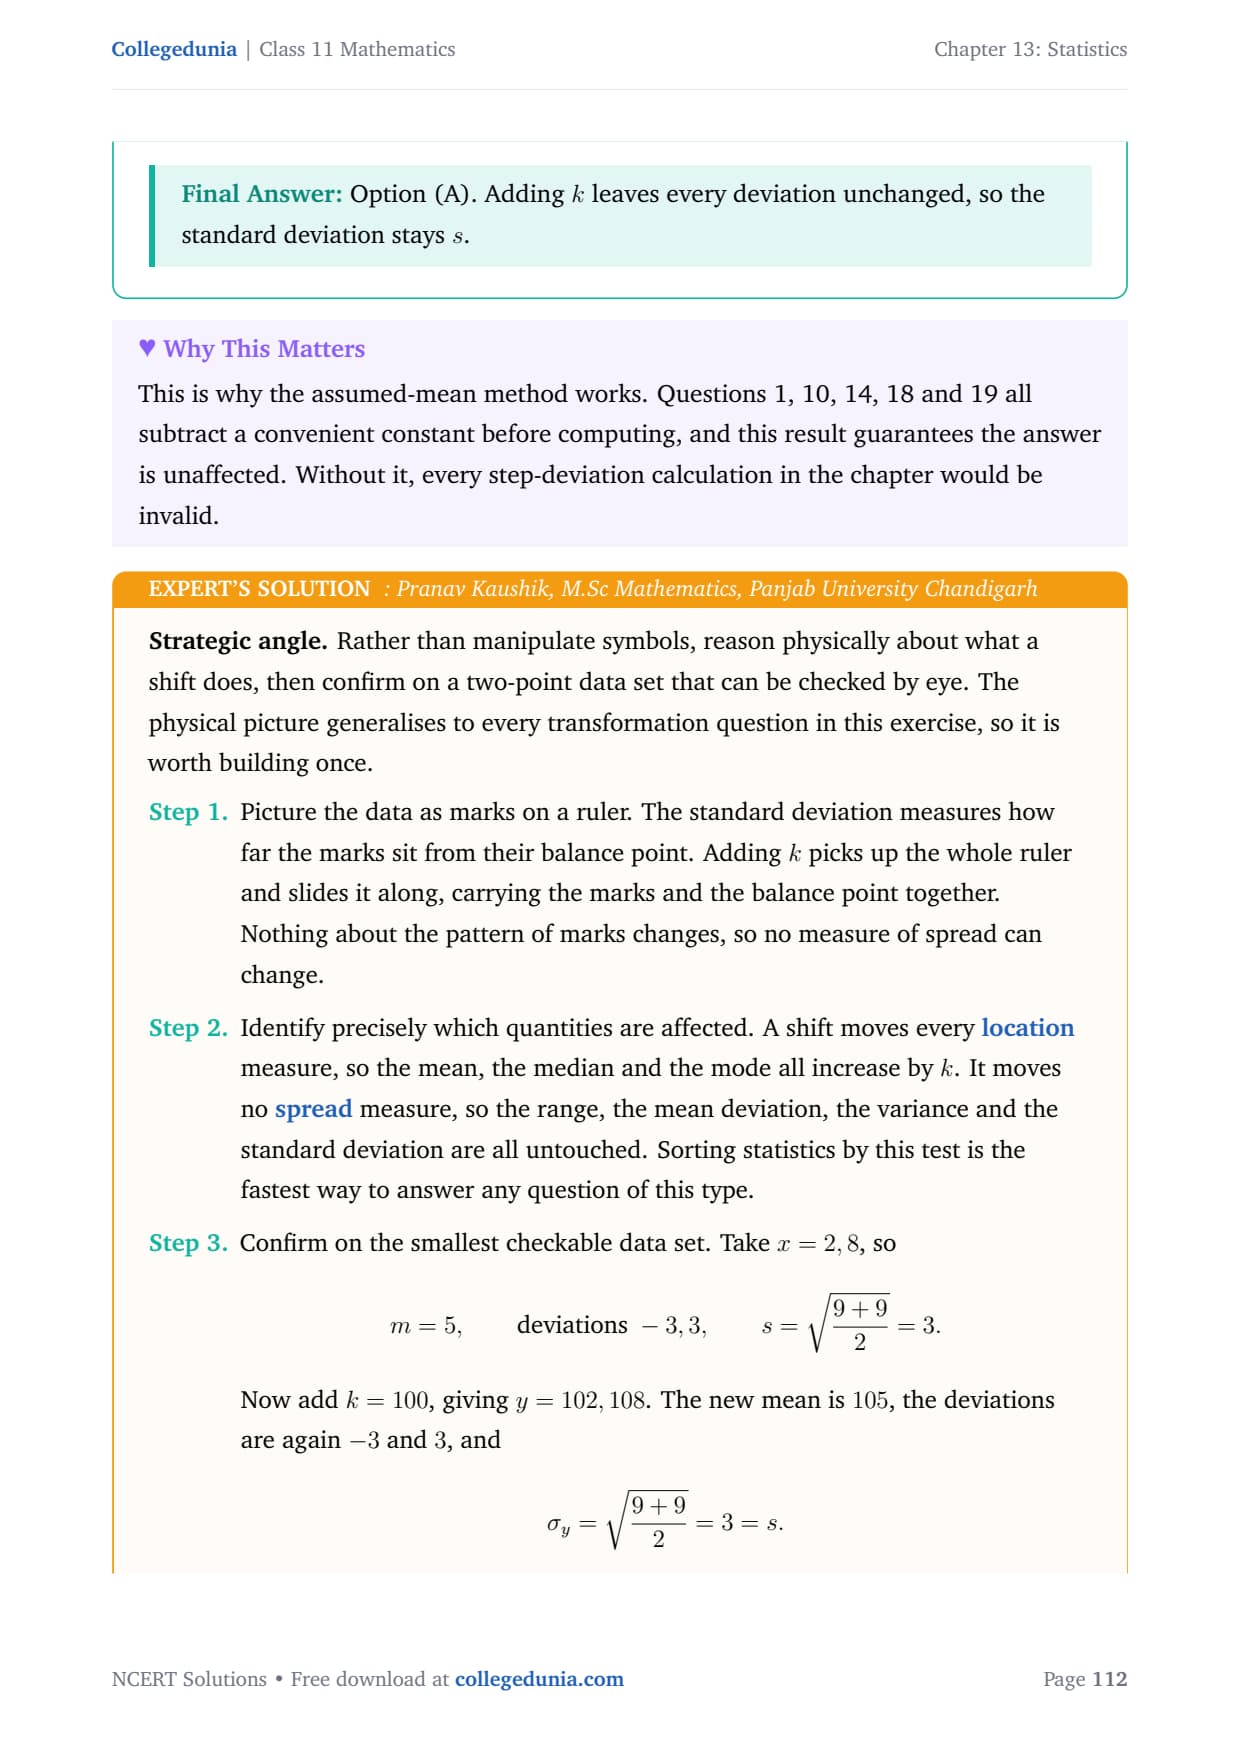
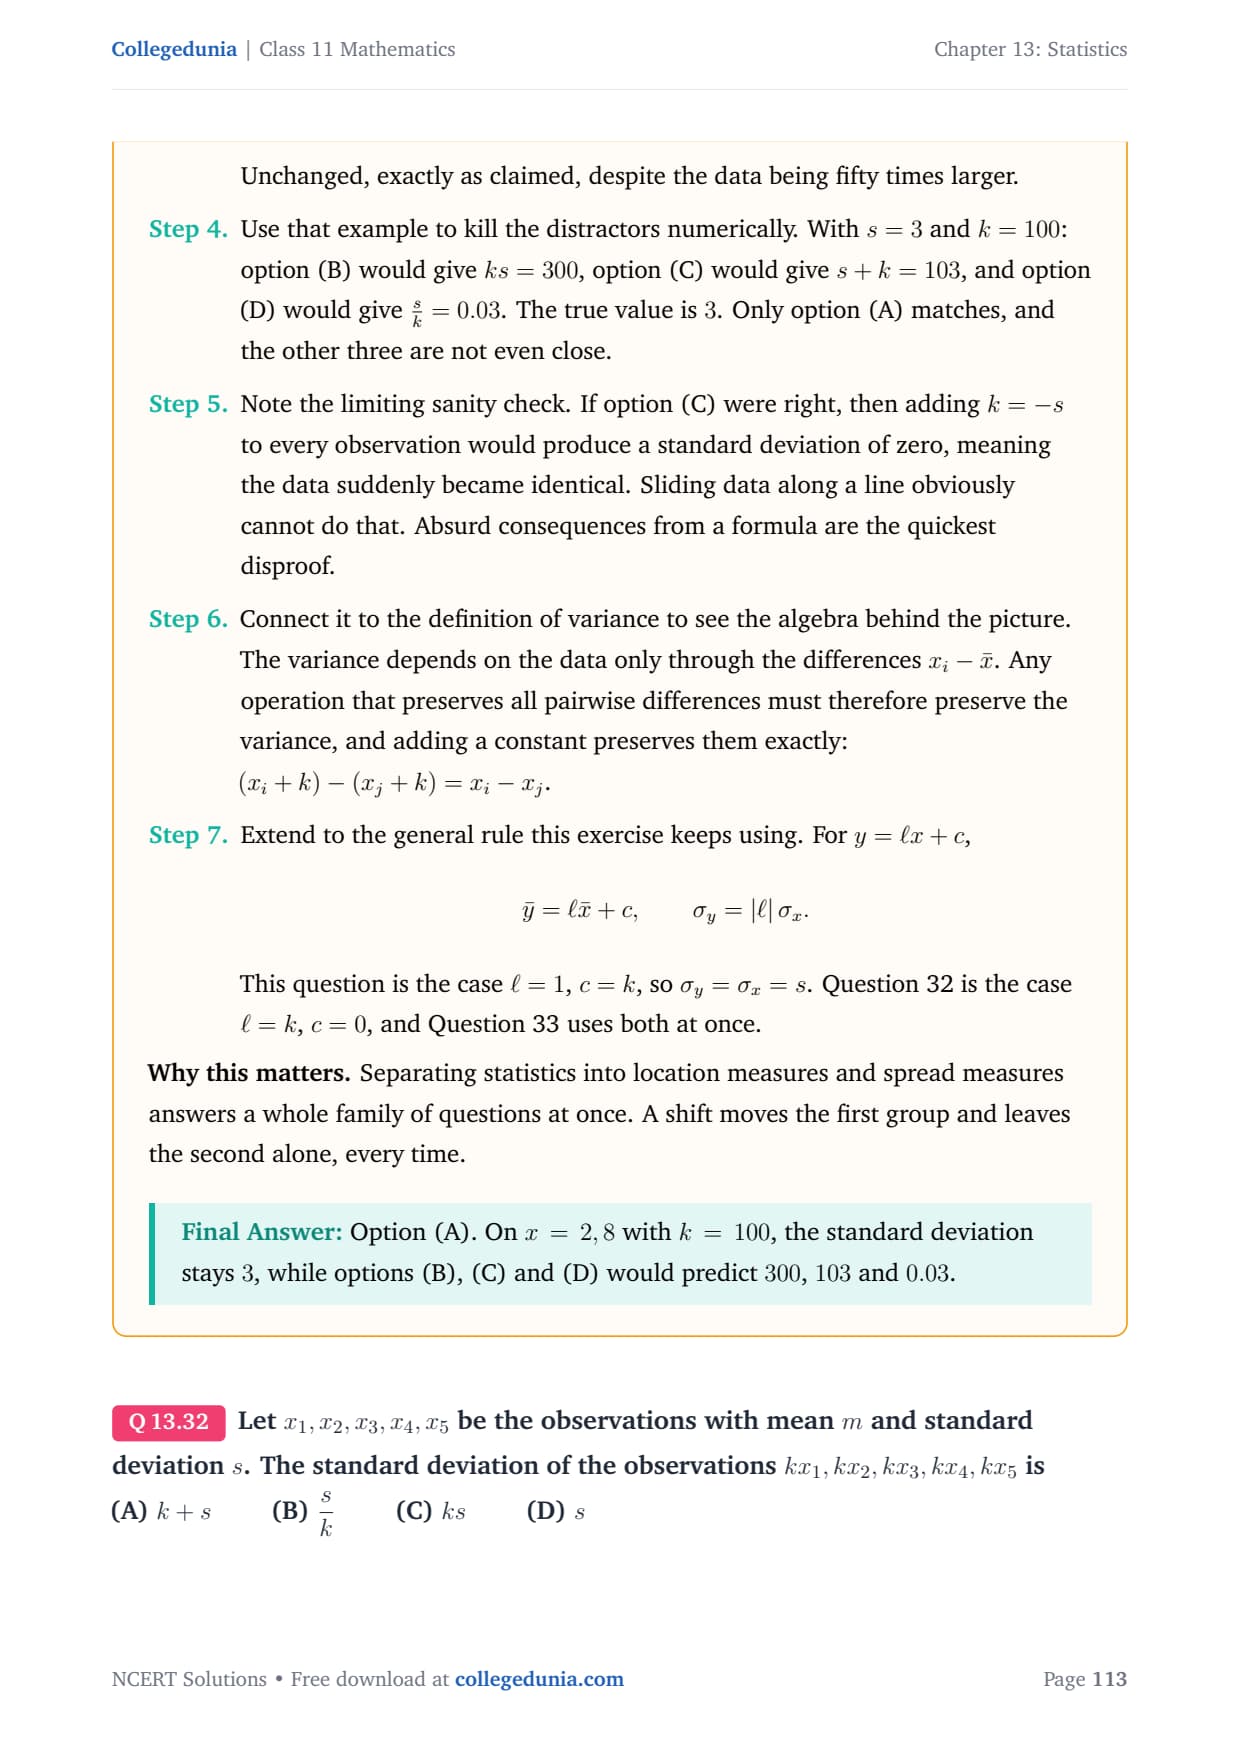
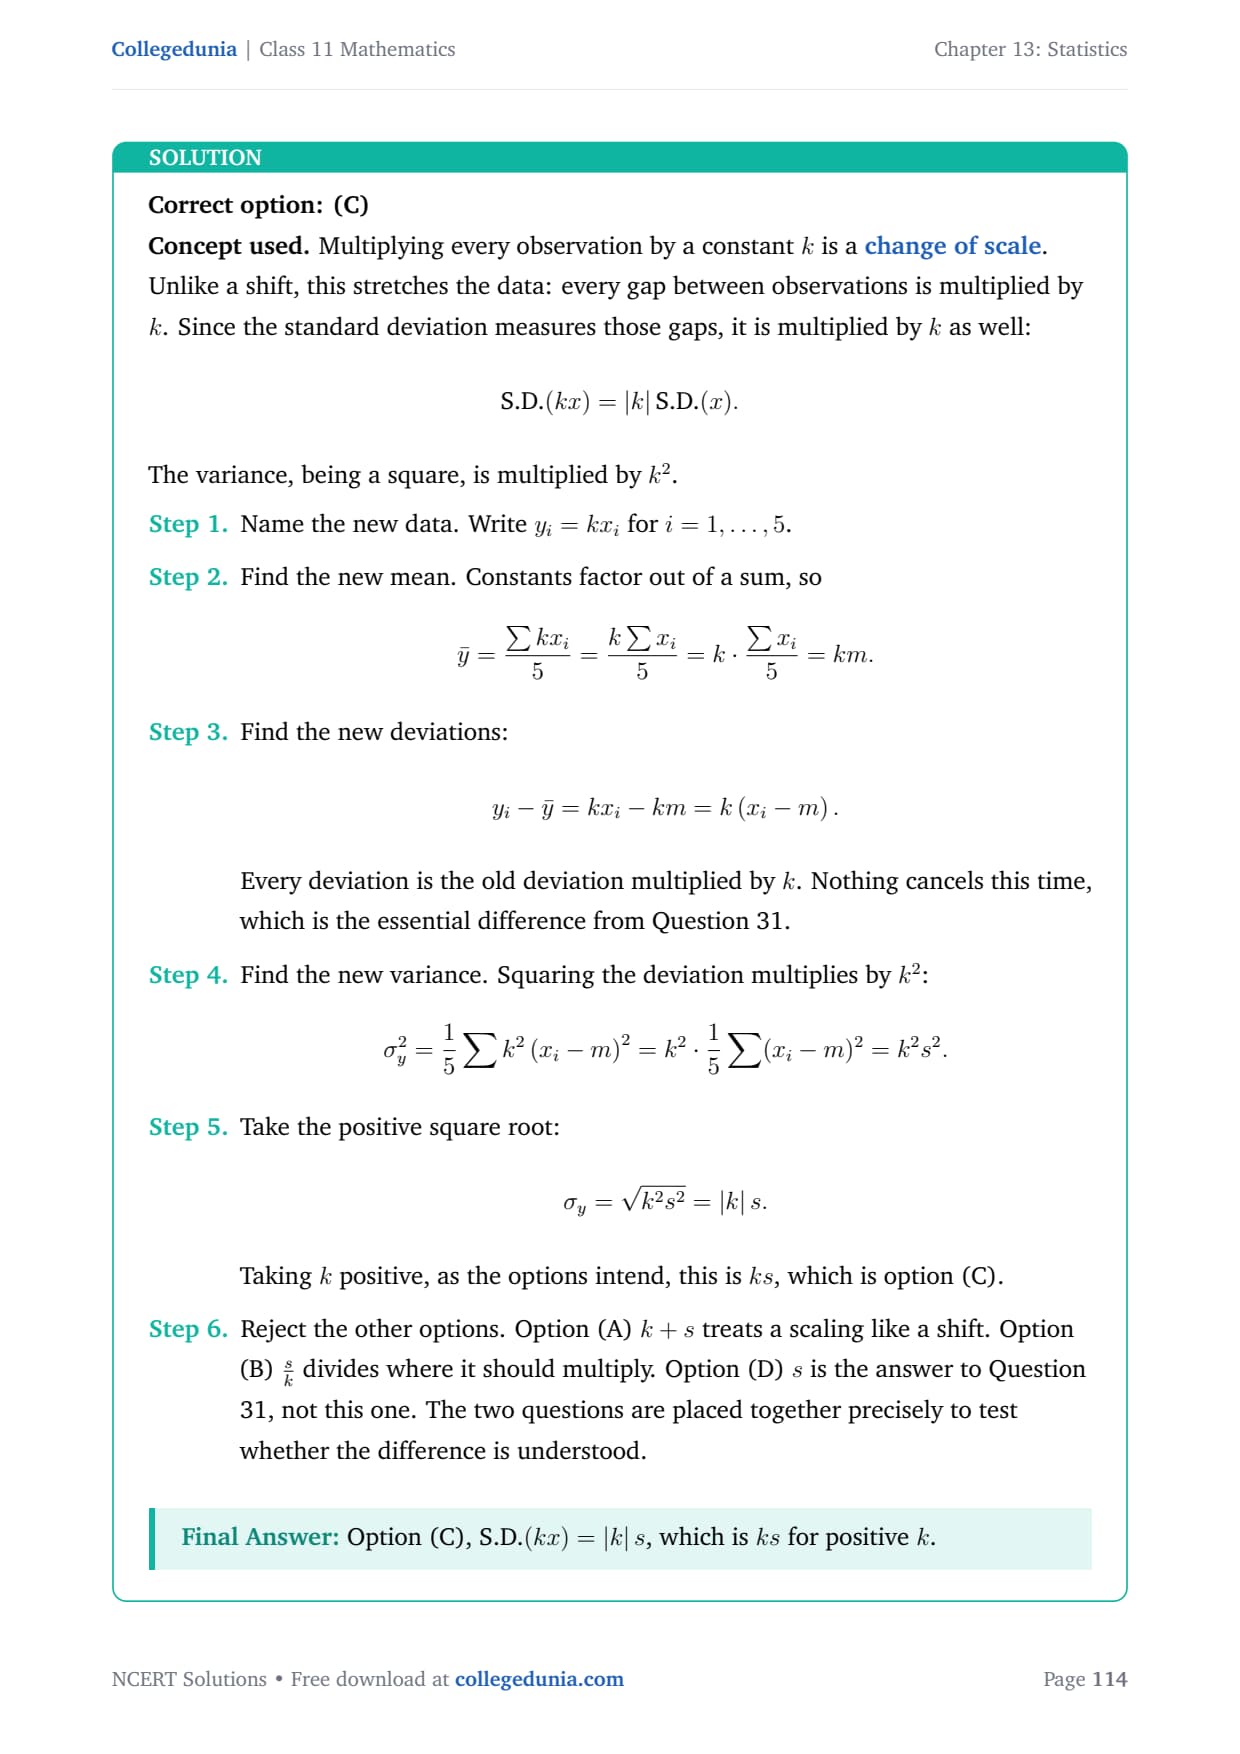
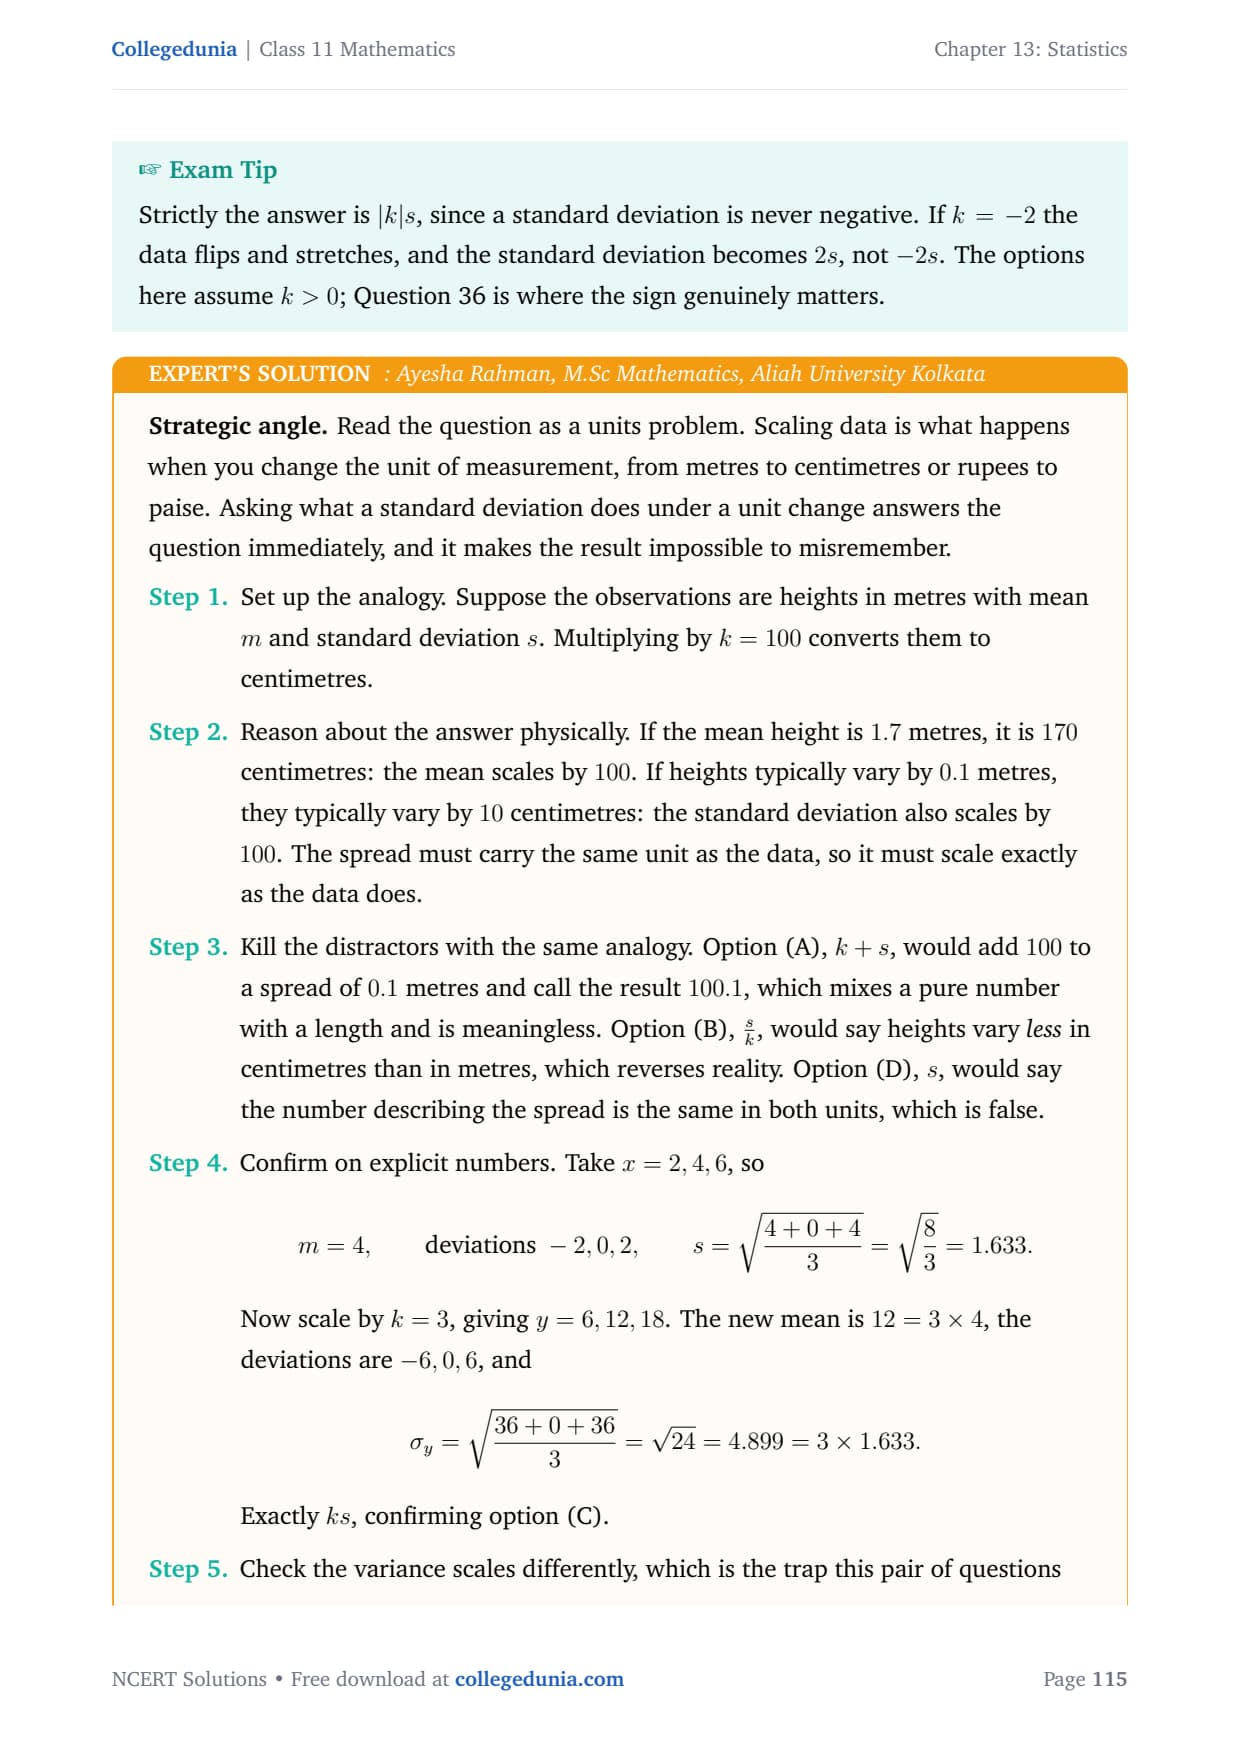
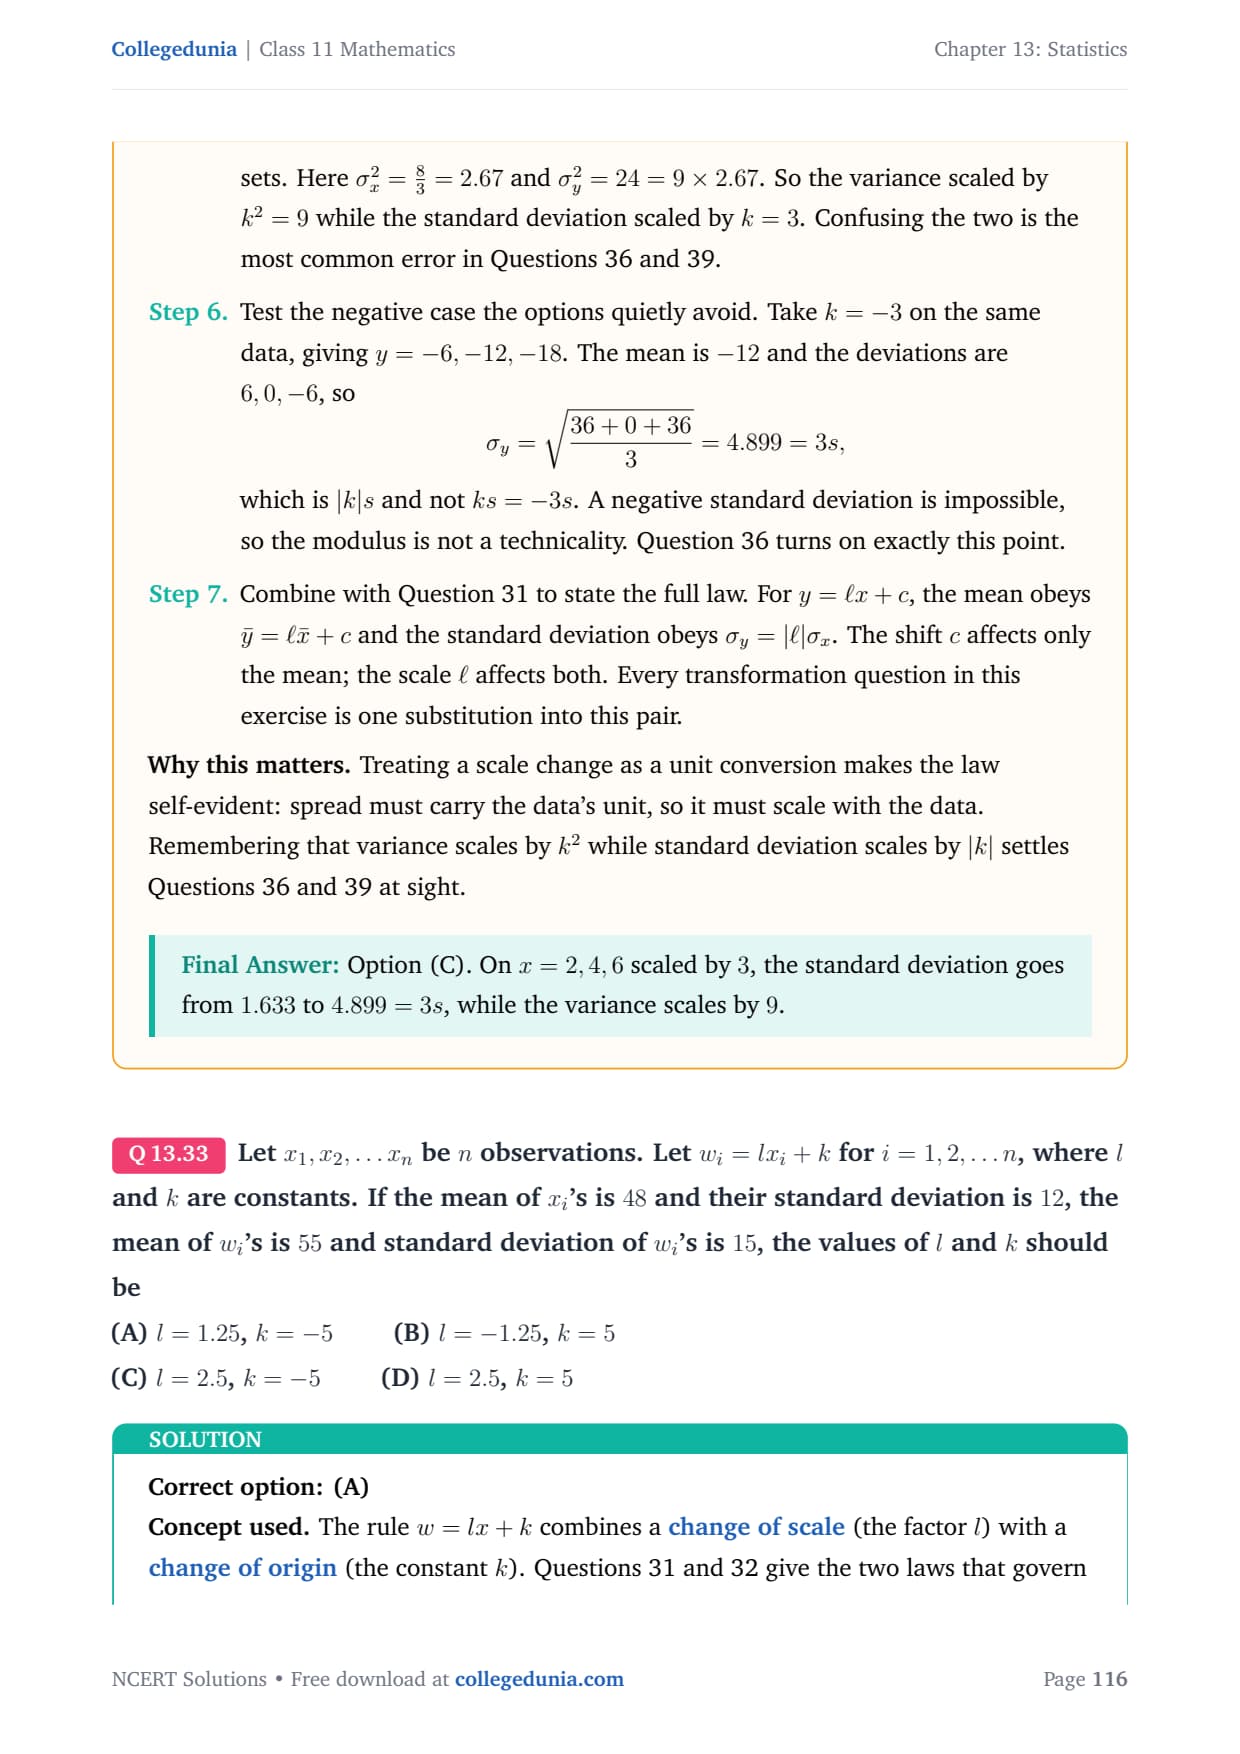
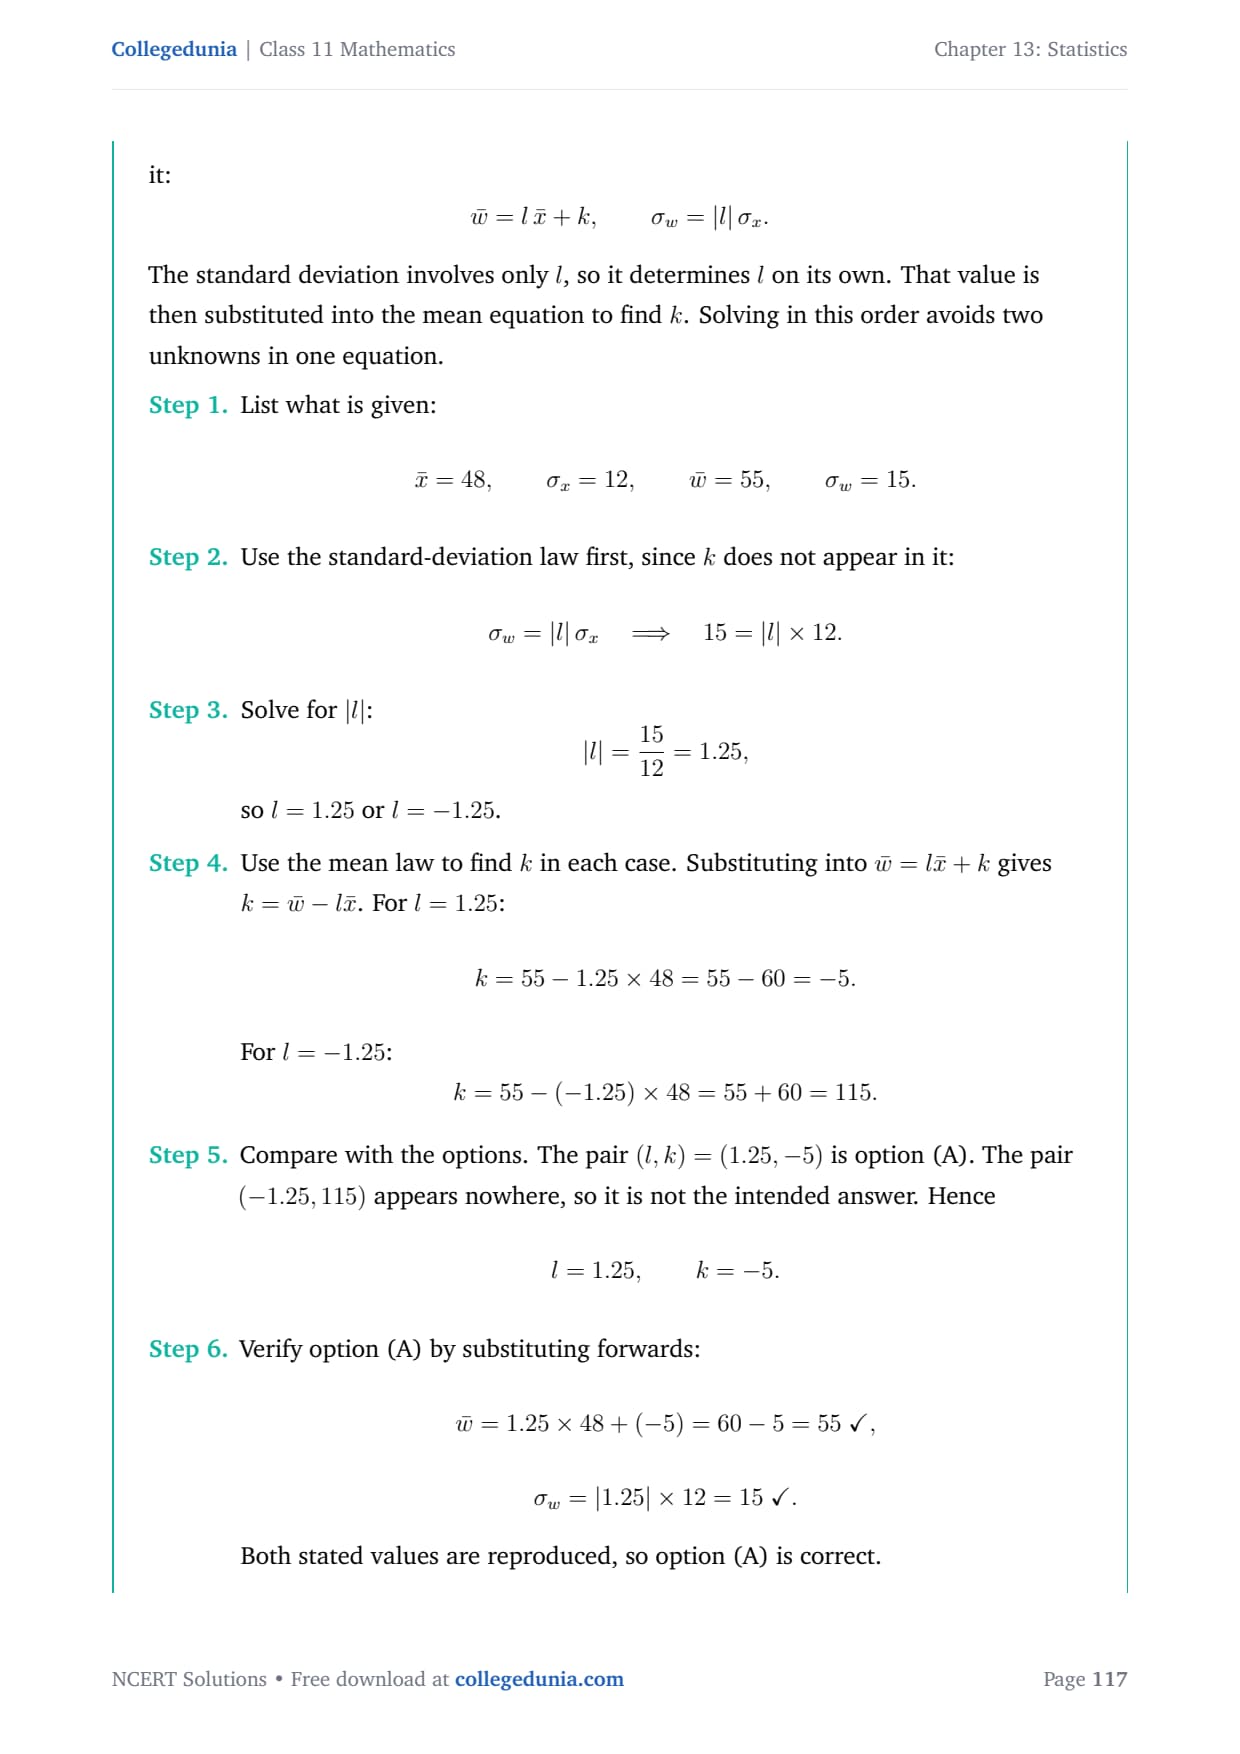
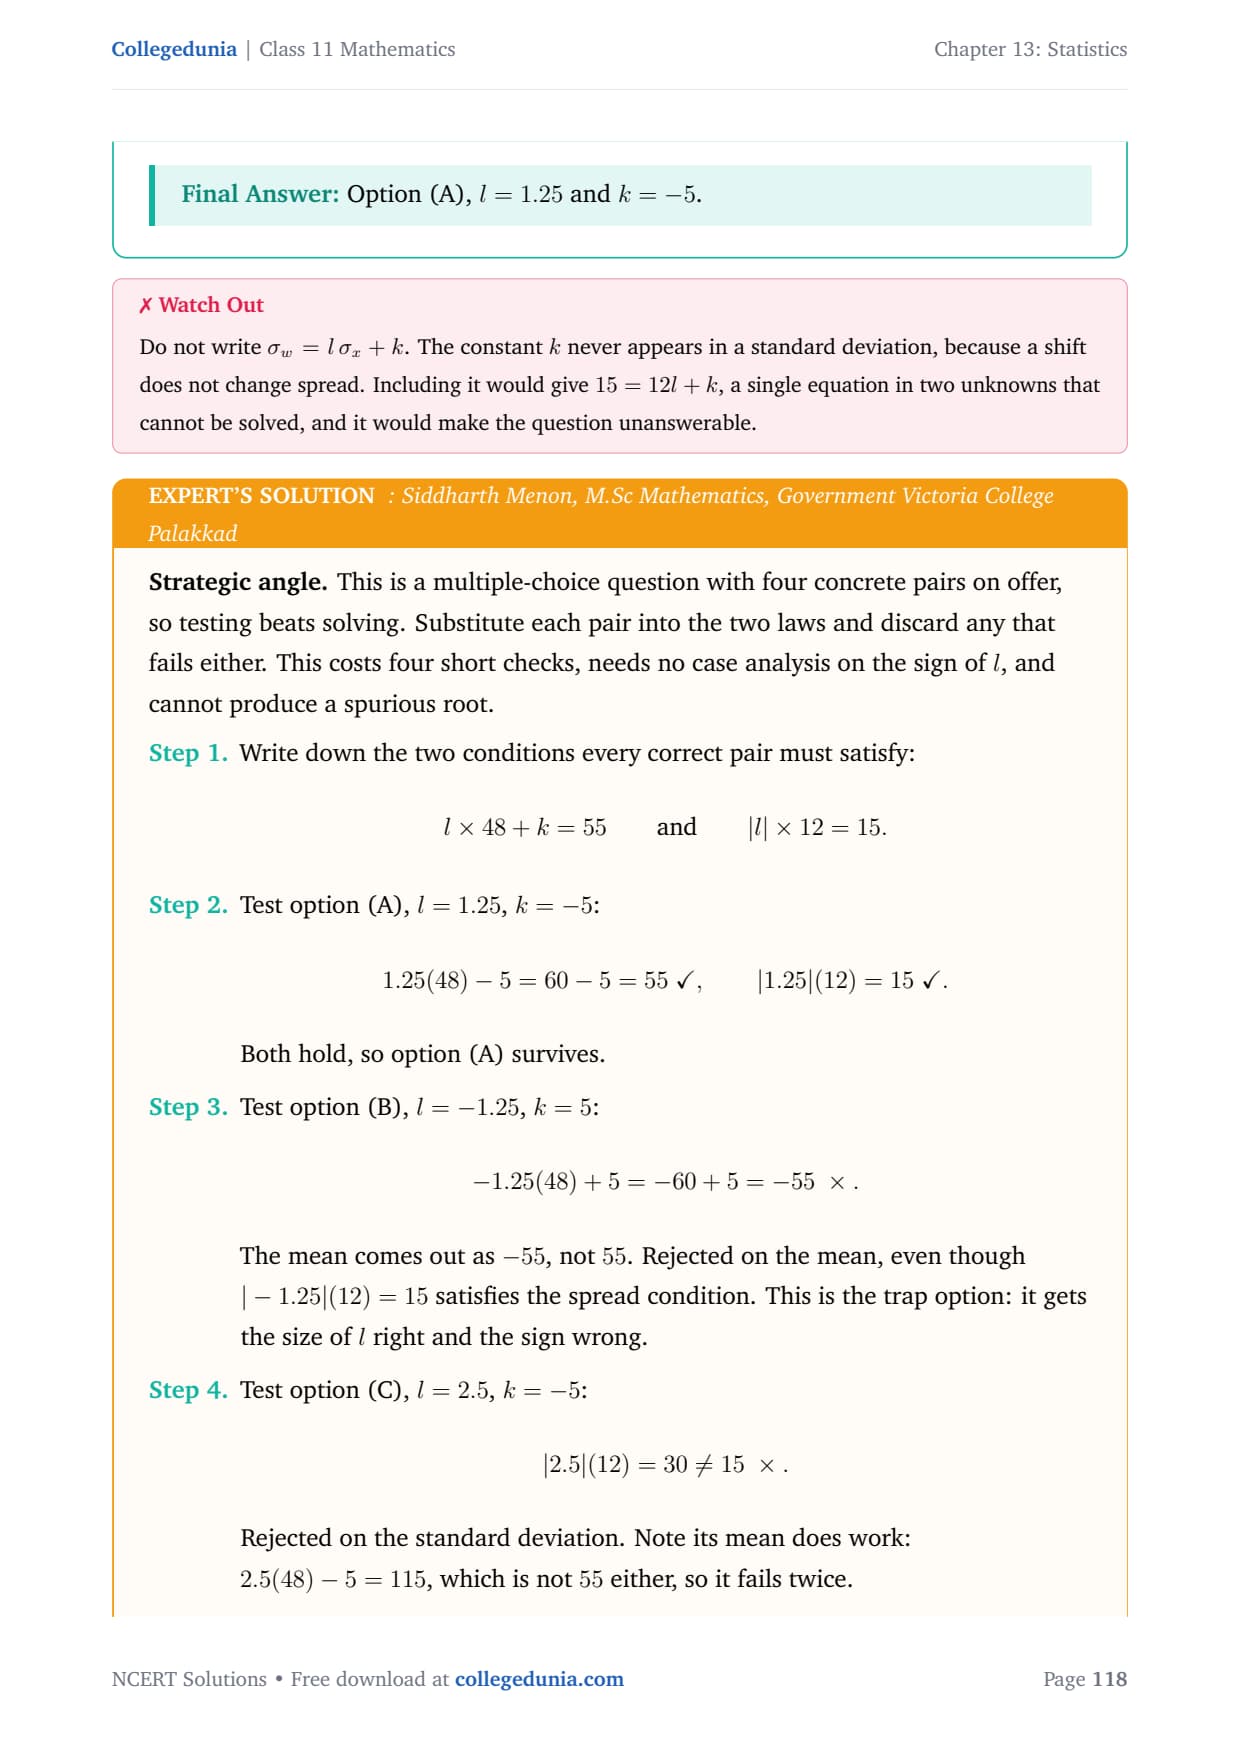
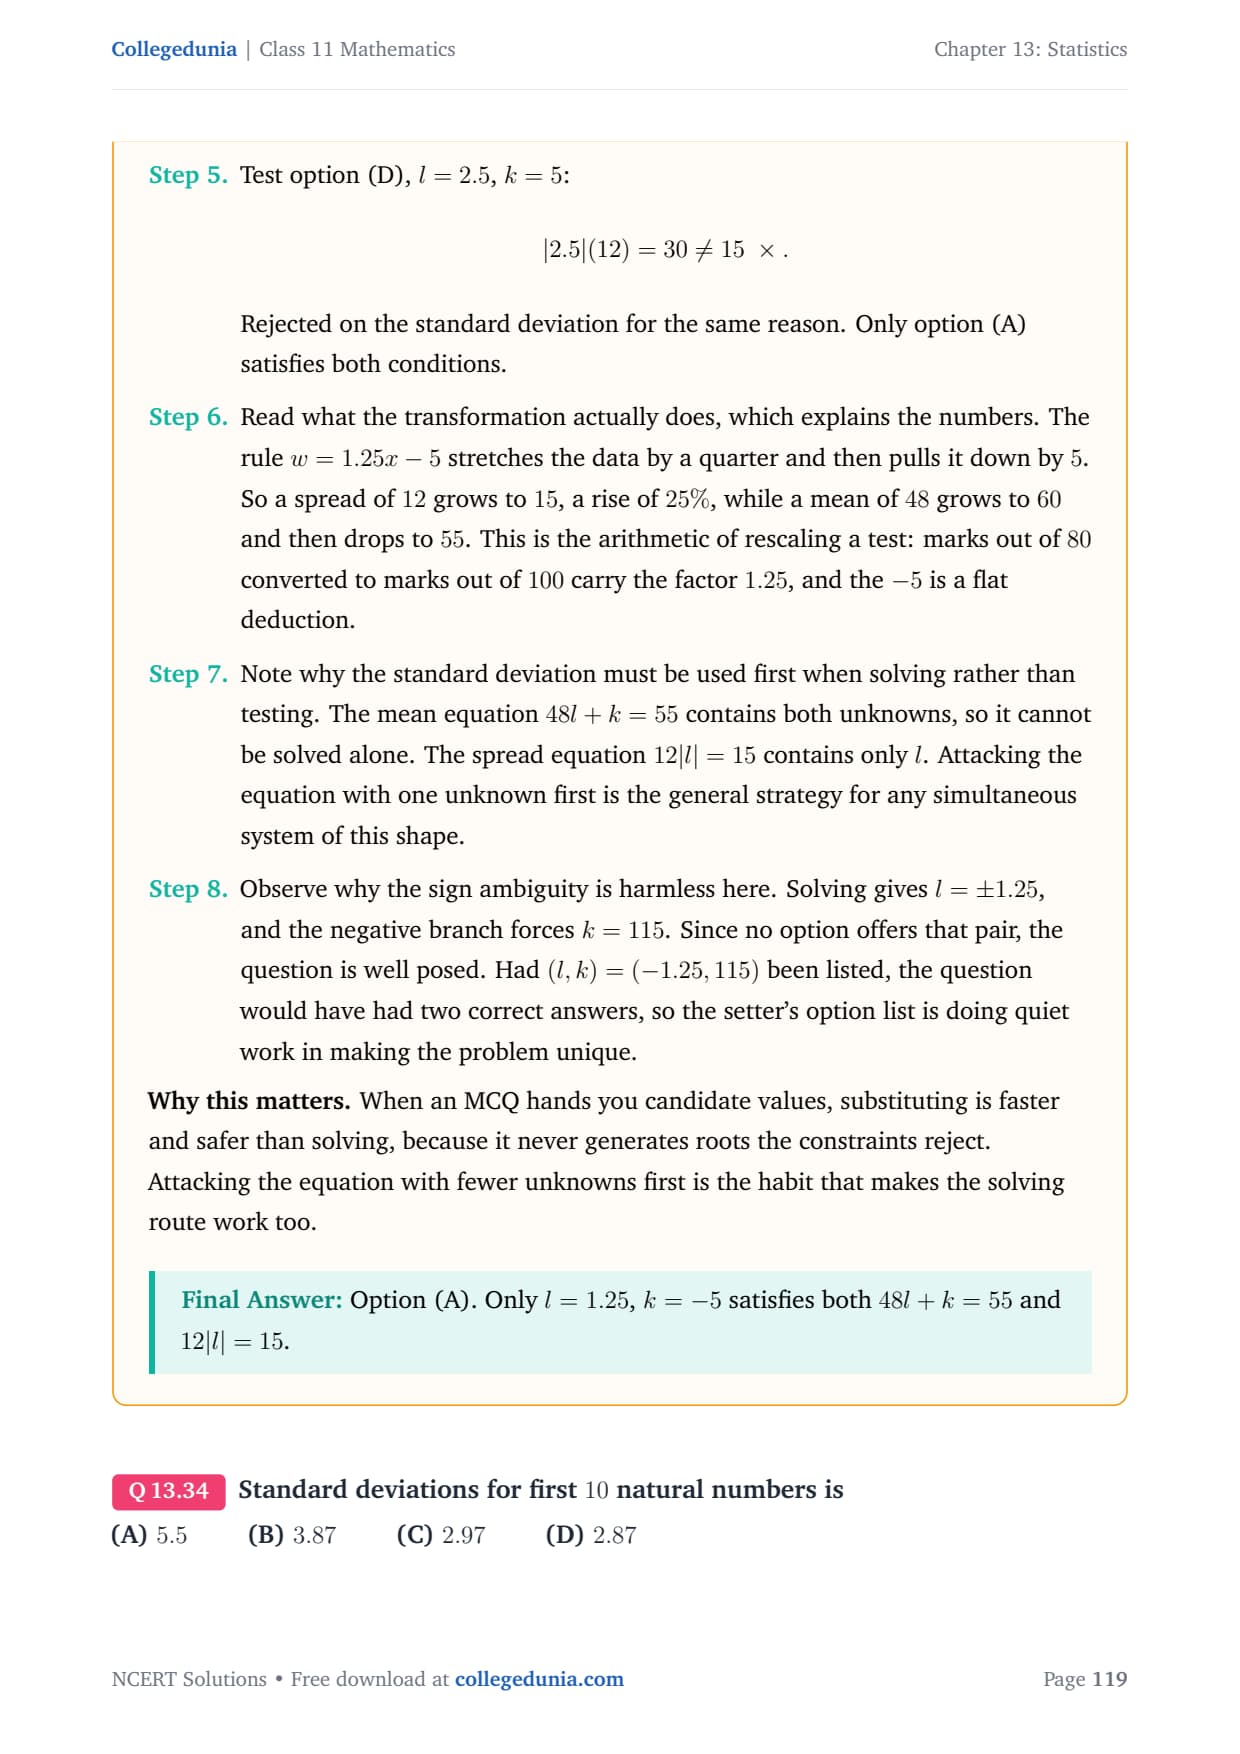
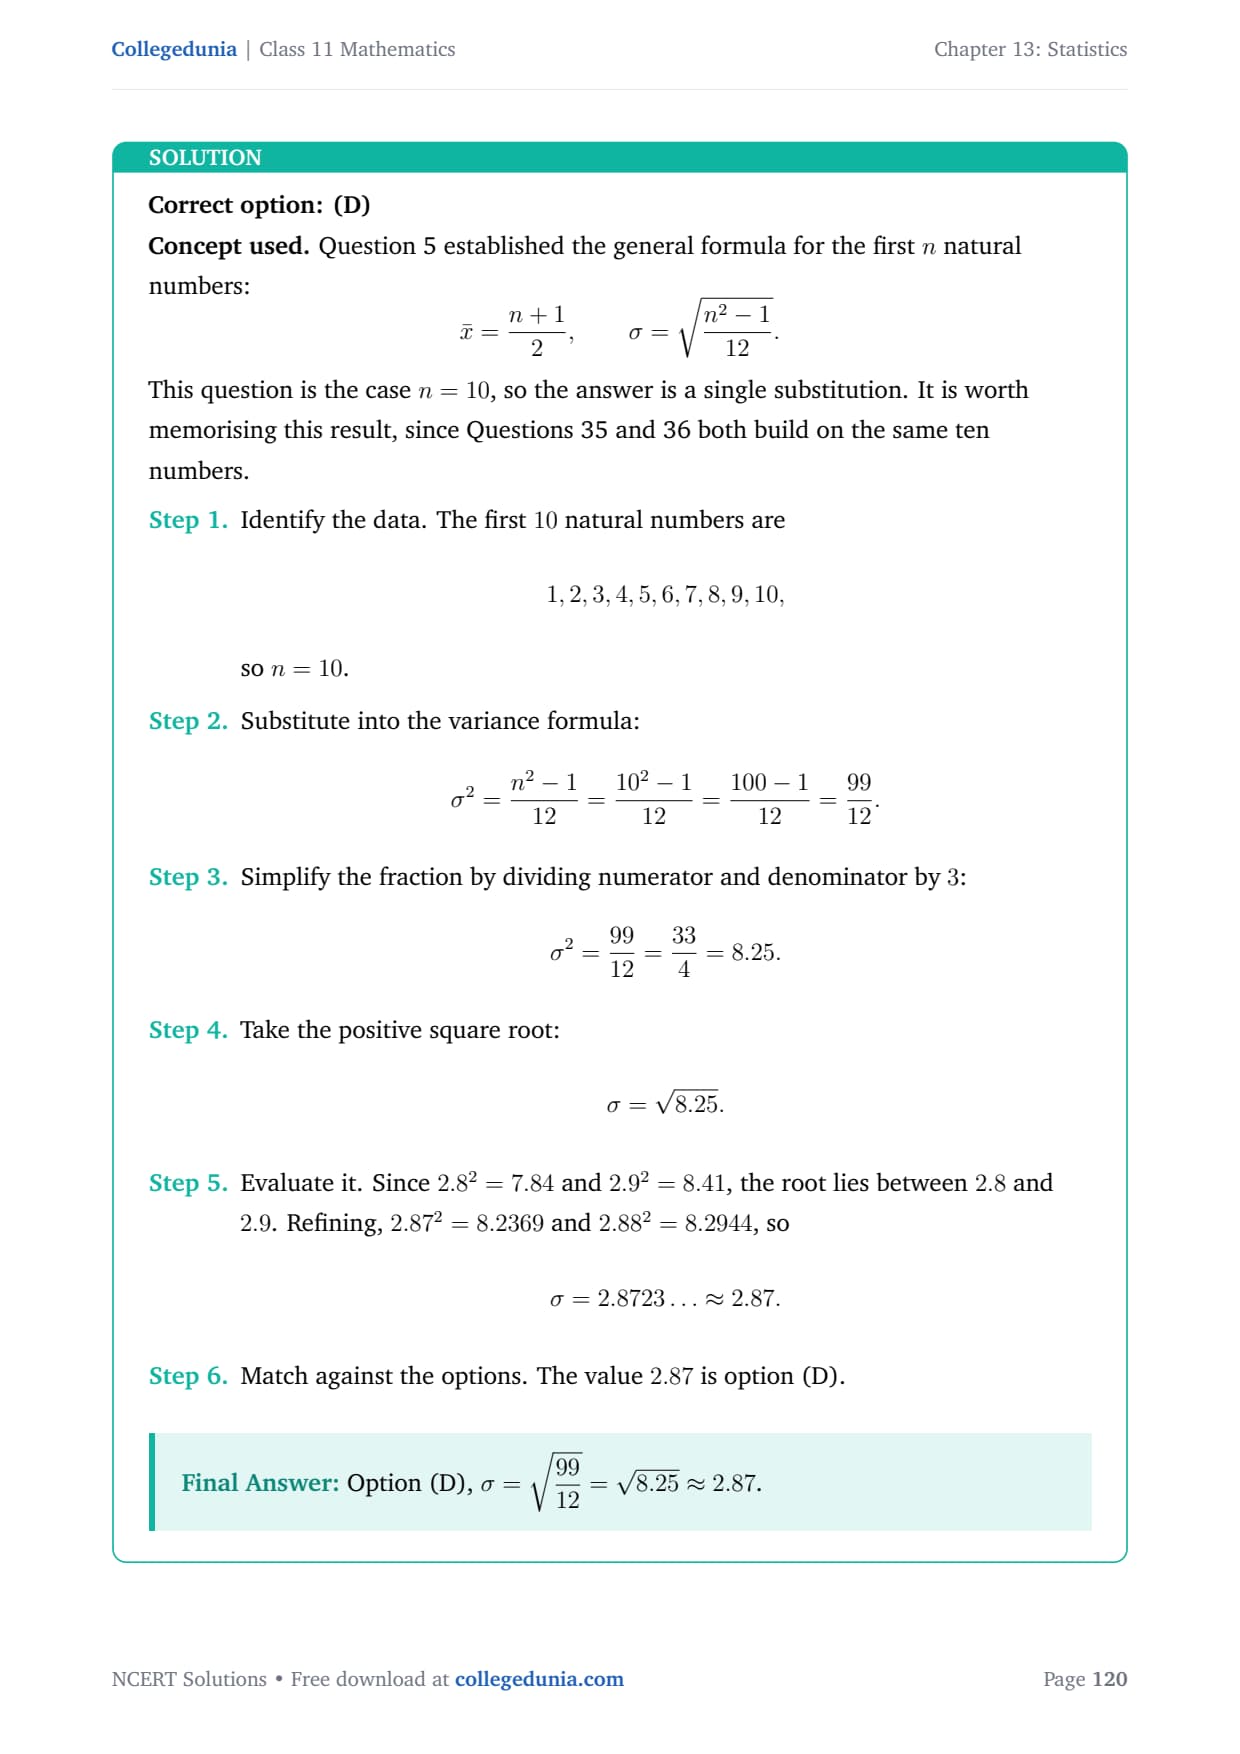
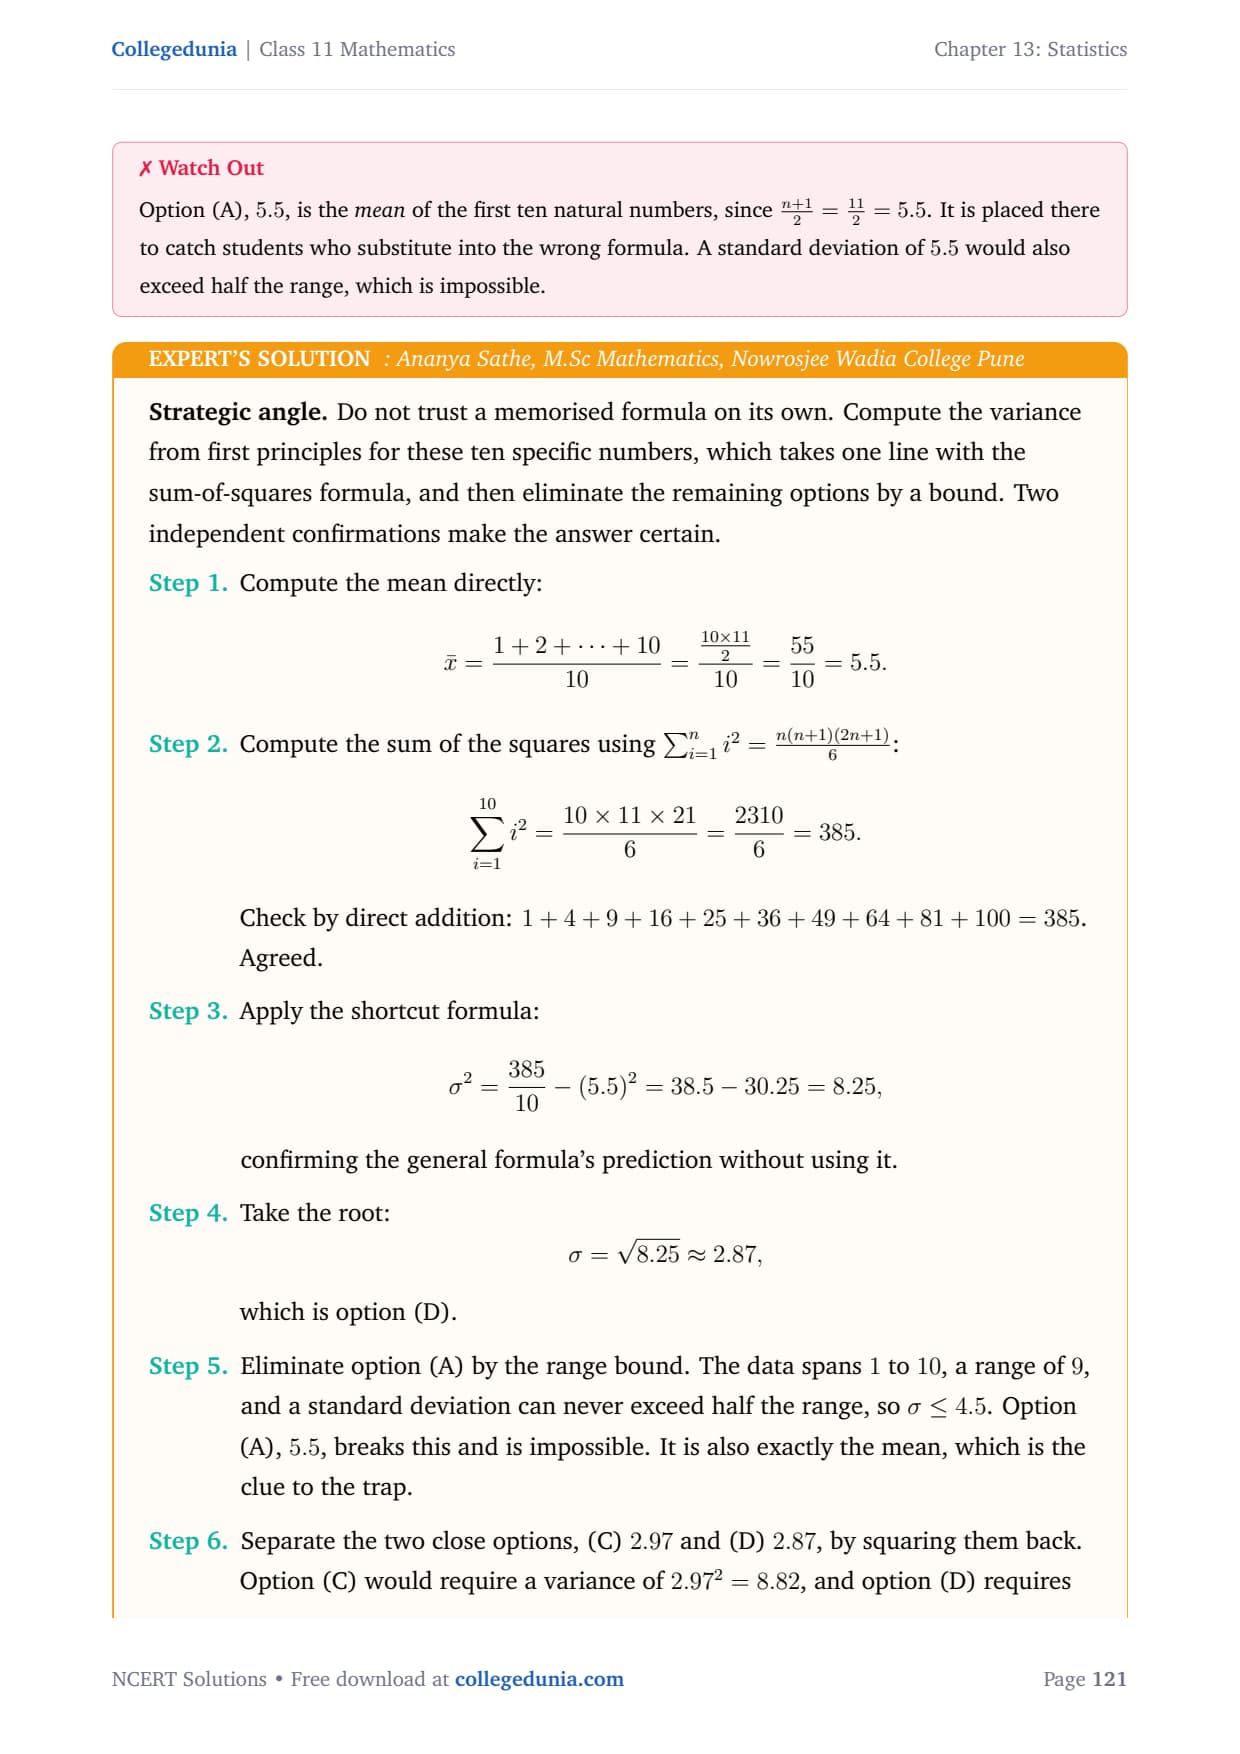
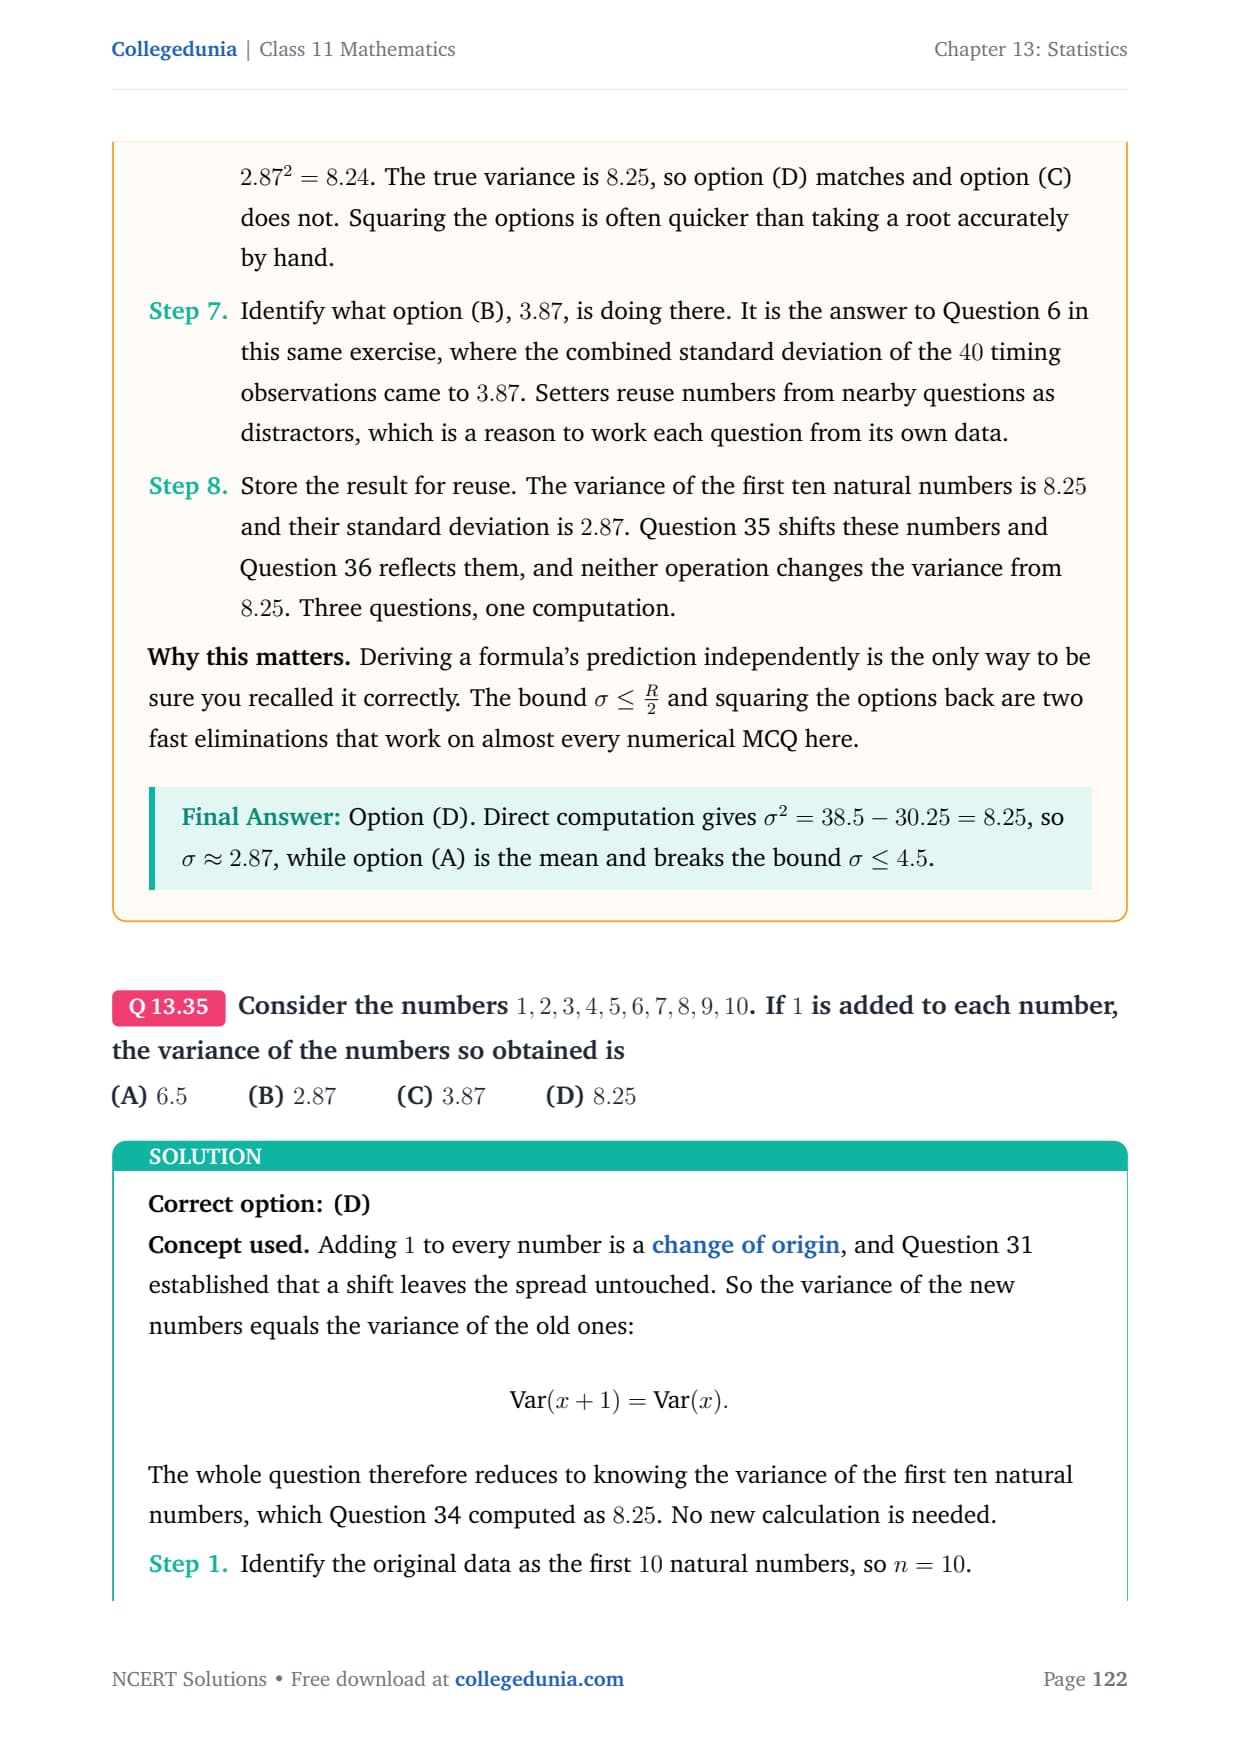
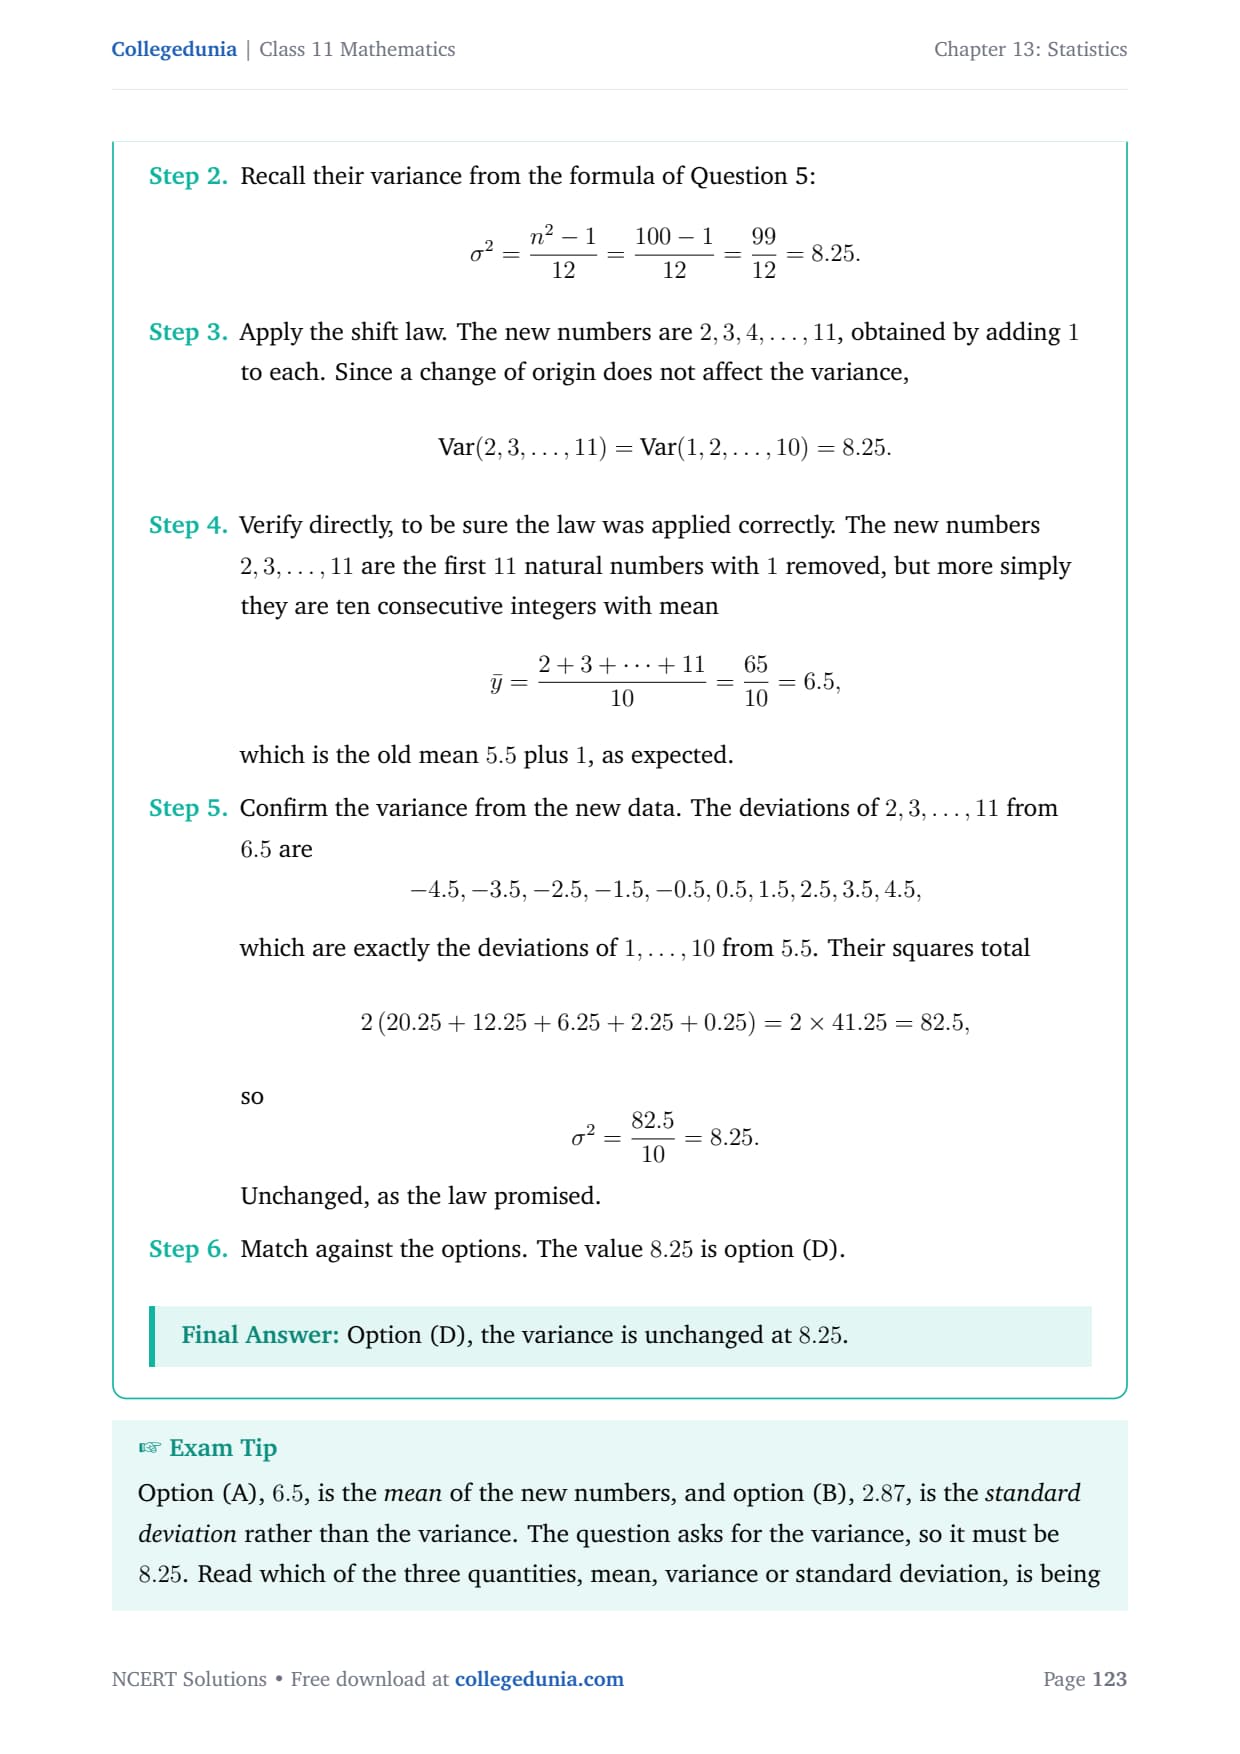
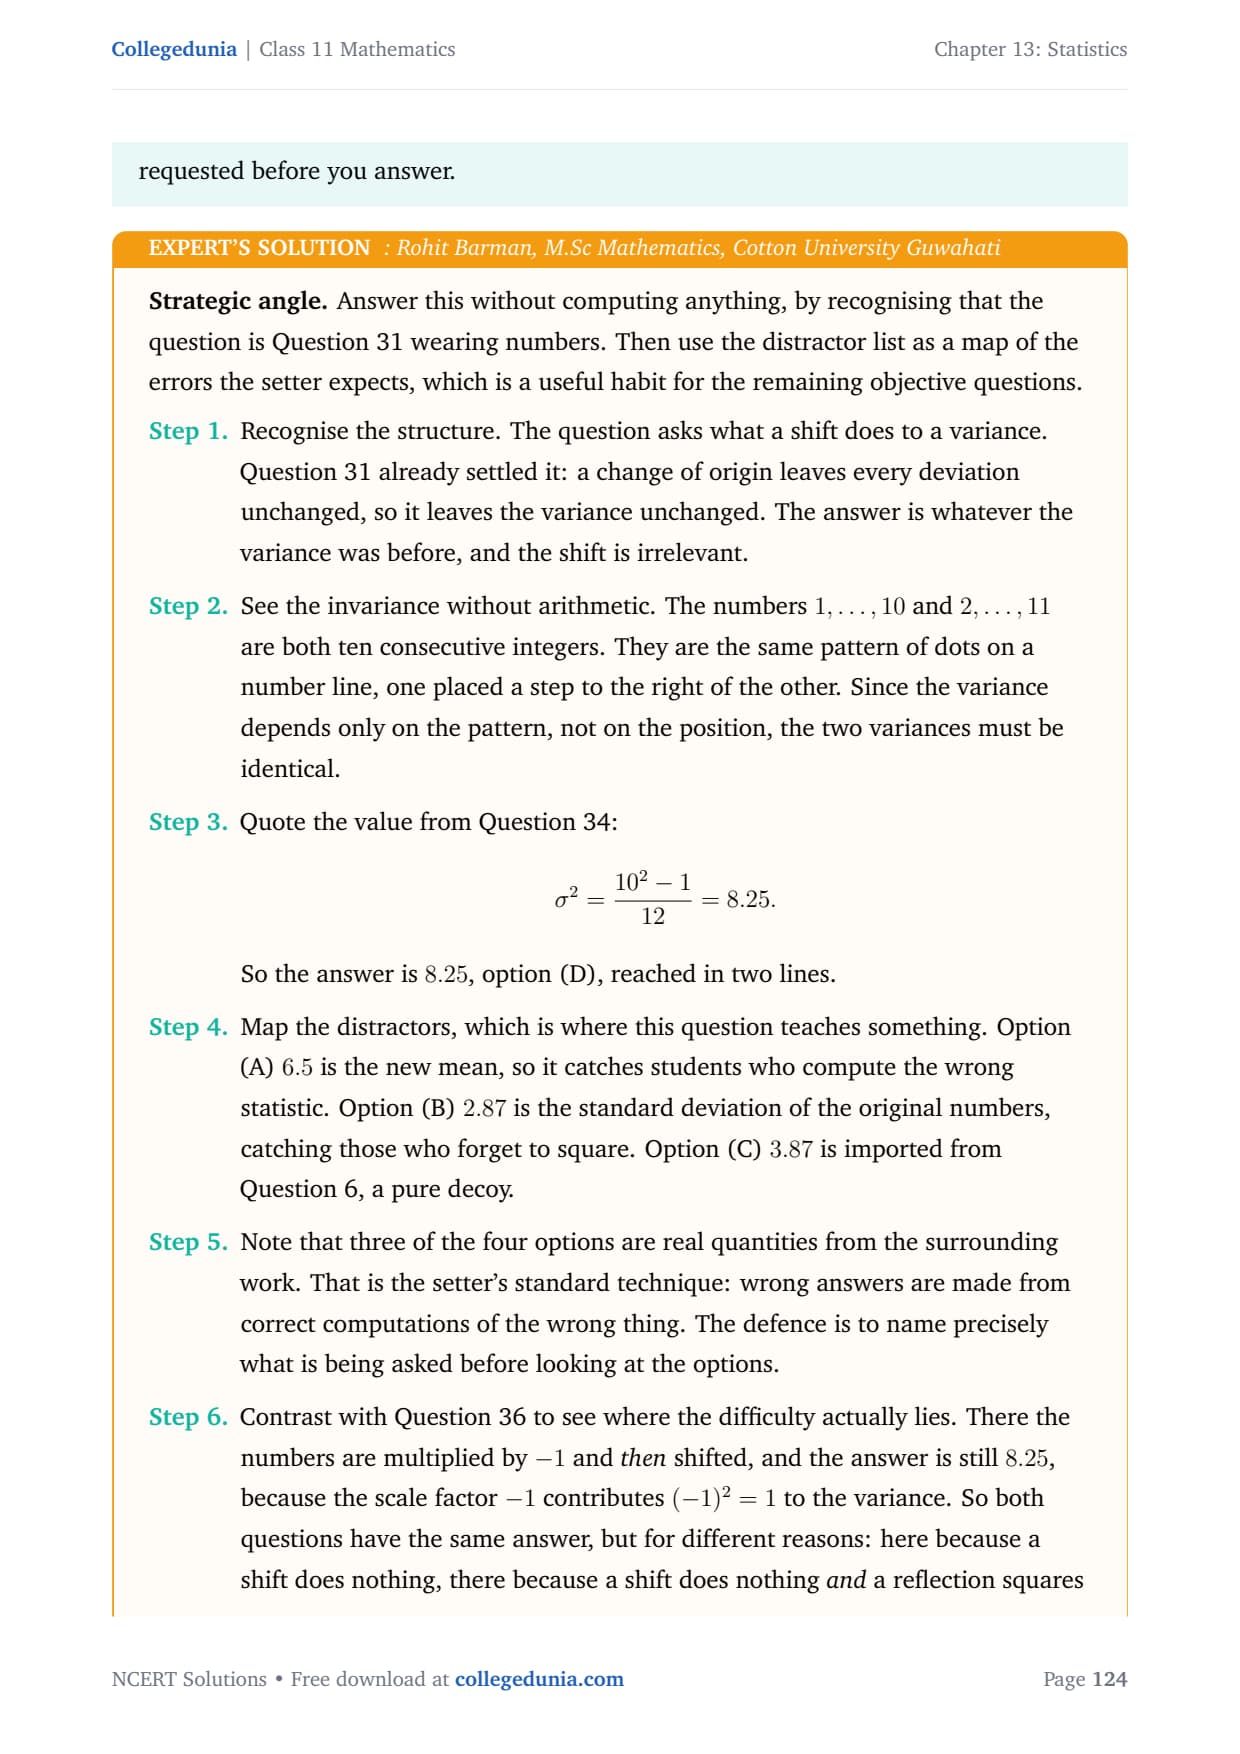
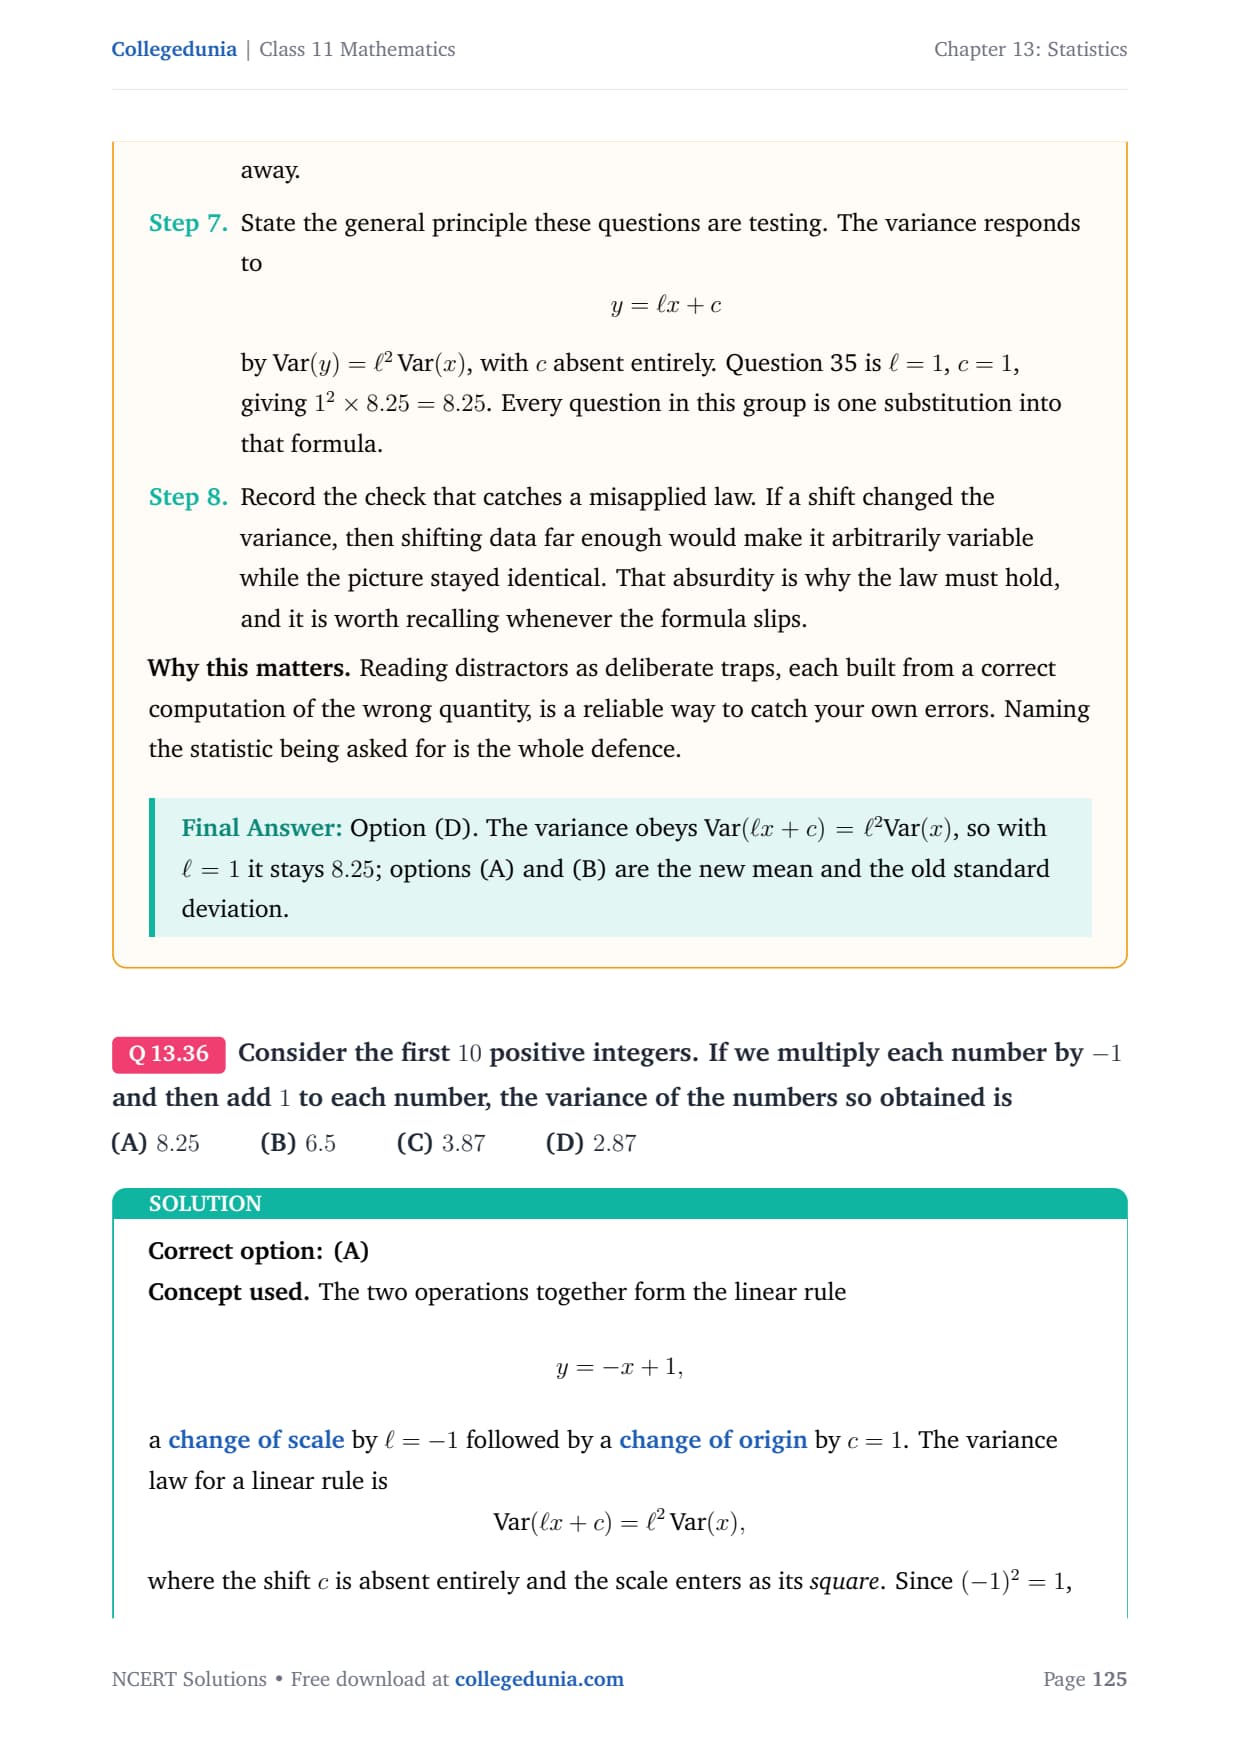
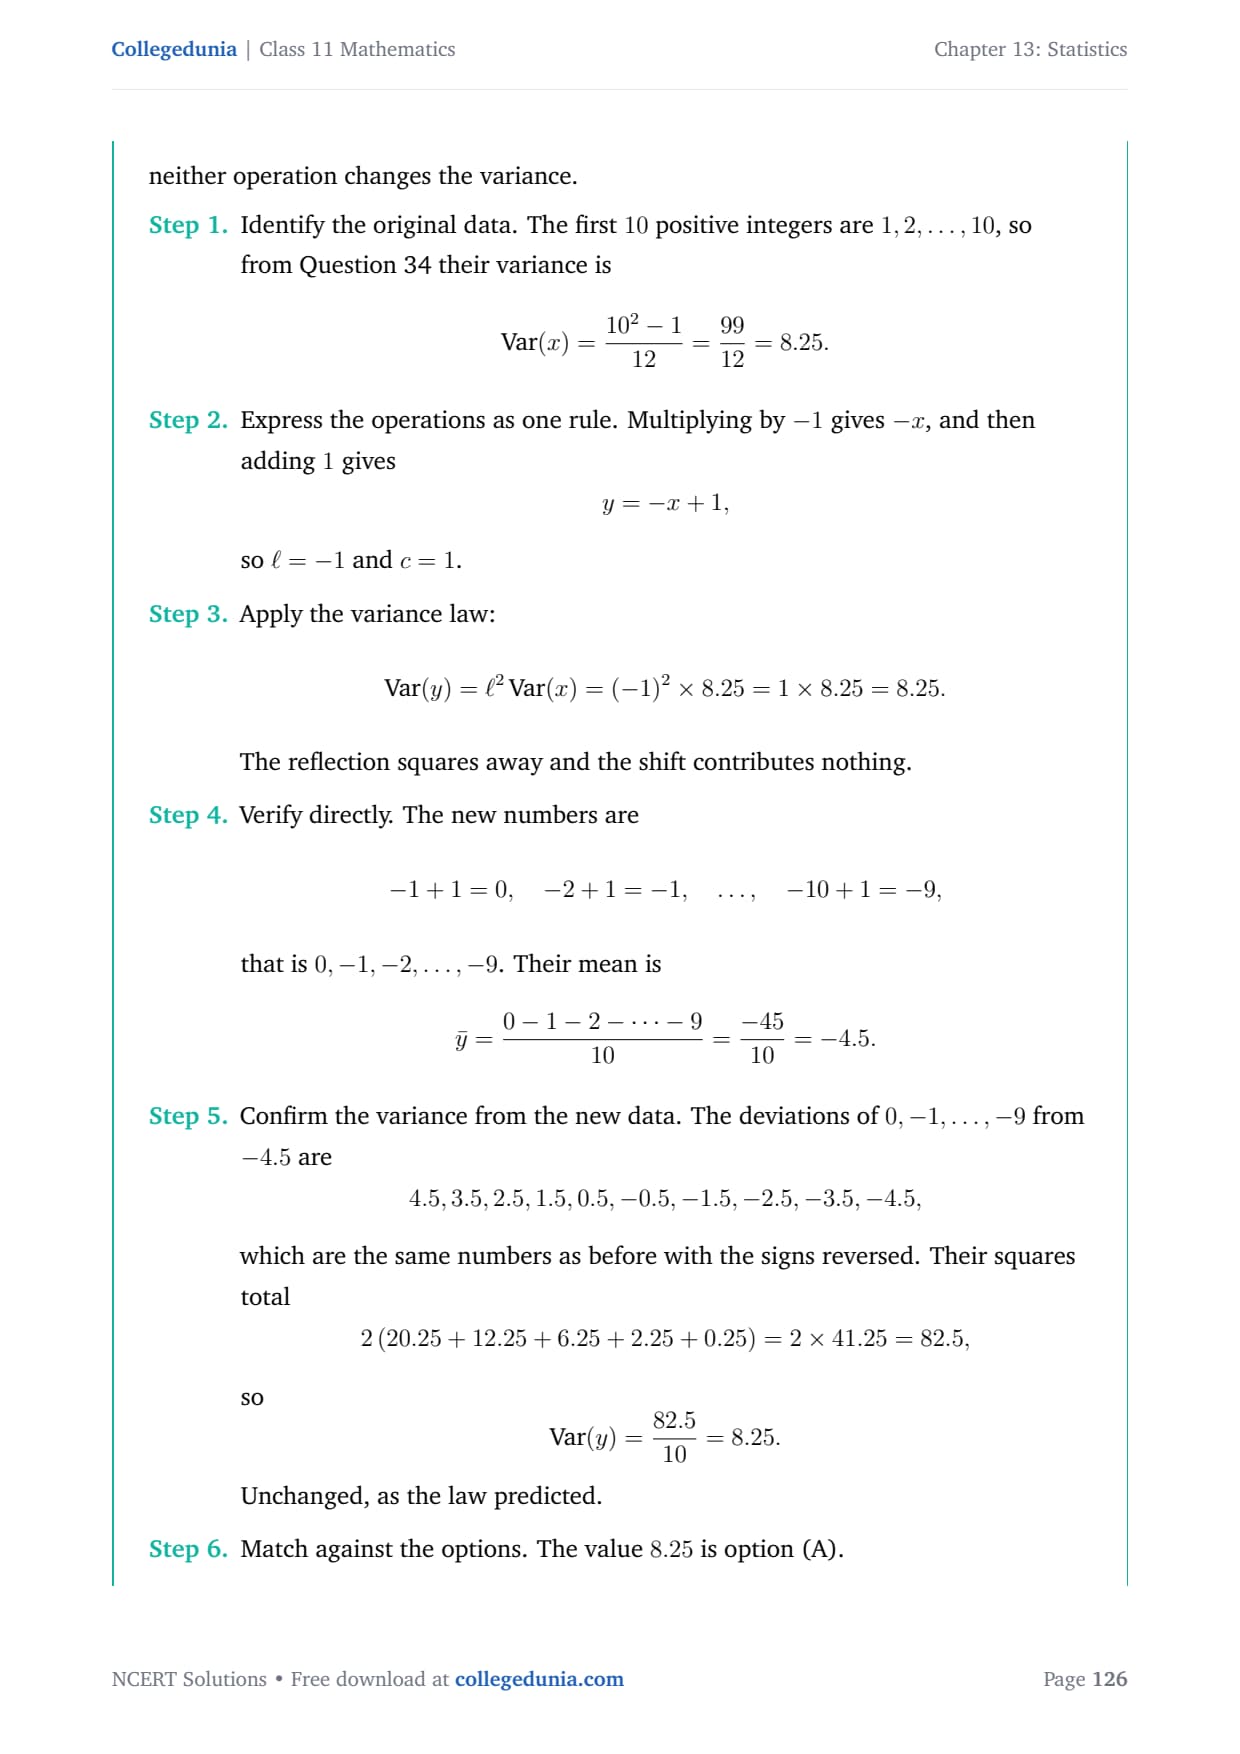
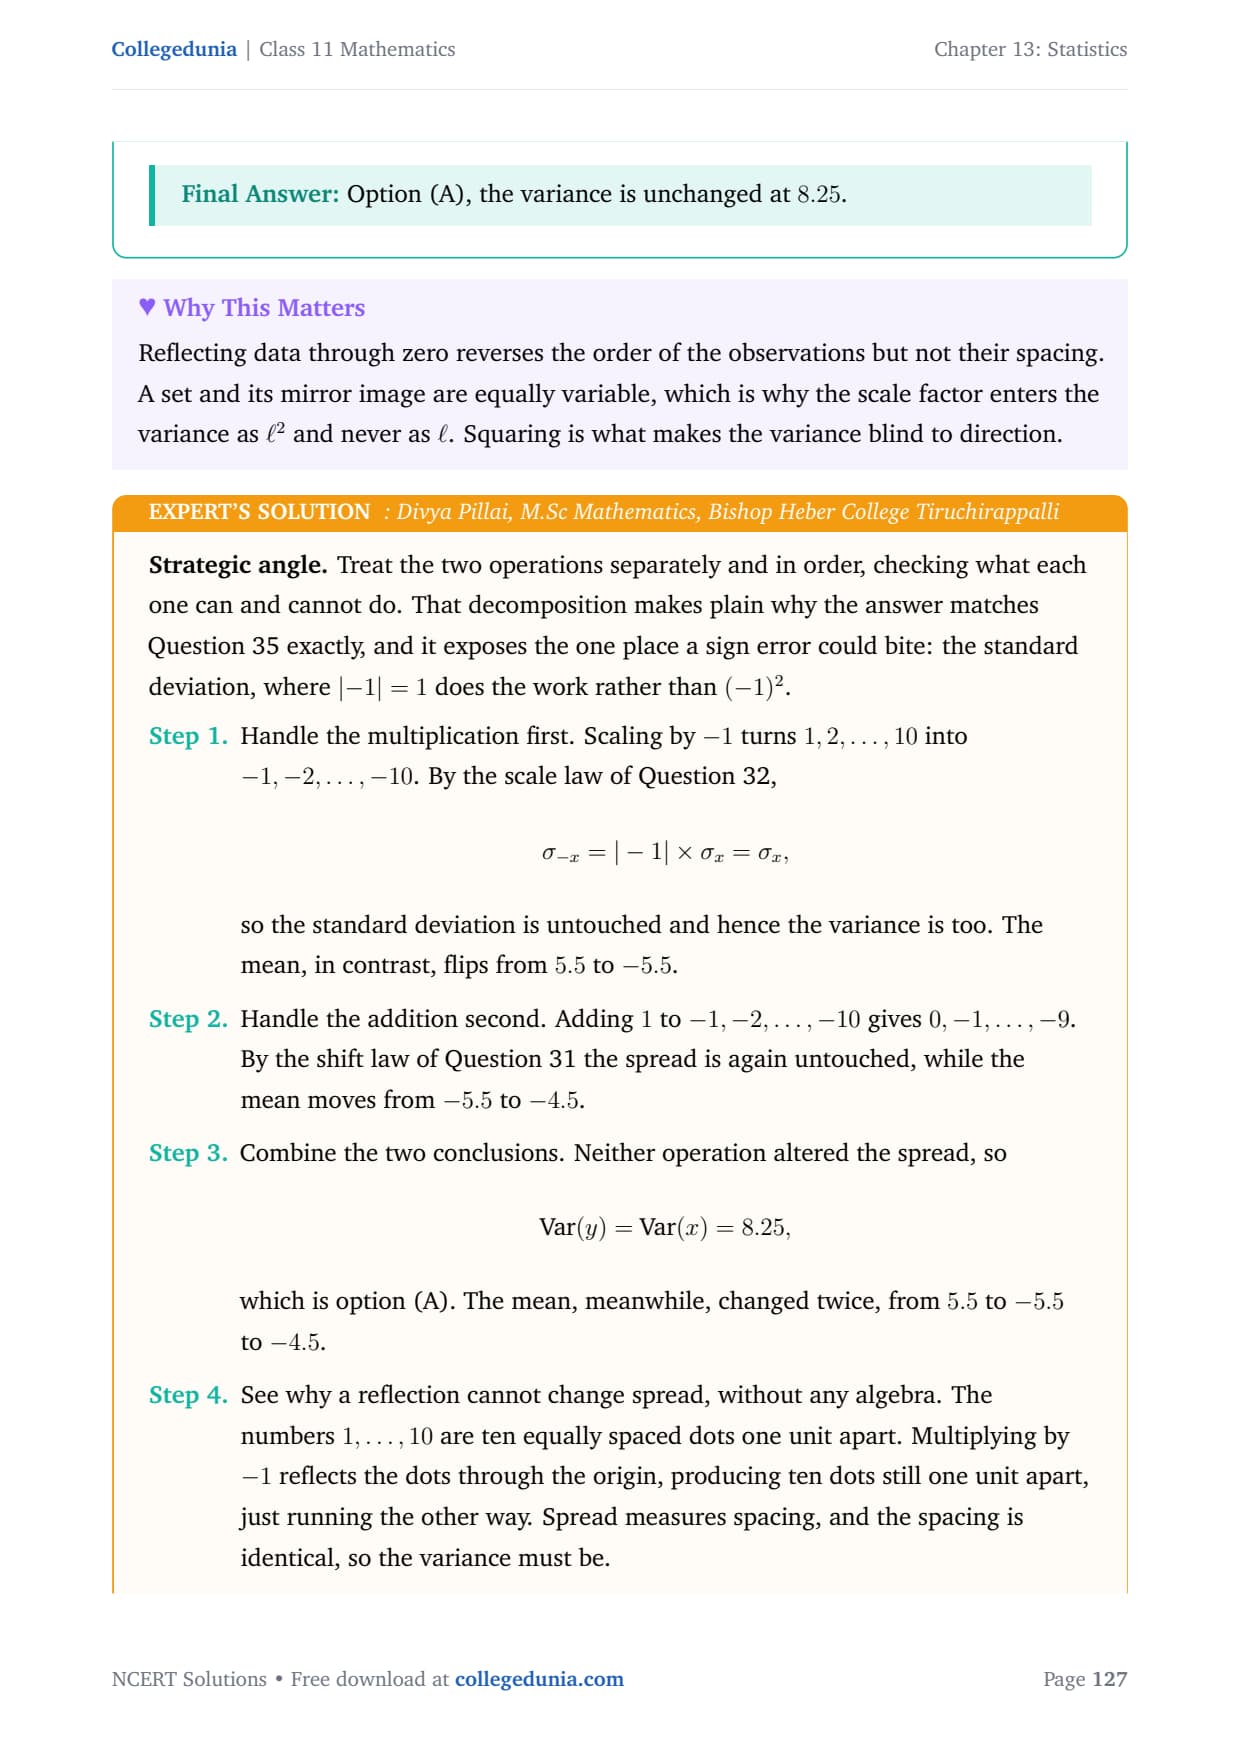
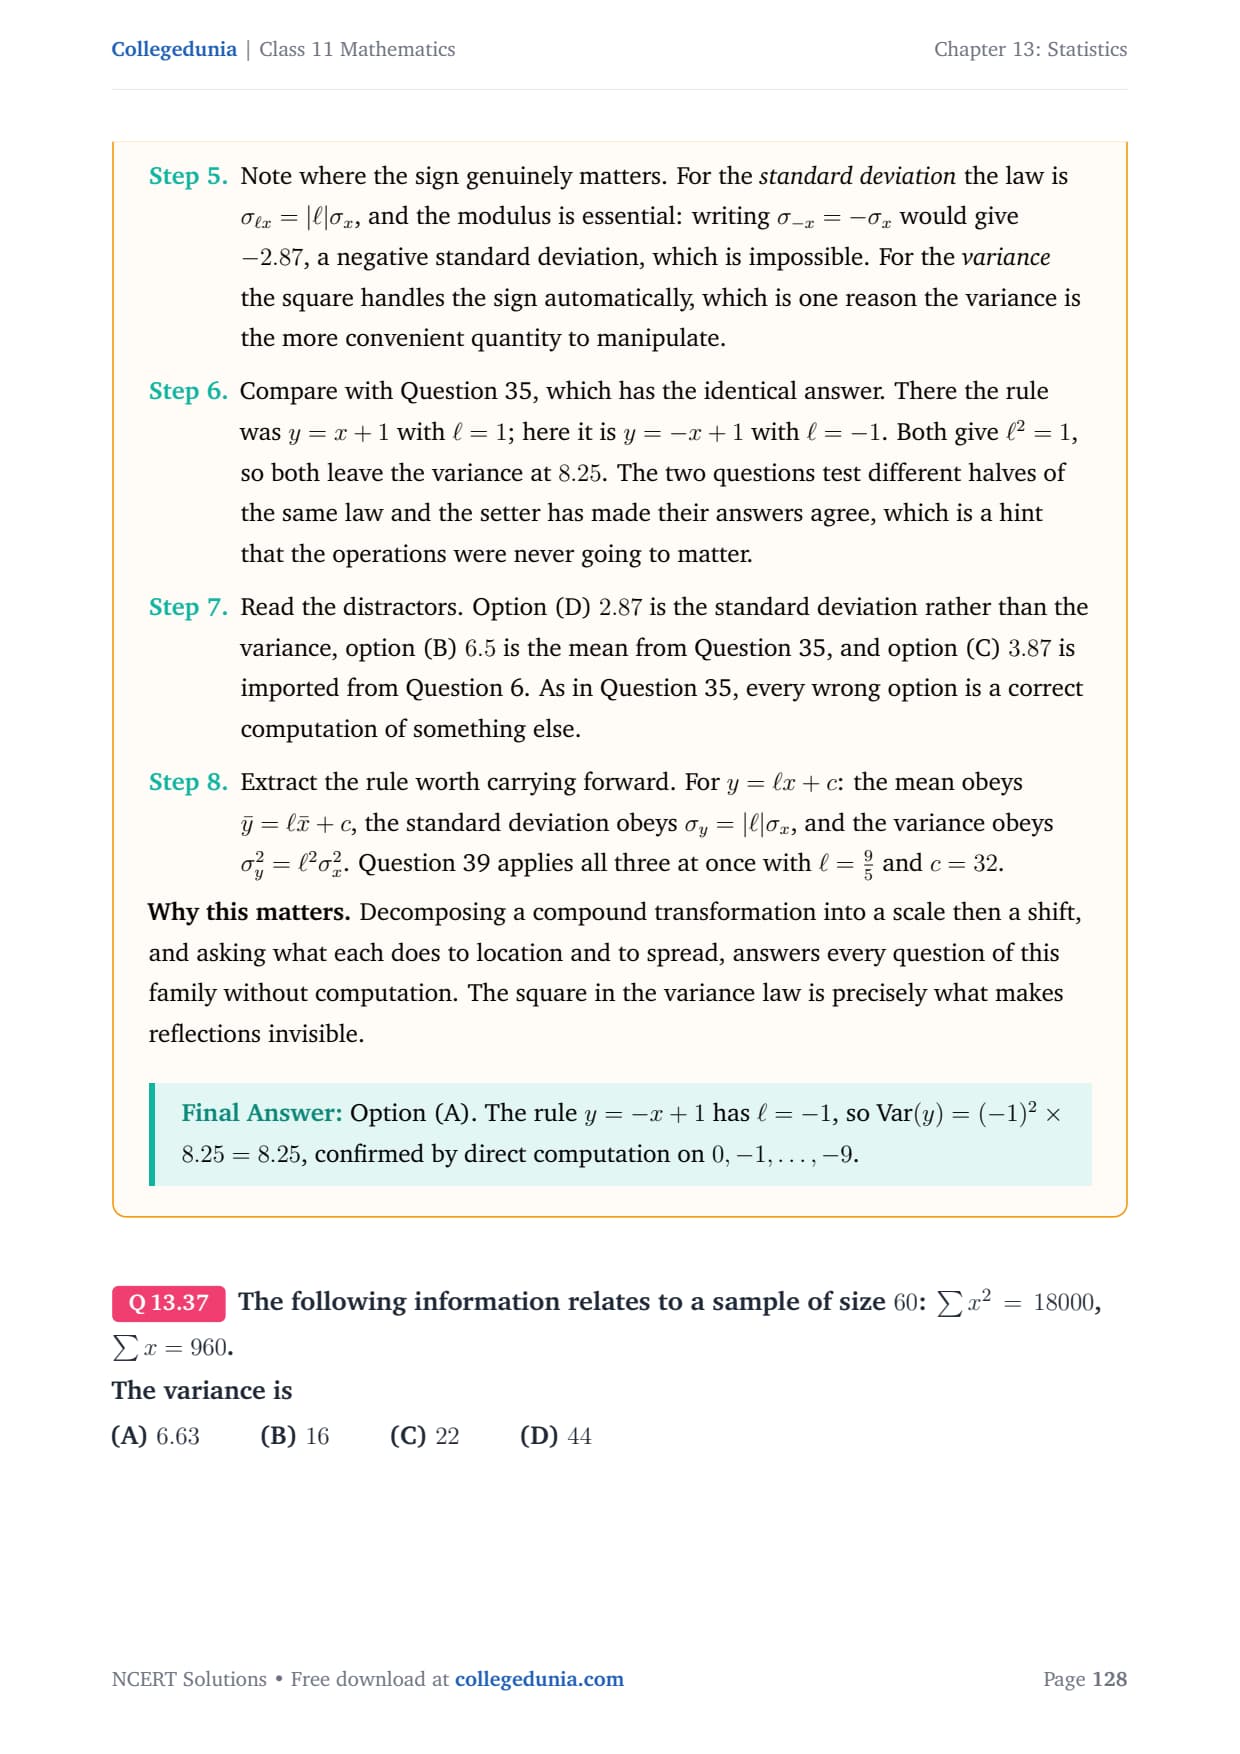
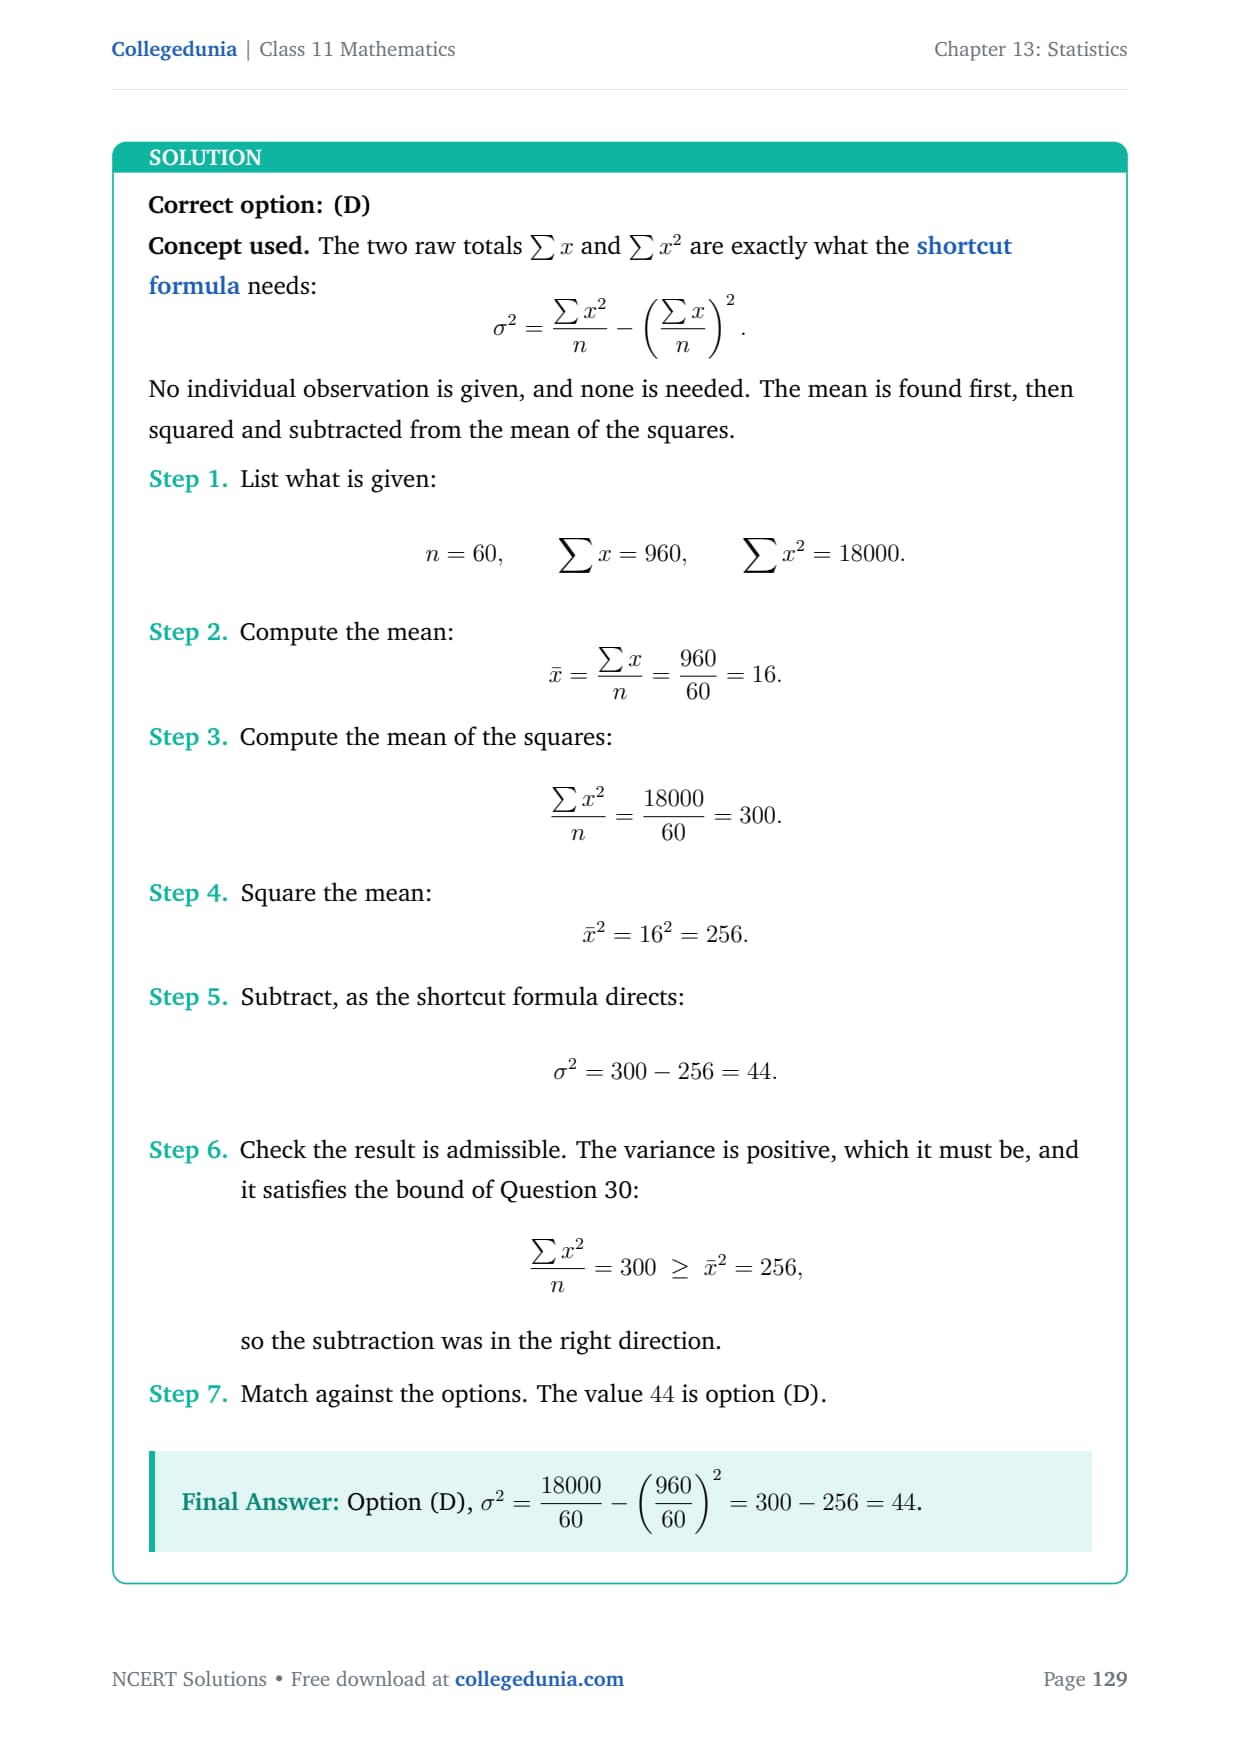
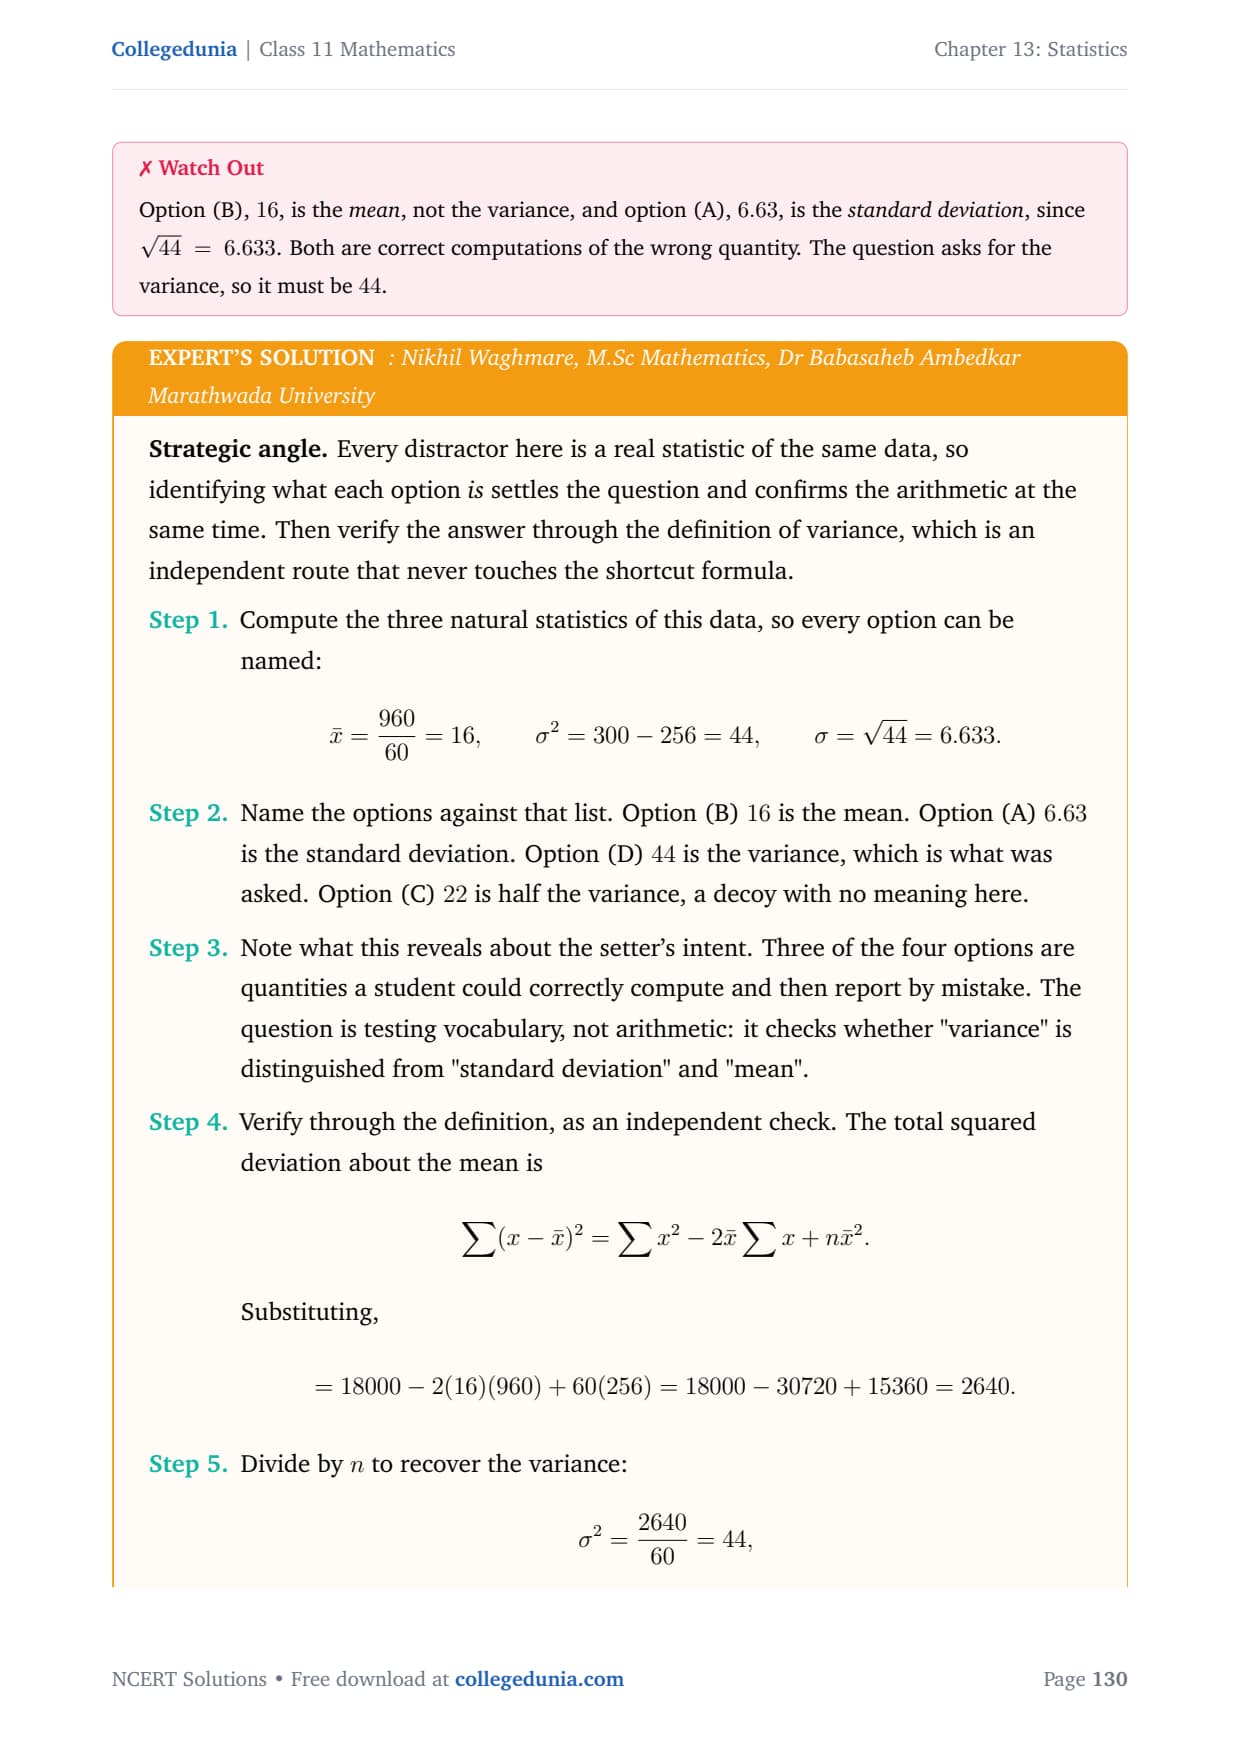
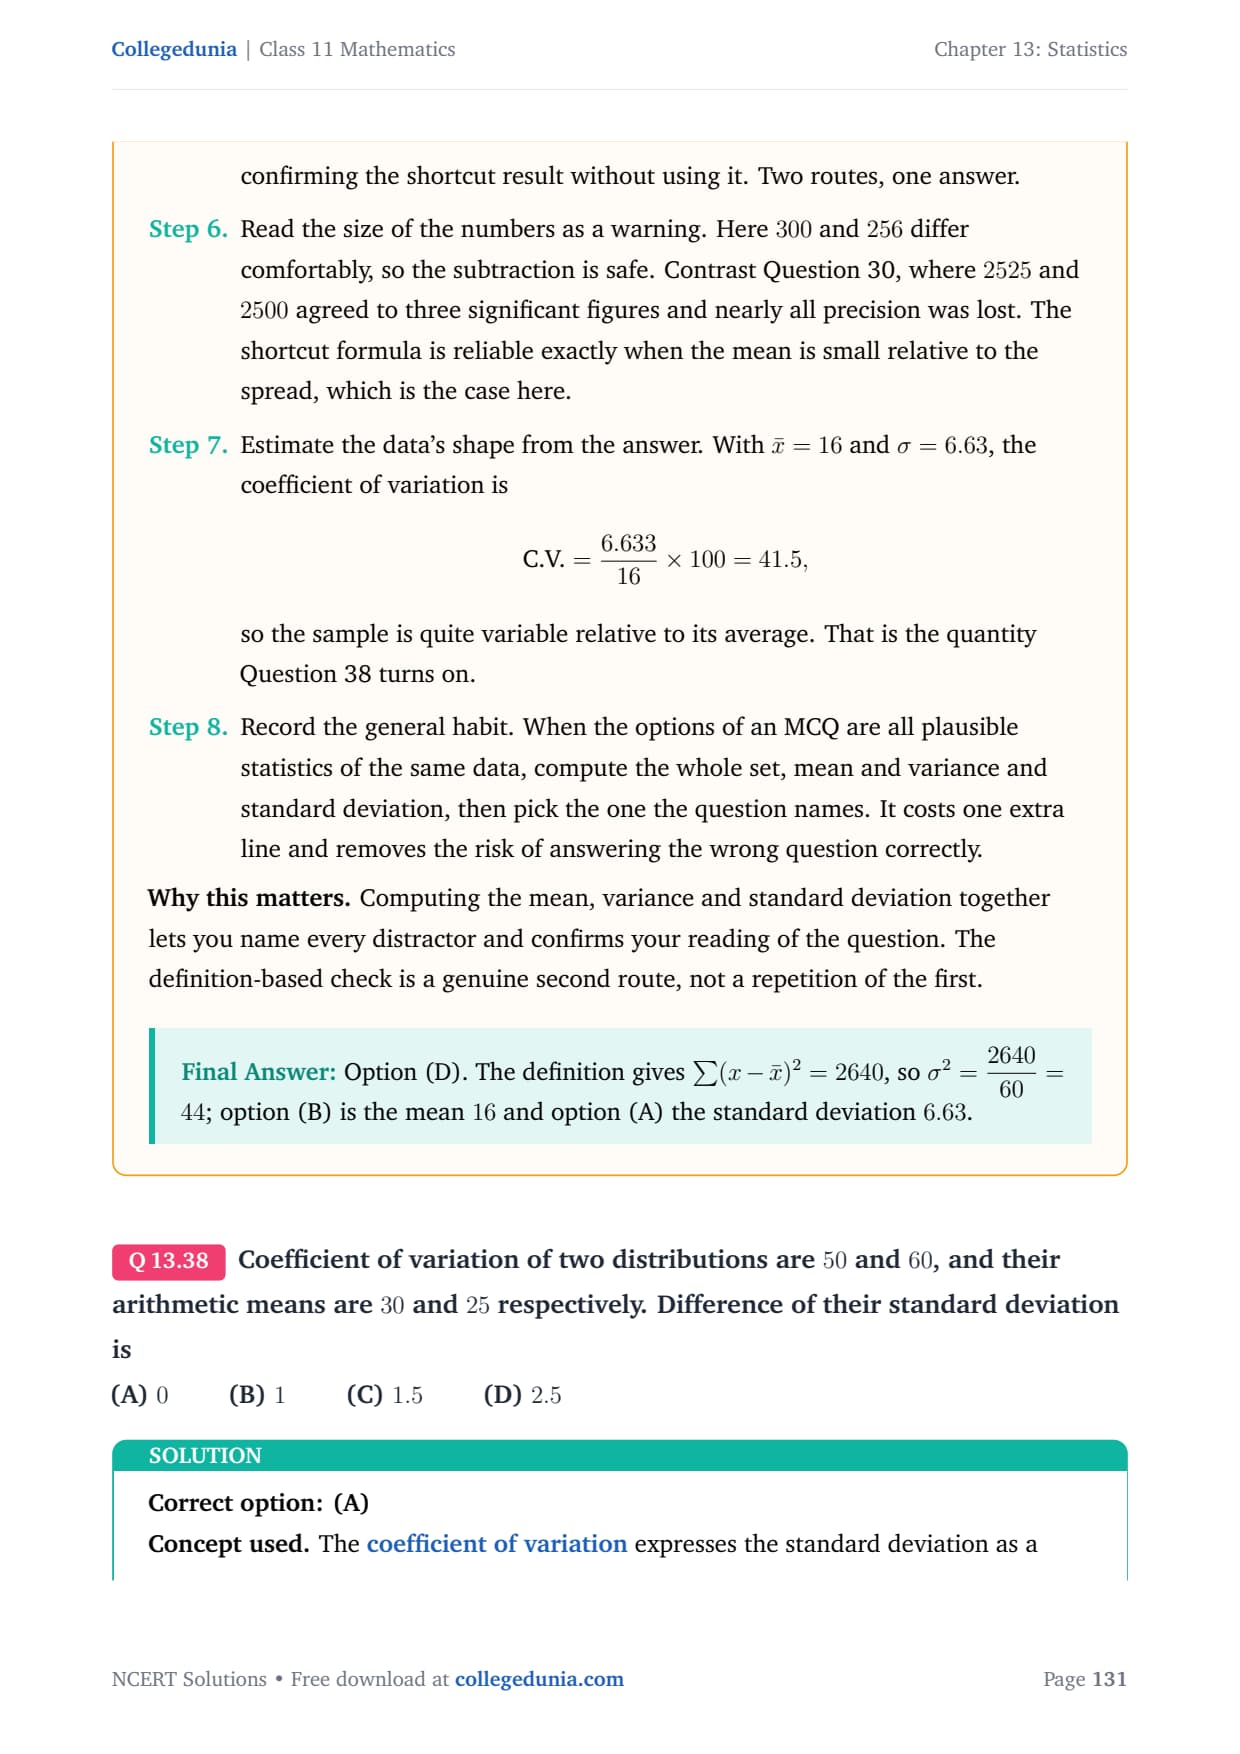
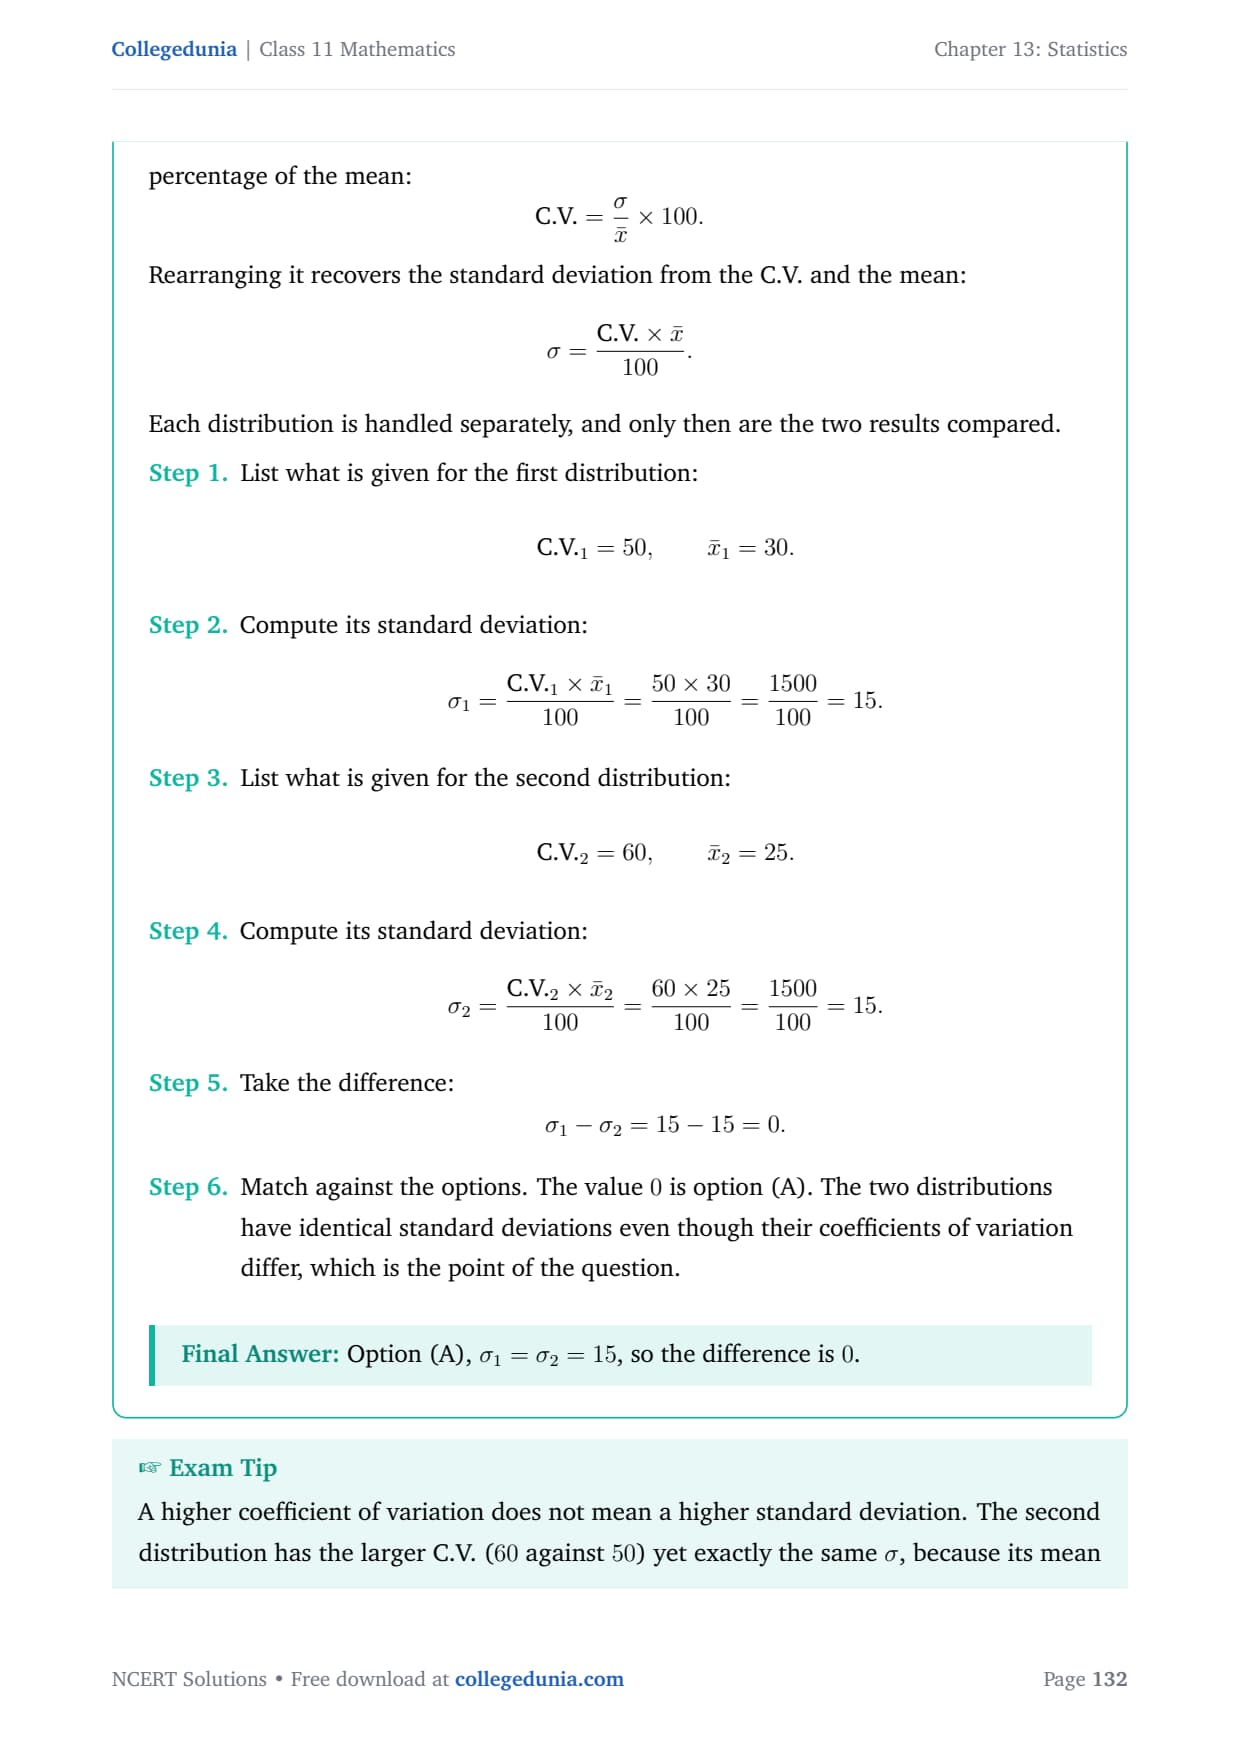
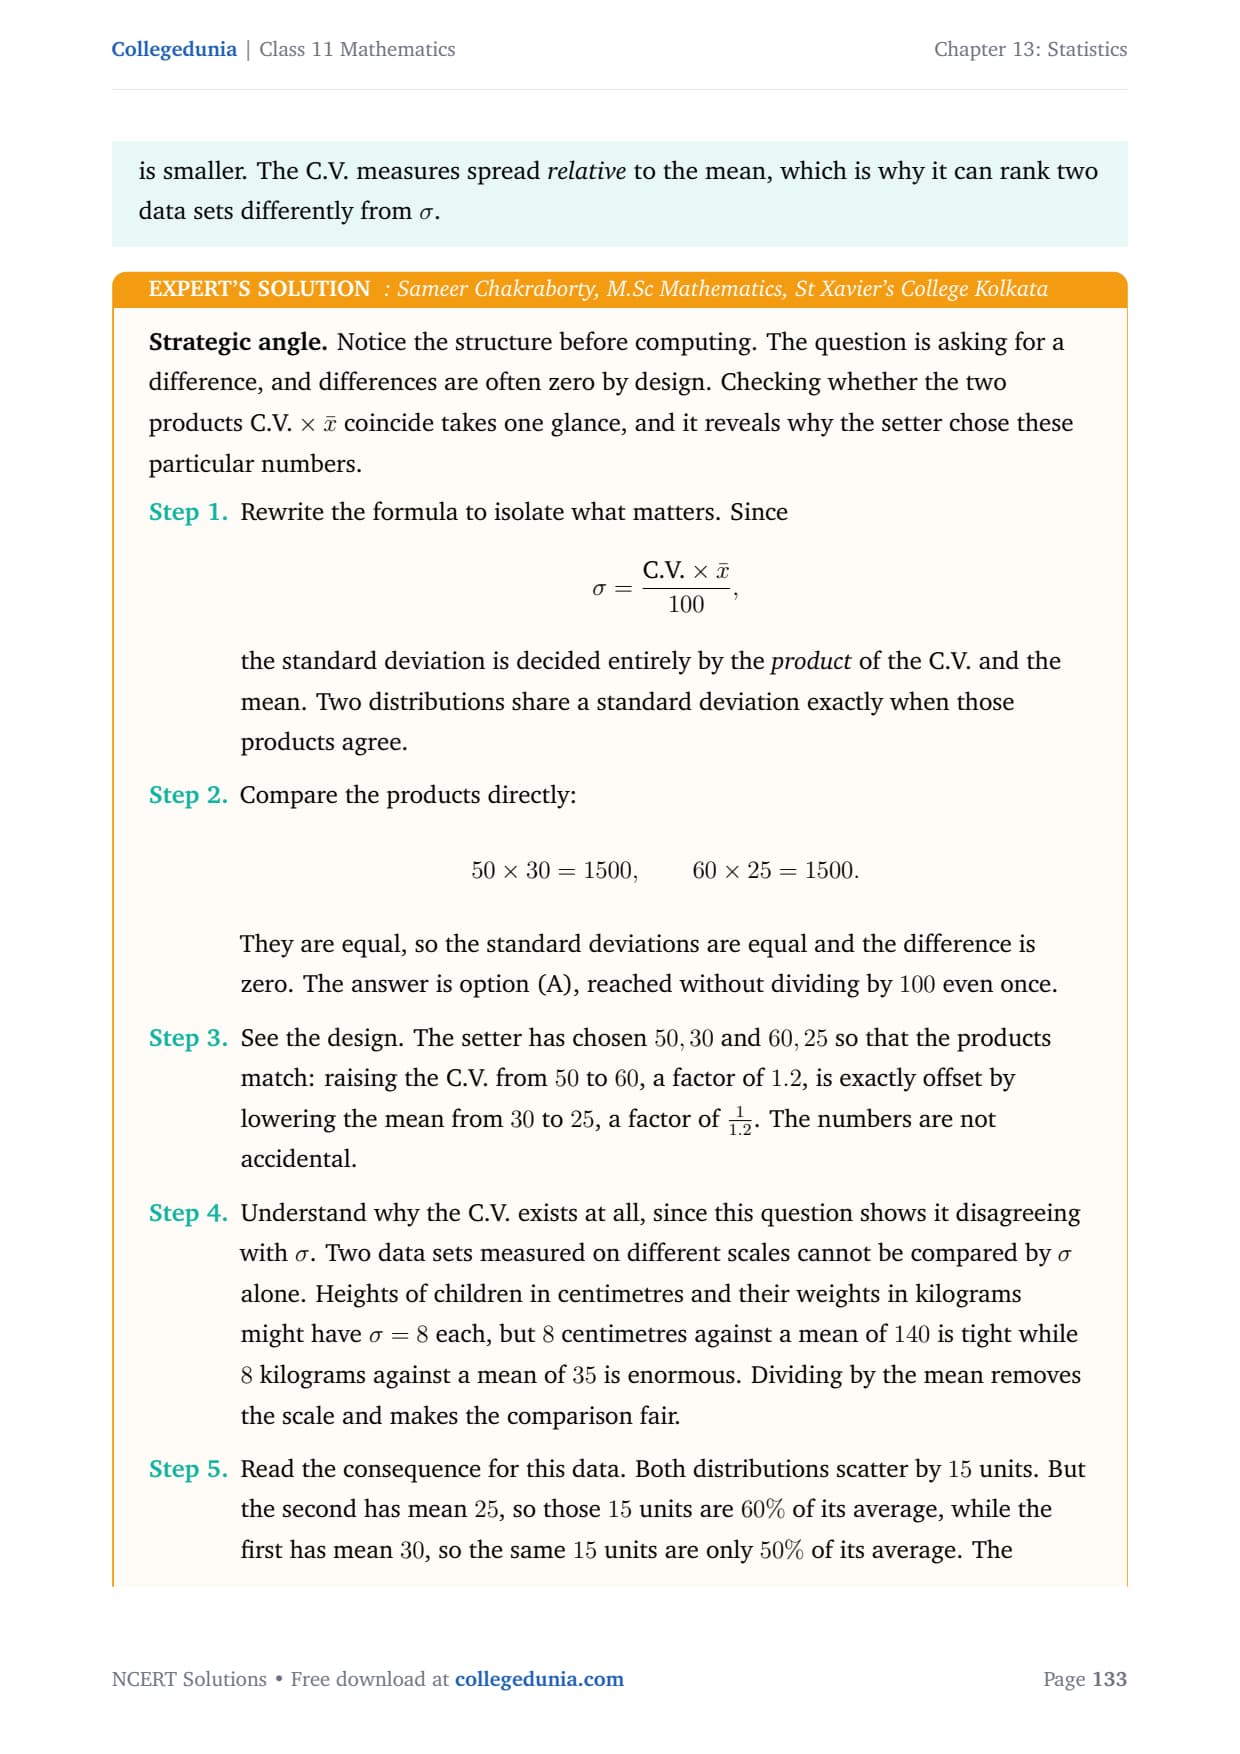
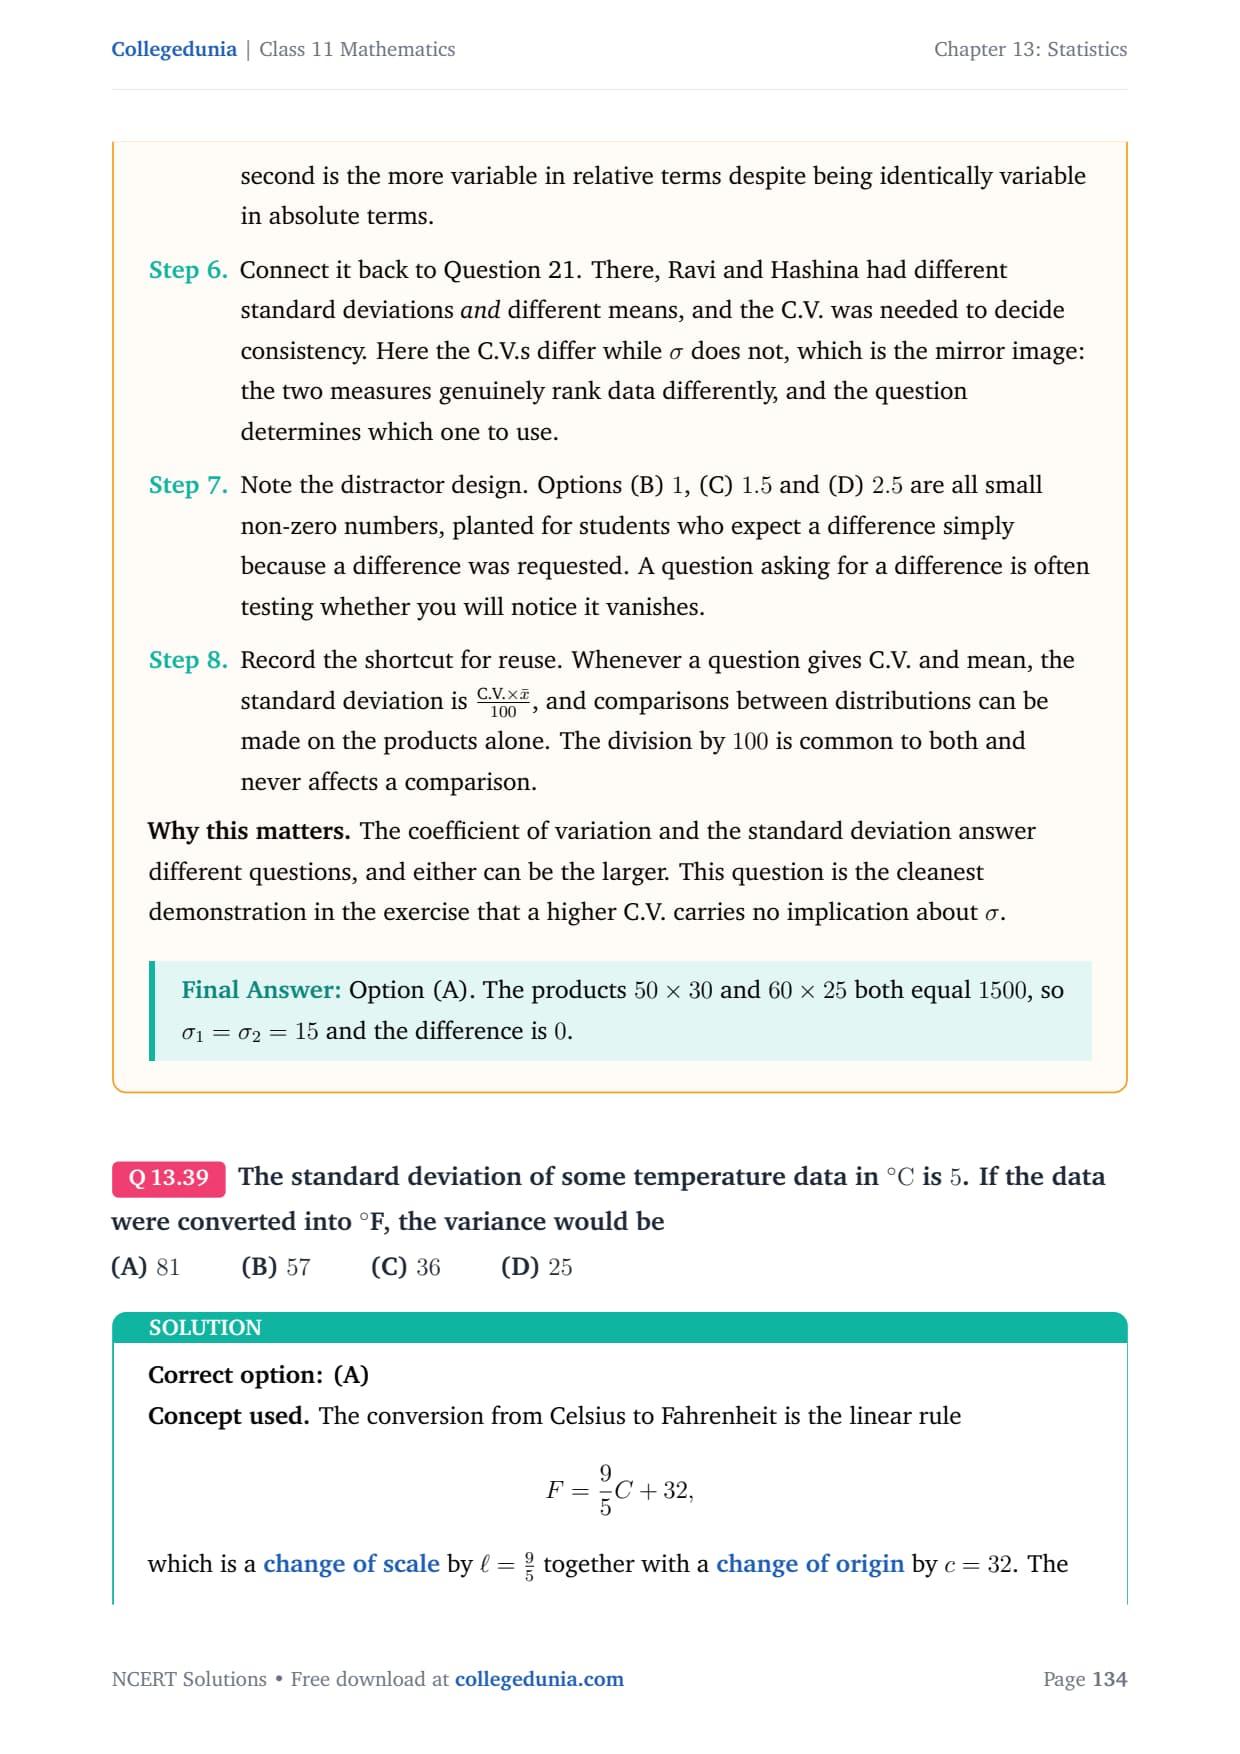
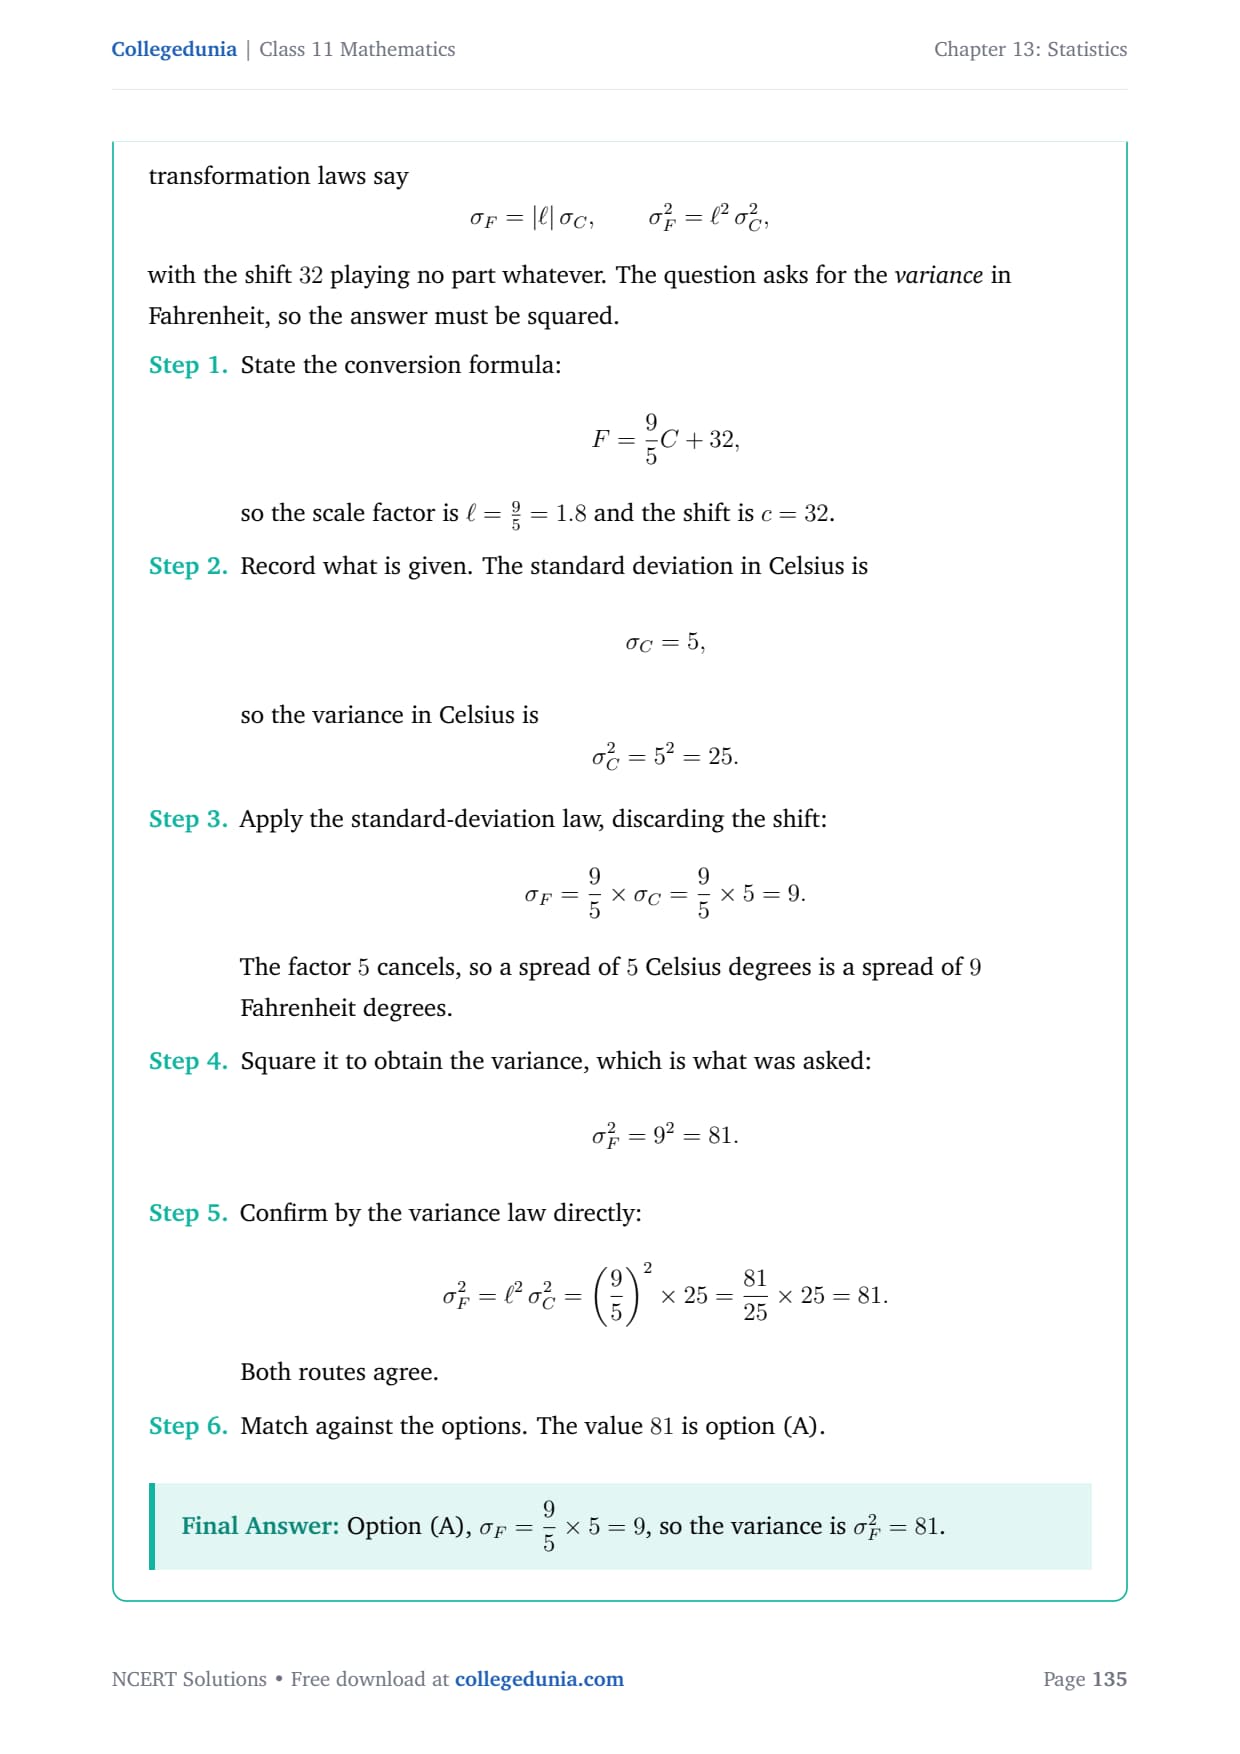
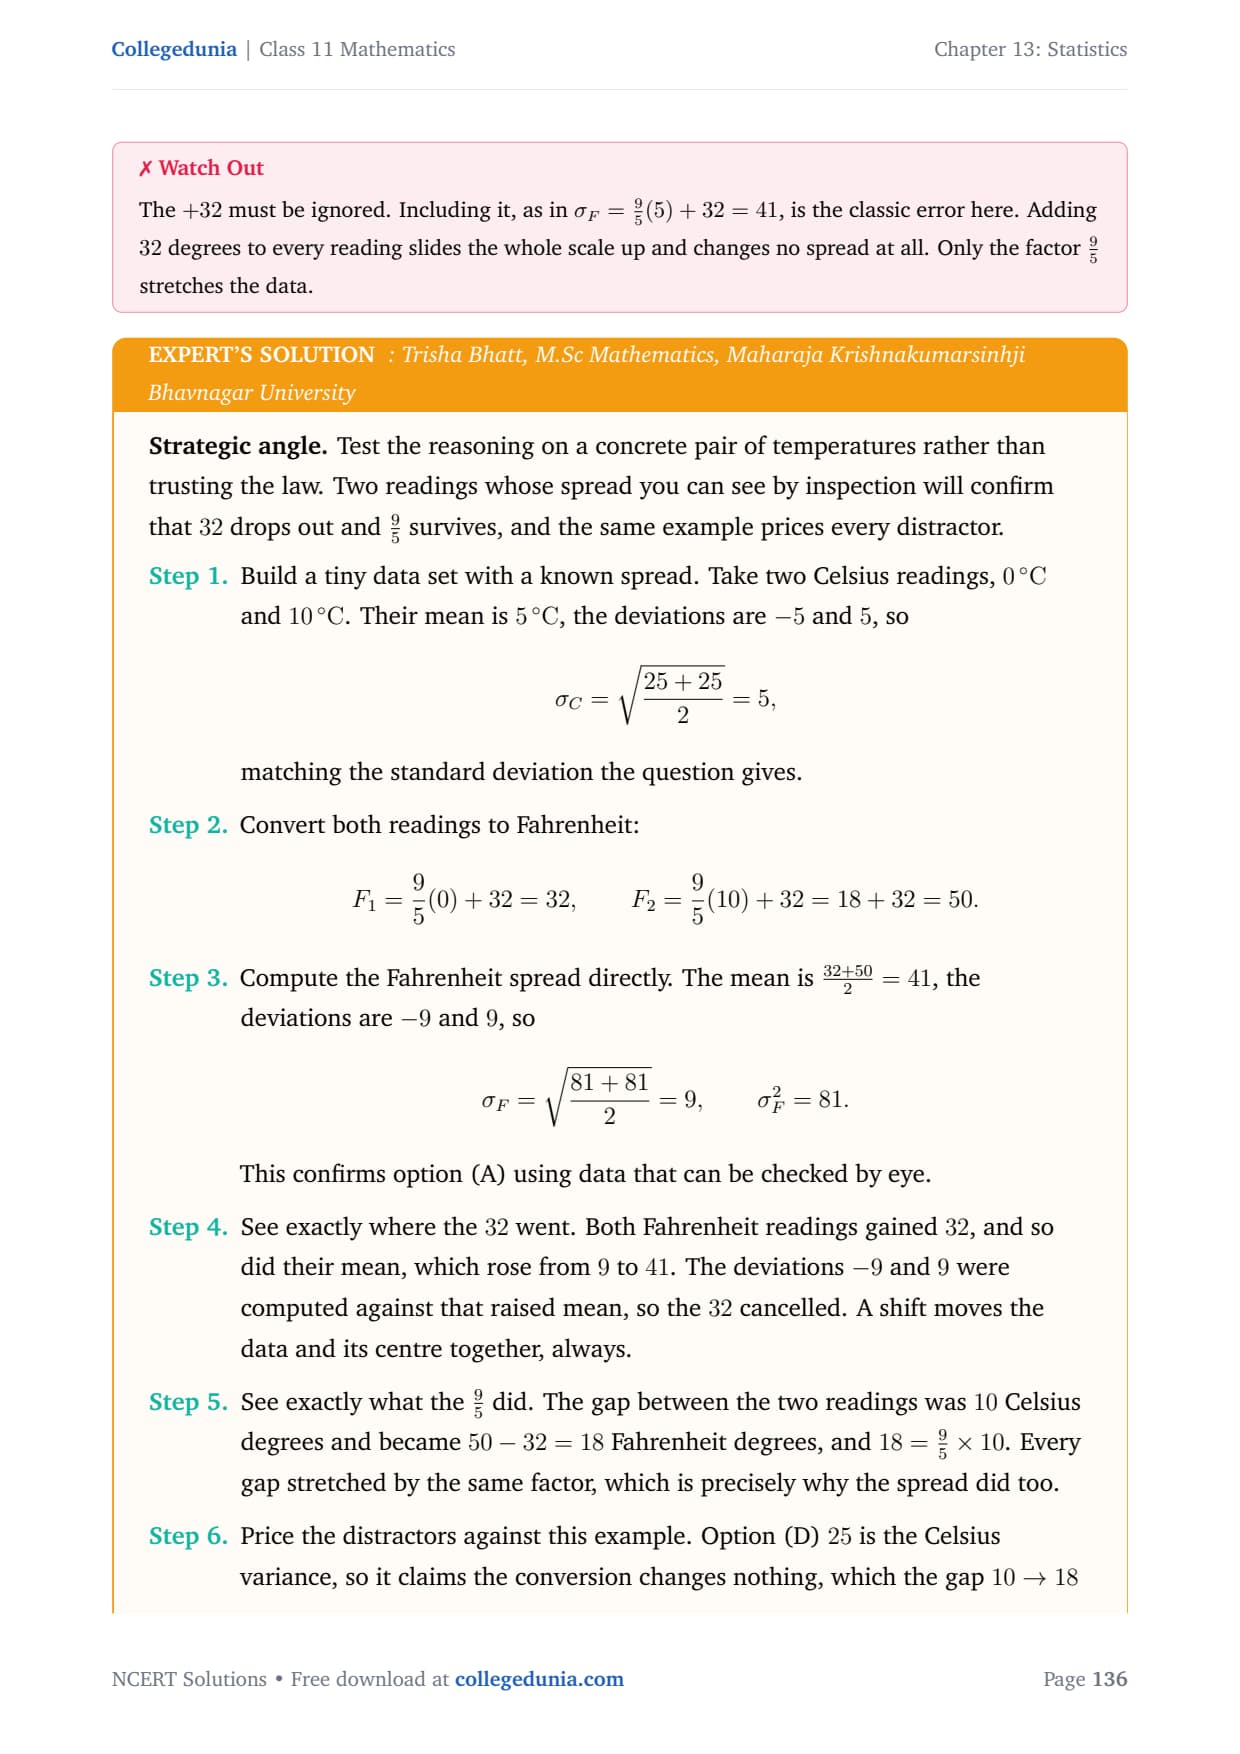
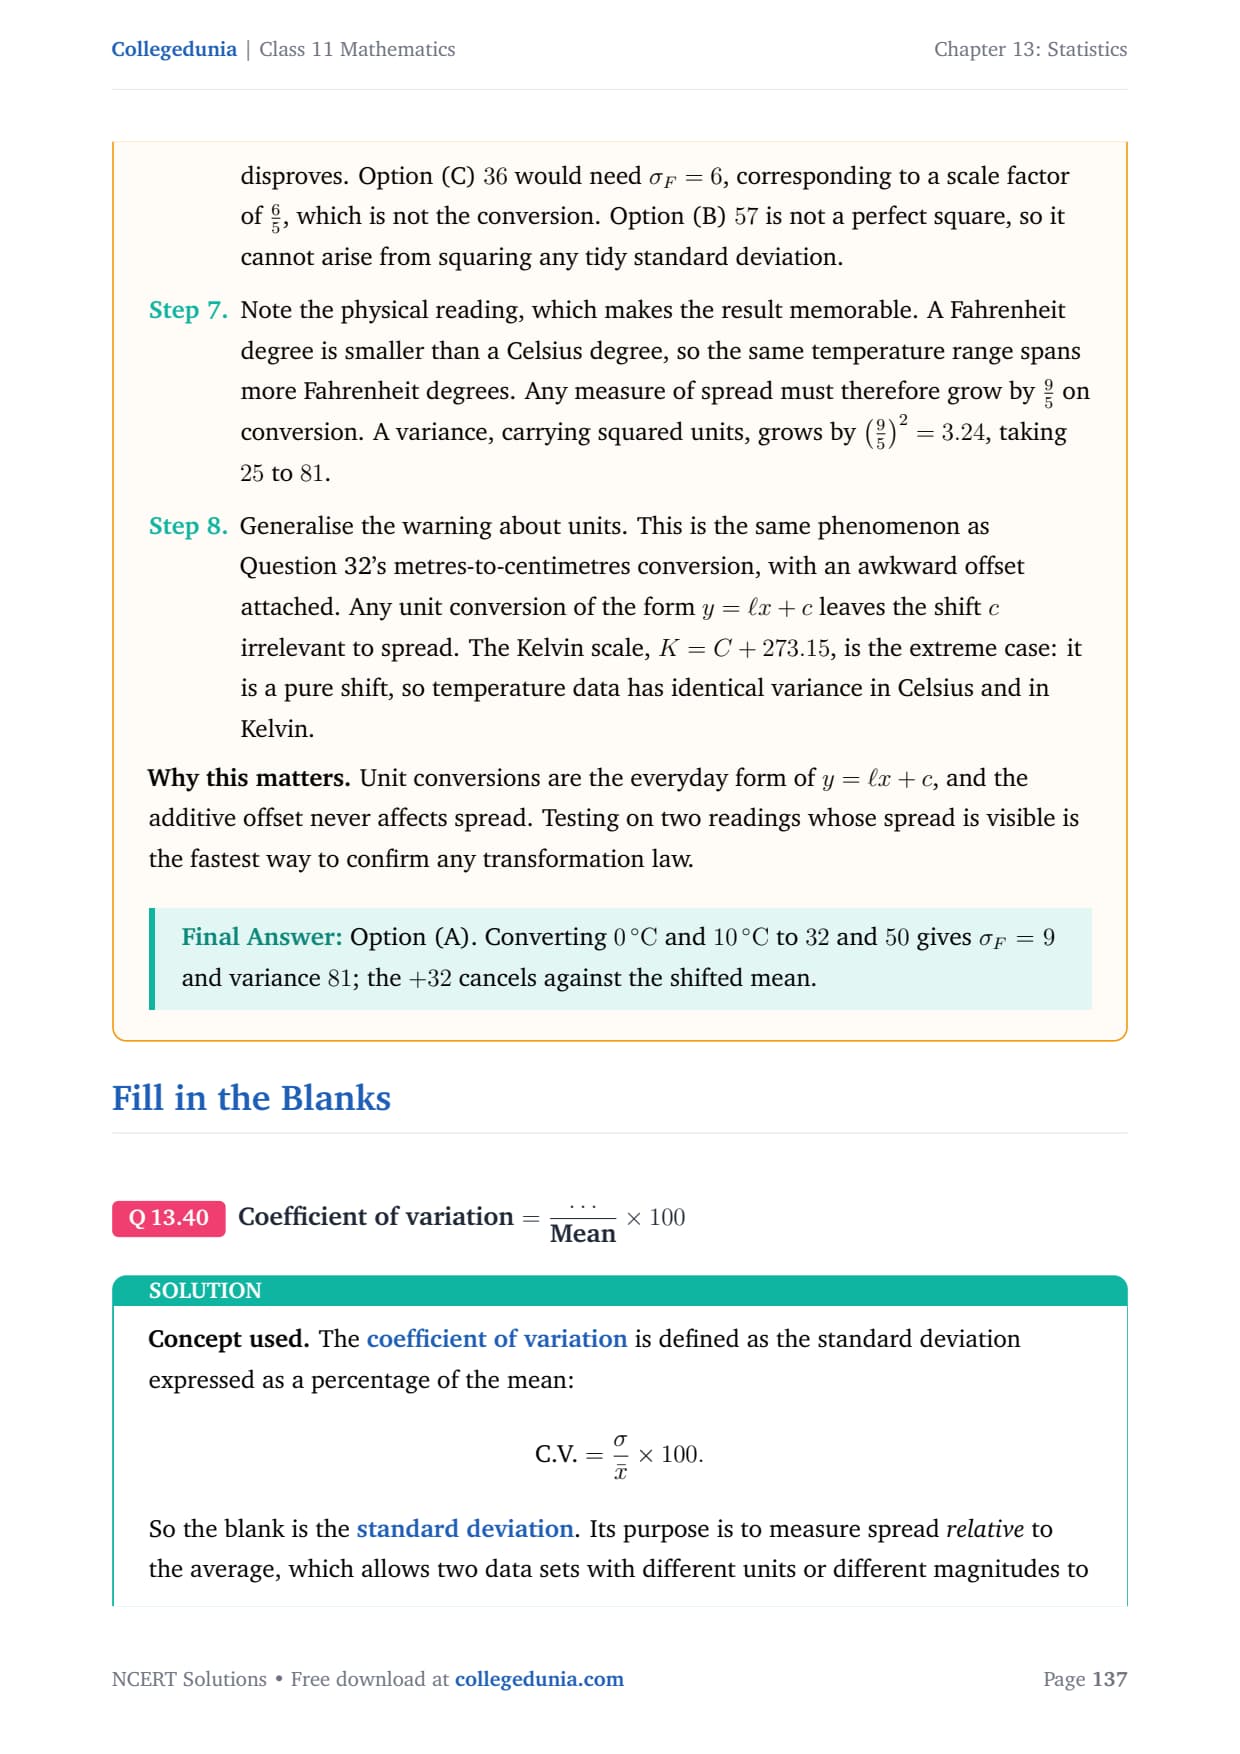
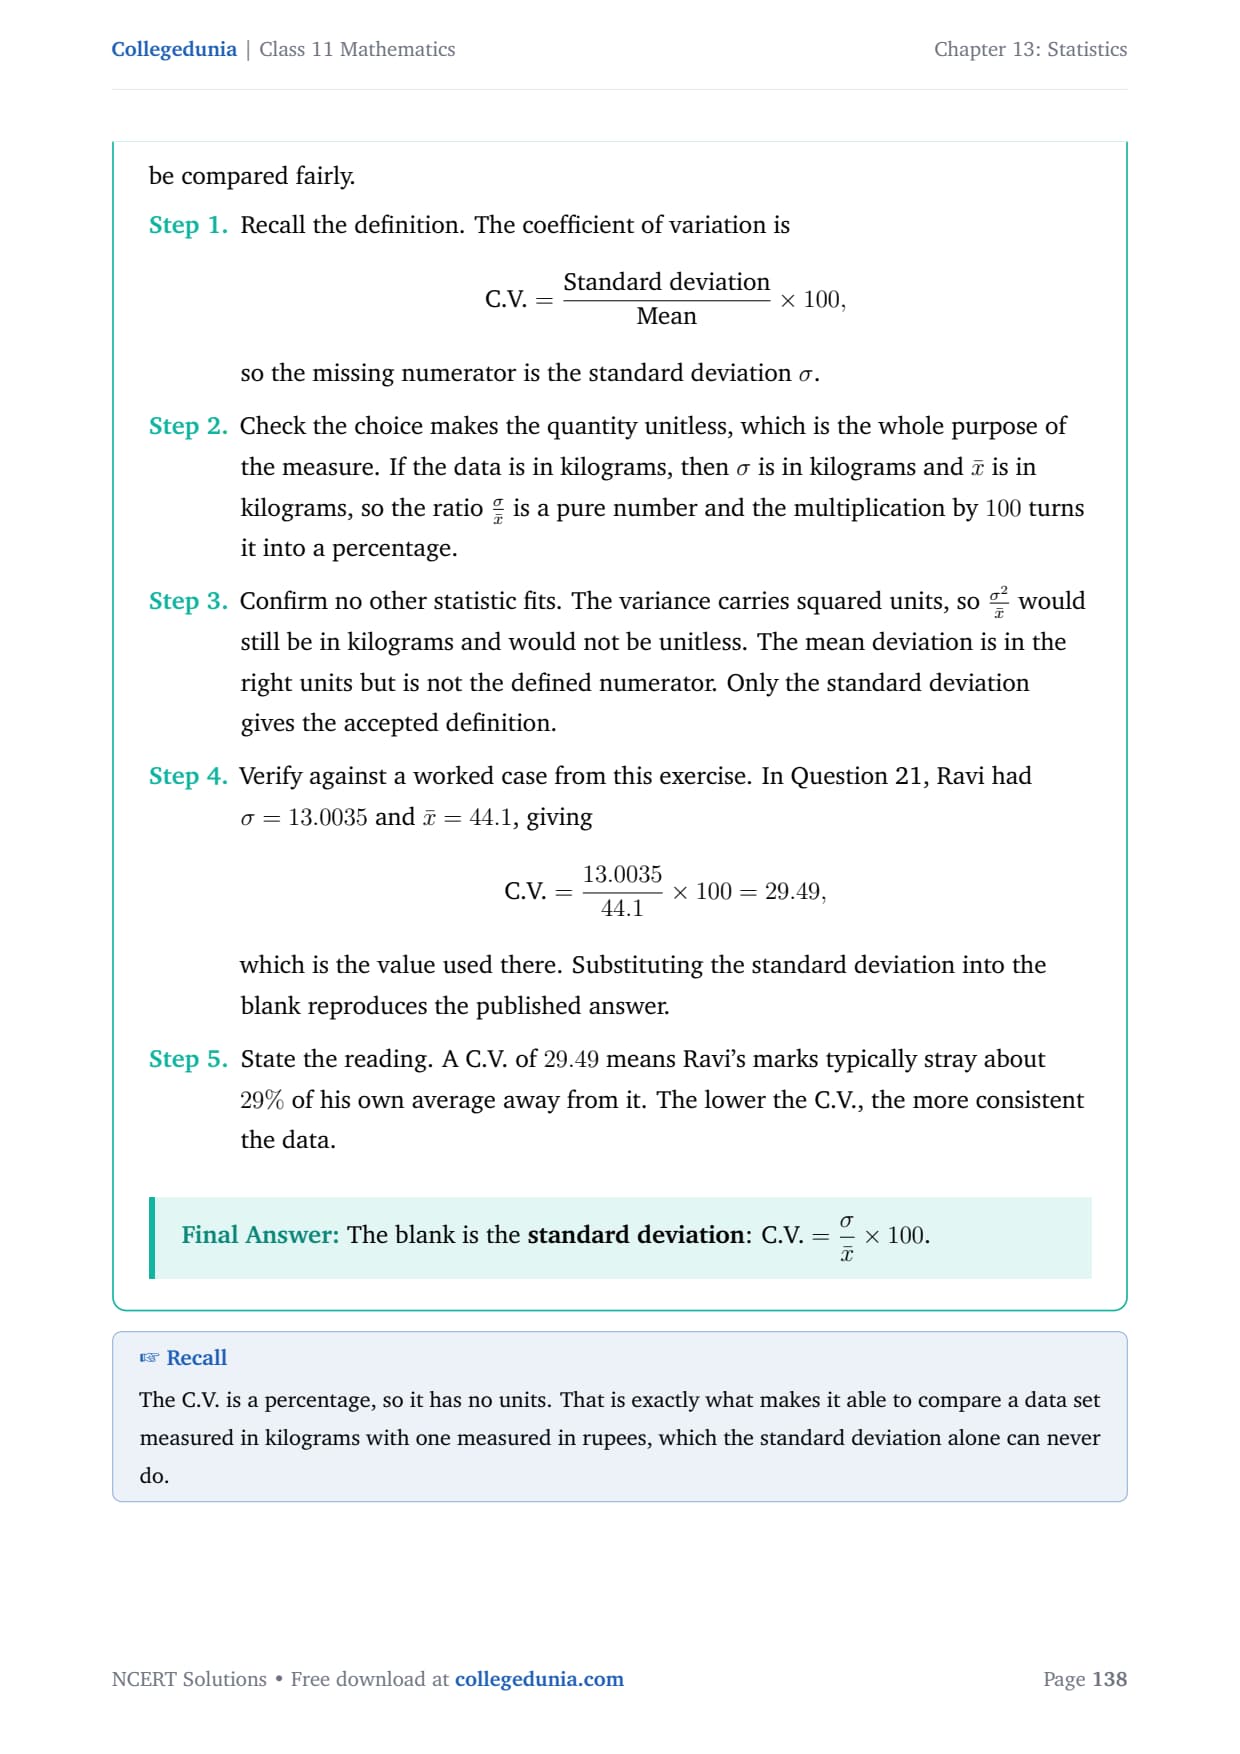
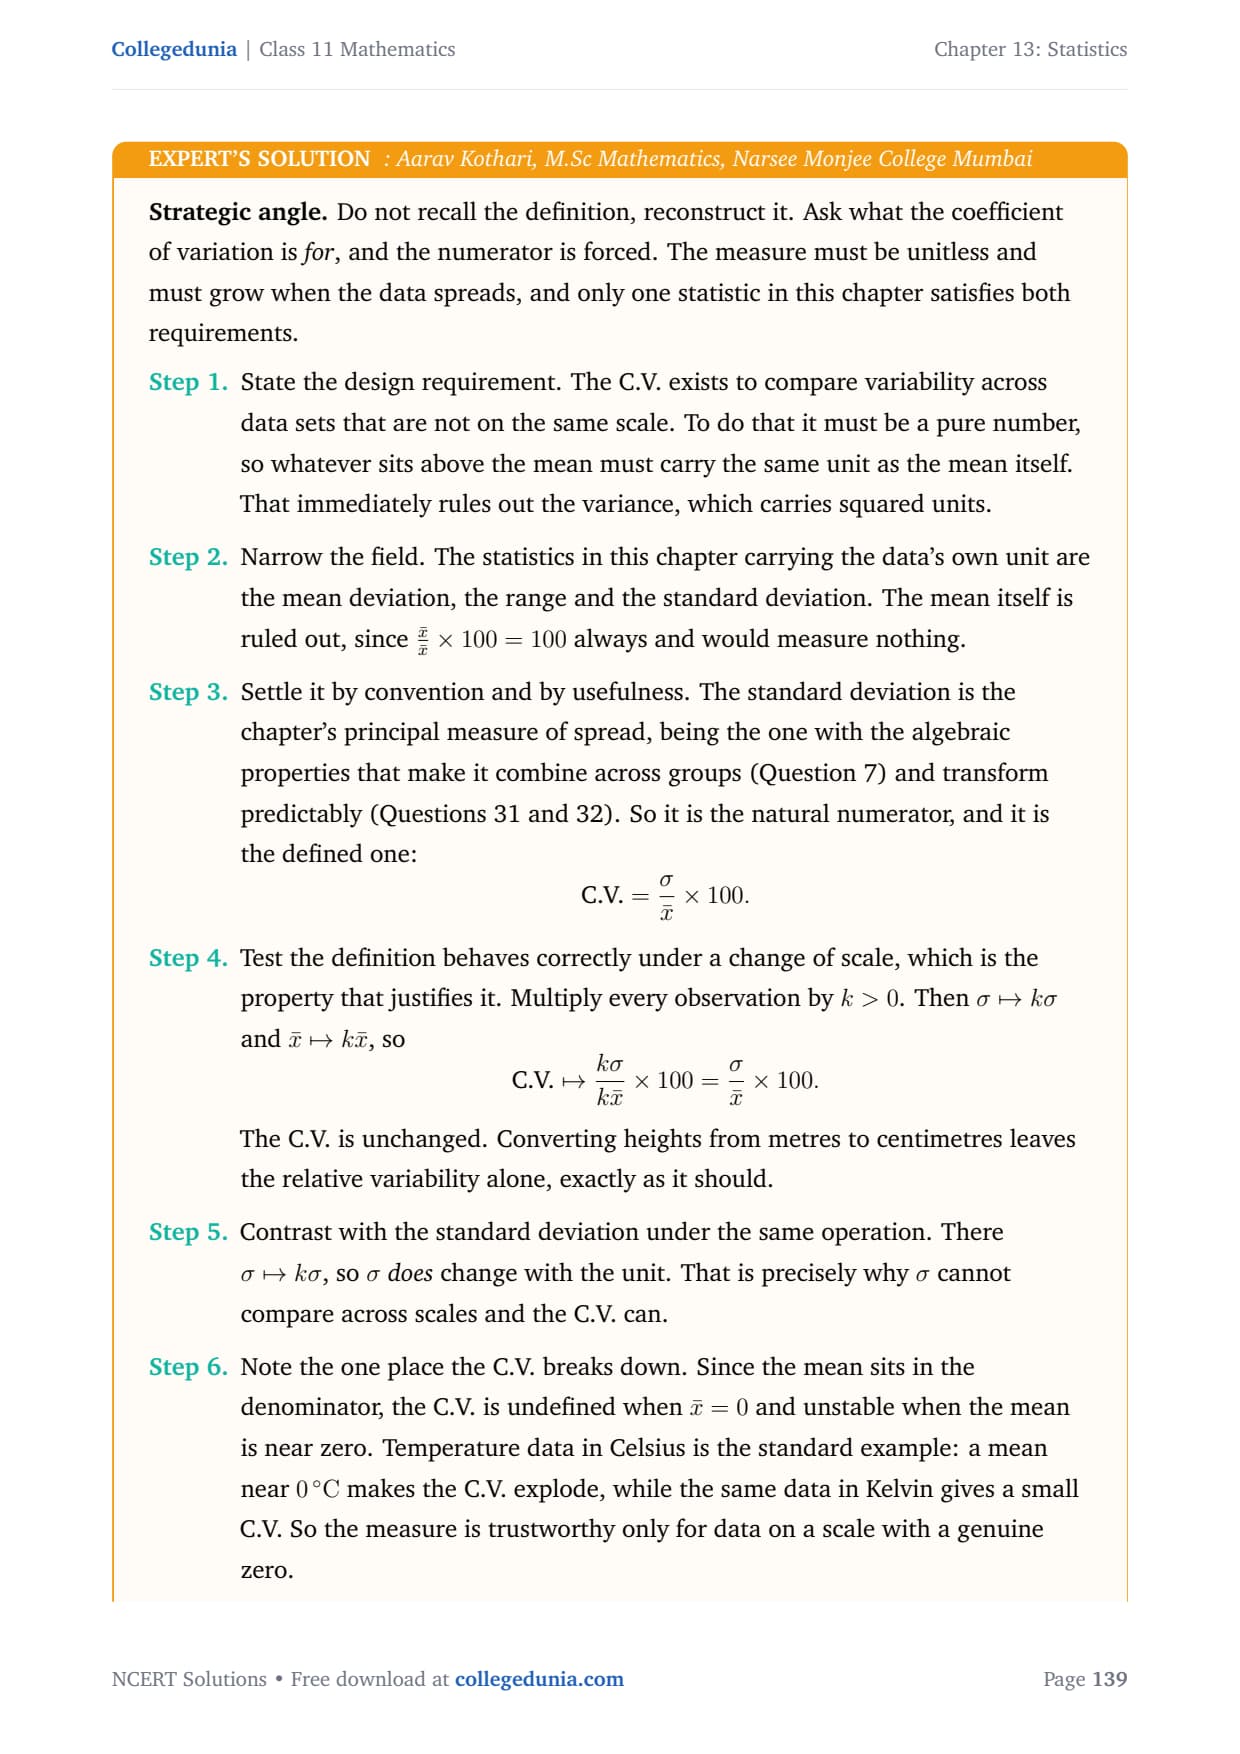
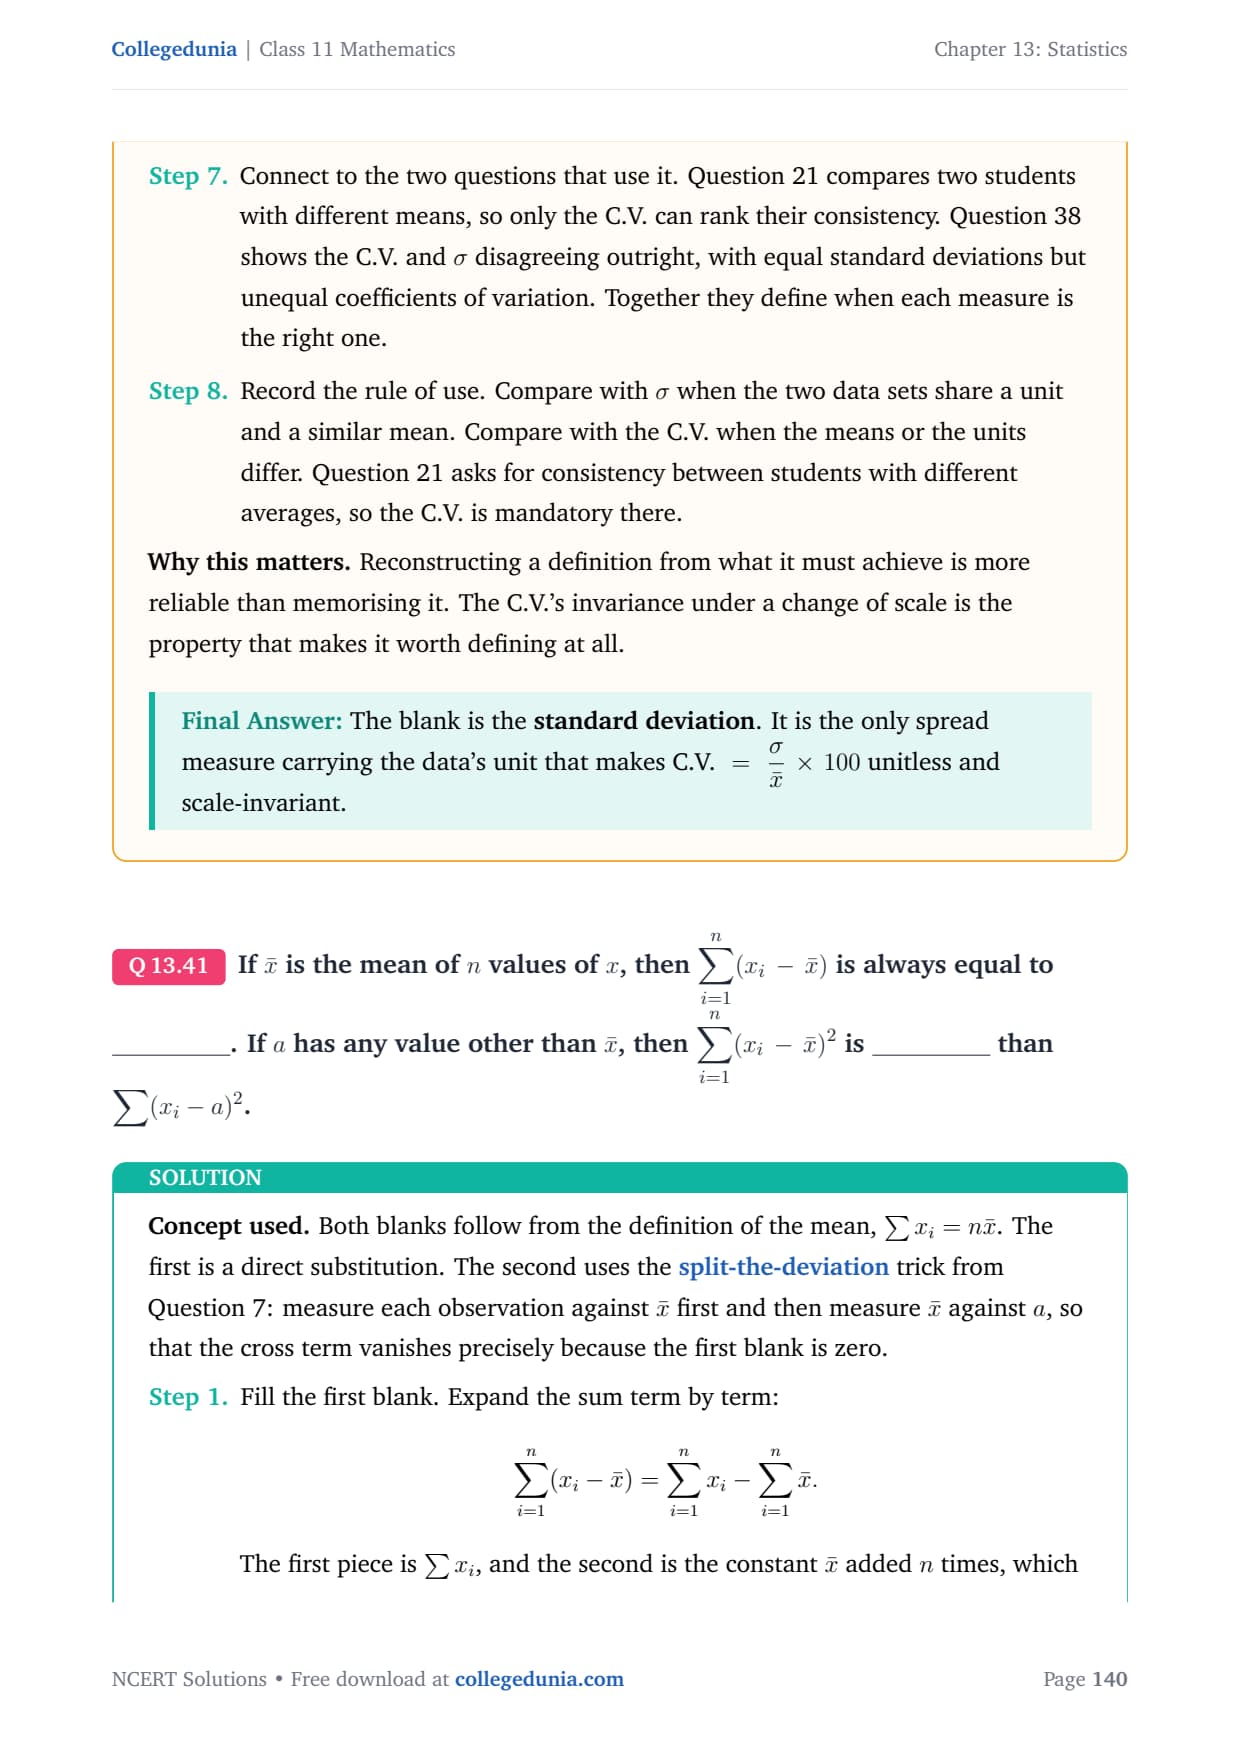
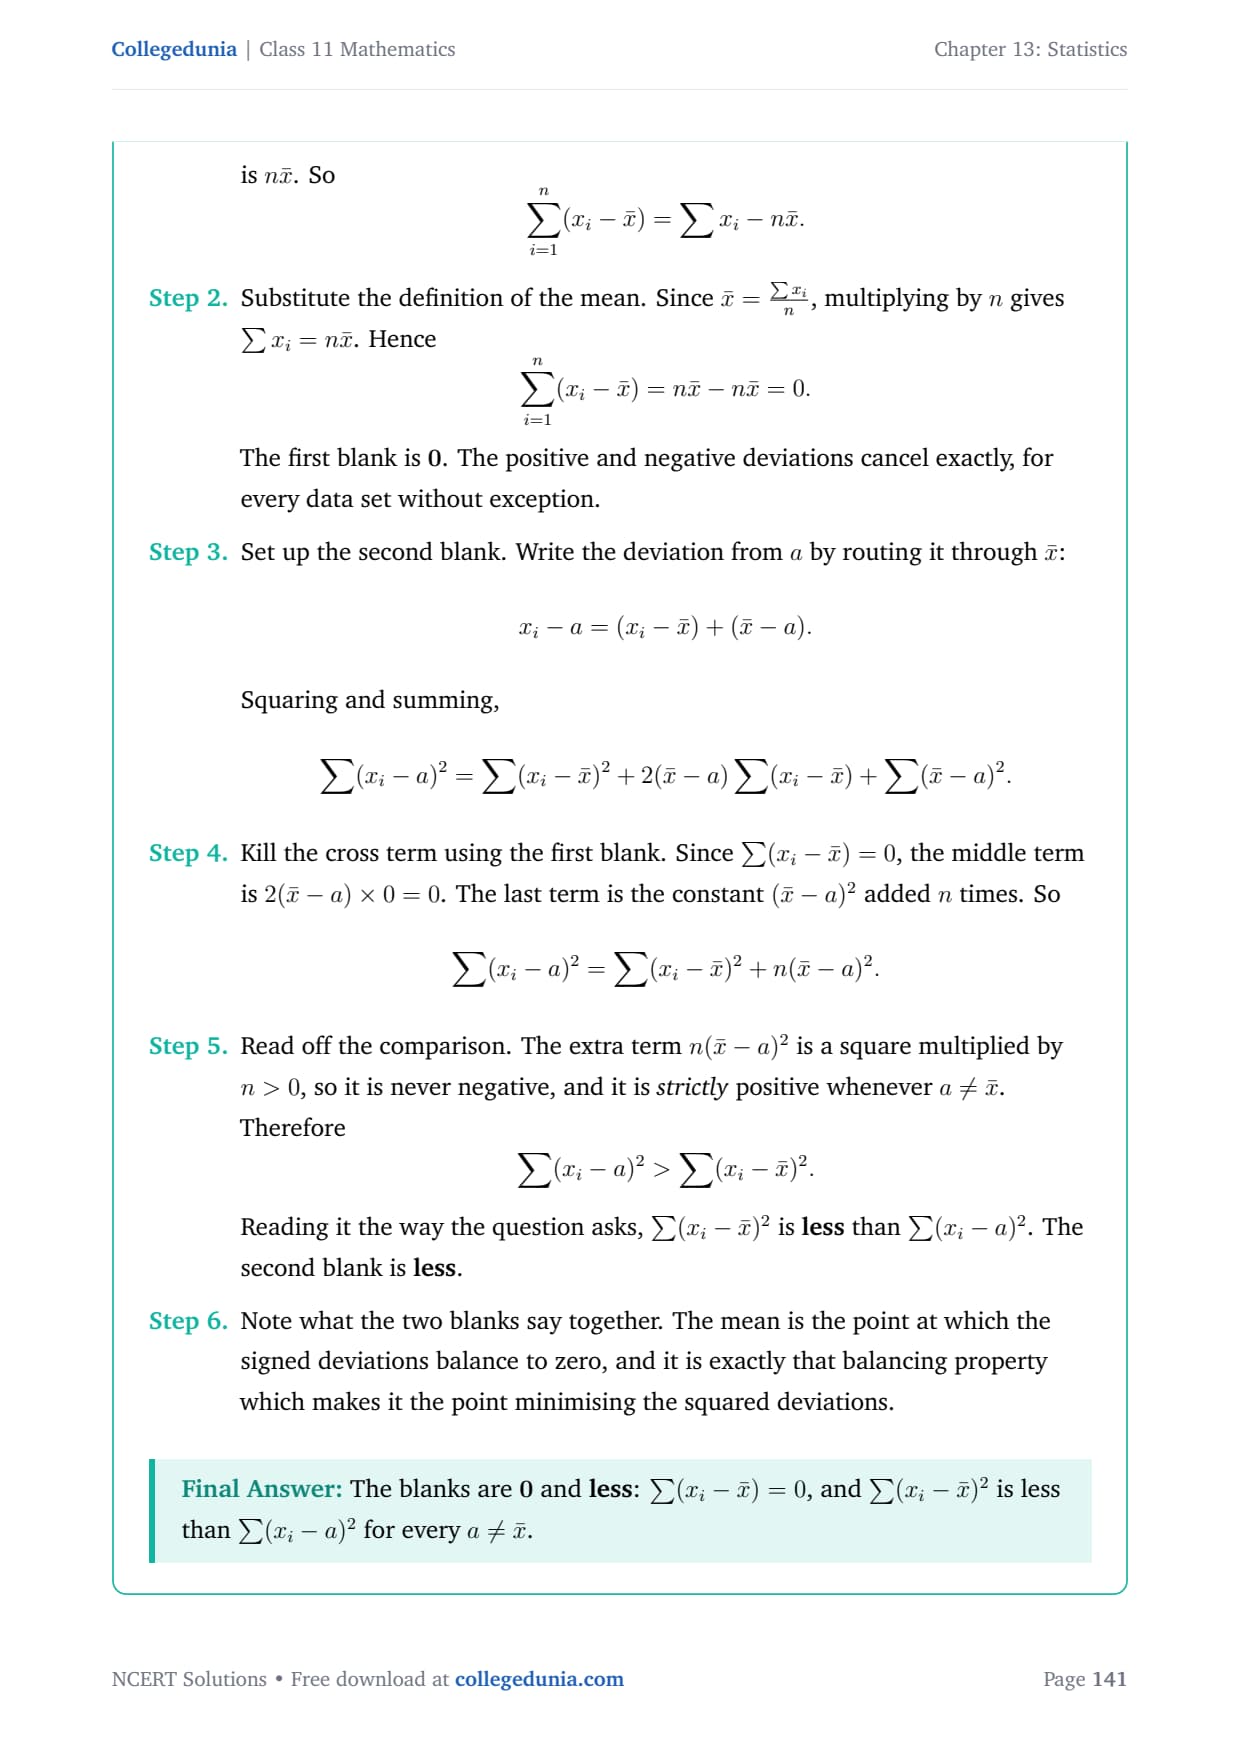
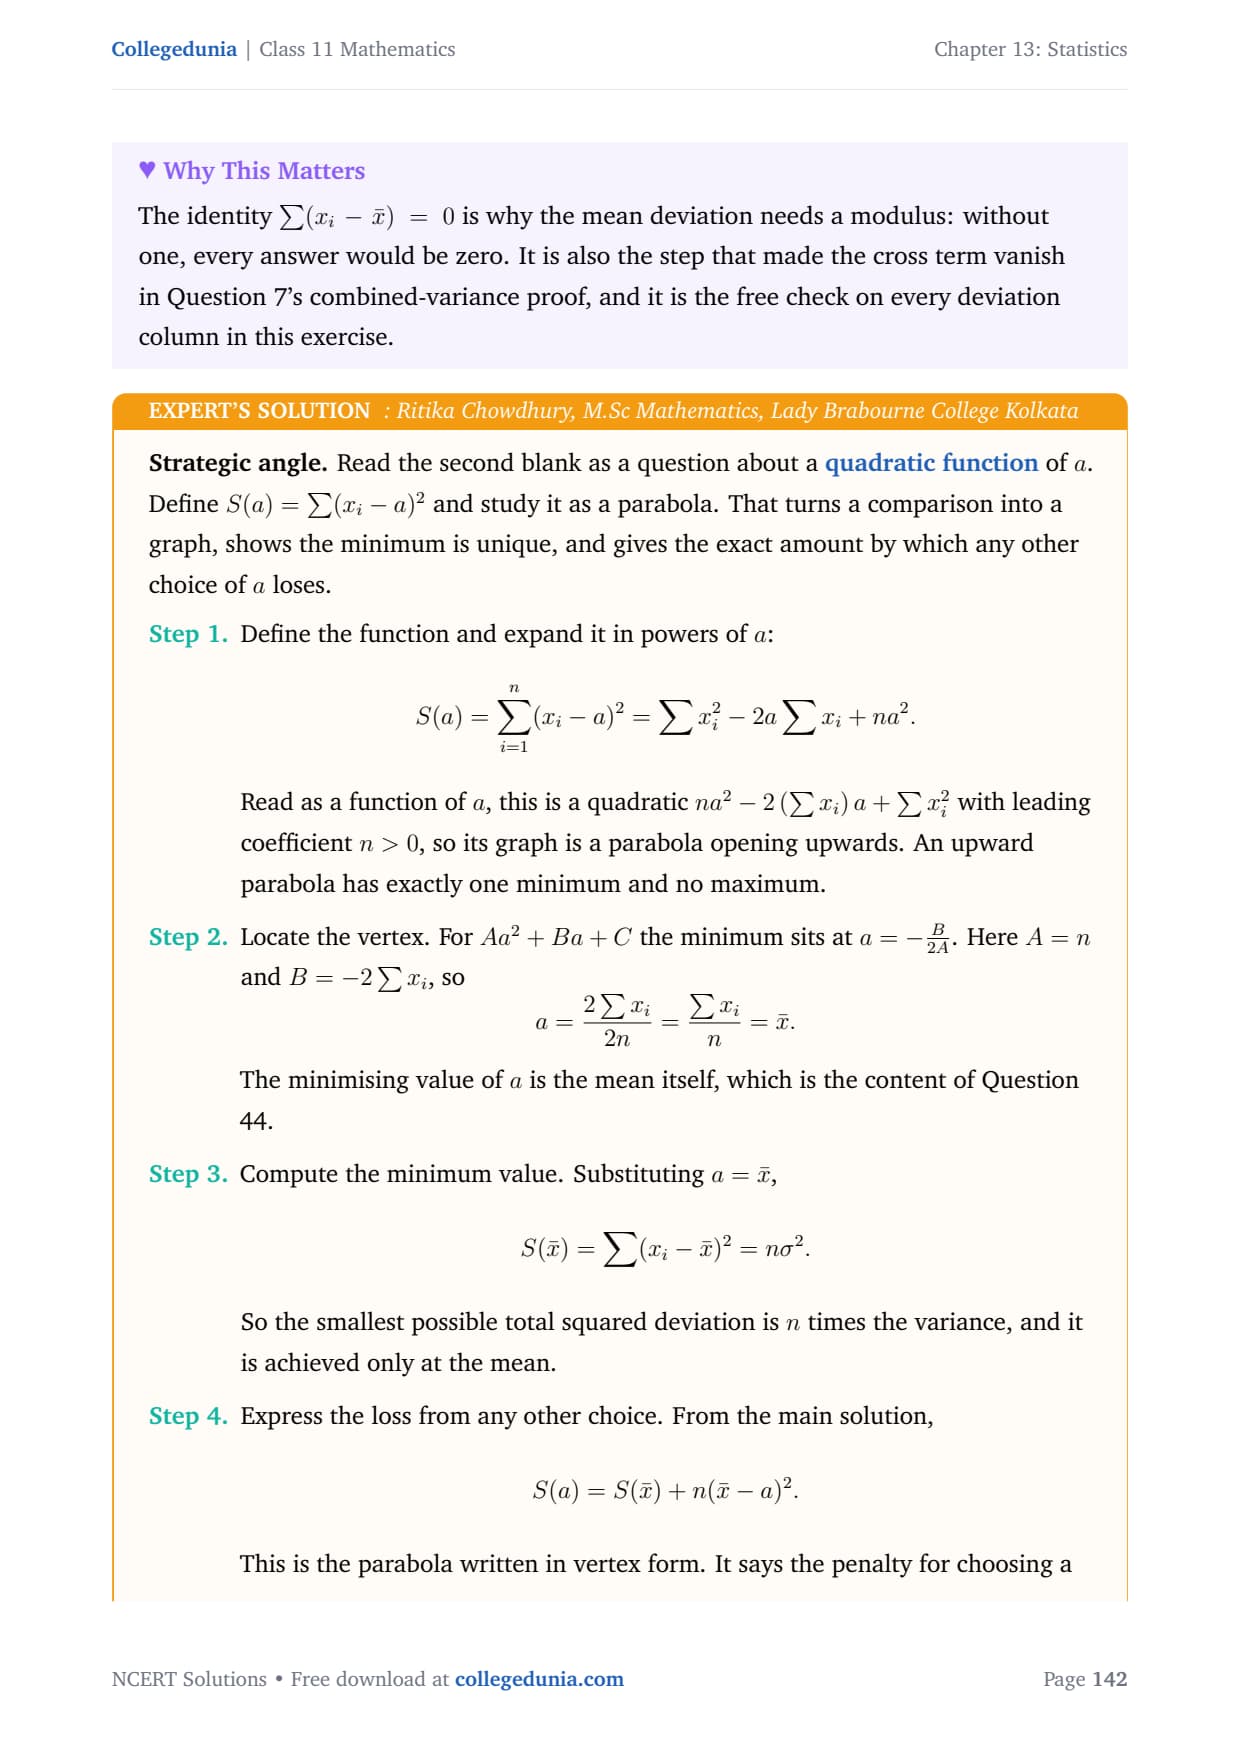
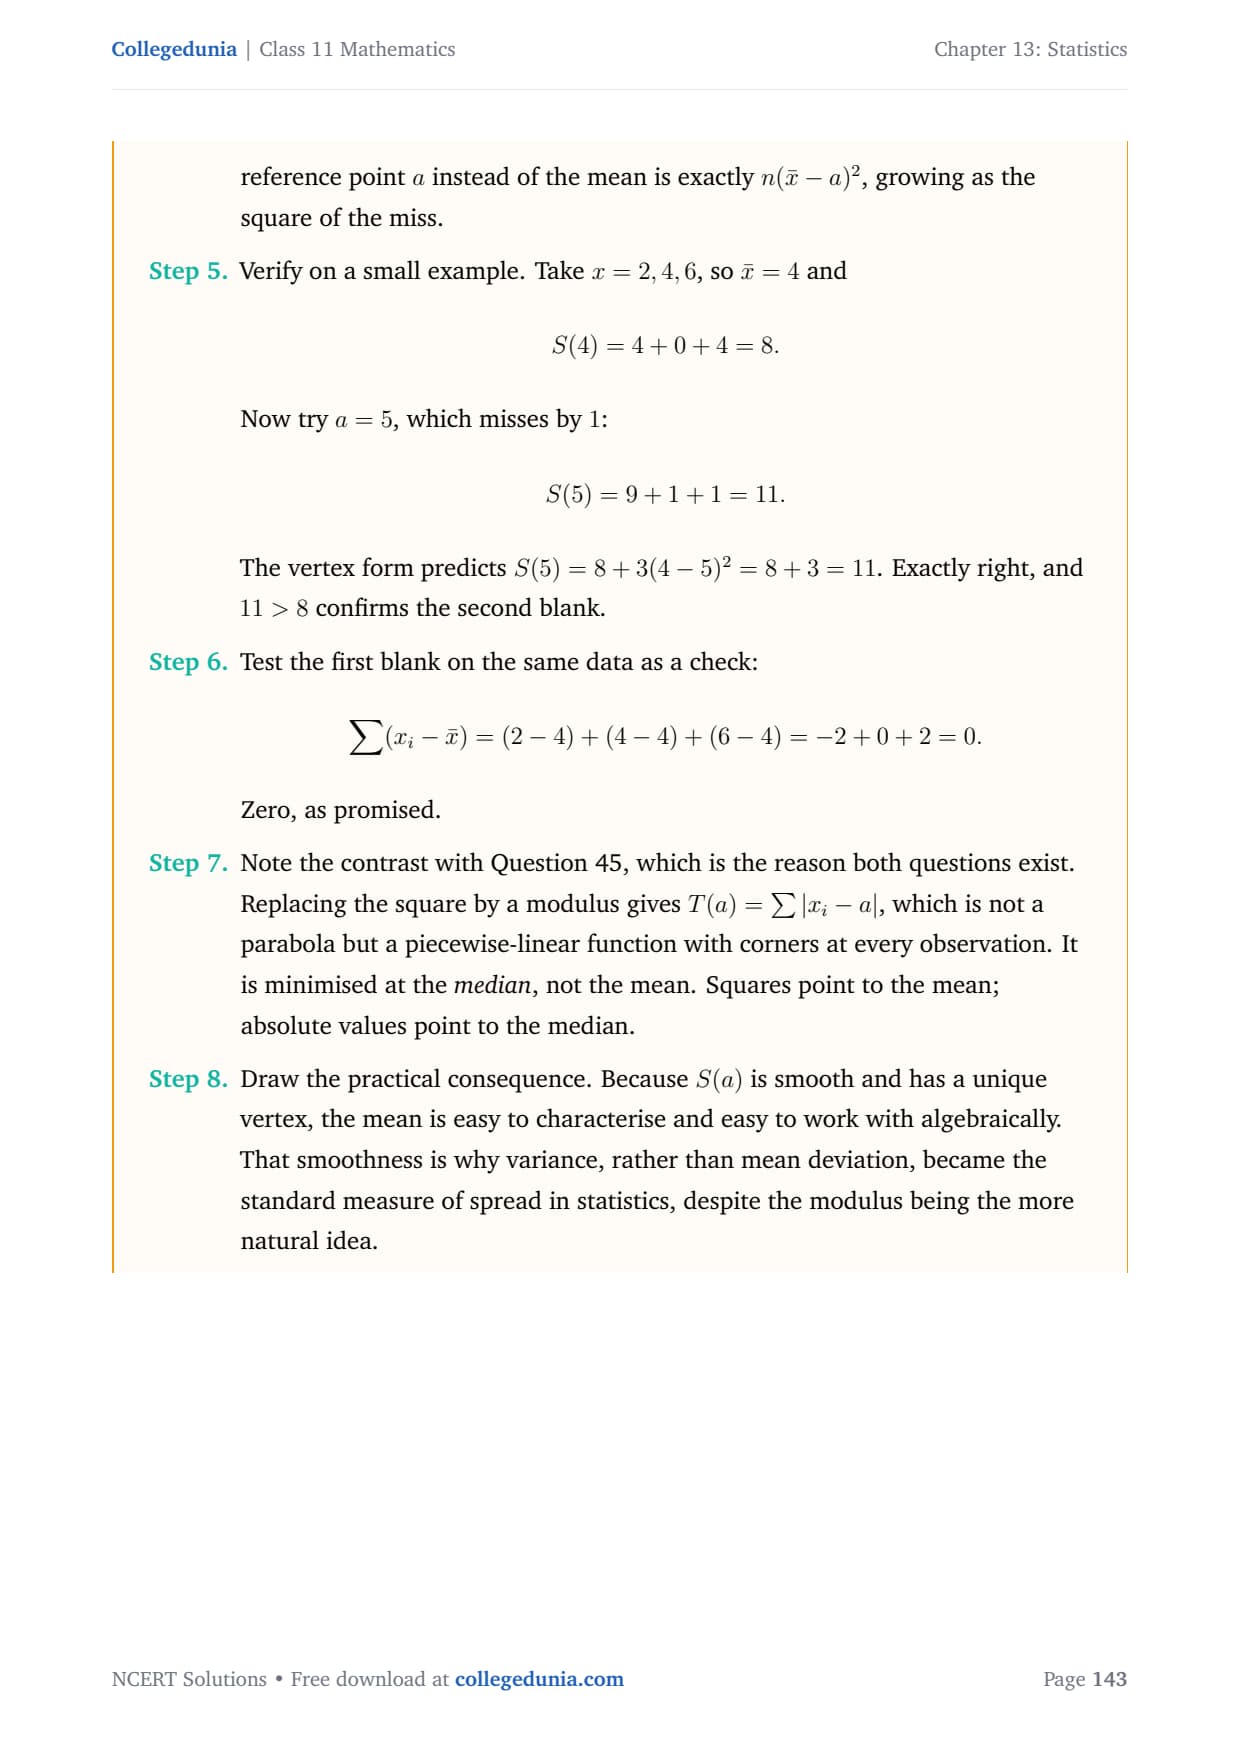
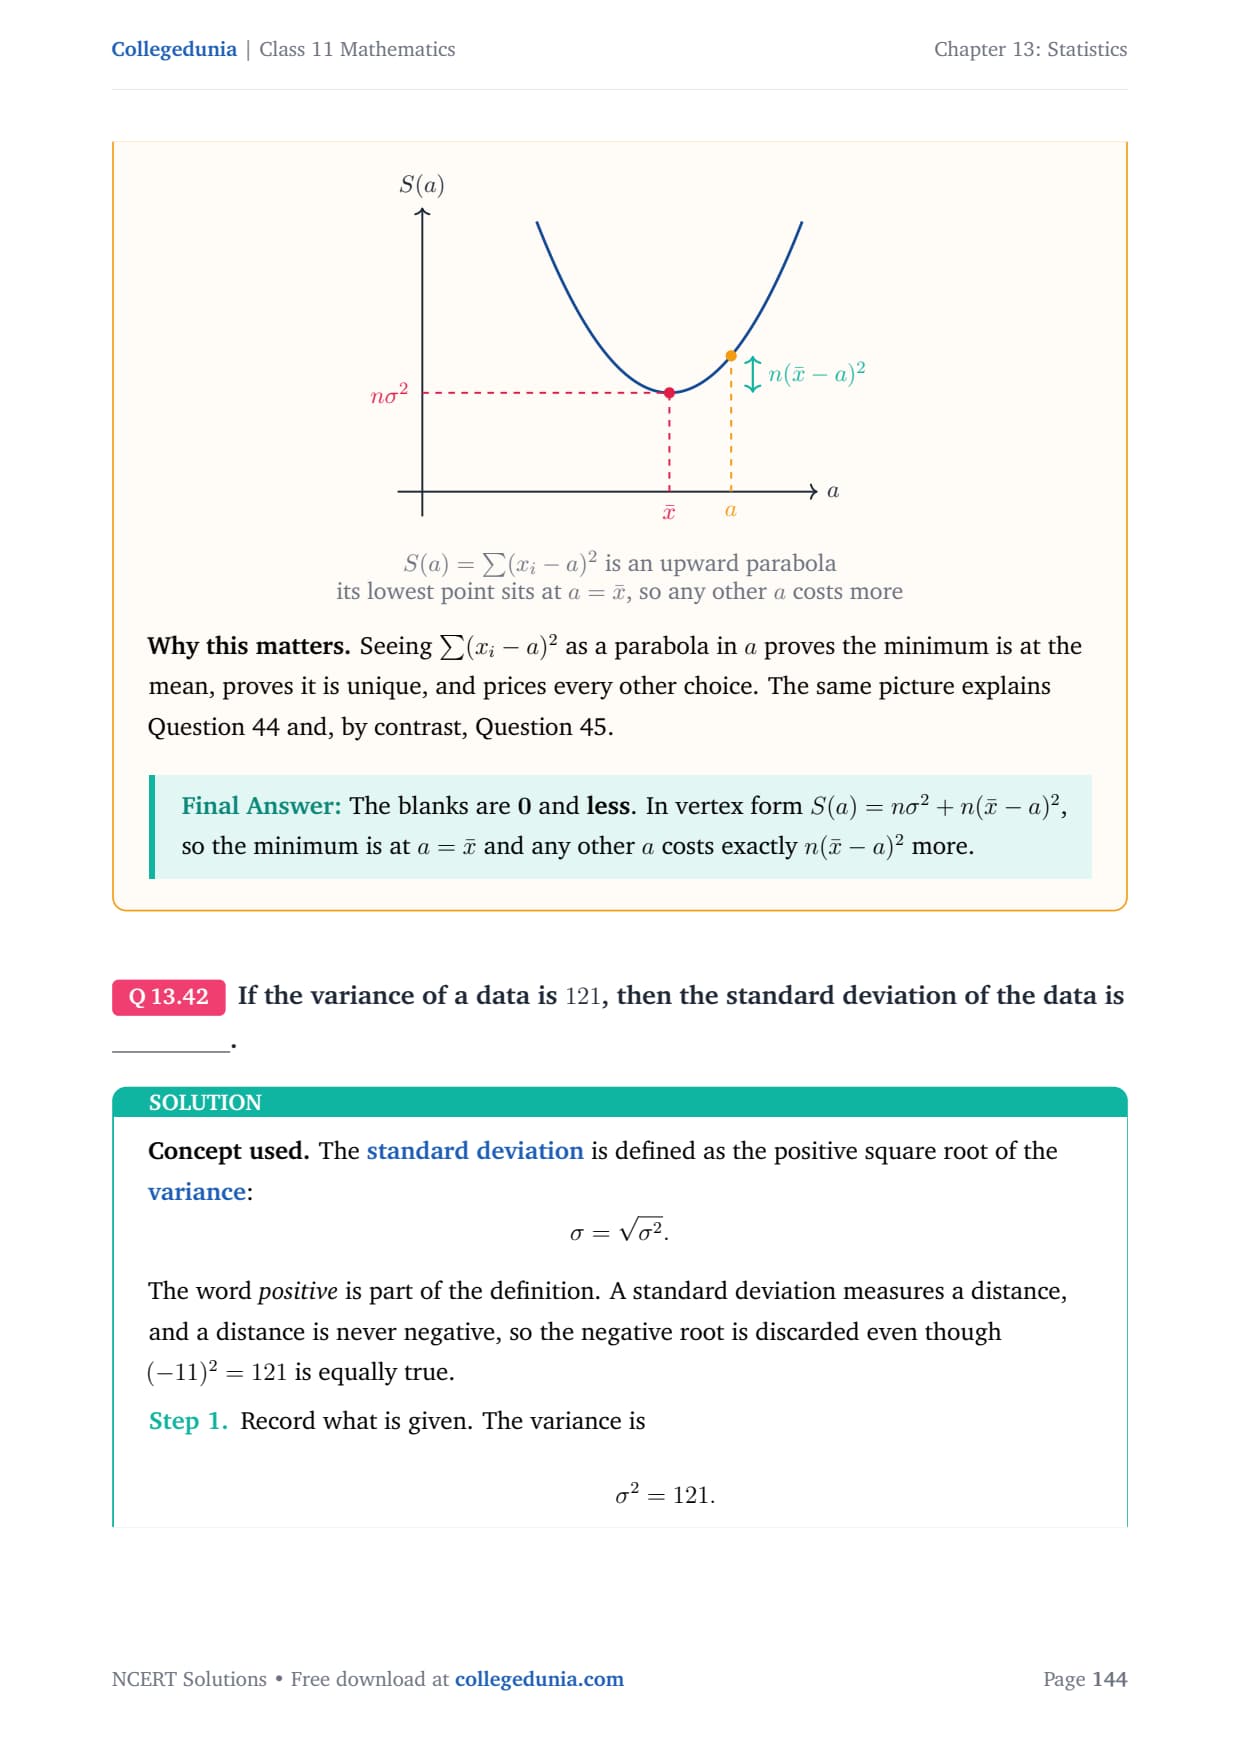
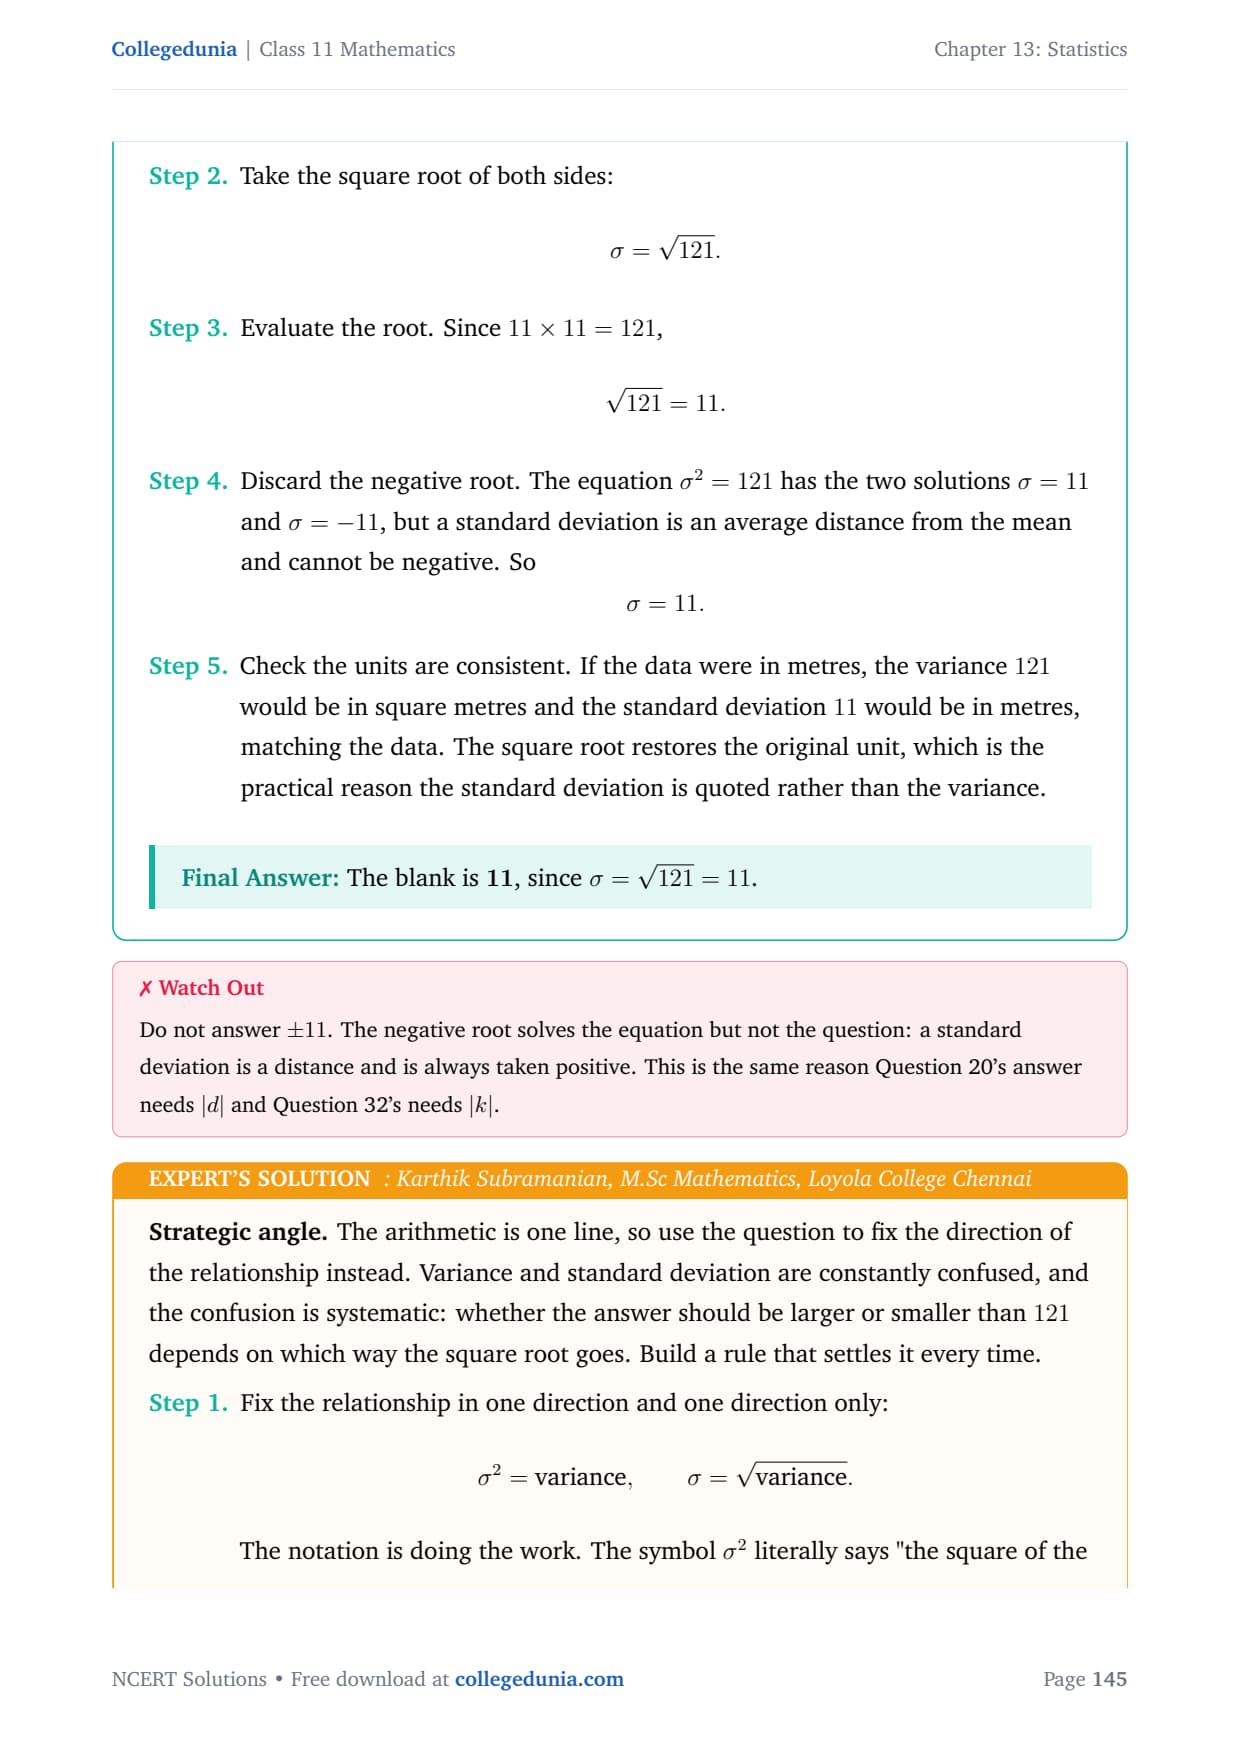
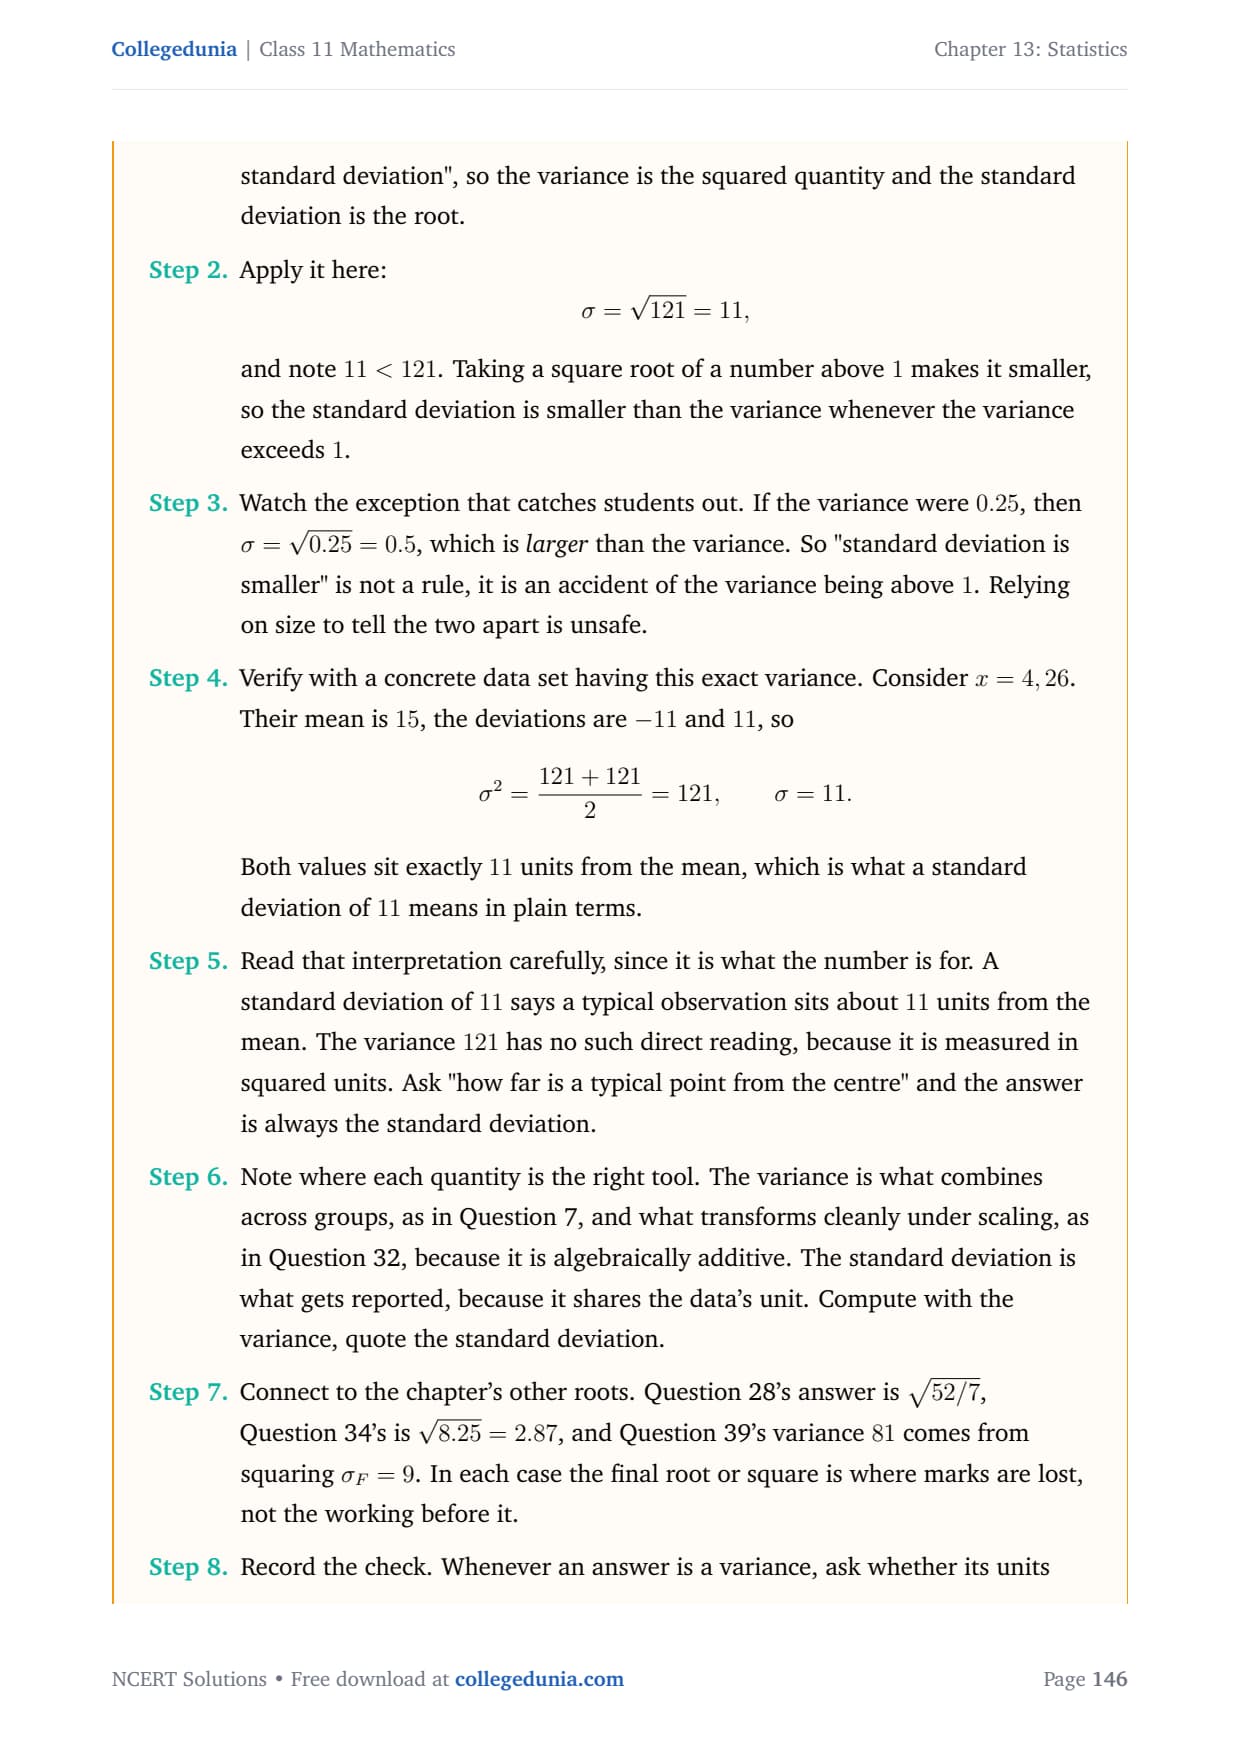
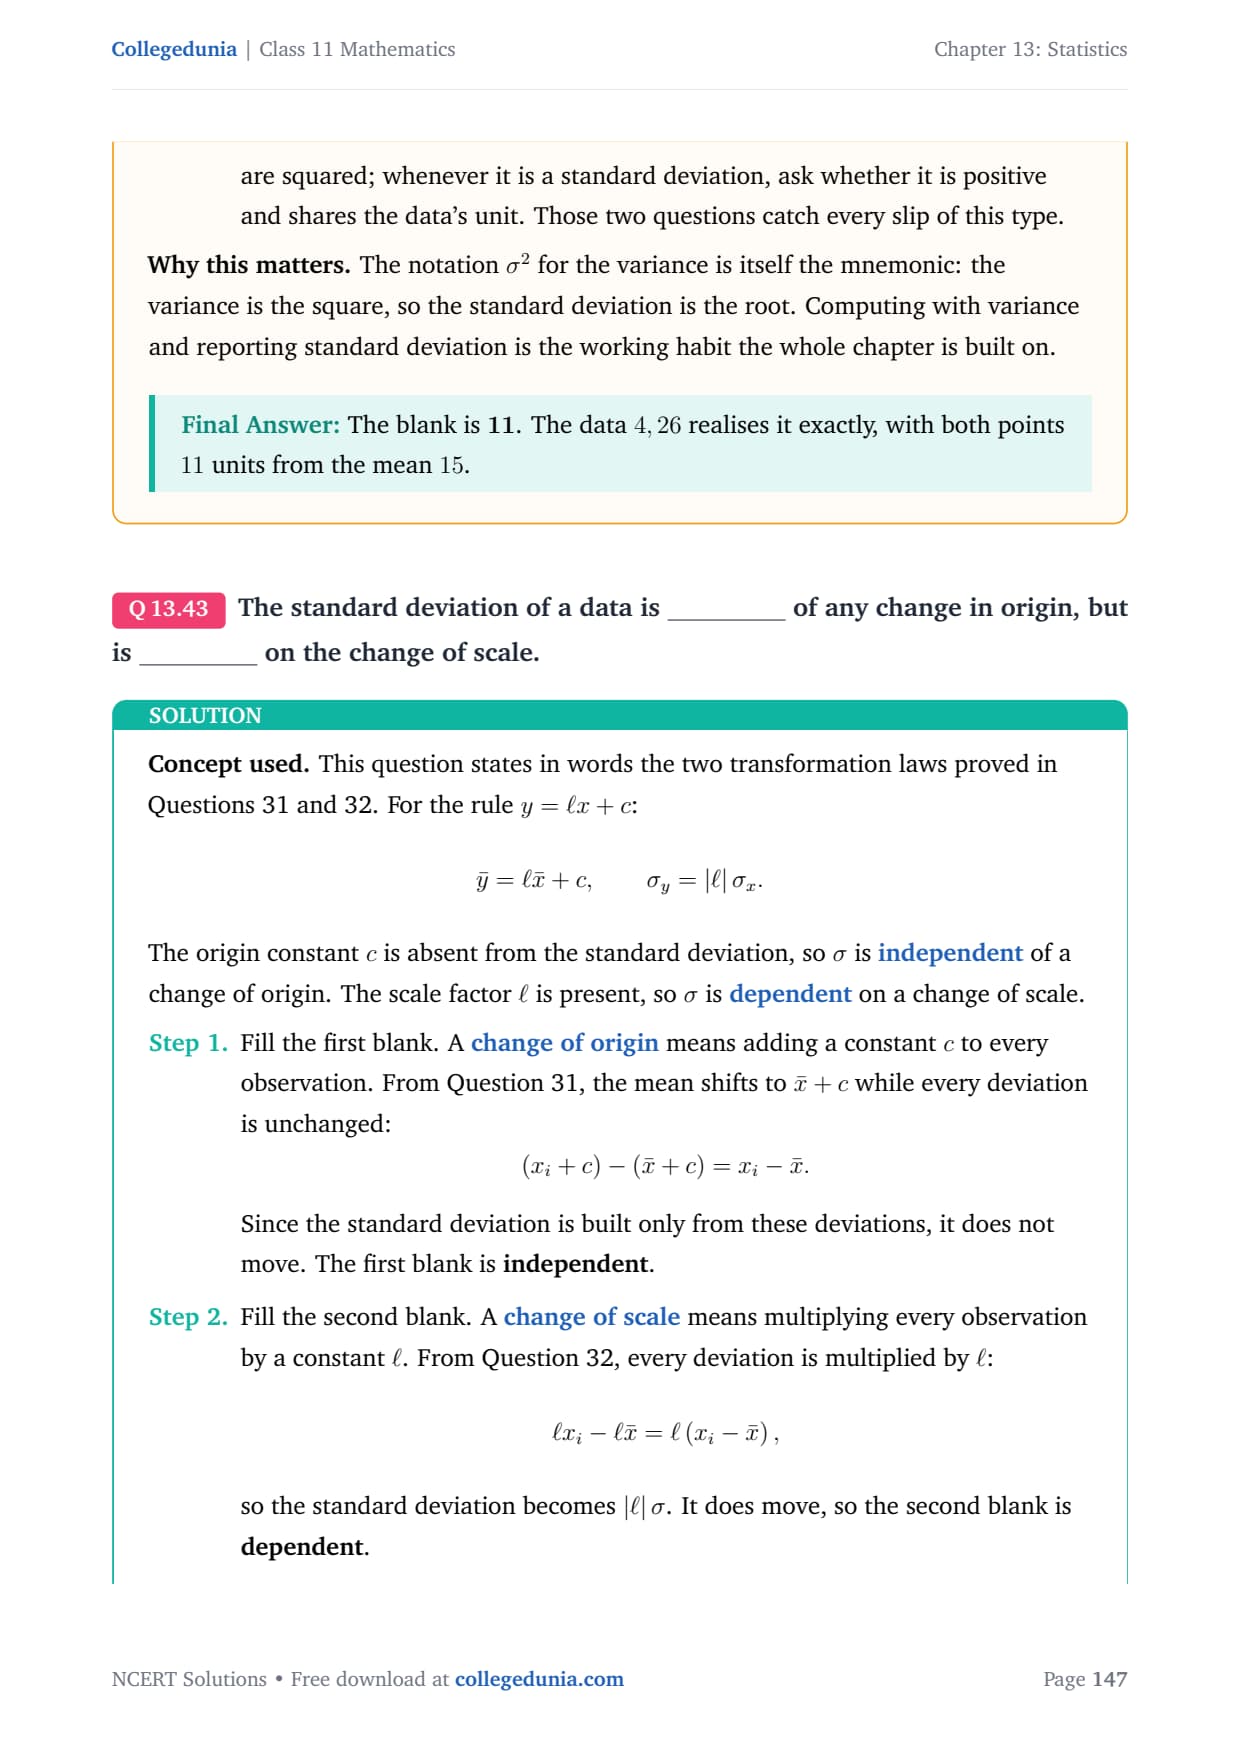
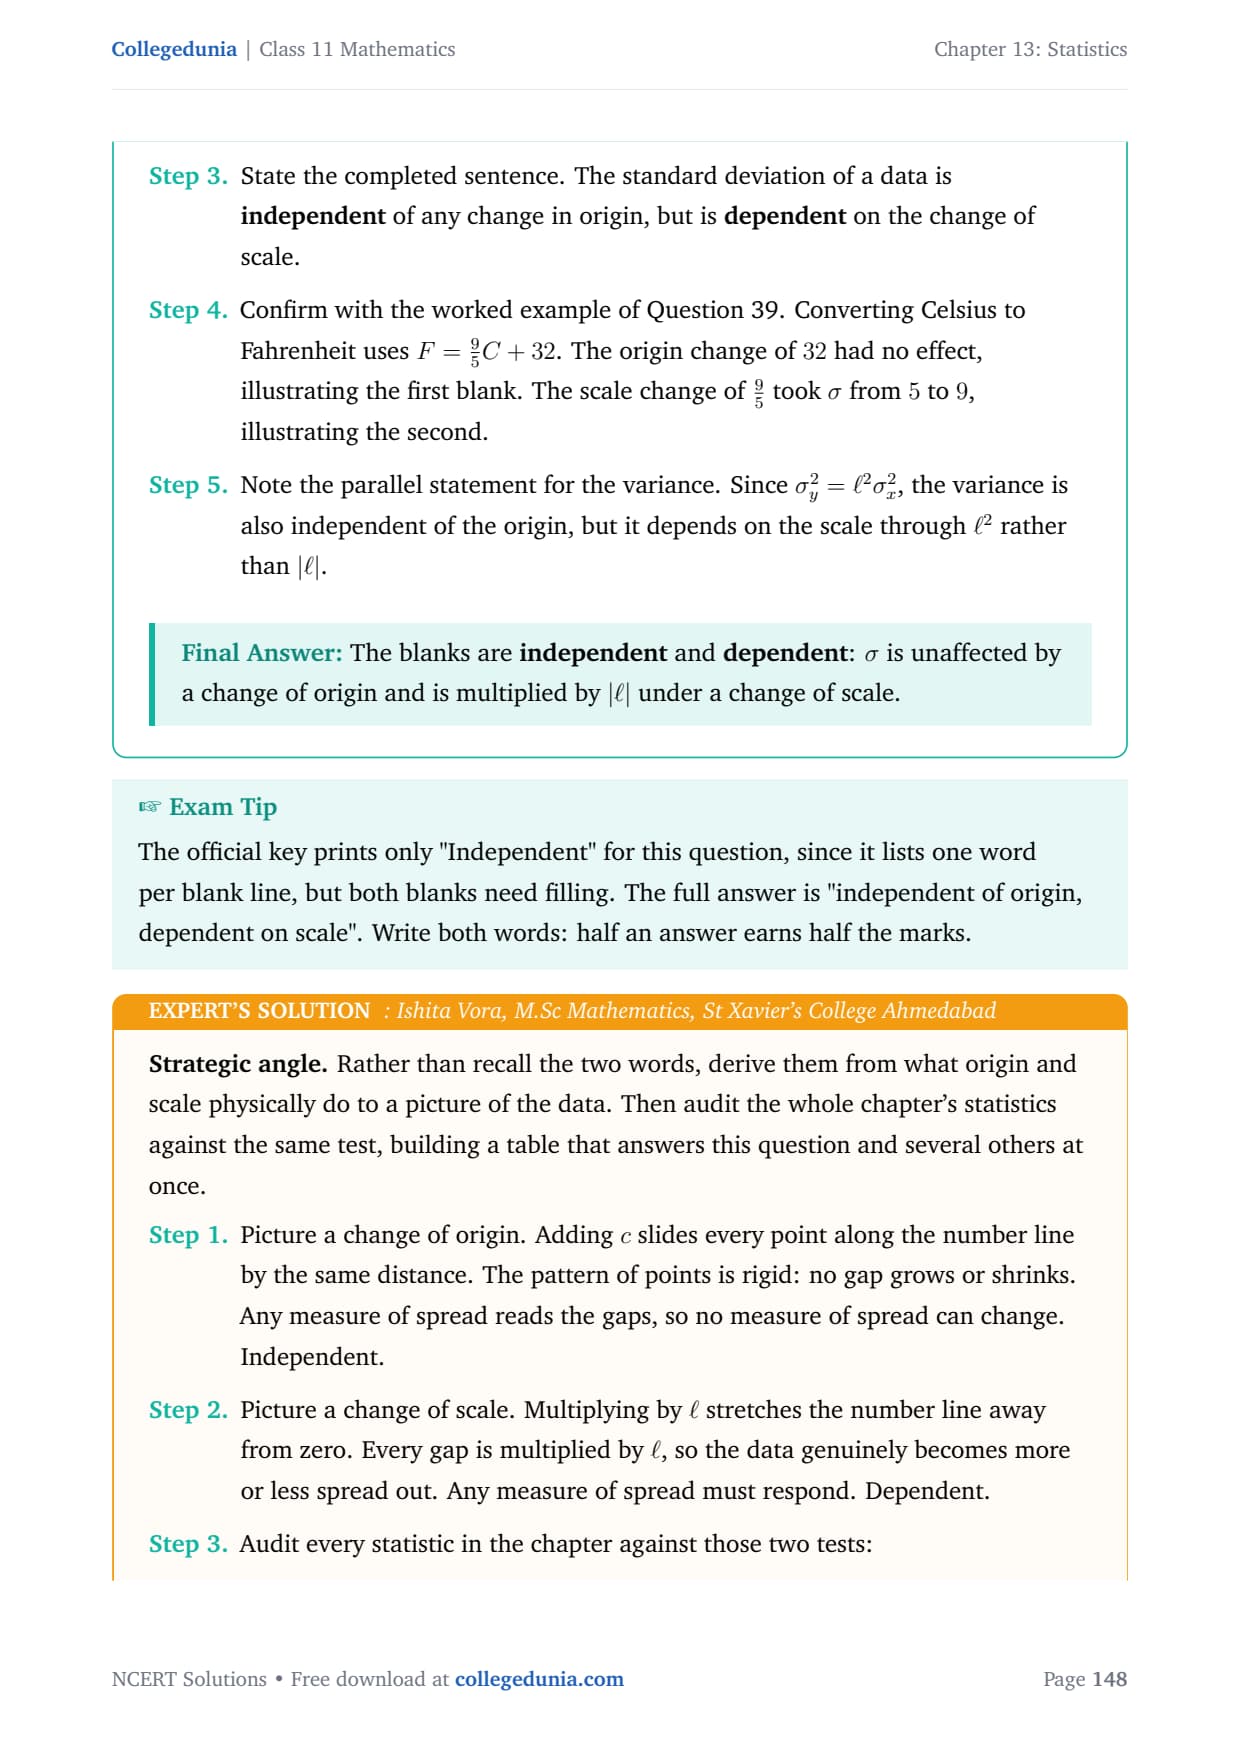
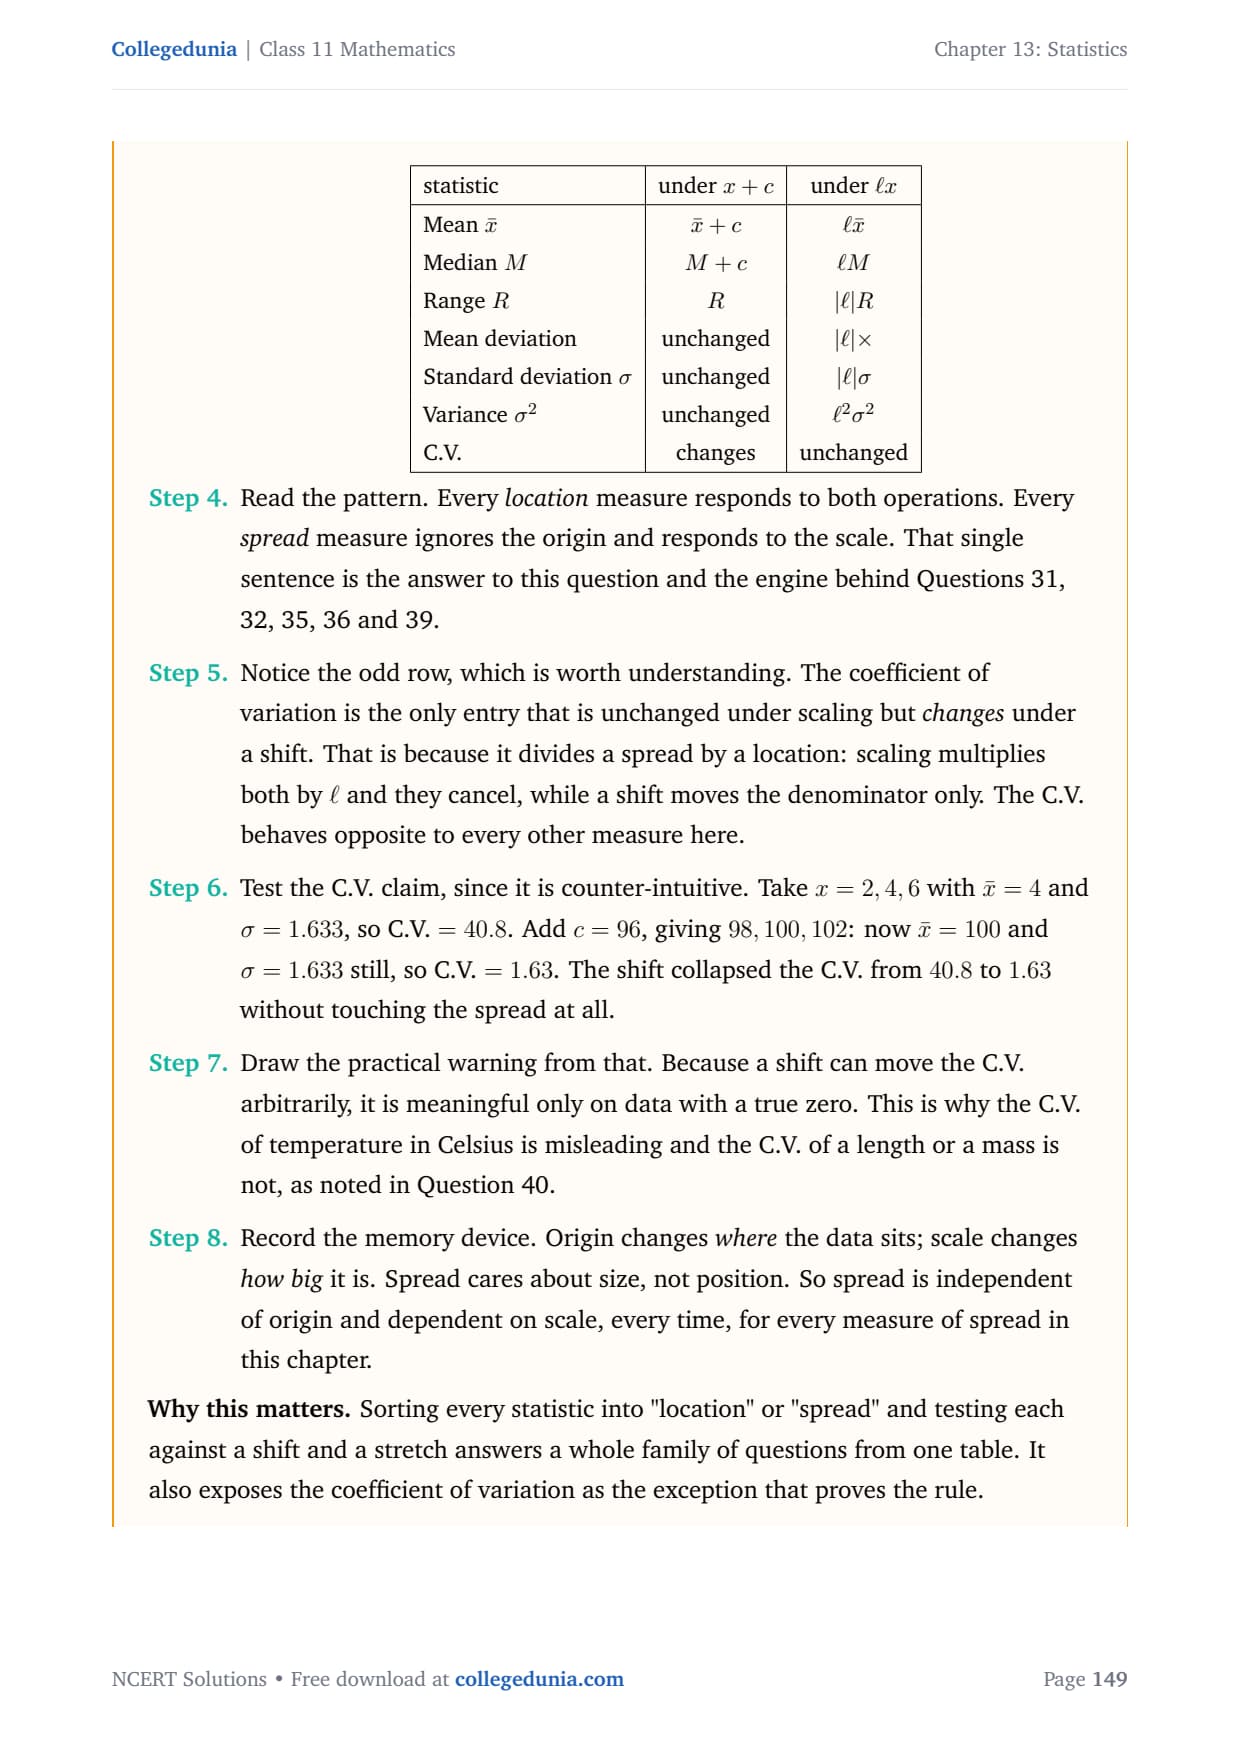
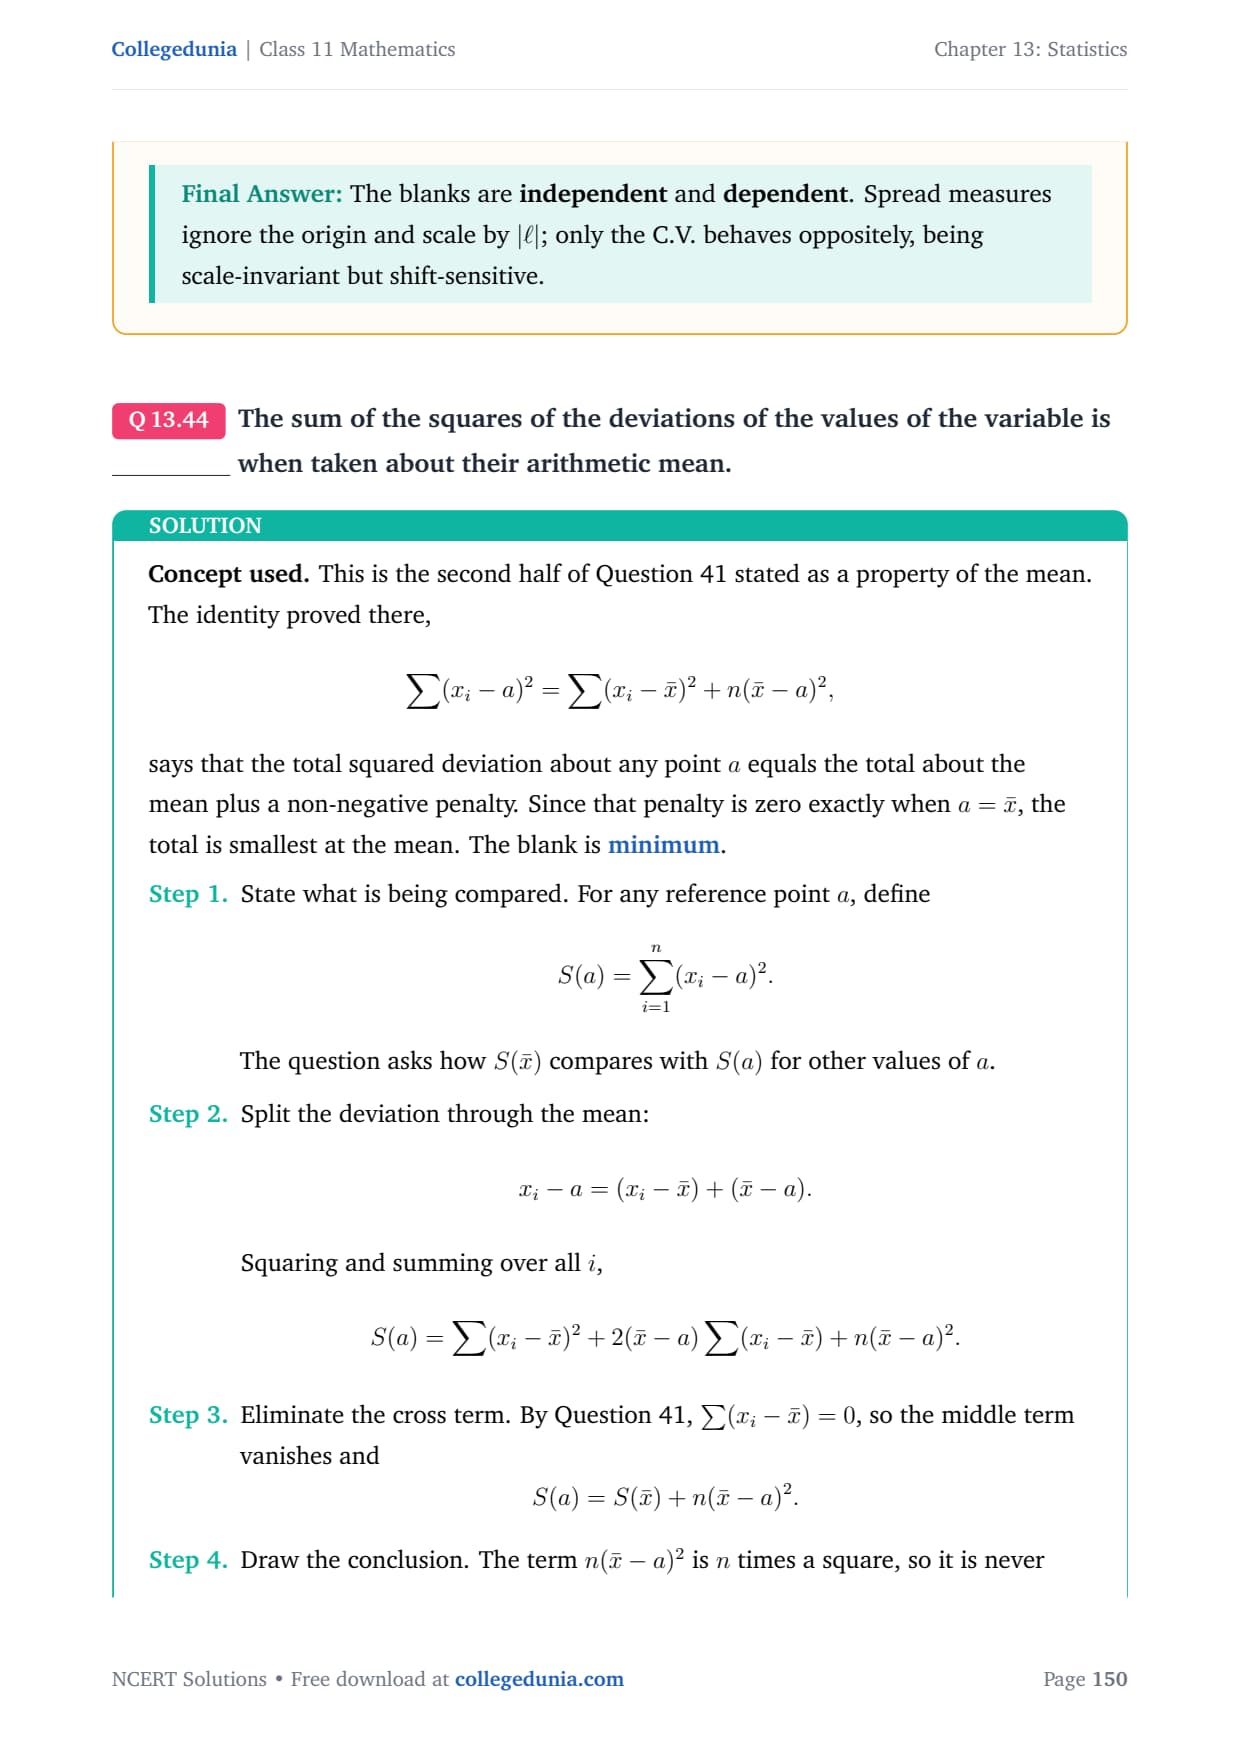
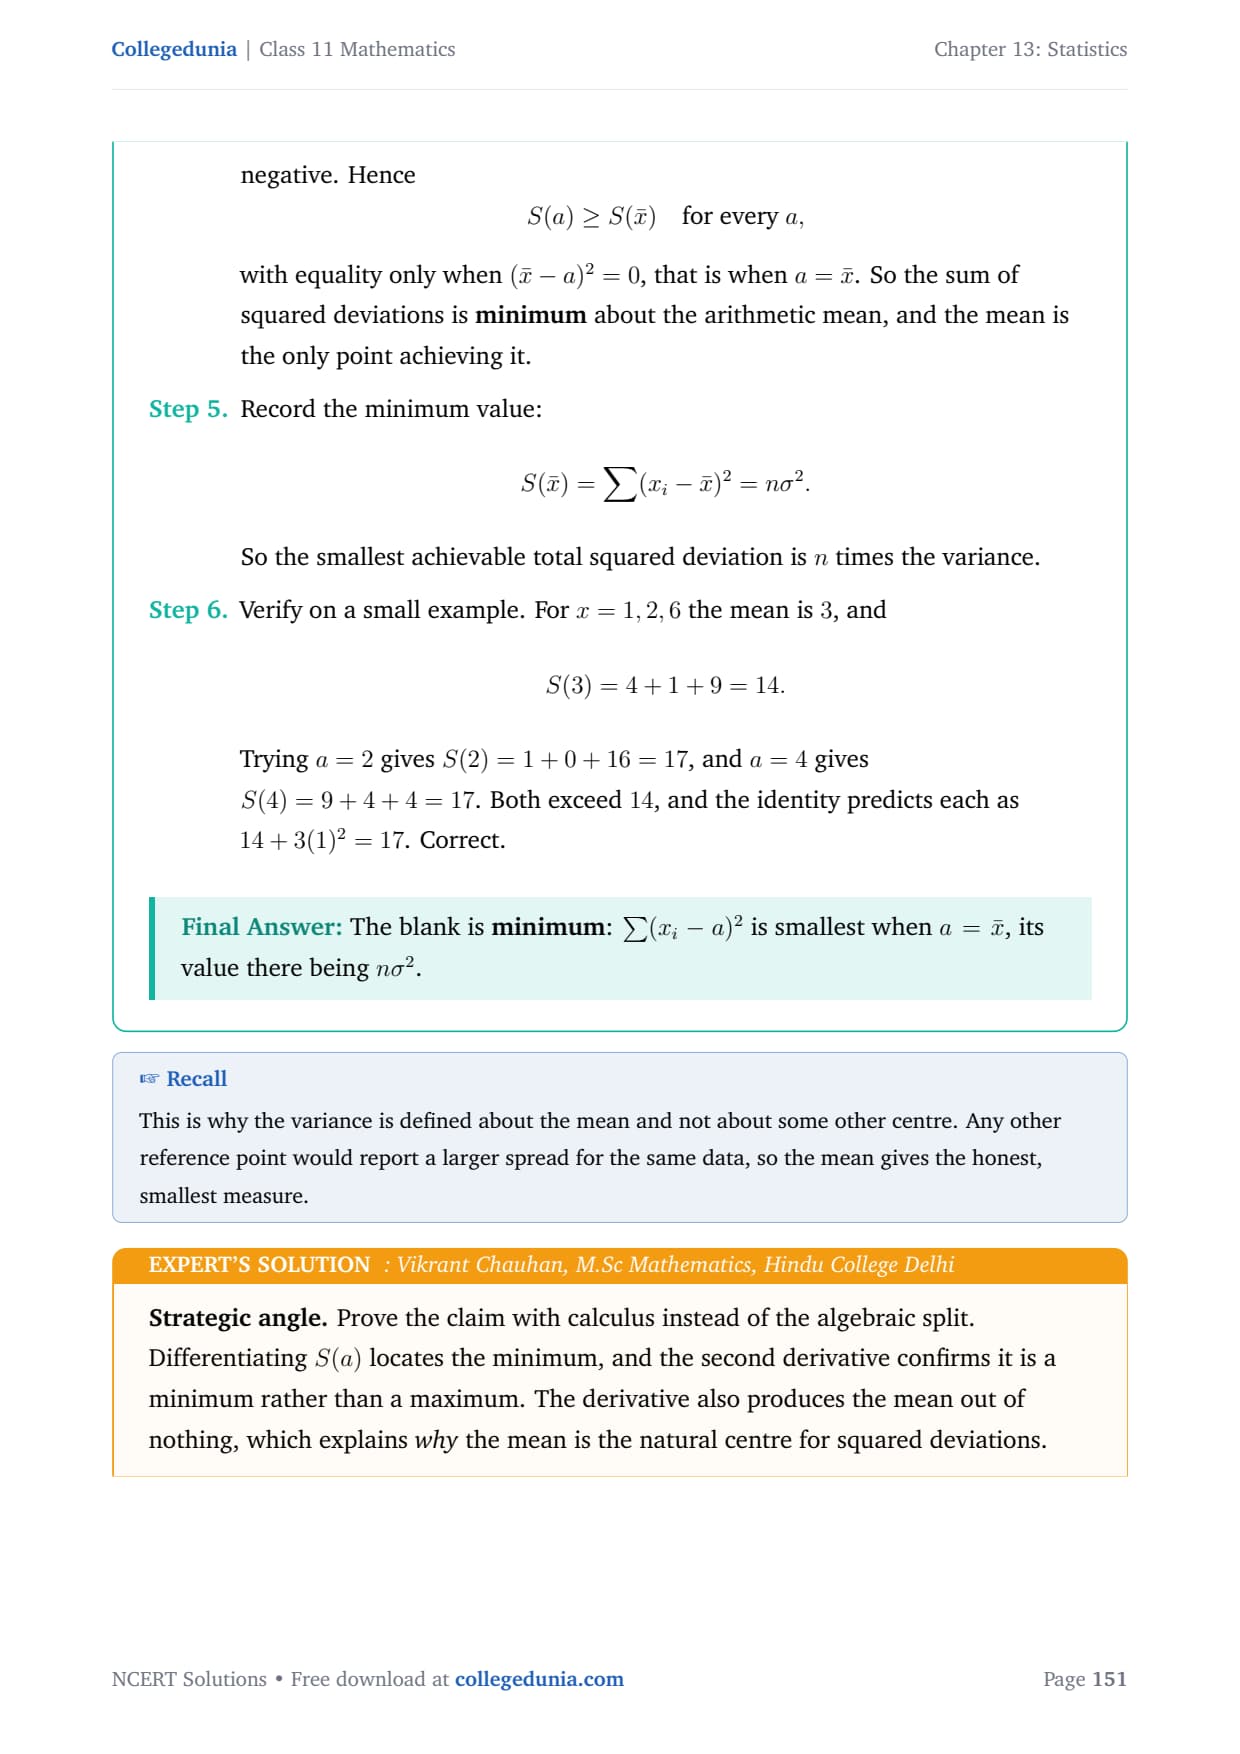
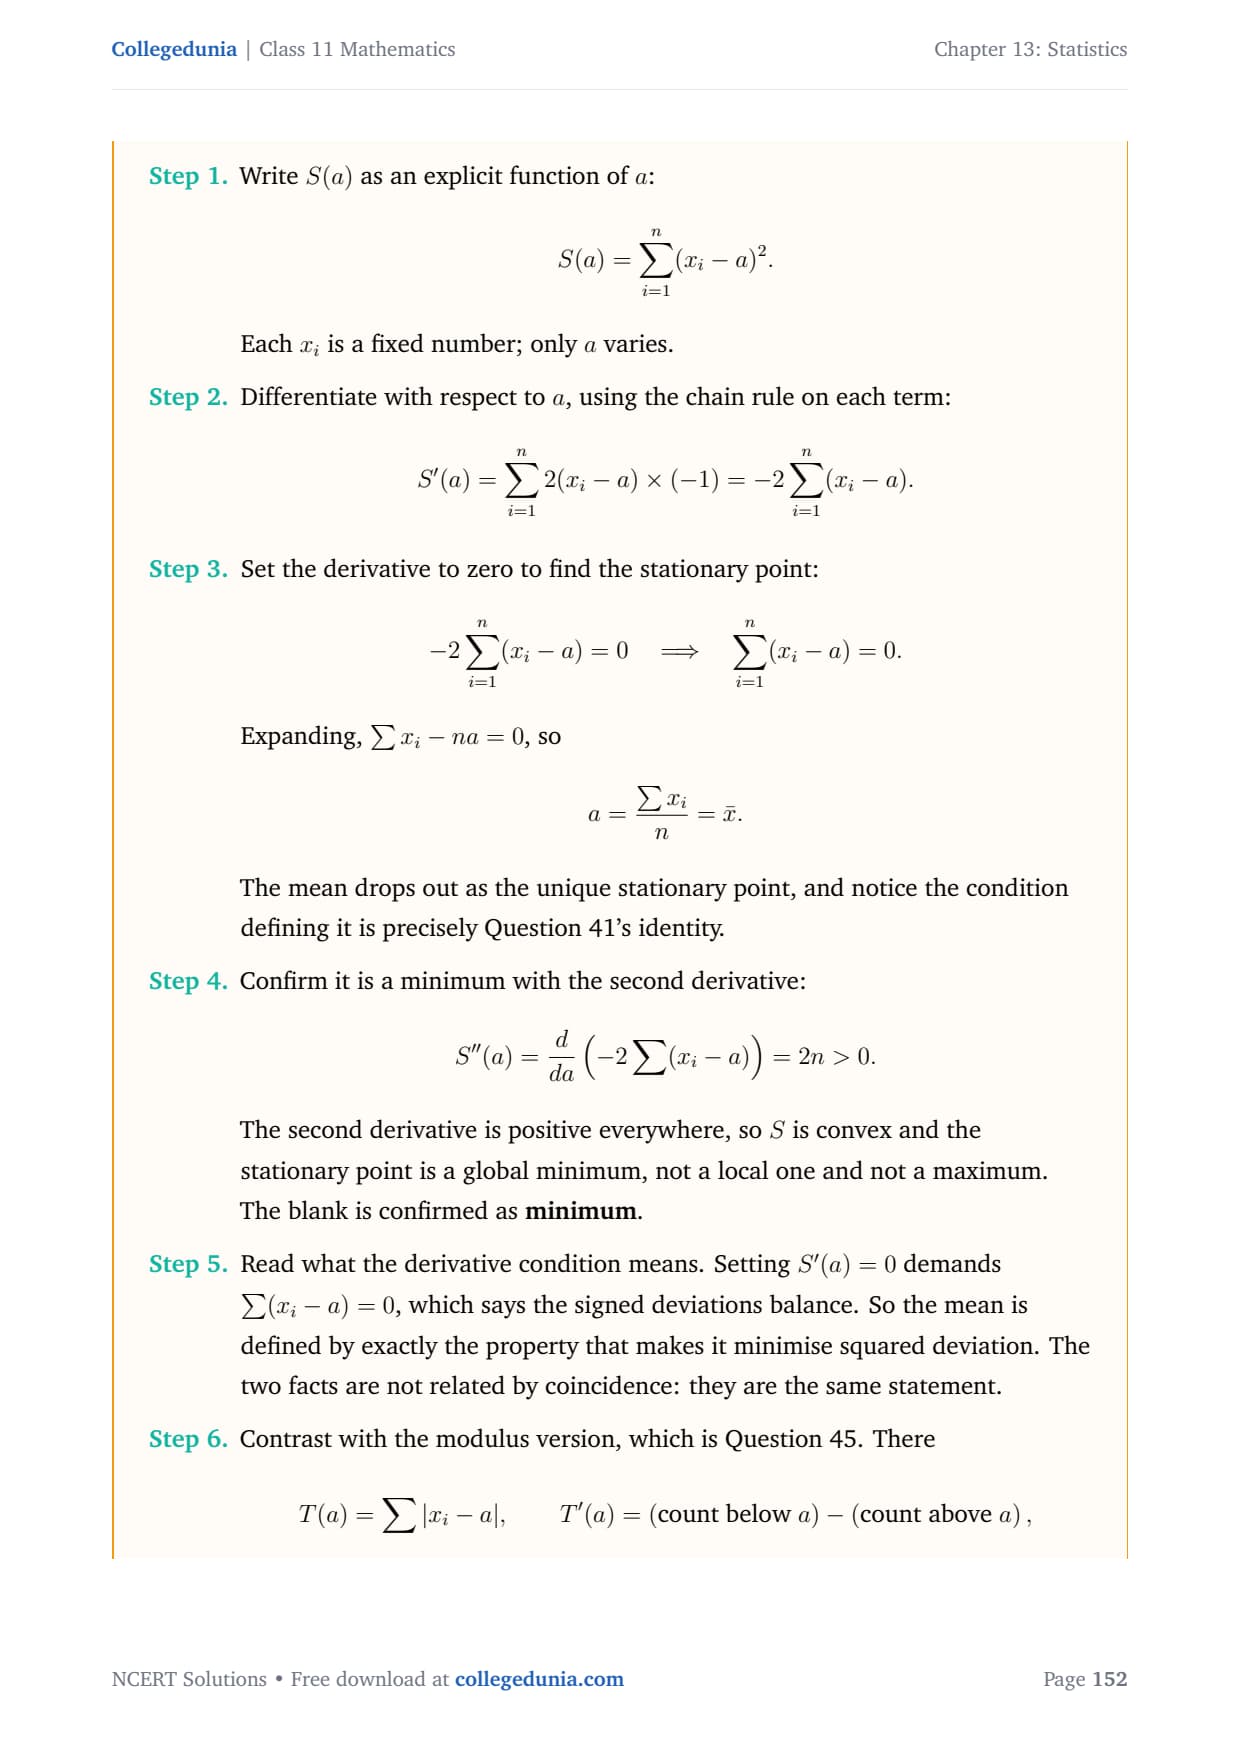
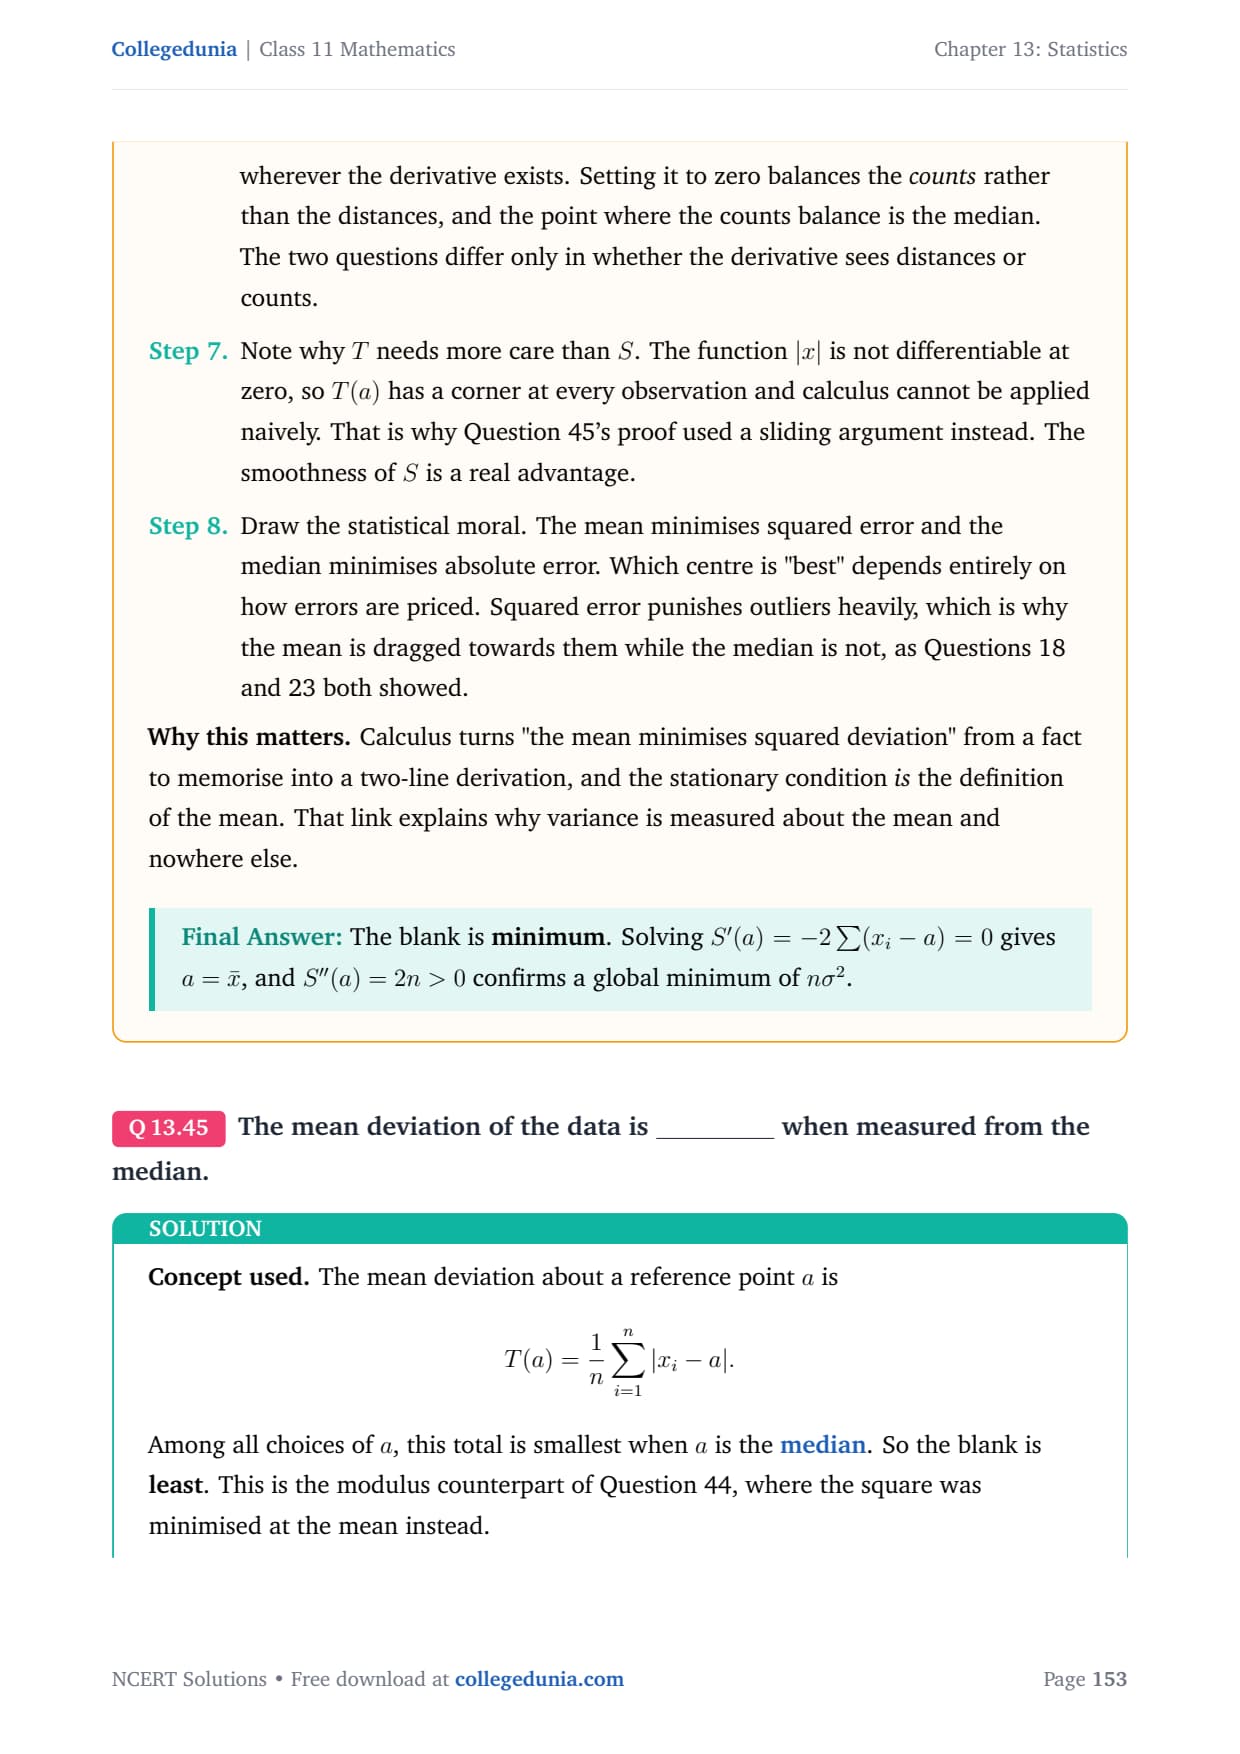
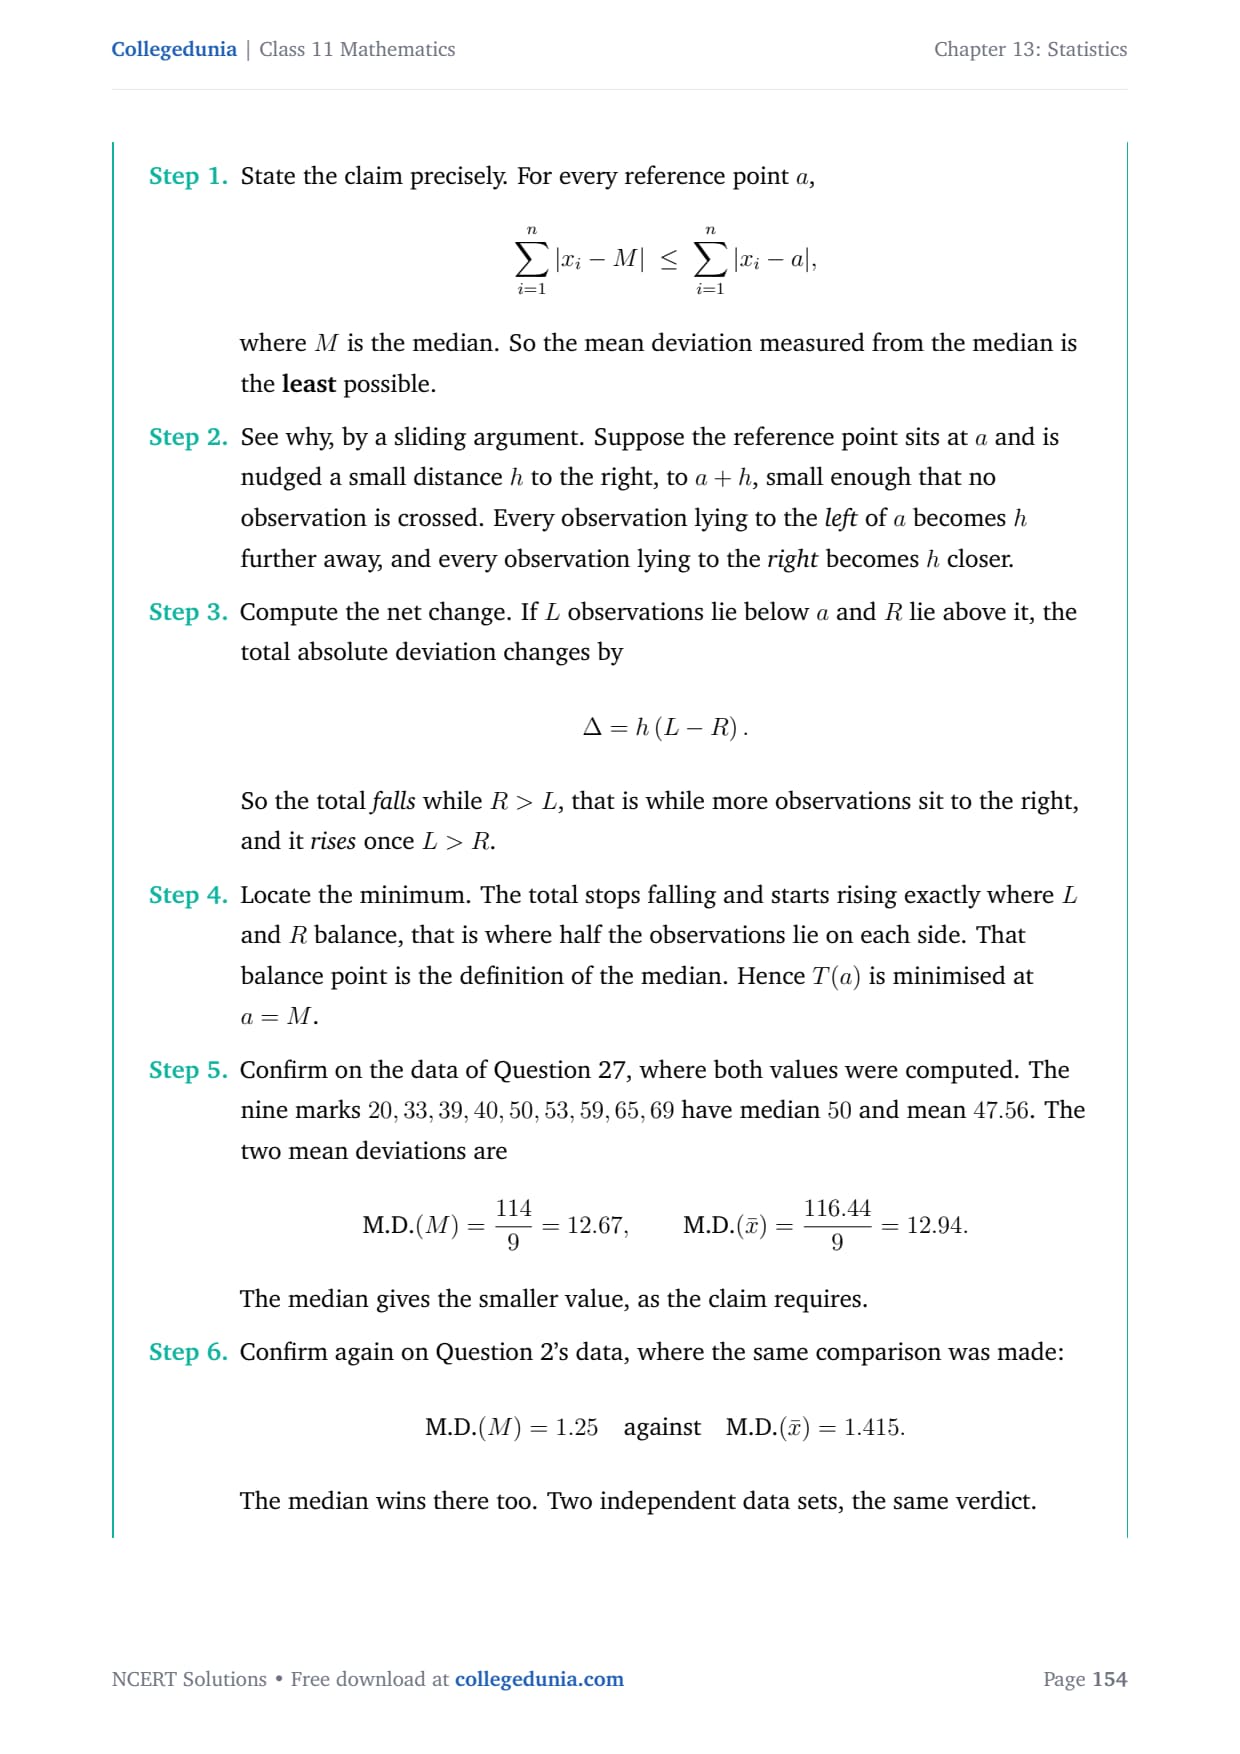
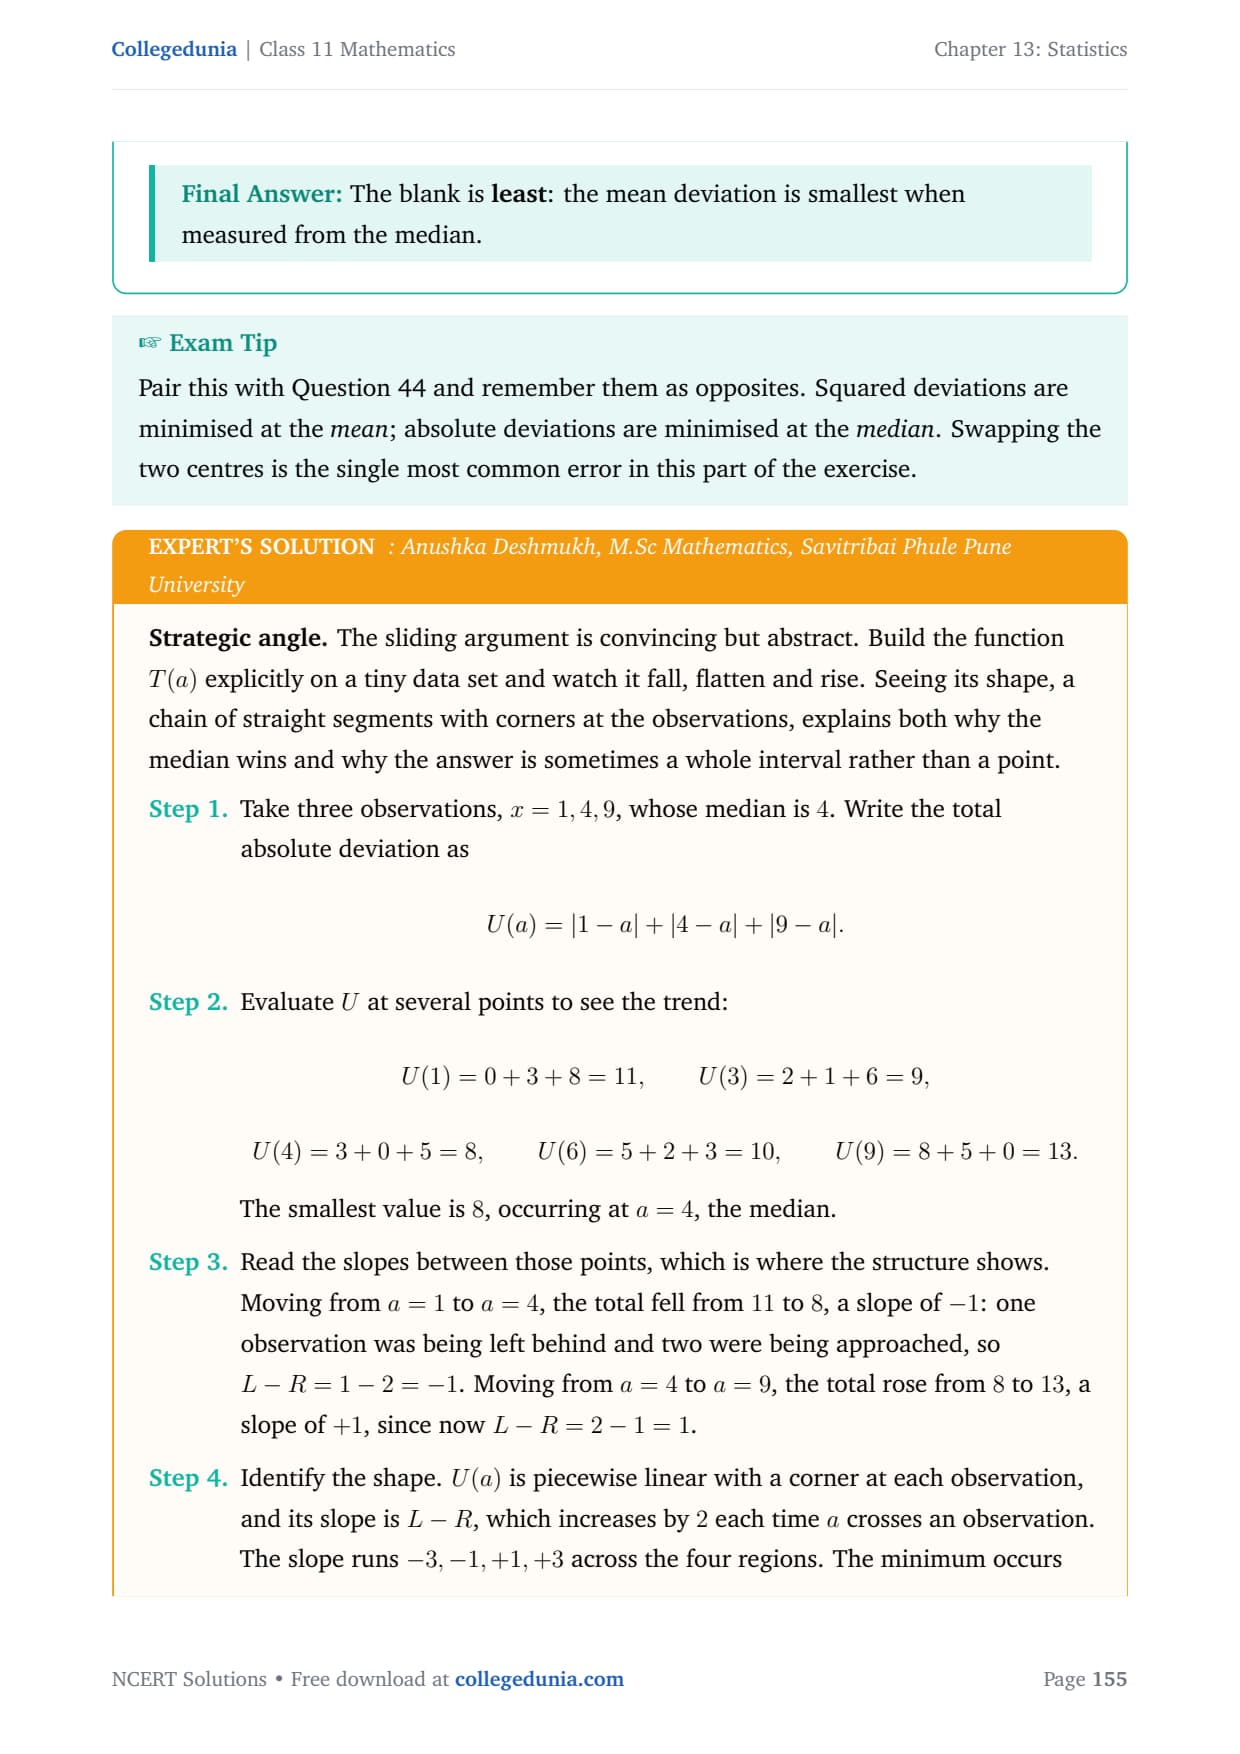
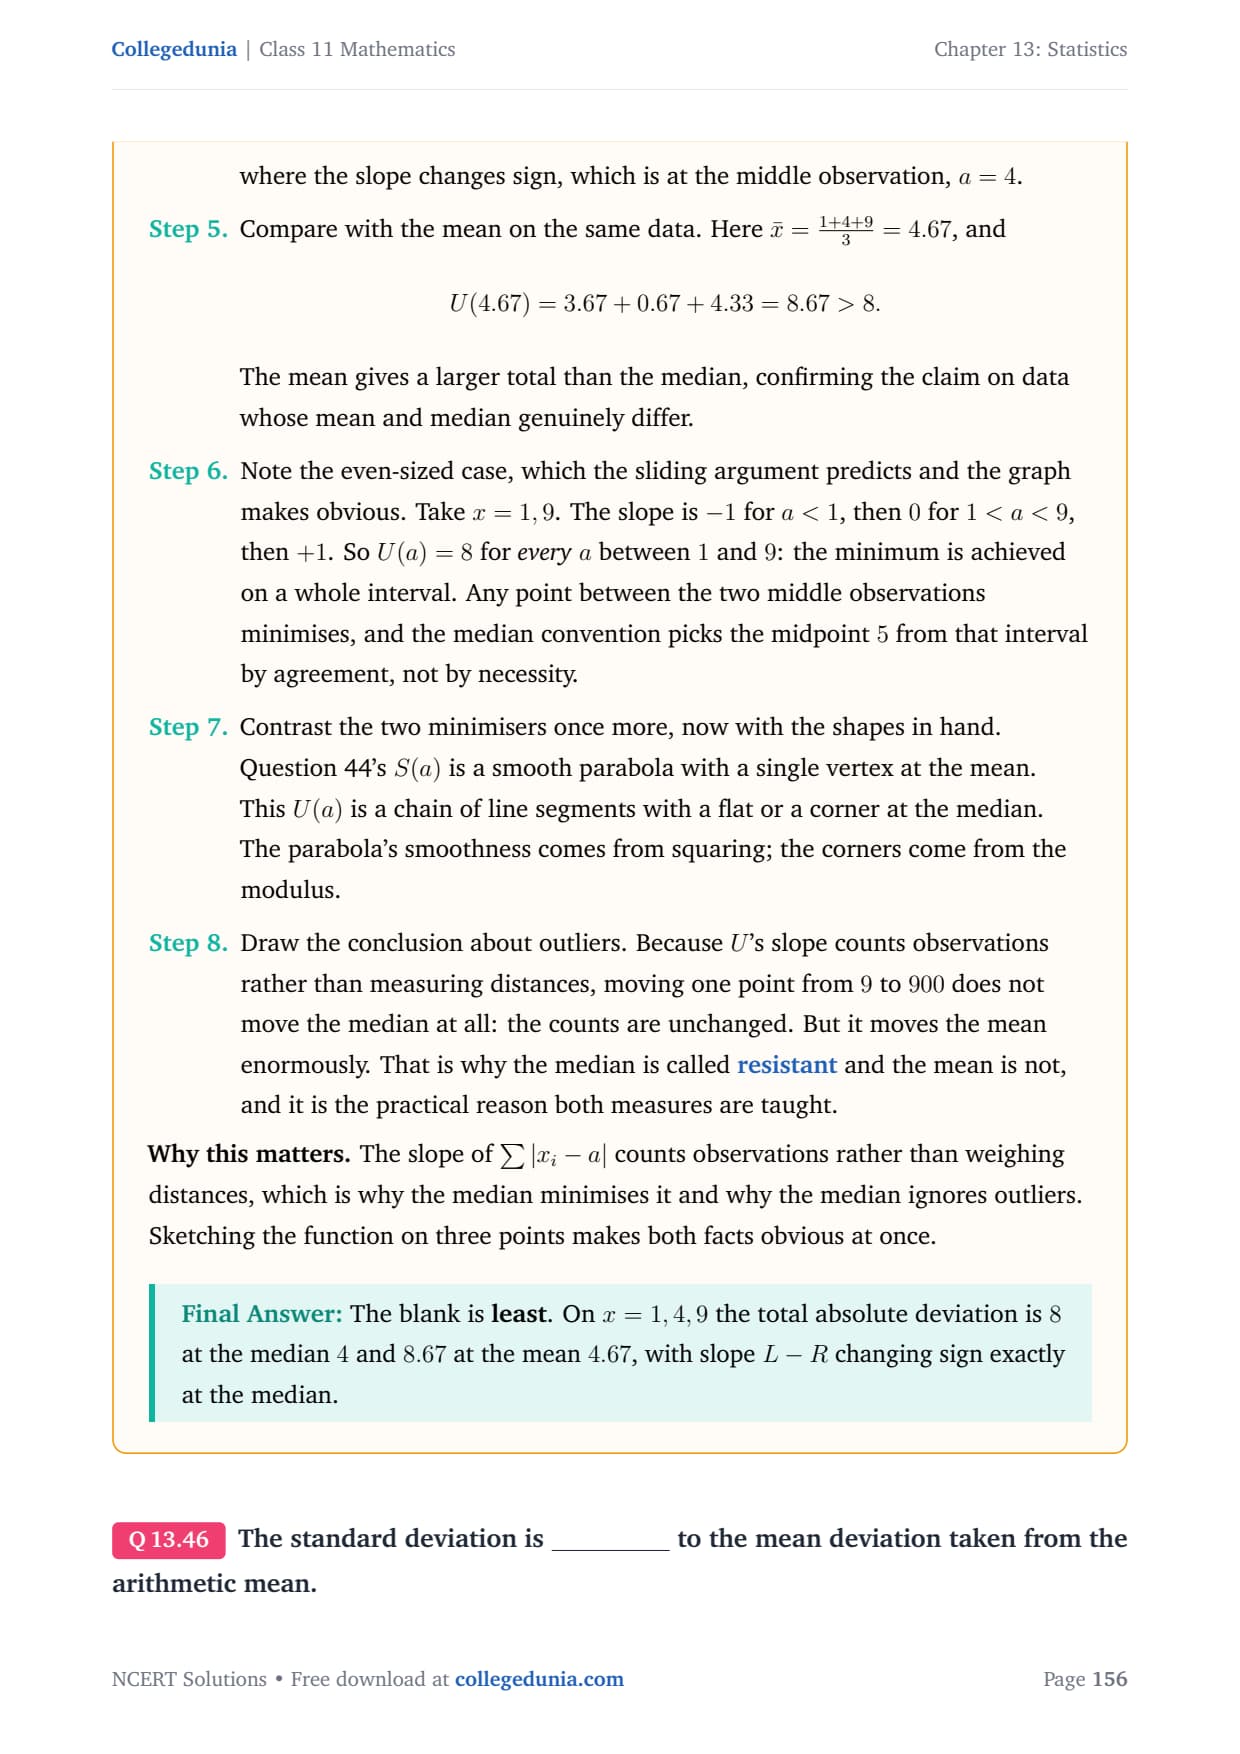
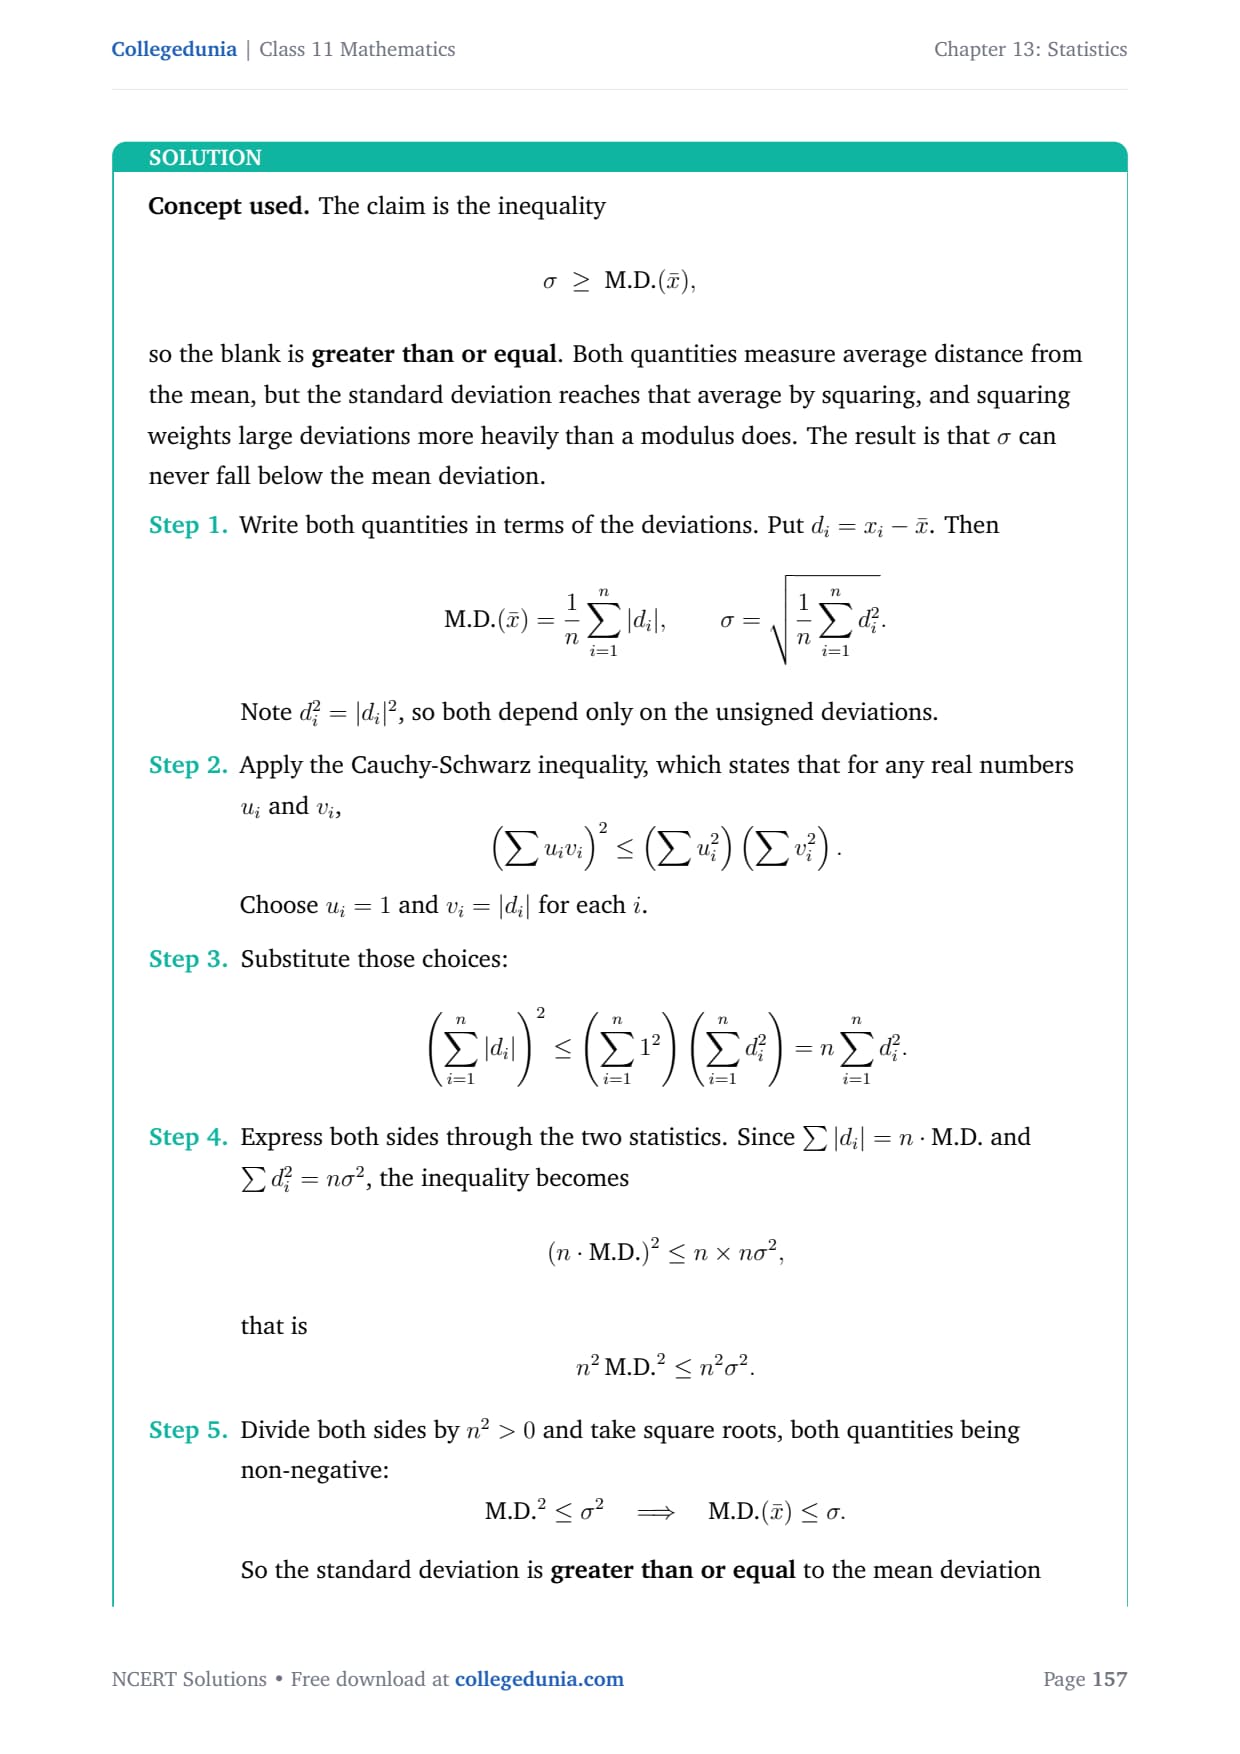
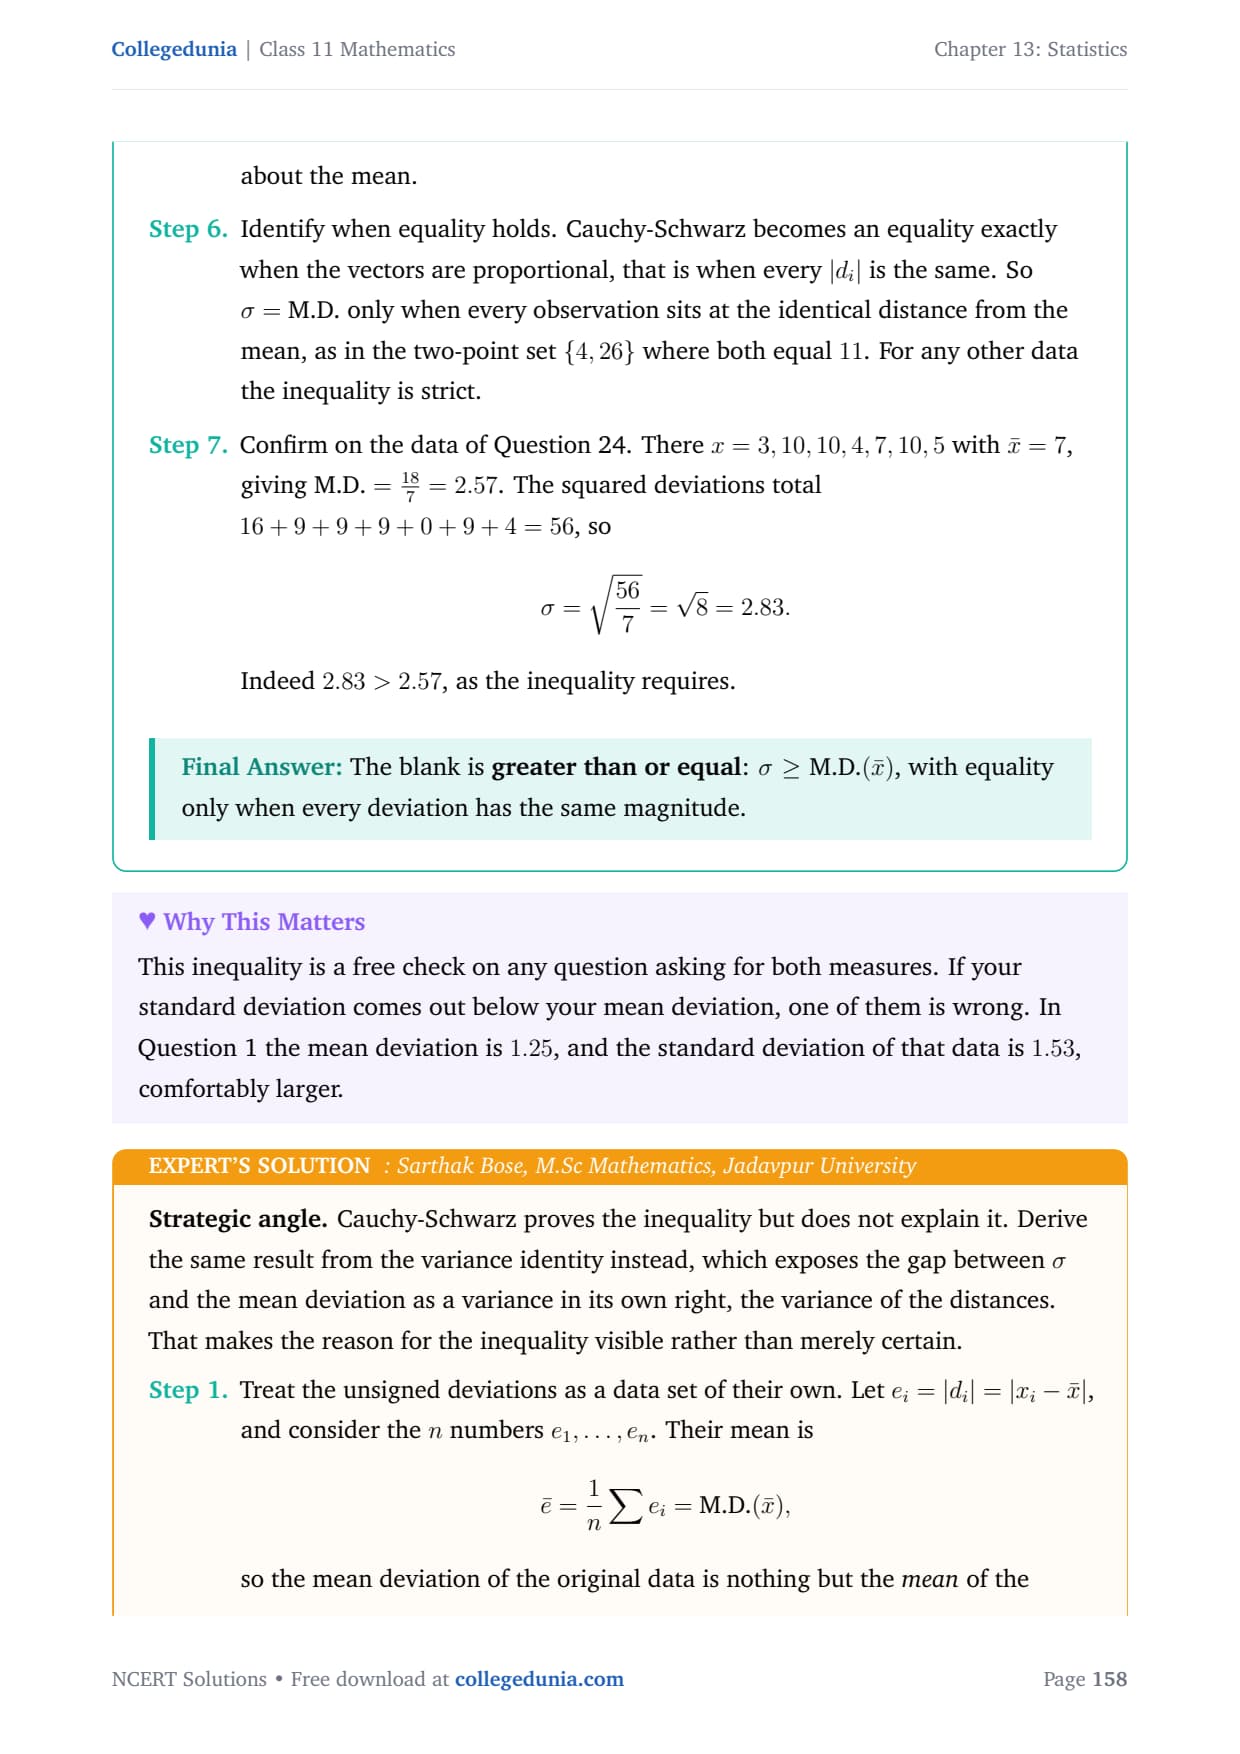
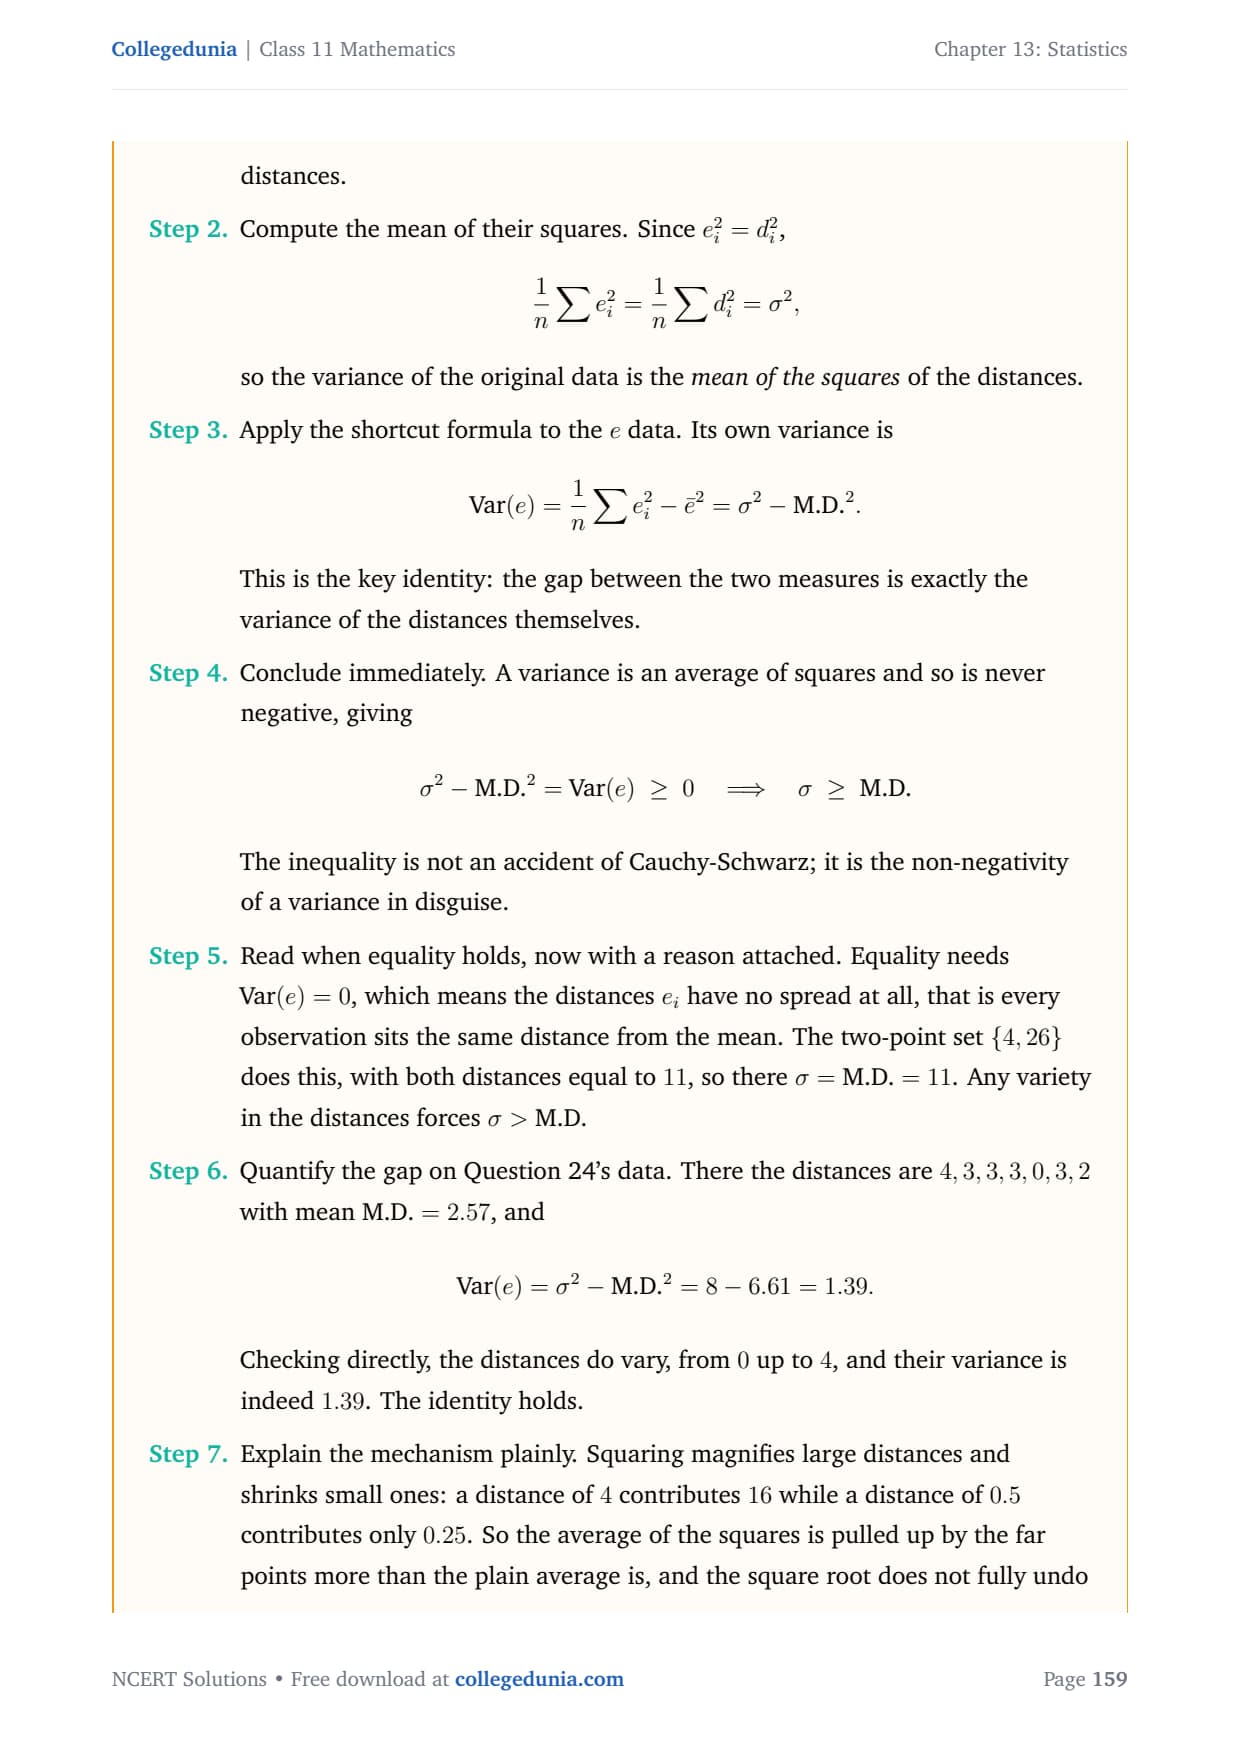
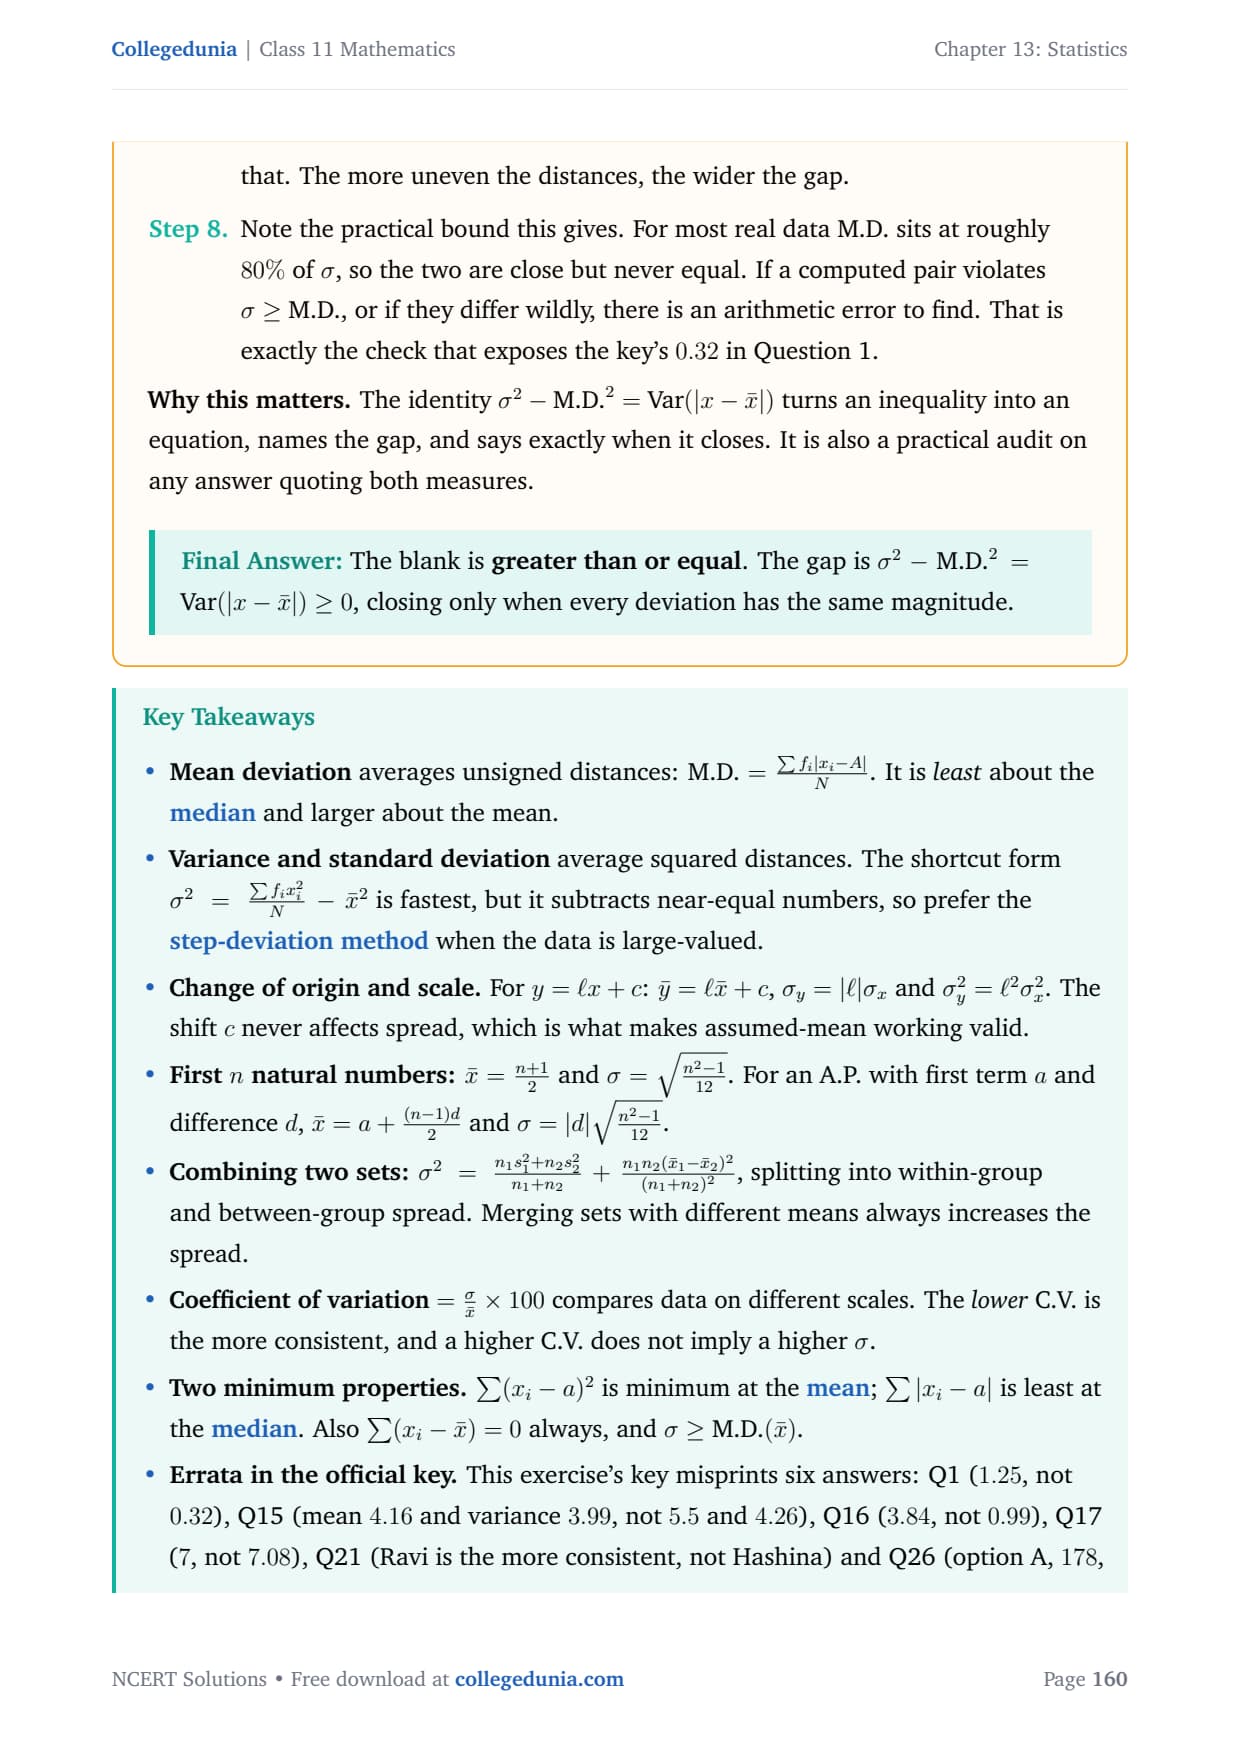
Every solution in this Collegedunia set is prepared by subject experts, based on the 2026-27 NCERT Exemplar, and checked line by line against the official answer key.
One numbering note before students start. The NCERT Exemplar book prints Statistics as its Chapter 15, and the exercise is numbered Exercise 15.3. In the current NCERT textbook order it is Chapter 13, which is the number used on this page. The questions are identical. The solutions PDF runs to 161 pages.
- 46 questions solved: Short Answer, Long Answer, Objective and Fill in the Blanks.
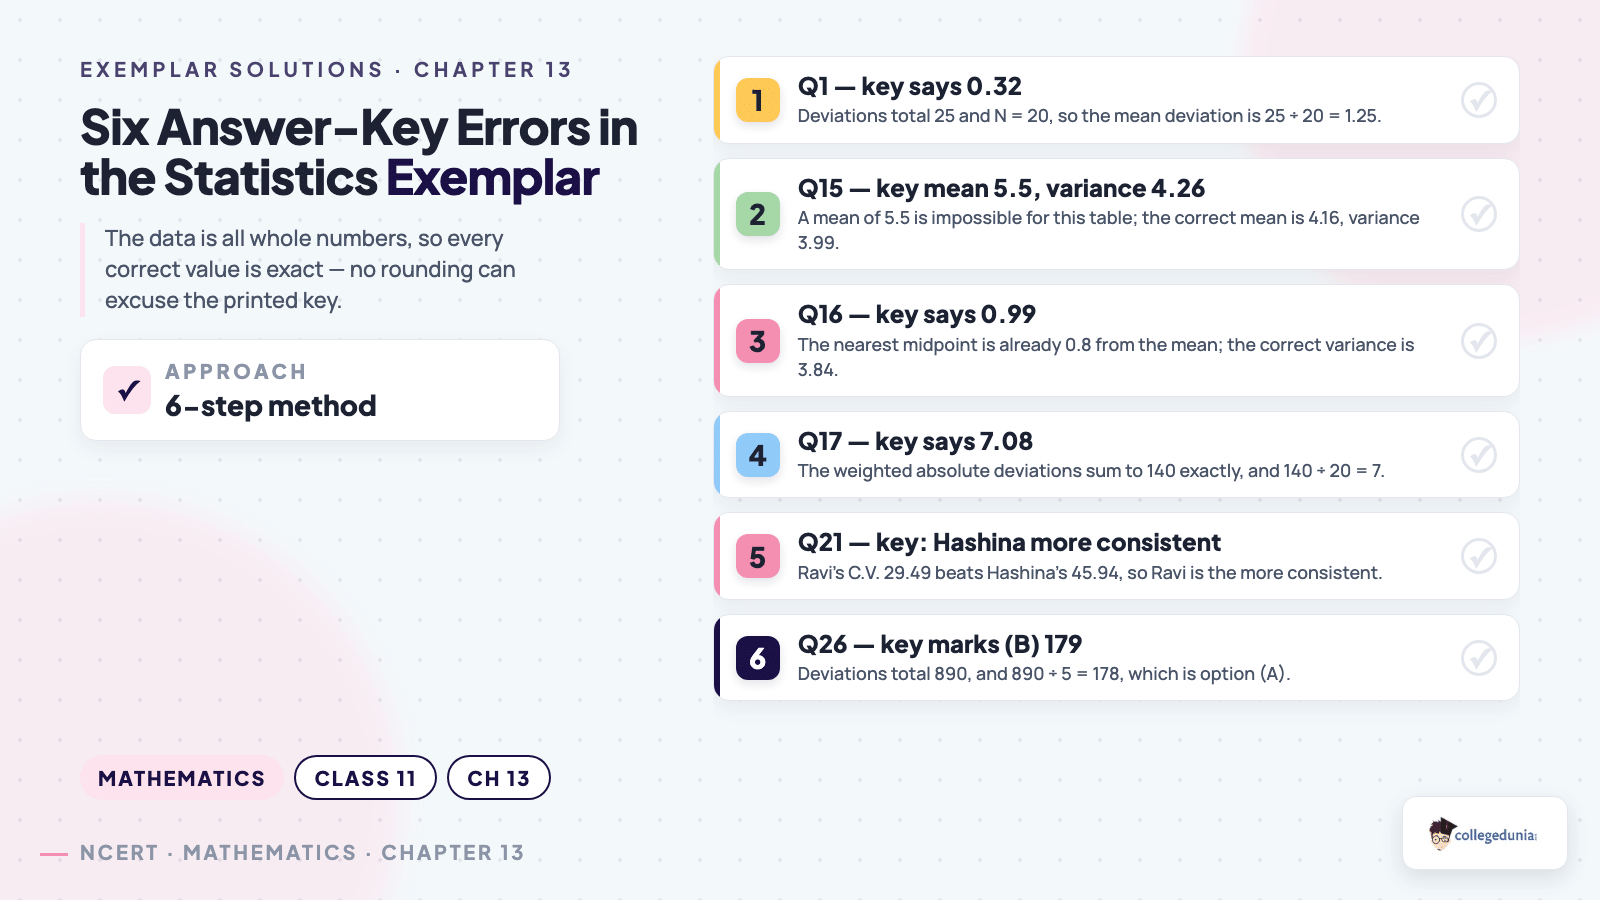
- Six answer-key errors flagged: the printed key is wrong on Q1, Q15, Q16, Q17, Q21 and Q26.
- Exam focus: useful for CBSE Boards, JEE Main, JEE Advanced and CUET.
Topics Covered in the Class 11 Maths Statistics Exemplar
Statistics is a chapter of table work. Every question is a measure of spread, and the only real decisions are which measure is asked for and which centre it is measured from. The Exemplar spends most of its questions on grouped data, where the individual values are unknown and each class must be replaced by its midpoint. These are the topics the 46 questions are built on.
- Mean deviation about the mean: for raw data, discrete frequency tables and grouped classes, as in Q1 and Q16.
- Mean deviation about the median: including finding the median of grouped data by interpolation first, as in Q2 and Q17.
- Variance and standard deviation: the shortcut form σ2 = (Σfixi2)/N − x̄2, which the chapter uses far more than the definition.
- Combined standard deviation: pooling two groups through Σx and Σx2, proved in Q7 and applied in Q8 and Q12.
- Change of origin and scale: adding a constant leaves σ unchanged, multiplying by k multiplies σ by |k|. This drives Q31 to Q33, Q35, Q36 and Q39.
- Coefficient of variation: C.V. = (σ/x̄) × 100, the only fair way to compare the consistency of two data sets with different means.
- Standard results: the mean deviation and standard deviation of the first n natural numbers, and of an A.P., in Q3, Q4, Q5 and Q20.
- Correcting wrong observations: Q22 and Q23 hand students a mean and variance computed from a misread value and ask for the true figures.
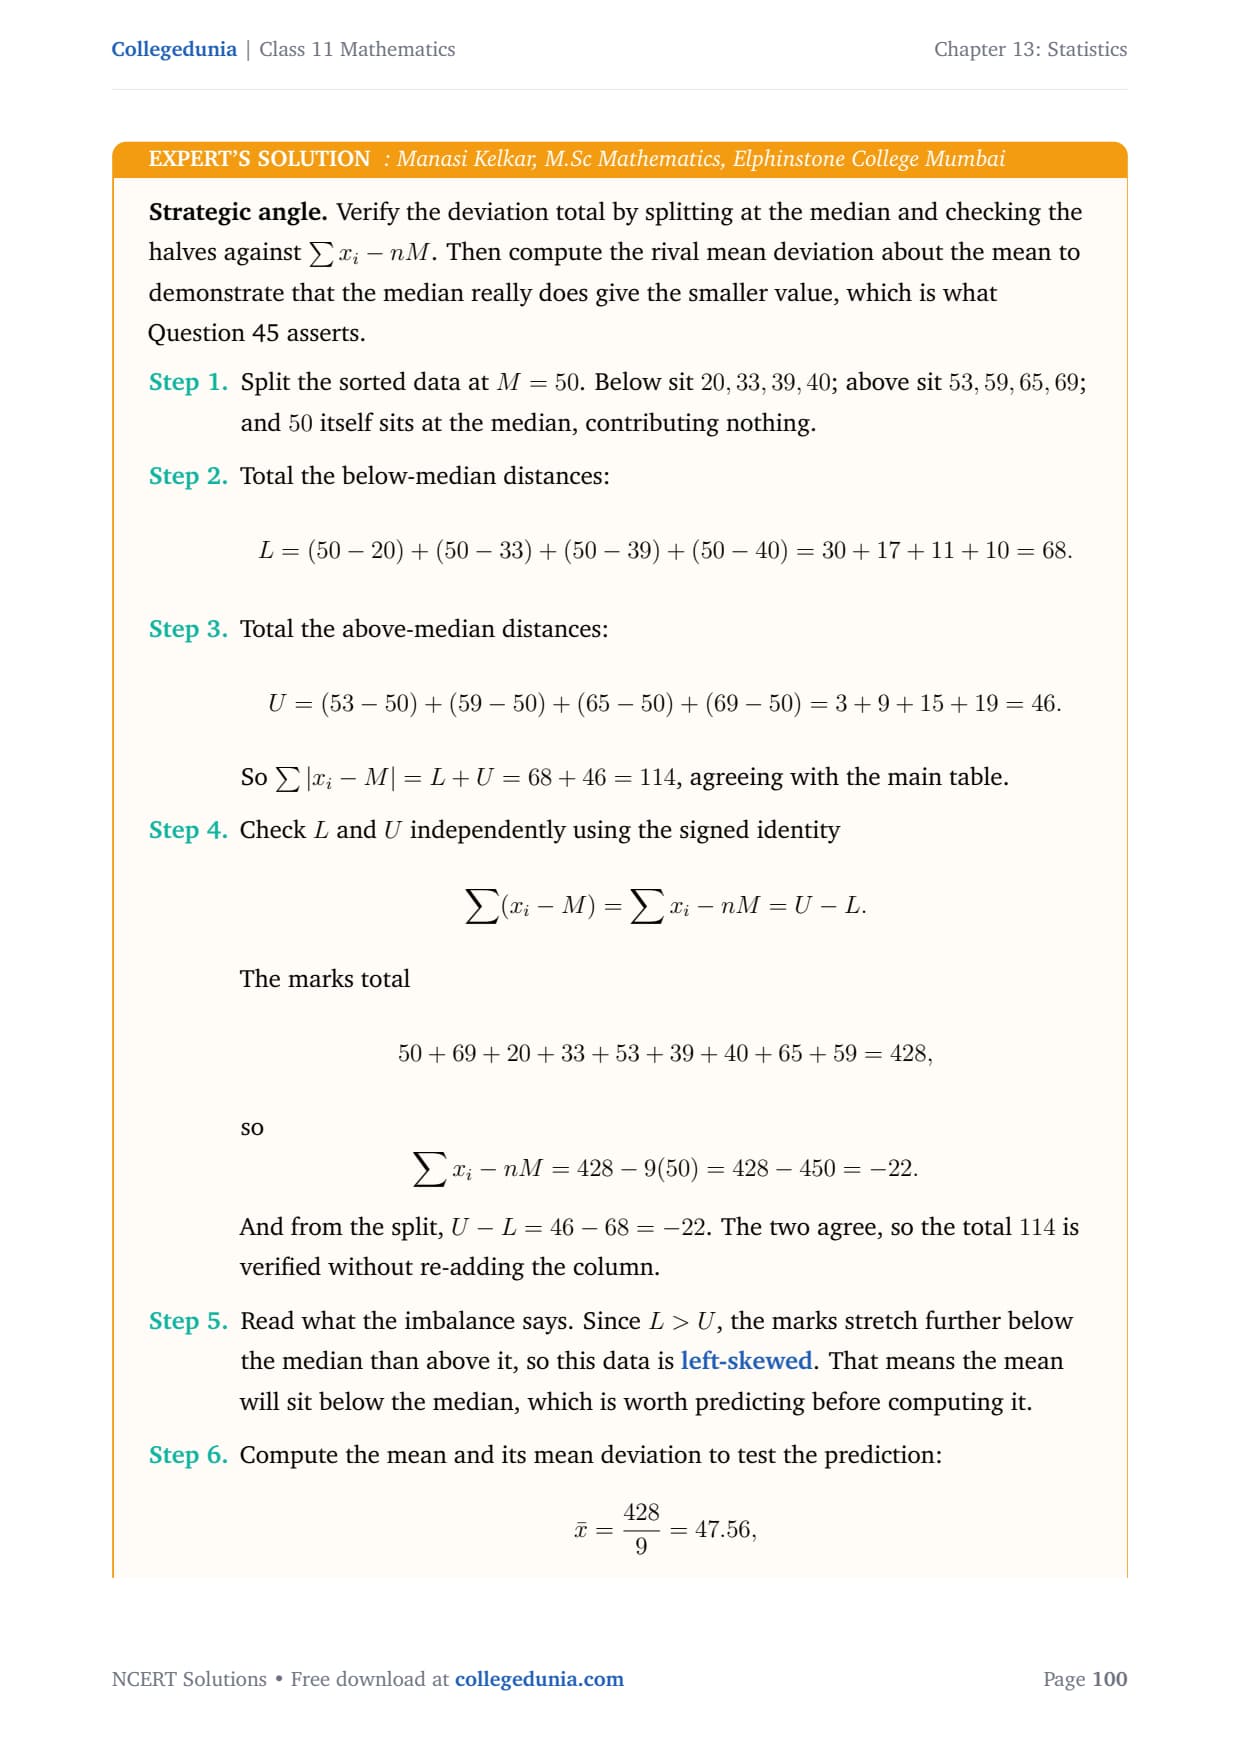
Important: mean deviation is always smallest when measured from the median, and the sum of squared deviations is always smallest when measured from the mean. Q44 and Q45 ask for exactly these two facts, and they also explain why the chapter keeps switching between the two centres.
Exercise 15.3 Question-Type Breakdown for Statistics
All 46 questions sit inside the single exercise the book prints as Exercise 15.3, grouped by format. The table below shows how the exercise splits, so students can plan practice by question type rather than solving straight through.
| Question Type | Question Numbers | Count | What it tests |
|---|---|---|---|
| Short Answer | Q1 to Q15 | 15 | Mean deviation, standard deviation, combined groups, standard results |
| Long Answer | Q16 to Q23 | 8 | Grouped-data tables, coefficient of variation, correcting wrong readings |
| Objective (MCQ) | Q24 to Q39 | 16 | Formula recognition and the effect of change of origin and scale |
| Fill in the Blanks | Q40 to Q46 | 7 | Definitions and the standard properties of the two measures |
The Long Answer block (Q16 to Q23) is where this chapter is won or lost, and it is also where five of the six key errors sit. Every question there is a full table that must be built without arithmetic slips. The Objective block is the largest group and is the fastest to finish, because most of its questions are settled by the change-of-origin and change-of-scale rules rather than by any computation.
Six Answer-Key Errors in the Statistics Exemplar Every Student Must Know
The printed NCERT Exemplar key for Statistics has six questions where the given answer is wrong, which is the highest count of key errors in any chapter of this set apart from Limits and Derivatives. In each case the data is made of whole numbers, so the correct value is exact and there is no rounding step that could explain the difference. Students who copy the key blindly will learn the wrong answer, so read this section before self-checking.
| Question | Printed key | Correct answer | The check that settles it |
|---|---|---|---|
| Q1 | 0.32 | 1.25 | Deviations total 25, N = 20, so 25 ÷ 20 = 1.25 |
| Q15 | Mean 5.5, Variance 4.26 | Mean 4.16, Variance 3.99 | A mean of 5.5 needs Σfixi = 88, but the largest possible total is 66.5 |
| Q16 | 0.99 | 3.84 | The nearest midpoint is already 0.8 from the mean, and 6 of 25 values lie over 7 away |
| Q17 | 7.08 | 7 | Σfi|xi − M| = 140 exactly, and 140 ÷ 20 = 7 |
| Q21 | Hashina is more intelligent and more consistent | Hashina is more intelligent, Ravi is more consistent | Ravi's C.V. is 29.49 against Hashina's 45.94 |
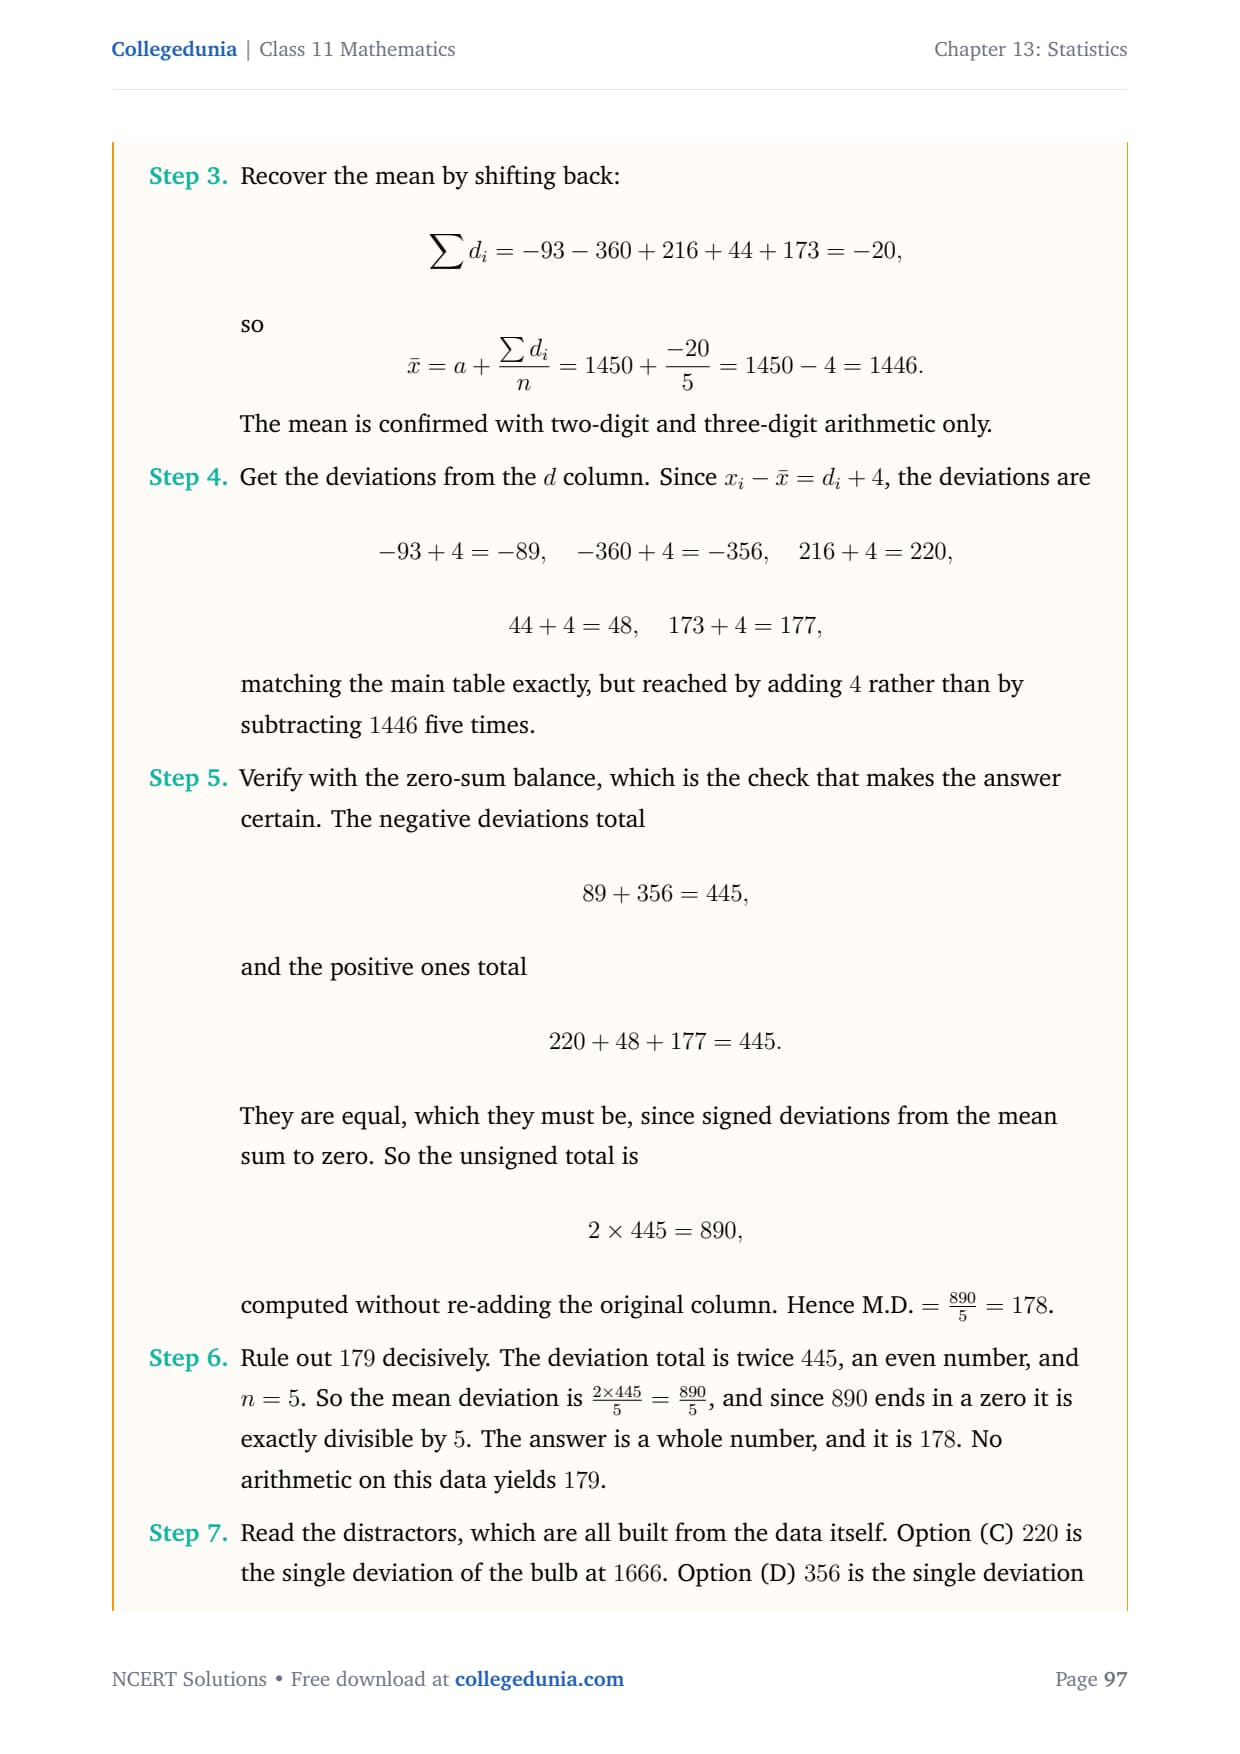
| Q26 | (B) 179 | (A) 178 | Deviations total 890, and 890 ÷ 5 = 178 exactly |
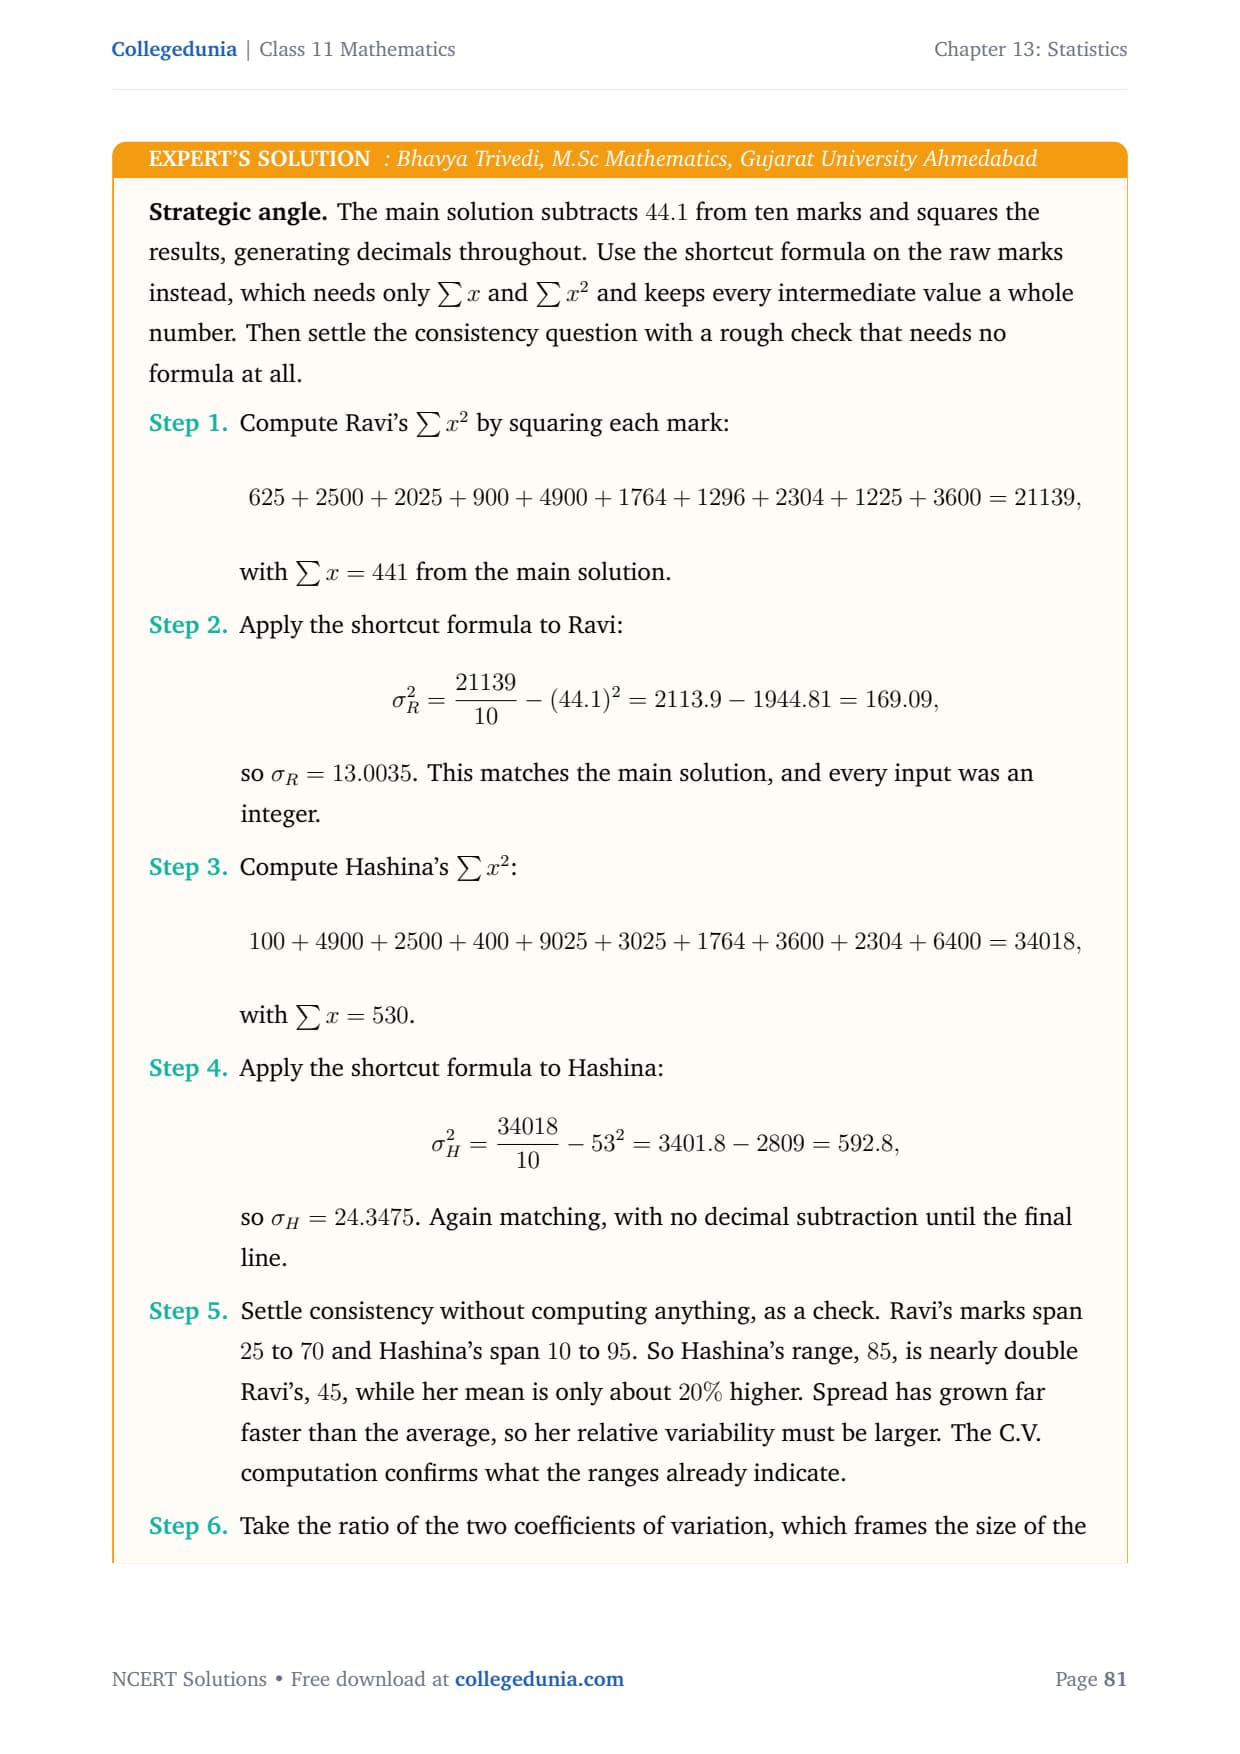
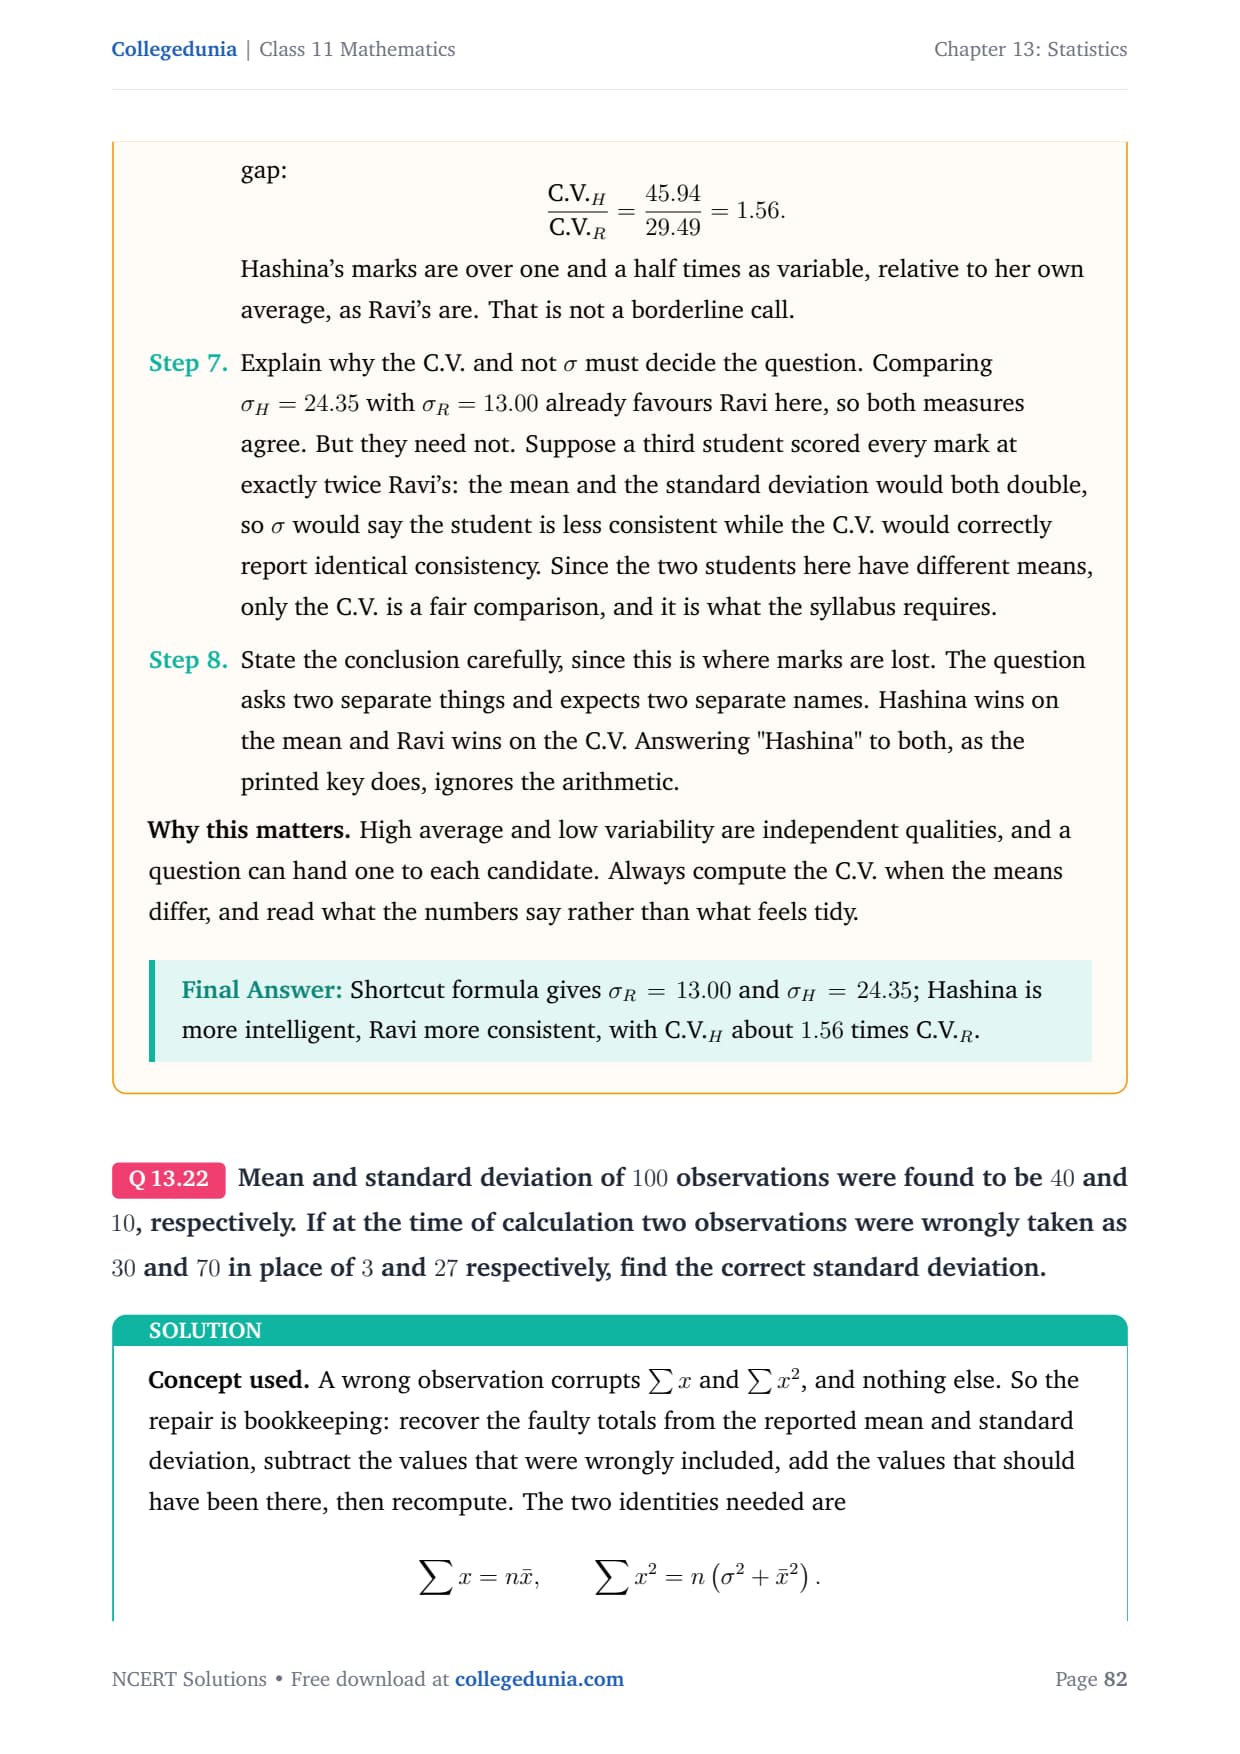
Q21 is the most interesting of the six, because the key is half right. The question gives the marks of two students, Ravi and Hashina, over ten tests and asks who is more intelligent and who is more consistent. Those are two different questions measured by two different quantities. Intelligence is judged by the mean, and Hashina's mean of 53 beats Ravi's 44.1, so the key's first half is correct. Consistency is judged by the coefficient of variation, and the lower C.V. wins. Ravi's C.V. is 29.49 against Hashina's 45.94, so Ravi is the more consistent, not Hashina. The raw data says the same thing at a glance: Hashina's marks swing from 10 to 95, a range of 85, while Ravi's stay between 25 and 70, a range of 45. Several solution books reprint the key's wording even though their own tables show Ravi's C.V. is lower, which contradicts their own working.
Q1, Q17 and Q26 are settled by exact integer arithmetic. In Q1 the total frequency is 20 and the deviations weighted by frequency add to exactly 25, so the mean deviation is 25 ÷ 20 = 1.25. No reading of the table produces the key's 0.32. In Q17 every midpoint, frequency and distance is a whole number, so Σfi|xi − M| = 140 is exact and 140 ÷ 20 = 7 exactly. To reach the key's 7.08 the sum would have to be 141.6, which no combination of these integers produces. In Q26 the lives of five bulbs are 1357, 1090, 1666, 1494 and 1623, giving a mean of 1446. The absolute deviations add to 890, and 890 ÷ 5 = 178 exactly, so the answer is (A) and not the key's (B) 179. To reach 179 the deviation total would have to be 895.
Q15 and Q16 fail a bound check before any table is built. In Q15 the total frequency is 16, so the key's mean of 5.5 would need Σfixi = 5.5 × 16 = 88. But the four midpoints can produce at most 66.5, so a mean of 5.5 is unreachable under any midpoint convention. The correct mean is 66.5 ÷ 16 = 4.16, and the exact variance from the unrounded mean 133/32 is 4087/1024, which is 3.99. Providers who quote 3.96, 4.04 or 4.24 differ only because they square a rounded mean such as 4.15 or 4.16. In Q16 the midpoints run from 2 to 18 and the mean is 9.2, so the nearest midpoint is already 0.8 away and the two extreme classes sit 7.2 and 8.8 away. An average distance of 0.99 is impossible when 6 of the 25 observations lie more than 7 units from the mean. The correct value is 3.84.
Key Formulas Used in the Class 11 Maths Statistics Exemplar
Statistics has a short formula list, but every question in the chapter is an application of one of these. Students should be able to write this table from memory before starting the exercise.
| Result | Statement | Where it is used |
|---|---|---|
| Mean of grouped data | x̄ = (Σfixi)/N, where xi is the class midpoint | Q1, Q15, Q16, Q18 |
| Mean deviation | M.D.(x̄) = (Σfi|xi − x̄|)/N, and the same with M for the median | Q1, Q2, Q16, Q17, Q24 |
| Median of grouped data | M = l + [(N/2 − cf)/f] × h, using the class before the median class for cf | Q17, Q27 |
| Variance shortcut | σ2 = (Σfixi2)/N − x̄2 | Q15, Q18, Q28, Q30, Q37 |
| Combined groups | Pool through Σx and Σx2, never by averaging the two standard deviations | Q7, Q8, Q12 |
| Change of origin | Adding a constant k to every value leaves σ and the variance unchanged | Q31, Q35, Q43 |
| Change of scale | Multiplying every value by k multiplies σ by |k| and the variance by k2 | Q32, Q33, Q36, Q39 |
| Coefficient of variation | C.V. = (σ/x̄) × 100, and the lower C.V. is the more consistent | Q21, Q38, Q40 |
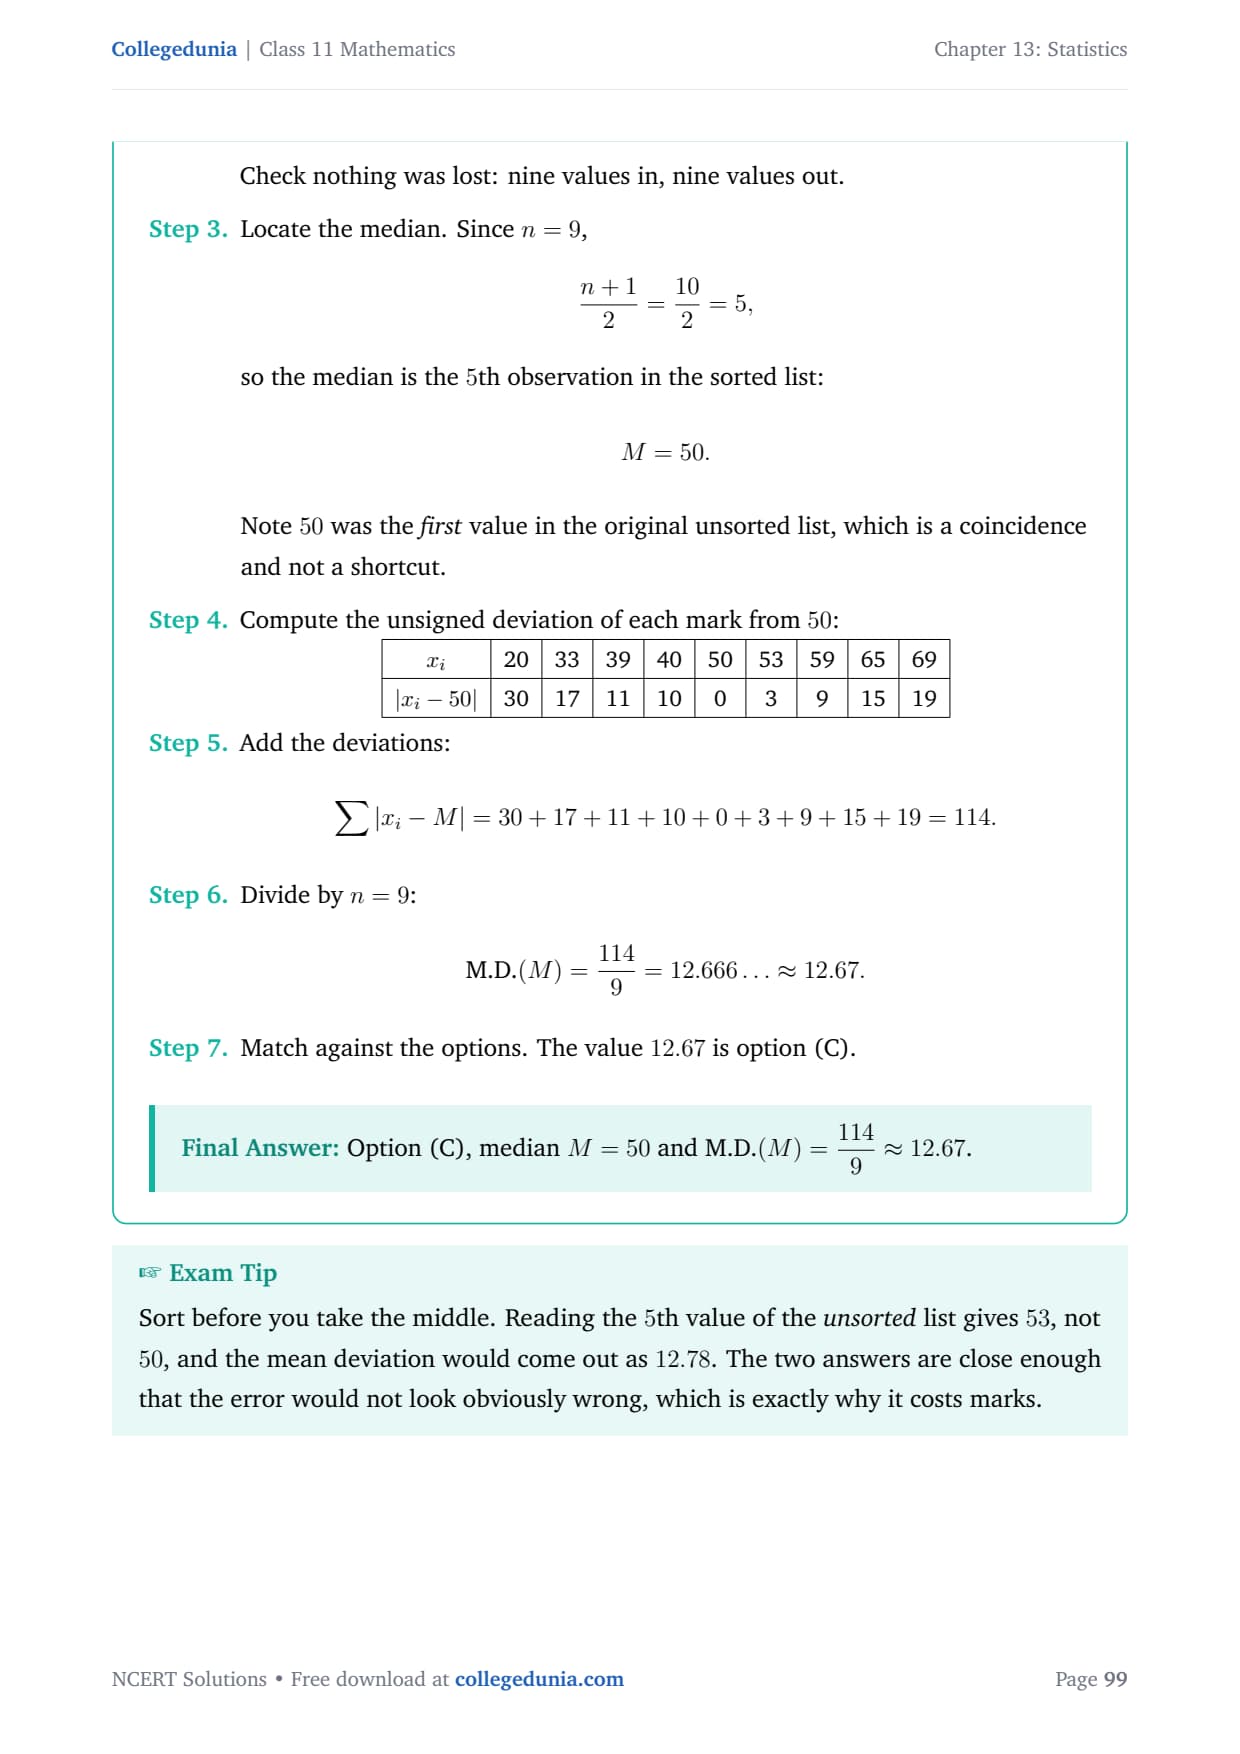
Tip: the change-of-origin and change-of-scale rules together settle six Objective questions with no arithmetic at all. In Q36 the values are multiplied by −1 and then 1 is added, so the variance is multiplied by (−1)2 = 1 and the addition changes nothing. The variance is simply unchanged.
Common Mistakes Students Make in the Statistics Exemplar
The same reflexes cost marks in this chapter every year. These five are the ones the solutions flag most often.
- Averaging two standard deviations. Standard deviations combine only through Σx and Σx2, or through the formula proved in Q7. Taking (σ1 + σ2)/2 has no statistical meaning at all, and Q6 is built to catch it.
- Assuming every class has the same width. Q15 breaks the pattern deliberately in its last class. Always compute each midpoint from its own limits rather than continuing an arithmetic sequence.
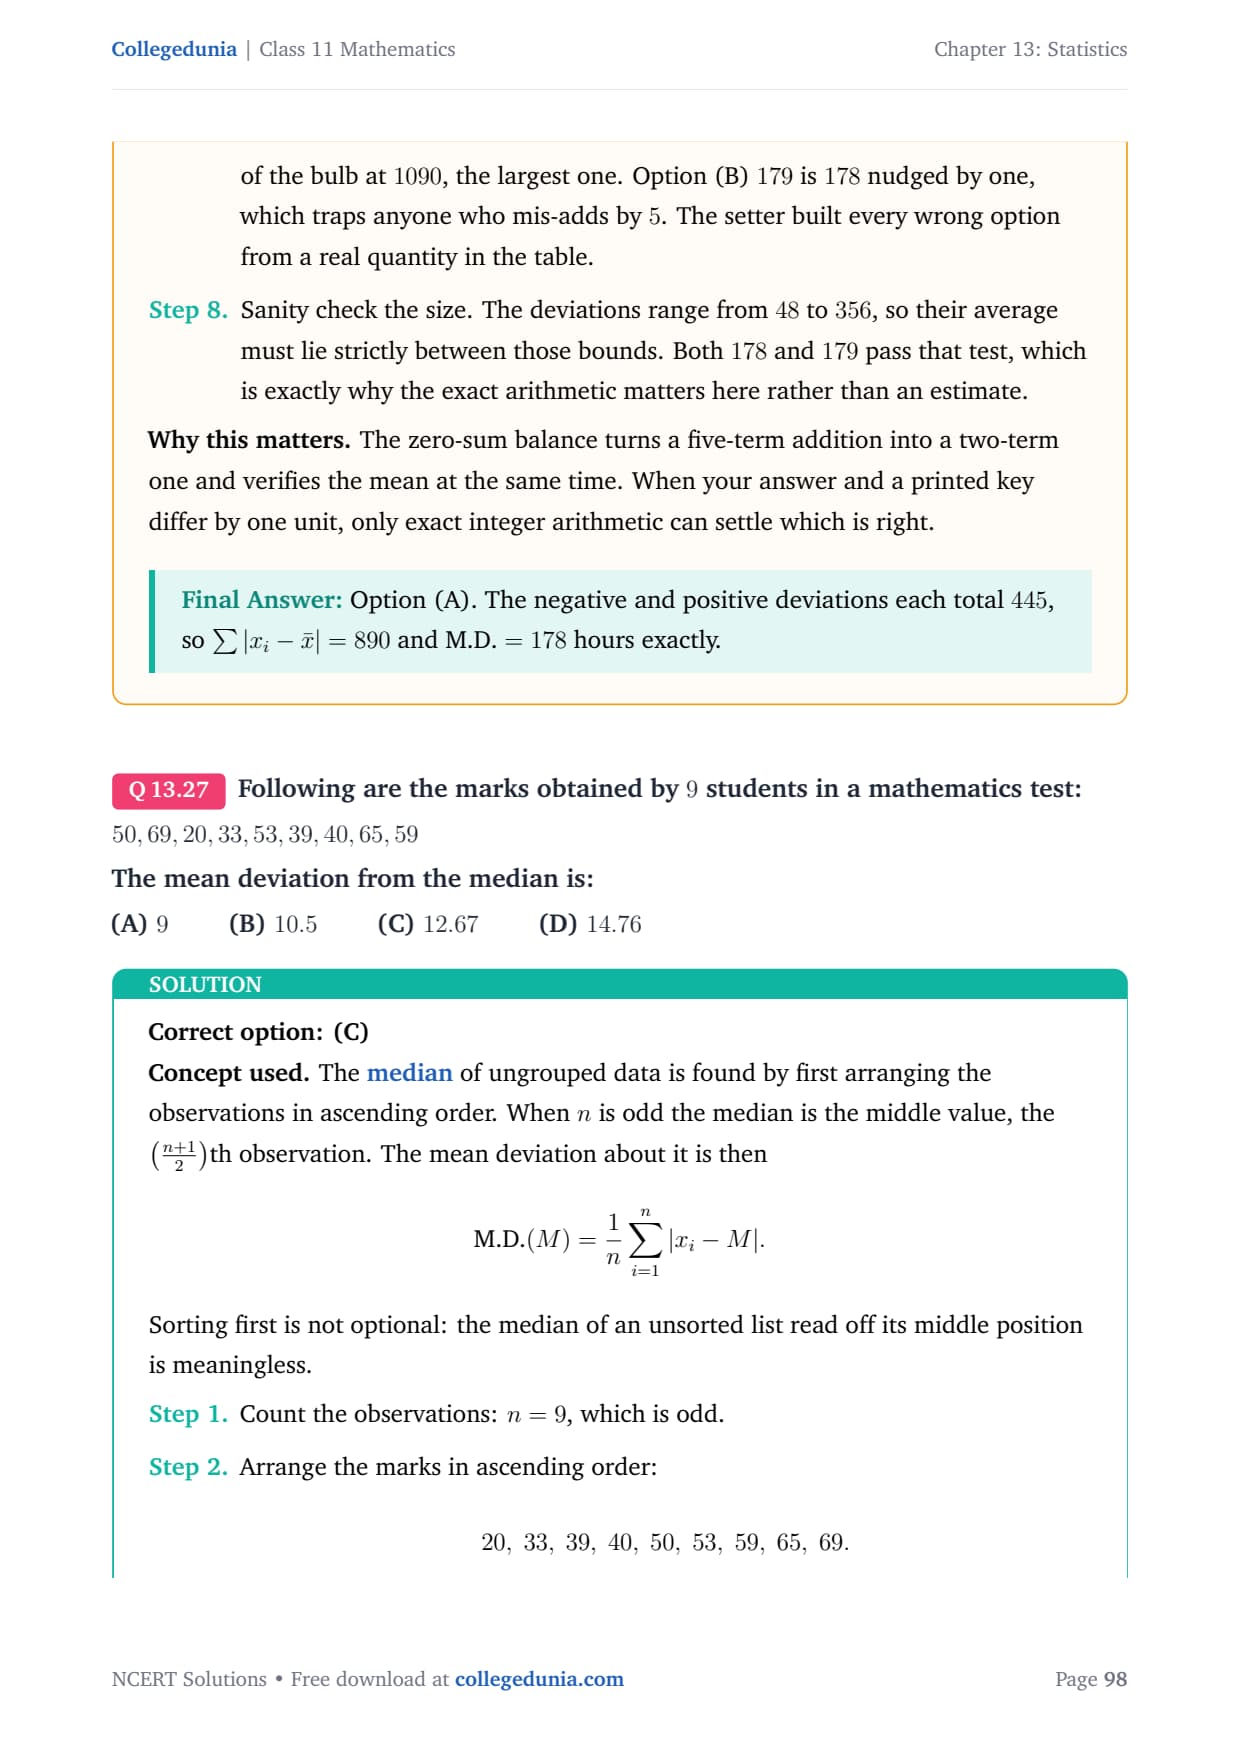
- Using the median class's own cumulative frequency. The interpolation formula wants the cumulative frequency of the class before the median class. In Q17 that is 9, not 12.
- Confusing standard deviation with variance in an option list. Q28 offers both √(52/7) and 52/7. One is the standard deviation and the other is the variance, and only one of them answers the question asked.
- Comparing consistency using σ instead of C.V. Two data sets with different means cannot be compared by σ alone. Q21 is exactly this question, and it is why the coefficient of variation exists.
How the Statistics Exemplar Steps Up from the NCERT Textbook
The Exemplar adds no new topics to Statistics. It asks the same ideas in a harder direction, as the table shows.
| Concept | NCERT Textbook asks | NCERT Exemplar asks |
|---|---|---|
| Mean deviation | Compute it for a short list of numbers | Compute it for the first n natural numbers, in terms of n |
| Standard deviation | Apply the formula to a given table | Derive it for an A.P. with first term a and common difference d |
| Combined data | Find the mean of two groups together | Find the combined standard deviation, and prove the formula first |
| Change of scale | State that σ is unaffected by change of origin | Convert a temperature standard deviation from Celsius to Fahrenheit |
| Corrections | Recompute a mean after one value is fixed | Recompute both mean and variance after two values are fixed |
How to Use the Statistics Exemplar for Boards and JEE Preparation
Statistics is the most predictable scoring chapter in the Class 11 Maths Exemplar, because every question follows a table. Treat the exercise as four sittings and write every table out in full, since almost all lost marks here are arithmetic slips rather than concept gaps.
| Session | What to solve | Time |
|---|---|---|
| 1 | Short Answer Q1 to Q15 | 2 hours |
| 2 | Long Answer Q16 to Q23, every table written out in full | 2.5 hours |
| 3 | Objective Q24 to Q39 | 1.5 hours |
| 4 | Q40 to Q46, then re-solve everything marked wrong | 1 hour |
That is about 7 hours for the chapter. For CBSE Boards and CUET, the grouped-data tables in the Long Answer block are the highest-value practice, because they are set almost every year in some form. For JEE Main and JEE Advanced, the change-of-origin and change-of-scale results and the combined standard deviation formula matter most, since those are the parts that appear as one-line objective questions.
Practice Questions for Class 11 Maths Statistics
After reading the solutions, students should test themselves on the same question types. The card below opens a set of solved practice questions with step-by-step answers for Statistics.
Practice Card: Solved Practice Questions for Class 11 Maths Statistics. Attempt each question, then check the solution.
Student Feedback
In a Collegedunia survey of 12,840 Class 11 students conducted before the 2026 exams, 68% of students said they lost marks in this chapter to arithmetic slips in the grouped-data tables rather than to any concept they did not know. Only 7% of students had noticed that the printed key answers the consistency half of Q21 the wrong way round.
Other Resources for Class 11 Maths Statistics
Pair the Exemplar Solutions with the textbook solutions and the notes for full chapter revision. All the Statistics resources are linked below.
| Resource | Link |
|---|---|
| NCERT Solutions | Statistics Class 11 NCERT Solutions |
| Revision Notes | Statistics Class 11 Notes |
| Handwritten Notes | Statistics Class 11 Handwritten Notes |
| NCERT Book PDF | Statistics Class 11 NCERT Book PDF |
| Exemplar Book PDF | Statistics Class 11 NCERT Exemplar Book PDF |
NCERT Exemplar Solutions for Other Class 11 Maths Chapters
The full Class 11 Maths Exemplar set covers 14 chapters, 735 questions and 2,625 pages of solutions. Use the table to jump to any other chapter.
Statistics Class 11 Maths NCERT Exemplar Solutions FAQs
Ques. How many questions are there in the Class 11 Maths Statistics Exemplar?
Ans. Statistics has 46 questions in a single exercise, which the Exemplar book prints as Exercise 15.3. They are split into 15 Short Answer, 8 Long Answer, 16 Objective and 7 Fill in the Blanks questions. Every one of them is solved in the 161-page PDF on this page.
Ques. Why is Statistics numbered Chapter 15 in the NCERT Exemplar book?
Ans. The NCERT Exemplar book follows an older chapter order in which Statistics is Chapter 15 and its exercise is Exercise 15.3. The current NCERT textbook lists it as Chapter 13, which is the number used on this page. The questions and the exercise content are identical, so students can use either number to find the same set.
Ques. Is the printed NCERT Exemplar answer key for Statistics correct?
Ans. Not on six questions. The key is wrong on Q1, Q15, Q16, Q17, Q21 and Q26. For example, Q17 works entirely in whole numbers and gives 140 ÷ 20 = 7 exactly, but the key prints 7.08. Each of the six errors is explained on this page with the correct answer and the one-line check that settles it.
Ques. Who is more consistent in Q21 of the Statistics Exemplar, Ravi or Hashina?
Ans. Ravi is more consistent, and Hashina is more intelligent. Consistency is measured by the coefficient of variation, and the lower value wins. Ravi's C.V. is 29.49 against Hashina's 45.94, so Ravi is the steadier performer even though Hashina's mean of 53 beats his 44.1. The printed key says Hashina is more consistent, which is wrong.
Ques. Are the Class 11 Maths Statistics Exemplar Solutions free to download?
Ans. Yes. The Statistics NCERT Exemplar Solutions PDF is free to download from this page. It runs to 161 pages, solves all 46 questions step by step according to the 2026-27 NCERT Exemplar, and helps students prepare for CBSE Boards, JEE Main, JEE Advanced and CUET.



Comments