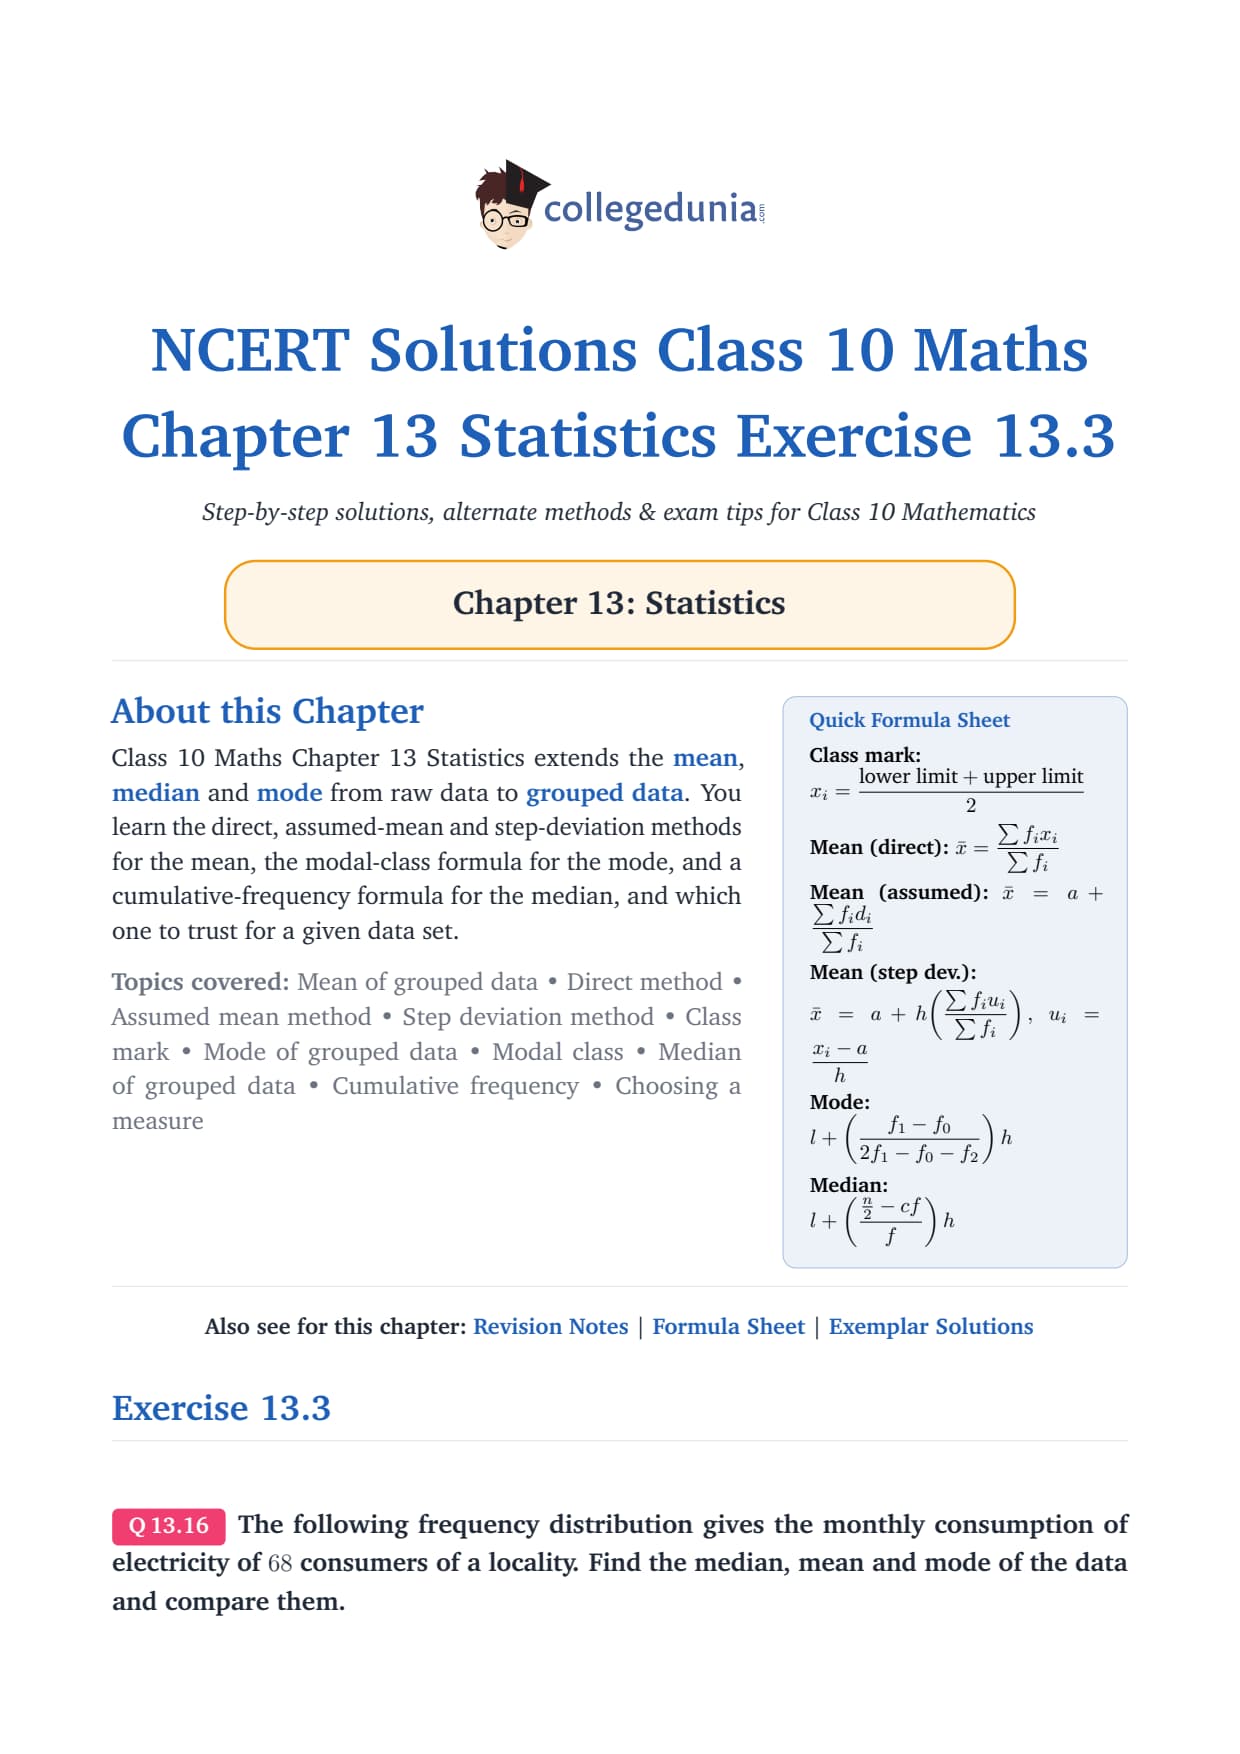
The NCERT Solutions for Class 10 Maths Chapter 13 Statistics Exercise 13.3 cover all 7 questions on the median of grouped data, solved step by step for the 2026-27 CBSE syllabus. Each answer builds the cumulative frequency table, identifies the median class, and applies the median formula correctly.
7 questions on median of grouped data, including "less than" cumulative type and inclusive class conversion.
Every question has a full step-by-step solution plus an Expert Solution that adds board-exam strategy and common-error warnings.
Covers the median formula: Median = l + (n2 - cff) h with all variables explained in context.
Every answer in this Collegedunia compilation is curated by Mathematics subject experts, according to the 2026-27 NCERT textbook, and checked against the last five years of CBSE Class 10 Mathematics board papers.
What Exercise 13.3 of Statistics Chapter 13 Covers
Exercise 13.3 focuses entirely on finding the median of grouped data. The NCERT textbook uses this exercise to test whether students can set up the cumulative frequency table correctly and then read the median class from it. This is the most commonly tested part of Chapter 13 in the CBSE Class 10 board exam.
Median class identification: you find the class whose cumulative frequency first reaches n2, not the class with the highest frequency.
Inclusive to continuous conversion: Question 4 uses inclusive classes (like 118-126) that need a 0.5 adjustment before the formula applies.
"Less than" data type: Question 3 gives a "Below x" table, which must be converted to ordinary class frequencies by subtracting.
Combined questions: Questions 1 and 6 ask for median, mean, and mode together, so students need all three formulas.
Median Formula for Grouped Data: Key Concept for Exercise 13.3
The median formula used throughout Exercise 13.3 is:
n2Median = l + (n2 − cf)f × h
Variable
Meaning
How to find it
l
Lower boundary of the median class
Read from the class interval
n
Total number of observations
Sum of all frequencies
cf
Cumulative frequency before the median class
Running total up to the class above the median class
f
Frequency of the median class
Read from the frequency table
h
Class width (size)
Upper limit minus lower limit of any class
The most common mistake in Exercise 13.3: using the cumulative frequency of the median class instead of the cumulative frequency before it for the cf value. Always use the cf of the class just above the median class.
How to Solve Exercise 13.3 Question by Question
There are 7 questions in Exercise 13.3. The method is the same for most of them: build the cumulative frequency column, find n2, identify the median class, then substitute into the formula. Here is a quick guide for each question type:
Question
Data type
Special step
Answer (median)
Q1
Monthly electricity consumption, 68 consumers
Also find mean and mode
137 units
Q2
Unknown x and y, median given as 28.5
Two equations from total + median formula
x = 8, y = 7
Q3
"Below x" age data, 100 policy holders
Convert less-than table to class frequencies
35.76 years
Q4
Leaf lengths 118-126, 127-135... (inclusive)
Subtract 0.5 / add 0.5 to make continuous
146.75 mm
Q5
Neon lamp lifetime, 400 lamps
Classes already continuous
3406.98 hours
Q6
Surname letter count, 100 surnames
Also find mean and mode
8.05 letters
Q7
Student weights, 30 students
Symmetric data; median class is NOT the tallest
56.67 kg
Common Errors Students Make in Exercise 13.3 (and How to Avoid Them)
Board papers award 3 to 4 marks for median questions. Losing even one step costs marks. Here are the four errors that come up most often:
Wrong cf value: Using the cumulative frequency of the median class itself instead of the class before it. The formula needs the total count before the median class starts.
Not converting inclusive classes: In Question 4, the classes 118-126, 127-135 have gaps. You must shift boundaries by 0.5 (to 117.5-126.5, 126.5-135.5) before applying the formula. Skipping this gives a wrong answer.
Confusing median class with modal class: The median class is decided by the cumulative frequency crossing n/2, not by which class has the highest frequency. In Question 7, the tallest class is 50-55 but the median class is 55-60.
Forgetting to difference the "less than" table: In Question 3, the given numbers are cumulative totals. You must subtract each from the next to recover the actual class frequencies before building the cf column again.
All NCERT Solutions for Class 10 Maths Chapter 13 Statistics Exercise 13.3 with Step-by-Step Solutions
Exercise 13.3
Q 13.1
The following frequency distribution gives the monthly
consumption of electricity of 68 consumers of a locality. Find the
median, mean and mode of the data and compare them.
tabular|l|c|
Monthly consumption (in units) & Number of consumers
65–85 & 4
85–105 & 5
105–125 & 13
125–145 & 20
145–165 & 14
165–185 & 8
185–205 & 4
tabular
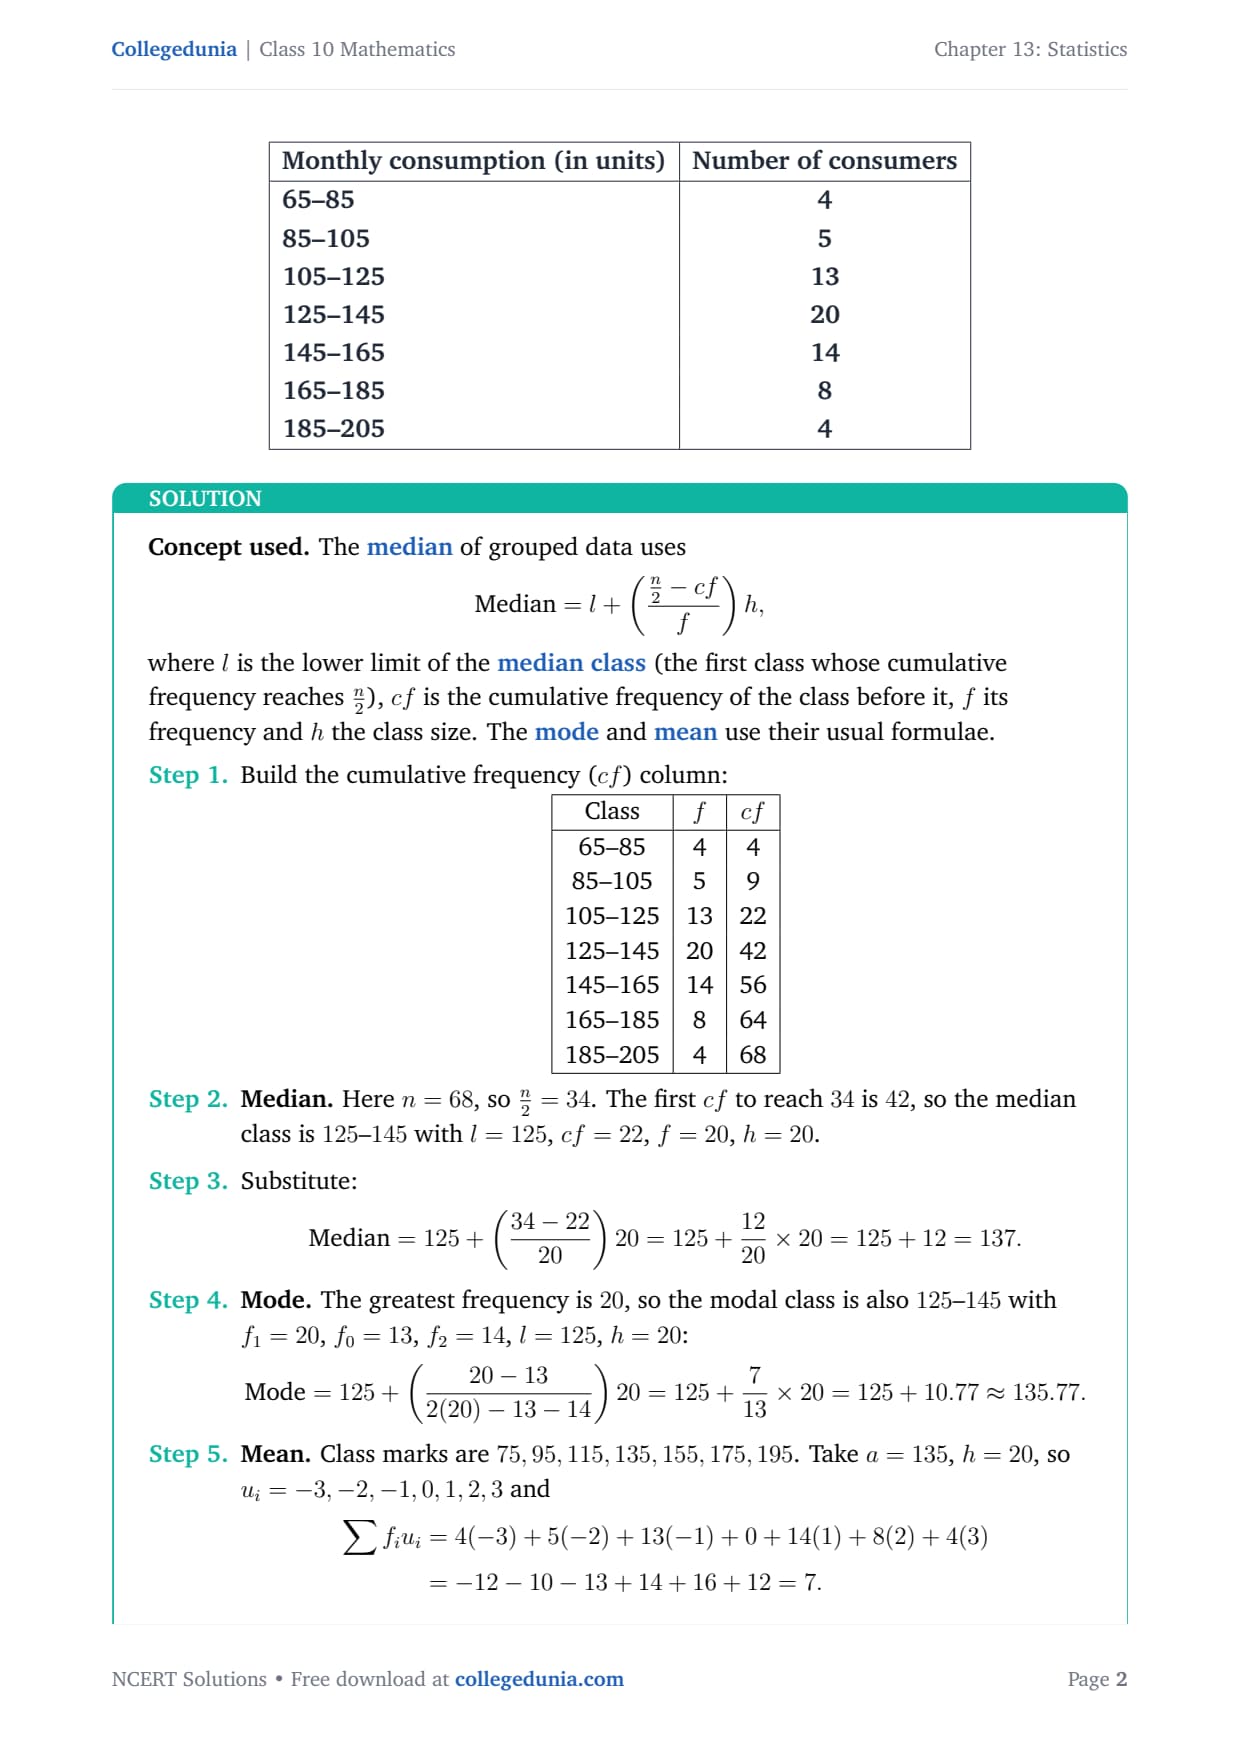
Concept used. The median of grouped data uses
Median=l+(n2-cff)h,
where l is the lower limit of the median class (the first
class whose cumulative frequency reaches n2), cf is the
cumulative frequency of the class before it, f its frequency and h
the class size. The mode and mean use their usual
formulae.
Mode. The greatest frequency is 20, so the modal class
is also 125–145 with f1=20, f0=13, f2=14, l=125,
h=20:
Mode=125+(20-132(20)-13-14)20=125+713× 20=125+10.77≈ 135.77.
Mean. Class marks are 75,95,115,135,155,175,195. Take
a=135, h=20, so ui=-3,-2,-1,0,1,2,3 and
MATH0
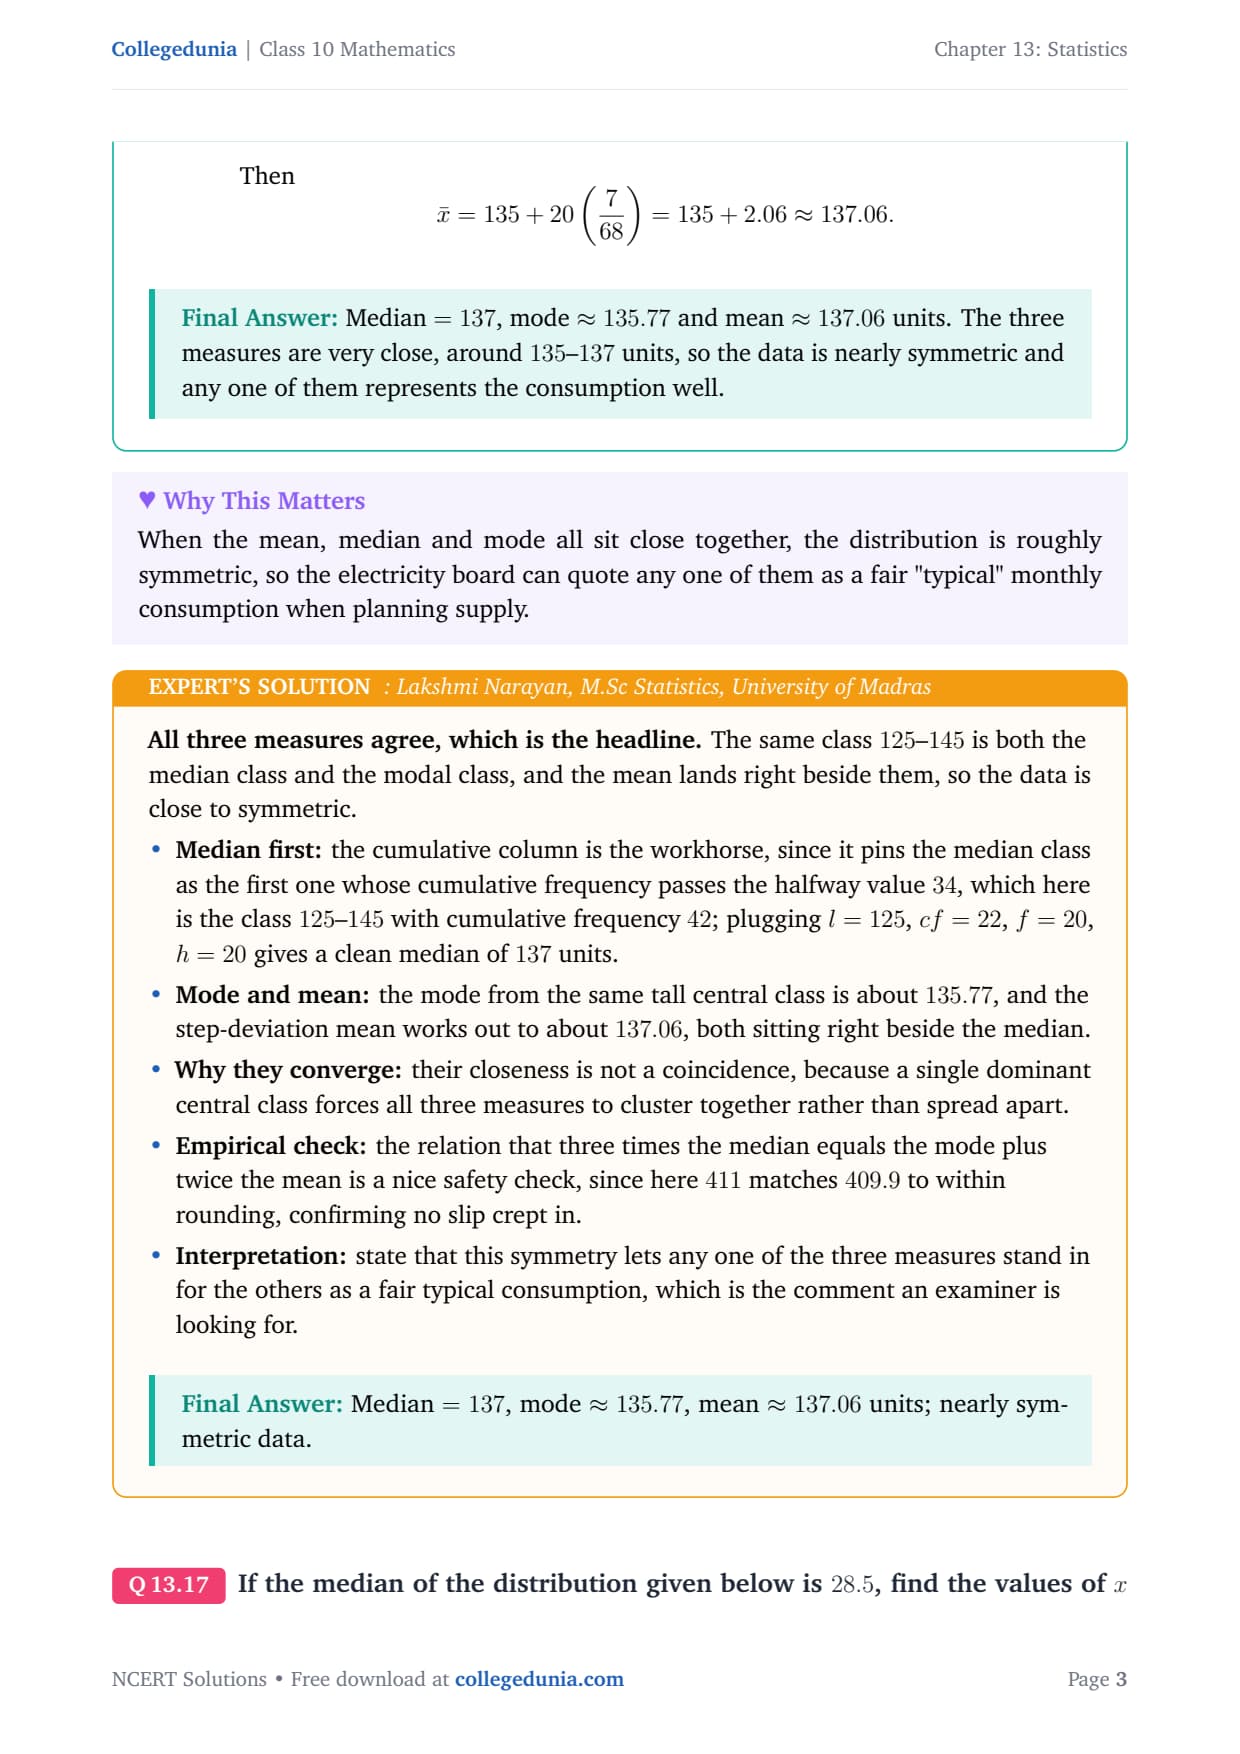
Then
x̄=135+20(768)=135+2.06≈ 137.06.
Median =137, mode ≈ 135.77 and mean ≈ 137.06 units. The three measures are very close, around 135–137 units, so the data is nearly symmetric and any one of them represents the consumption well.
LN
Lakshmi Narayan
M.Sc Statistics, University of Madras
Verified Expert
All three measures agree, which is the headline. The same class
125–145 is both the median class and the modal class, and the mean lands
right beside them, so the data is close to symmetric.
Median first: the cumulative column is the workhorse, since
it pins the median class as the first one whose cumulative frequency
passes the halfway value 34, which here is the class 125–145
with cumulative frequency 42; plugging l=125, cf=22, f=20,
h=20 gives a clean median of 137 units.
Mode and mean: the mode from the same tall central class is
about 135.77, and the step-deviation mean works out to about
137.06, both sitting right beside the median.
Why they converge: their closeness is not a coincidence,
because a single dominant central class forces all three measures to
cluster together rather than spread apart.
Empirical check: the relation that three times the median
equals the mode plus twice the mean is a nice safety check, since
here 411 matches 409.9 to within rounding, confirming no slip
crept in.
Interpretation: state that this symmetry lets any one of the
three measures stand in for the others as a fair typical consumption,
which is the comment an examiner is looking for.
Median =137, mode ≈ 135.77, mean ≈ 137.06 units; nearly symmetric data.
Q 13.2
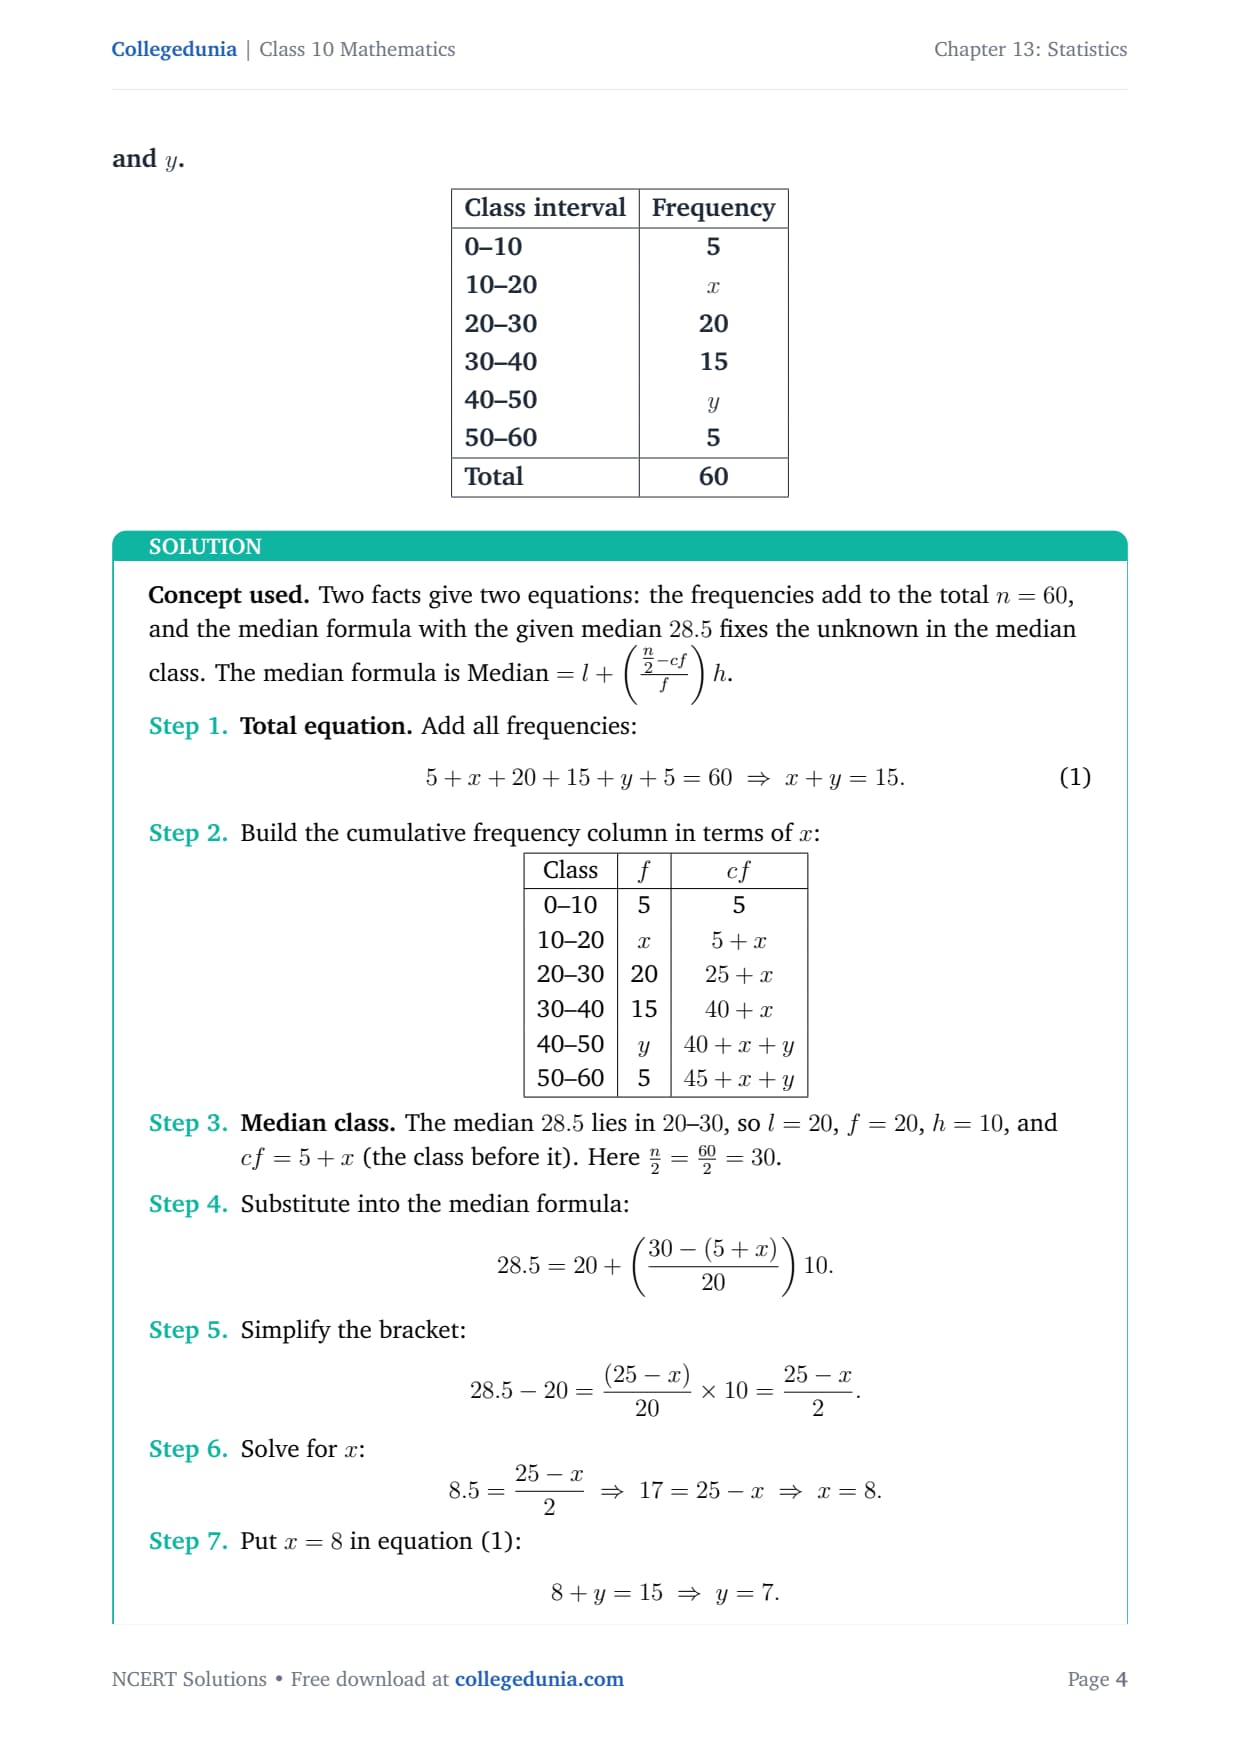
If the median of the distribution given below is 28.5, find
the values of x and y.
tabular|l|c|
Class interval & Frequency
0–10 & 5
10–20 & x
20–30 & 20
30–40 & 15
40–50 & y
50–60 & 5
Total & 60
tabular
Concept used. Two facts give two equations: the frequencies add
to the total n=60, and the median formula with the given median 28.5
fixes the unknown in the median class. The median formula is
Median=l+(n2-cff)h.
Total equation. Add all frequencies:
5+x+20+15+y+5=60 ⇒ x+y=15. 1
Build the cumulative frequency column in terms of x:
tabular|c|c|c|
Class & f & cf
0–10 & 5 & 5
10–20 & x & 5+x
20–30 & 20 & 25+x
30–40 & 15 & 40+x
40–50 & y & 40+x+y
50–60 & 5 & 45+x+y
tabular
Median class. The median 28.5 lies in 20–30, so
l=20, f=20, h=10, and cf=5+x (the class before it). Here
n2=602=30.
Substitute into the median formula:
28.5=20+(30-(5+x)20)10.
Simplify the bracket:
28.5-20=(25-x)20× 10=25-x2.
Solve for x:
8.5=25-x2 ⇒ 17=25-x ⇒ x=8.
Put x=8 in equation (1):
8+y=15 ⇒ y=7.
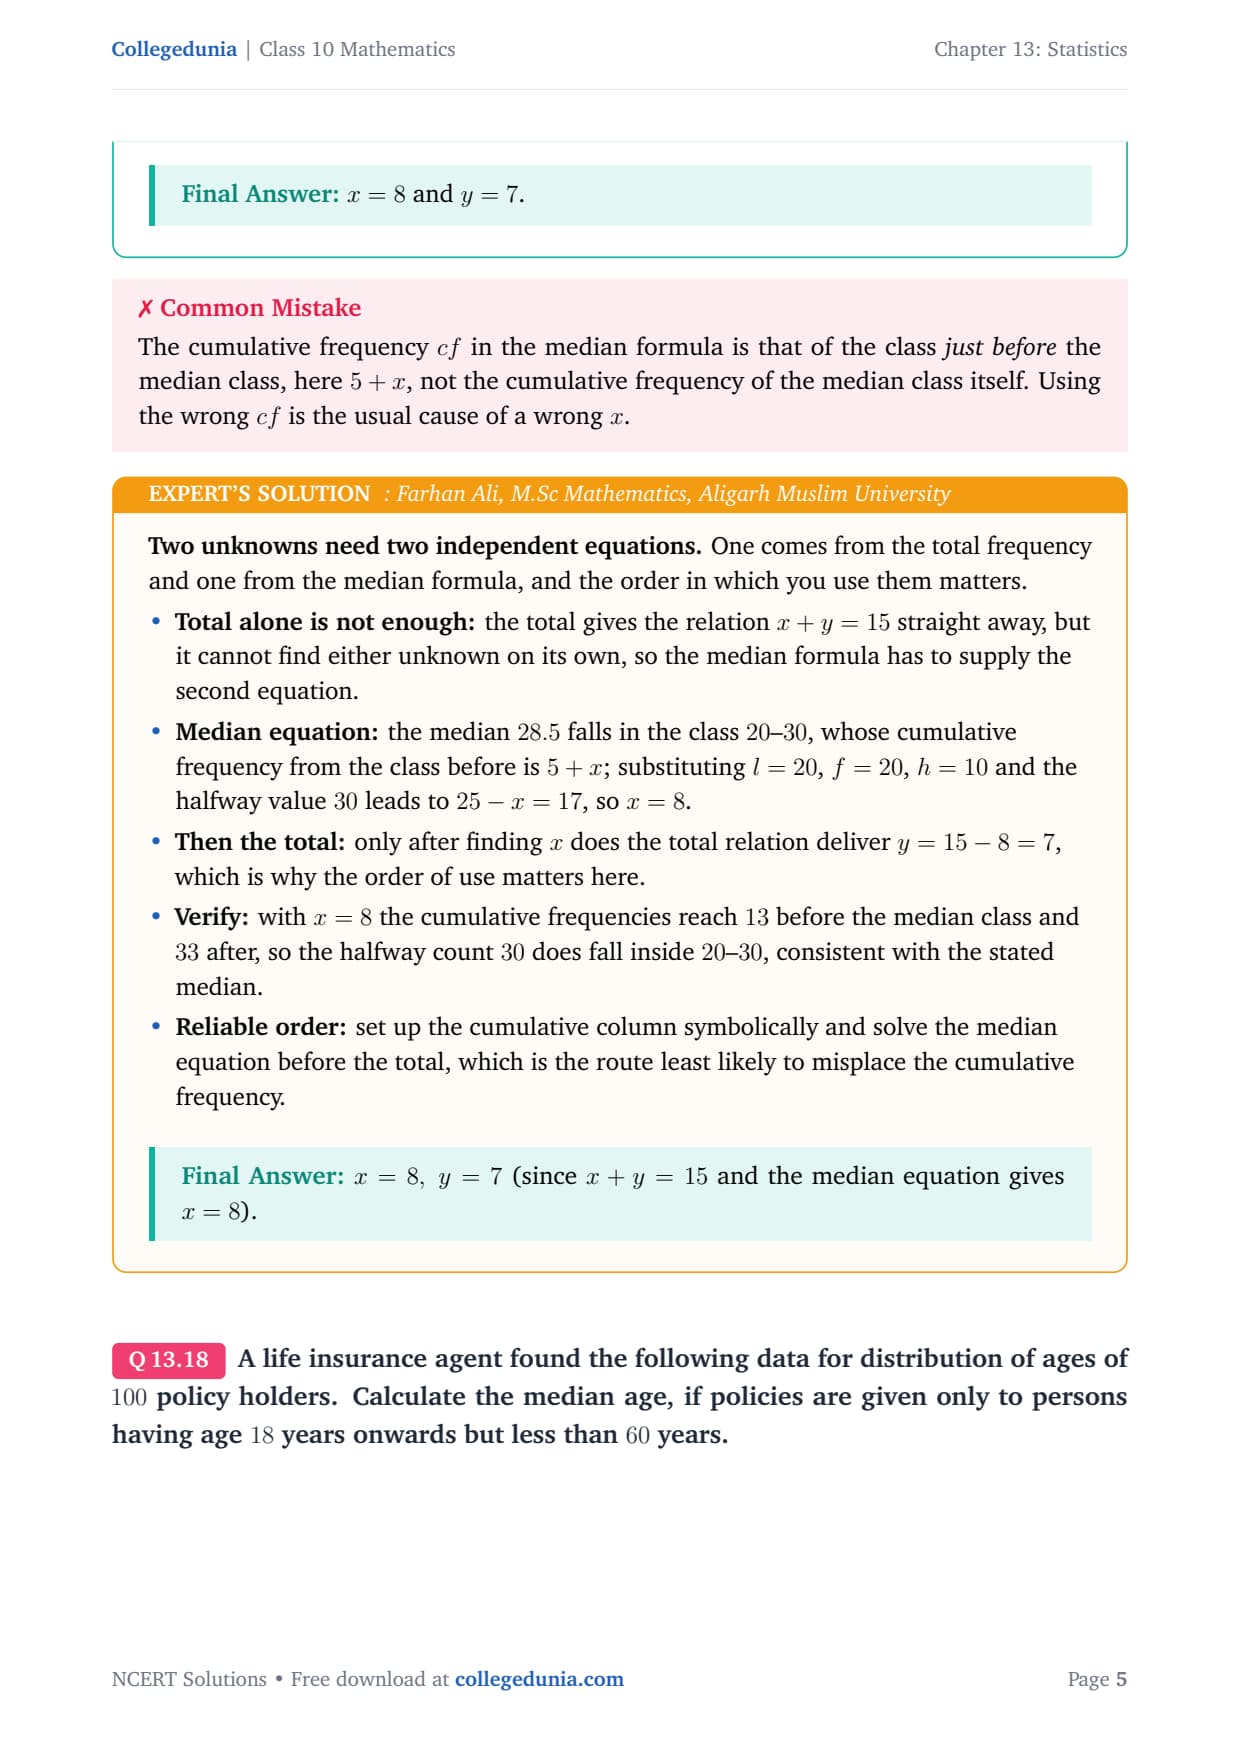
x=8 and y=7.
FA
Farhan Ali
M.Sc Mathematics, Aligarh Muslim University
Verified Expert
Two unknowns need two independent equations. One comes from the
total frequency and one from the median formula, and the order in which you
use them matters.
Total alone is not enough: the total gives the relation
x+y=15 straight away, but it cannot find either unknown on its own,
so the median formula has to supply the second equation.
Median equation: the median 28.5 falls in the class
20–30, whose cumulative frequency from the class before is
5+x; substituting l=20, f=20, h=10 and the halfway value 30
leads to 25-x=17, so x=8.
Then the total: only after finding x does the total
relation deliver y=15-8=7, which is why the order of use matters
here.
Verify: with x=8 the cumulative frequencies reach 13
before the median class and 33 after, so the halfway count 30
does fall inside 20–30, consistent with the stated median.
Reliable order: set up the cumulative column symbolically
and solve the median equation before the total, which is the route
least likely to misplace the cumulative frequency.
x=8, y=7 (since x+y=15 and the median equation gives x=8).
Q 13.3
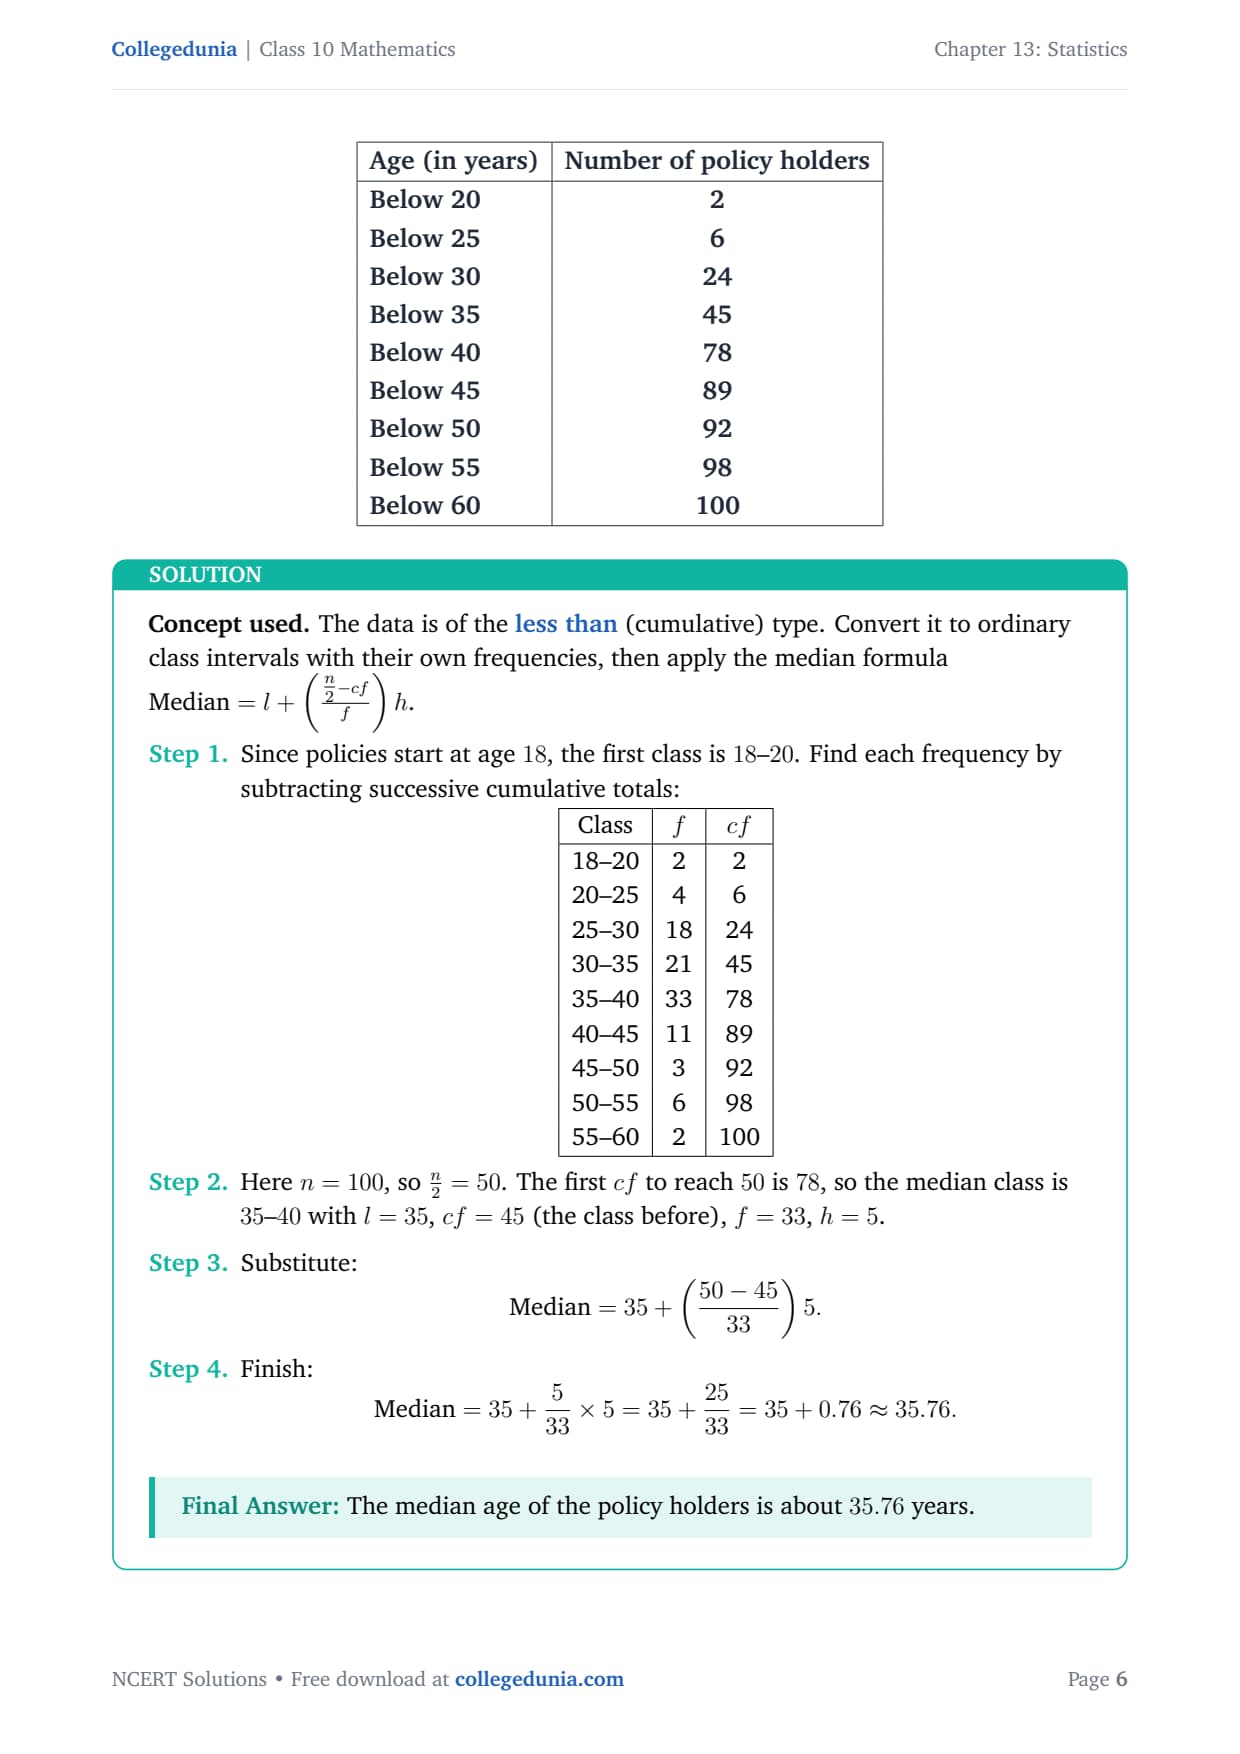
A life insurance agent found the following data for
distribution of ages of 100 policy holders. Calculate the median age,
if policies are given only to persons having age 18 years onwards but
less than 60 years.
Concept used. The data is of the less than (cumulative)
type. Convert it to ordinary class intervals with their own frequencies,
then apply the median formula
Median=l+(n2-cff)h.
Since policies start at age 18, the first class is 18–20.
Find each frequency by subtracting successive cumulative totals:
Here n=100, so n2=50. The first cf to reach 50
is 78, so the median class is 35–40 with l=35, cf=45
(the class before), f=33, h=5.
Substitute:
Median=35+(50-4533)5.
Finish:
Median=35+533× 5=35+2533=35+0.76≈ 35.76.
The median age of the policy holders is about 35.76 years.
SJ
Sunita Joshi
M.Sc Statistics, University of Pune
Verified Expert
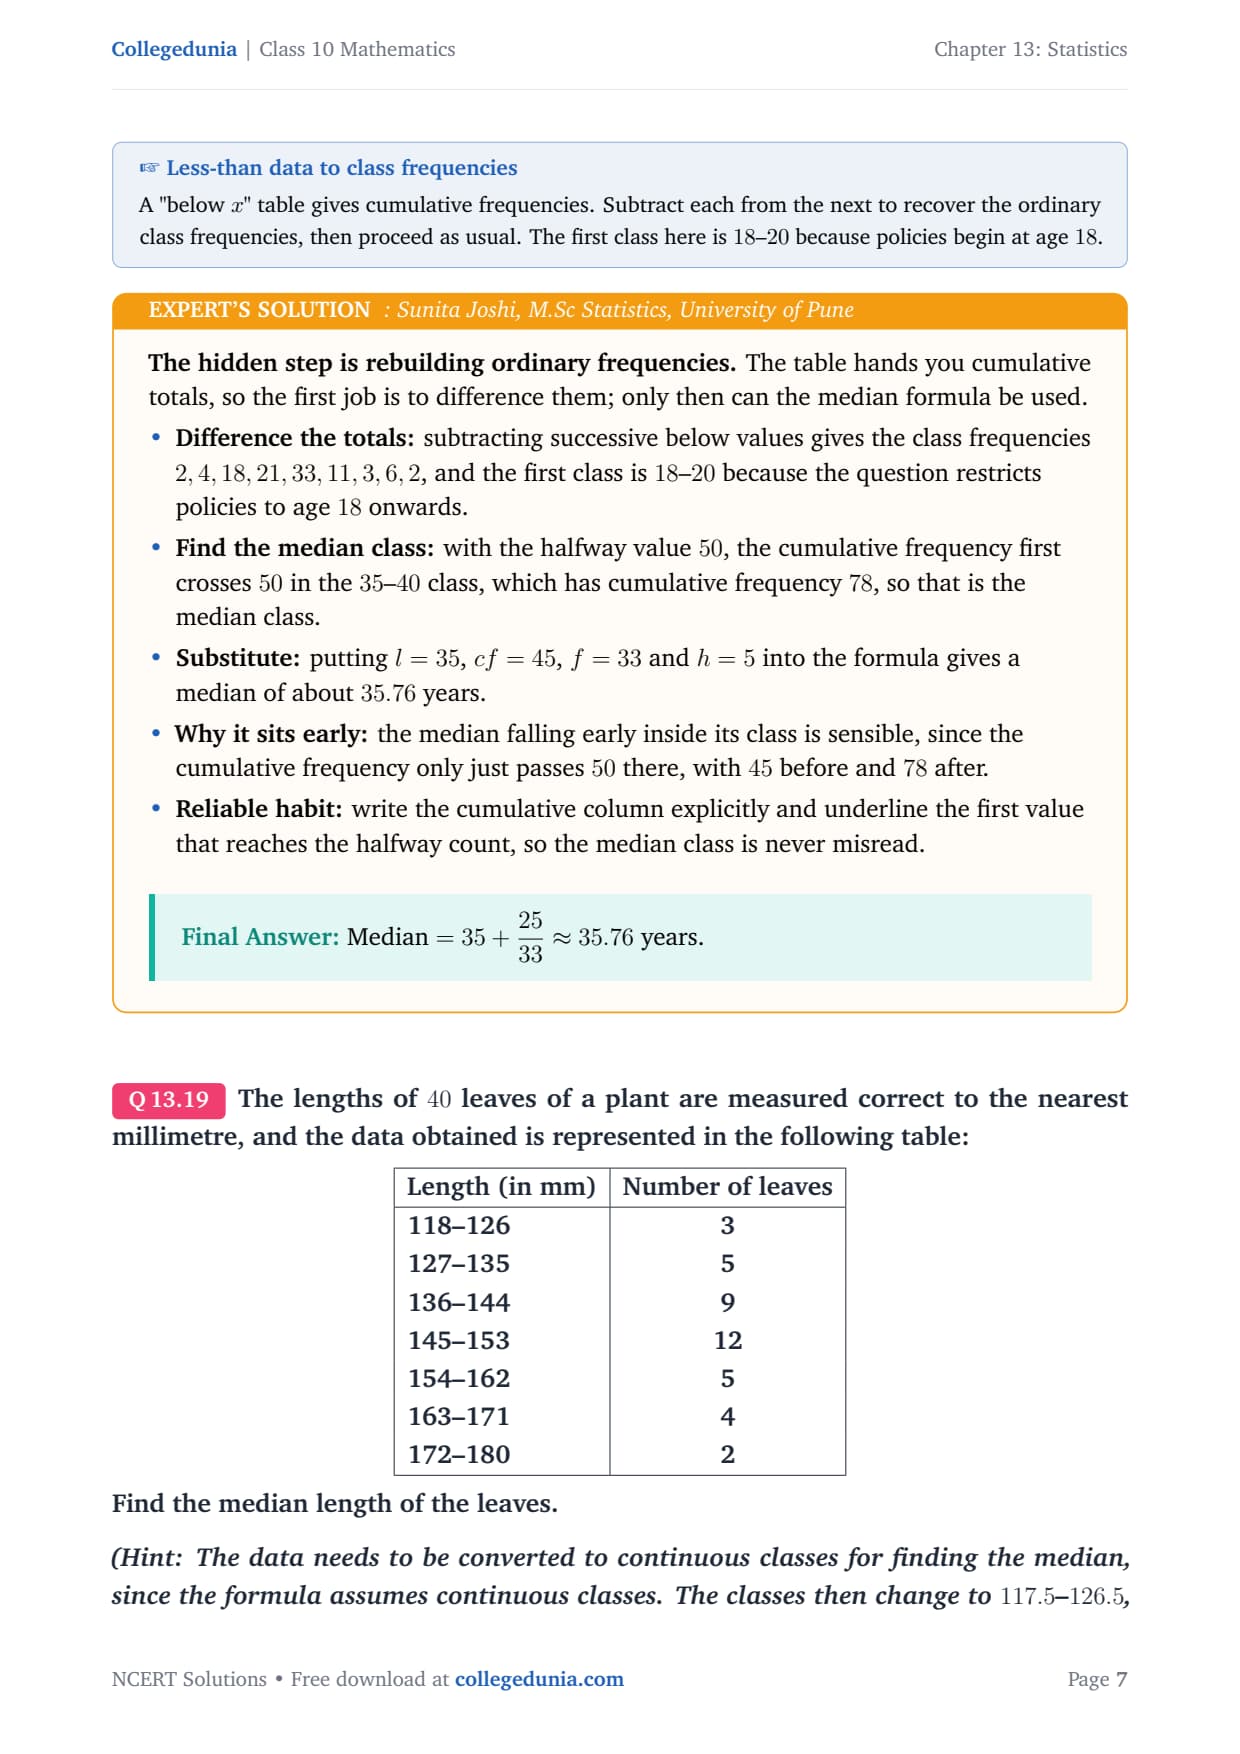
The hidden step is rebuilding ordinary frequencies. The table hands
you cumulative totals, so the first job is to difference them; only then can
the median formula be used.
Difference the totals: subtracting successive below values
gives the class frequencies 2, 4, 18, 21, 33, 11, 3, 6, 2, and the
first class is 18–20 because the question restricts policies to
age 18 onwards.
Find the median class: with the halfway value 50, the
cumulative frequency first crosses 50 in the 35–40 class,
which has cumulative frequency 78, so that is the median class.
Substitute: putting l=35, cf=45, f=33 and h=5 into
the formula gives a median of about 35.76 years.
Why it sits early: the median falling early inside its class
is sensible, since the cumulative frequency only just passes 50
there, with 45 before and 78 after.
Reliable habit: write the cumulative column explicitly and
underline the first value that reaches the halfway count, so the
median class is never misread.
Median=35+2533≈ 35.76 years.
Q 13.4
The lengths of 40 leaves of a plant are measured correct to
the nearest millimetre, and the data obtained is represented in the
following table:
tabular|l|c|
Length (in mm) & Number of leaves
118–126 & 3
127–135 & 5
136–144 & 9
145–153 & 12
154–162 & 5
163–171 & 4
172–180 & 2
tabular
Find the median length of the leaves.
(Hint: The data needs to be converted to continuous classes for
finding the median, since the formula assumes continuous classes. The
classes then change to 117.5–126.5, 126.5–135.5, ,
171.5–180.5.)
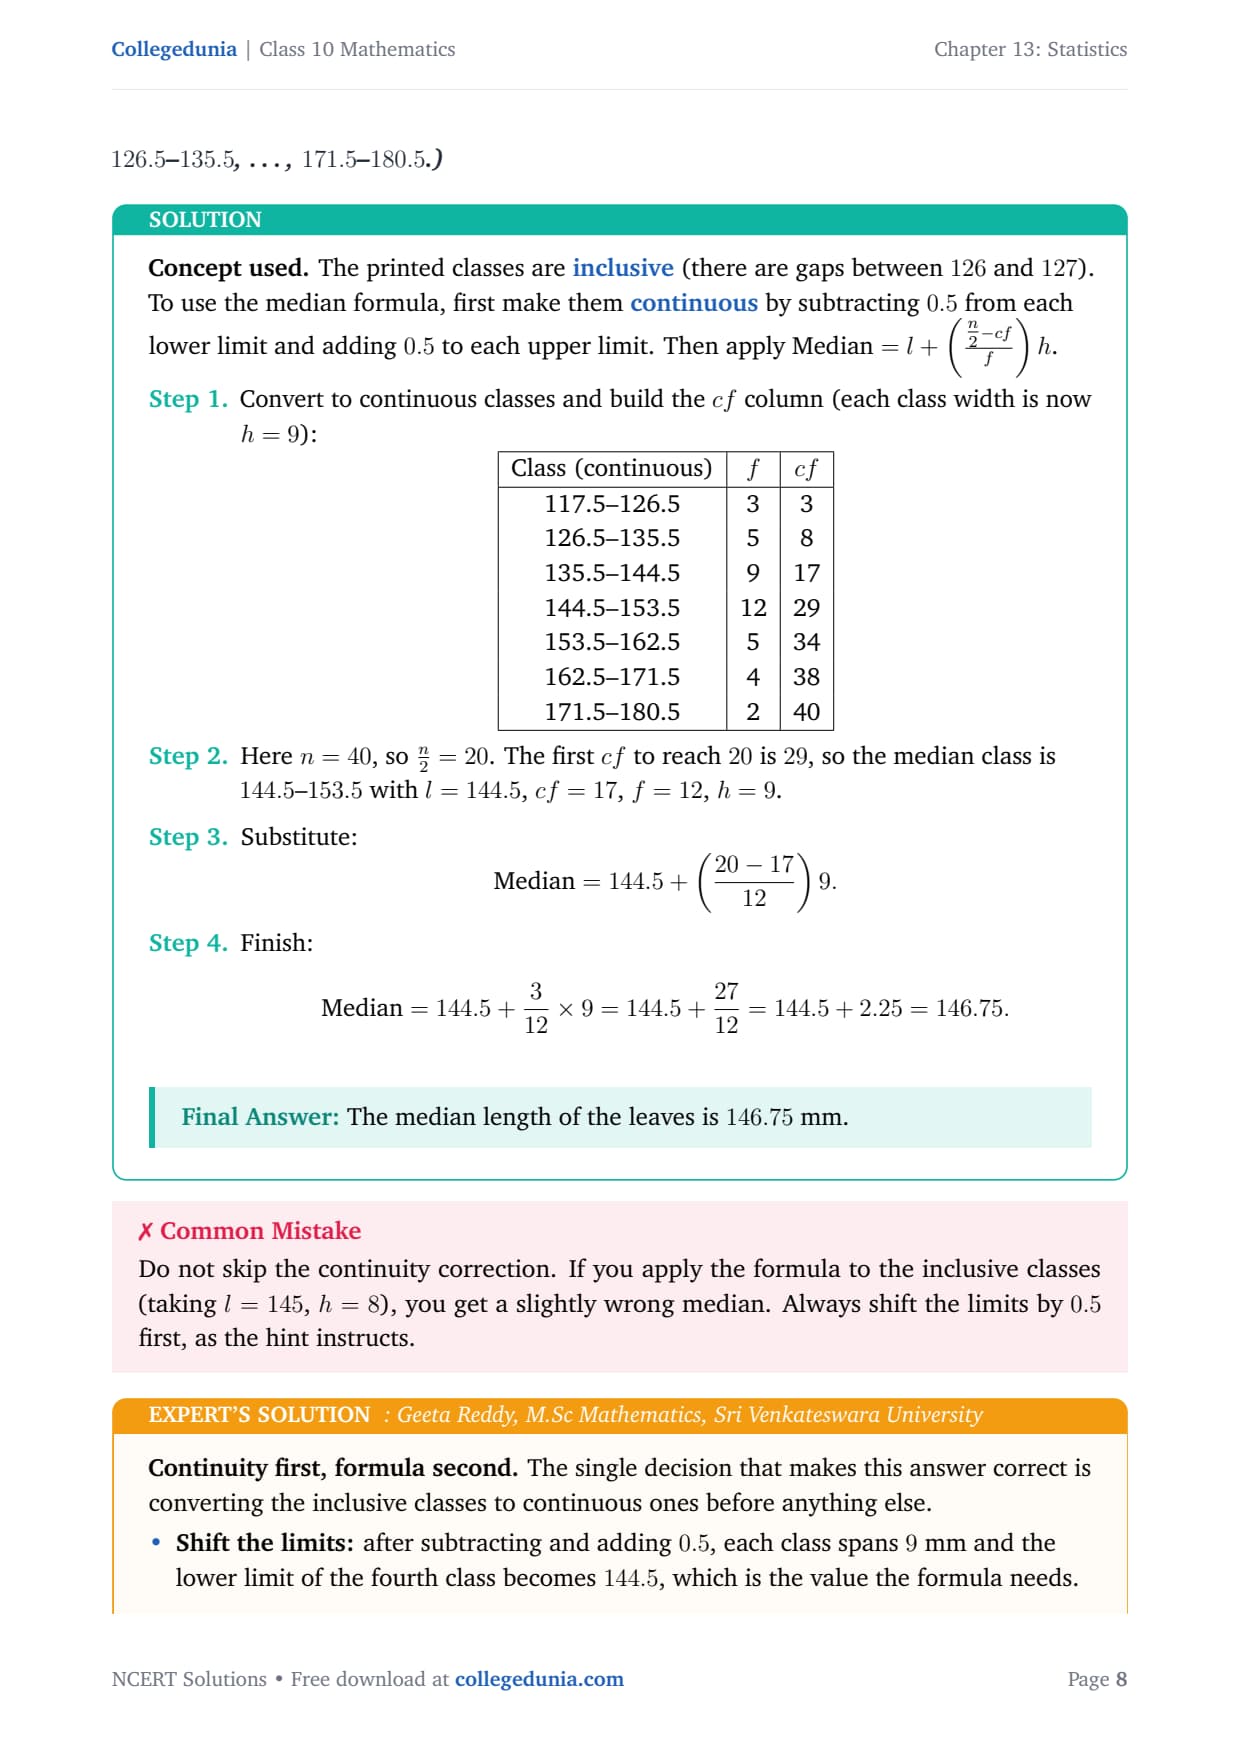
Concept used. The printed classes are inclusive
(there are gaps between 126 and 127). To use the median formula,
first make them continuous by subtracting 0.5 from each lower
limit and adding 0.5 to each upper limit. Then apply
Median=l+(n2-cff)h.
Convert to continuous classes and build the cf column (each
class width is now h=9):
Continuity first, formula second. The single decision that makes
this answer correct is converting the inclusive classes to continuous ones
before anything else.
Shift the limits: after subtracting and adding 0.5, each
class spans 9 mm and the lower limit of the fourth class becomes
144.5, which is the value the formula needs.
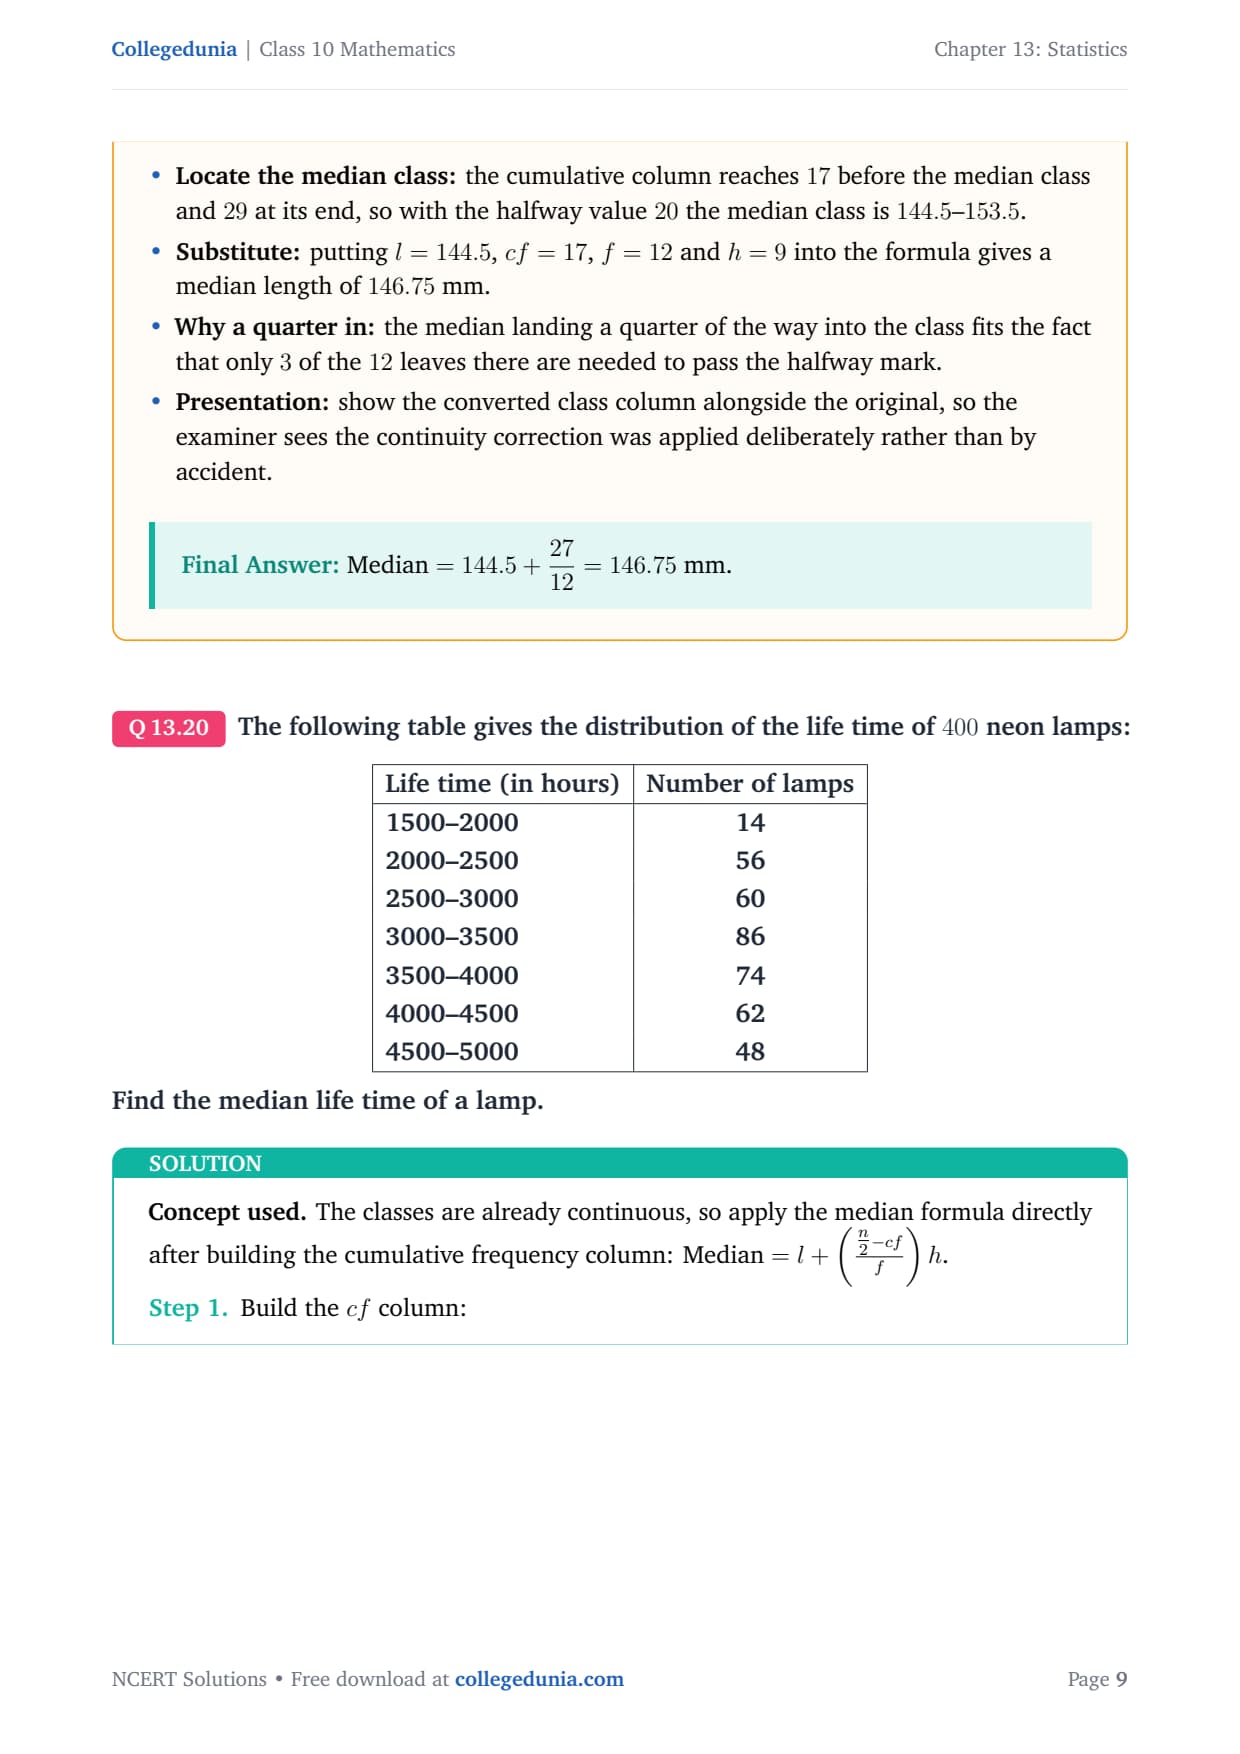
Locate the median class: the cumulative column reaches 17
before the median class and 29 at its end, so with the halfway
value 20 the median class is 144.5–153.5.
Substitute: putting l=144.5, cf=17, f=12 and h=9
into the formula gives a median length of 146.75 mm.
Why a quarter in: the median landing a quarter of the way
into the class fits the fact that only 3 of the 12 leaves there
are needed to pass the halfway mark.
Presentation: show the converted class column alongside the
original, so the examiner sees the continuity correction was applied
deliberately rather than by accident.
Median=144.5+2712=146.75 mm.
Q 13.5
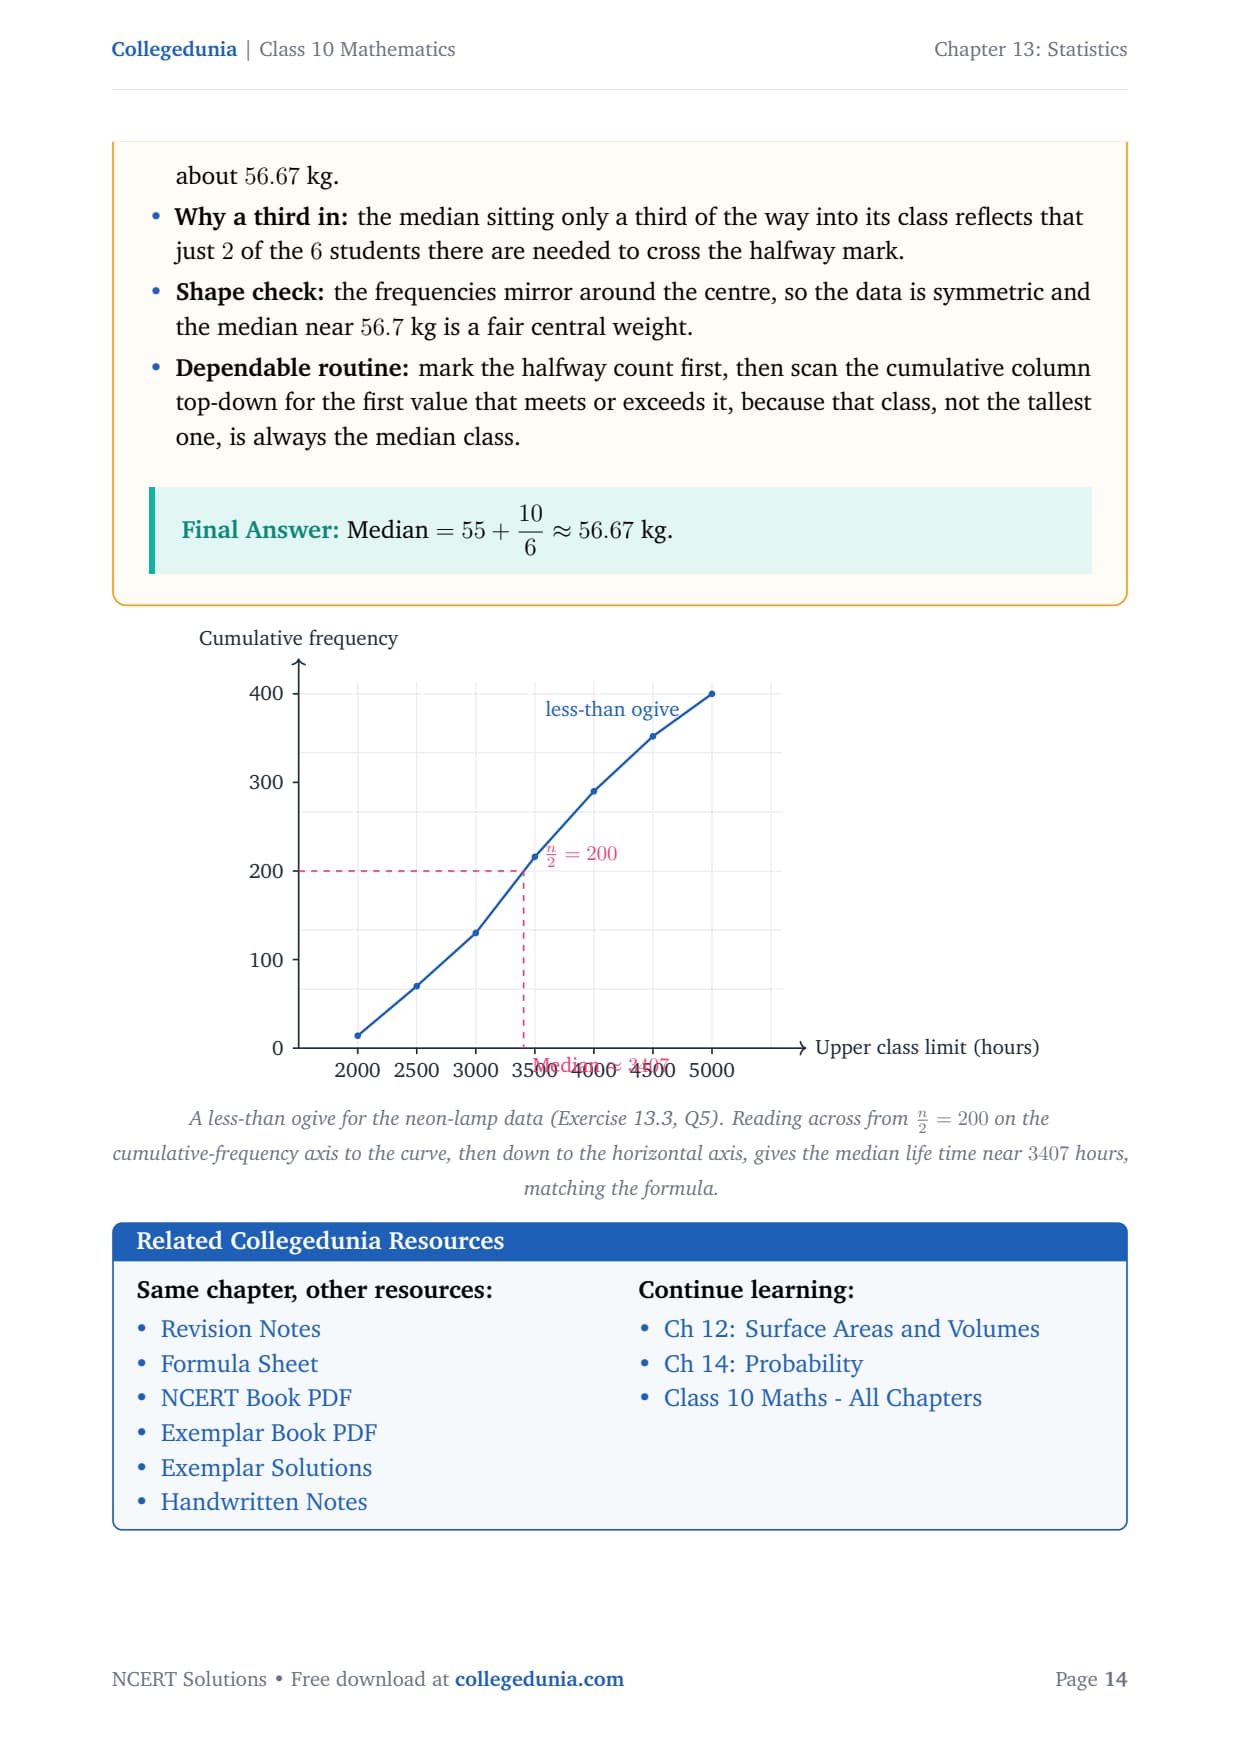
The following table gives the distribution of the life time of
400 neon lamps:
tabular|l|c|
Life time (in hours) & Number of lamps
1500–2000 & 14
2000–2500 & 56
2500–3000 & 60
3000–3500 & 86
3500–4000 & 74
4000–4500 & 62
4500–5000 & 48
tabular
Find the median life time of a lamp.
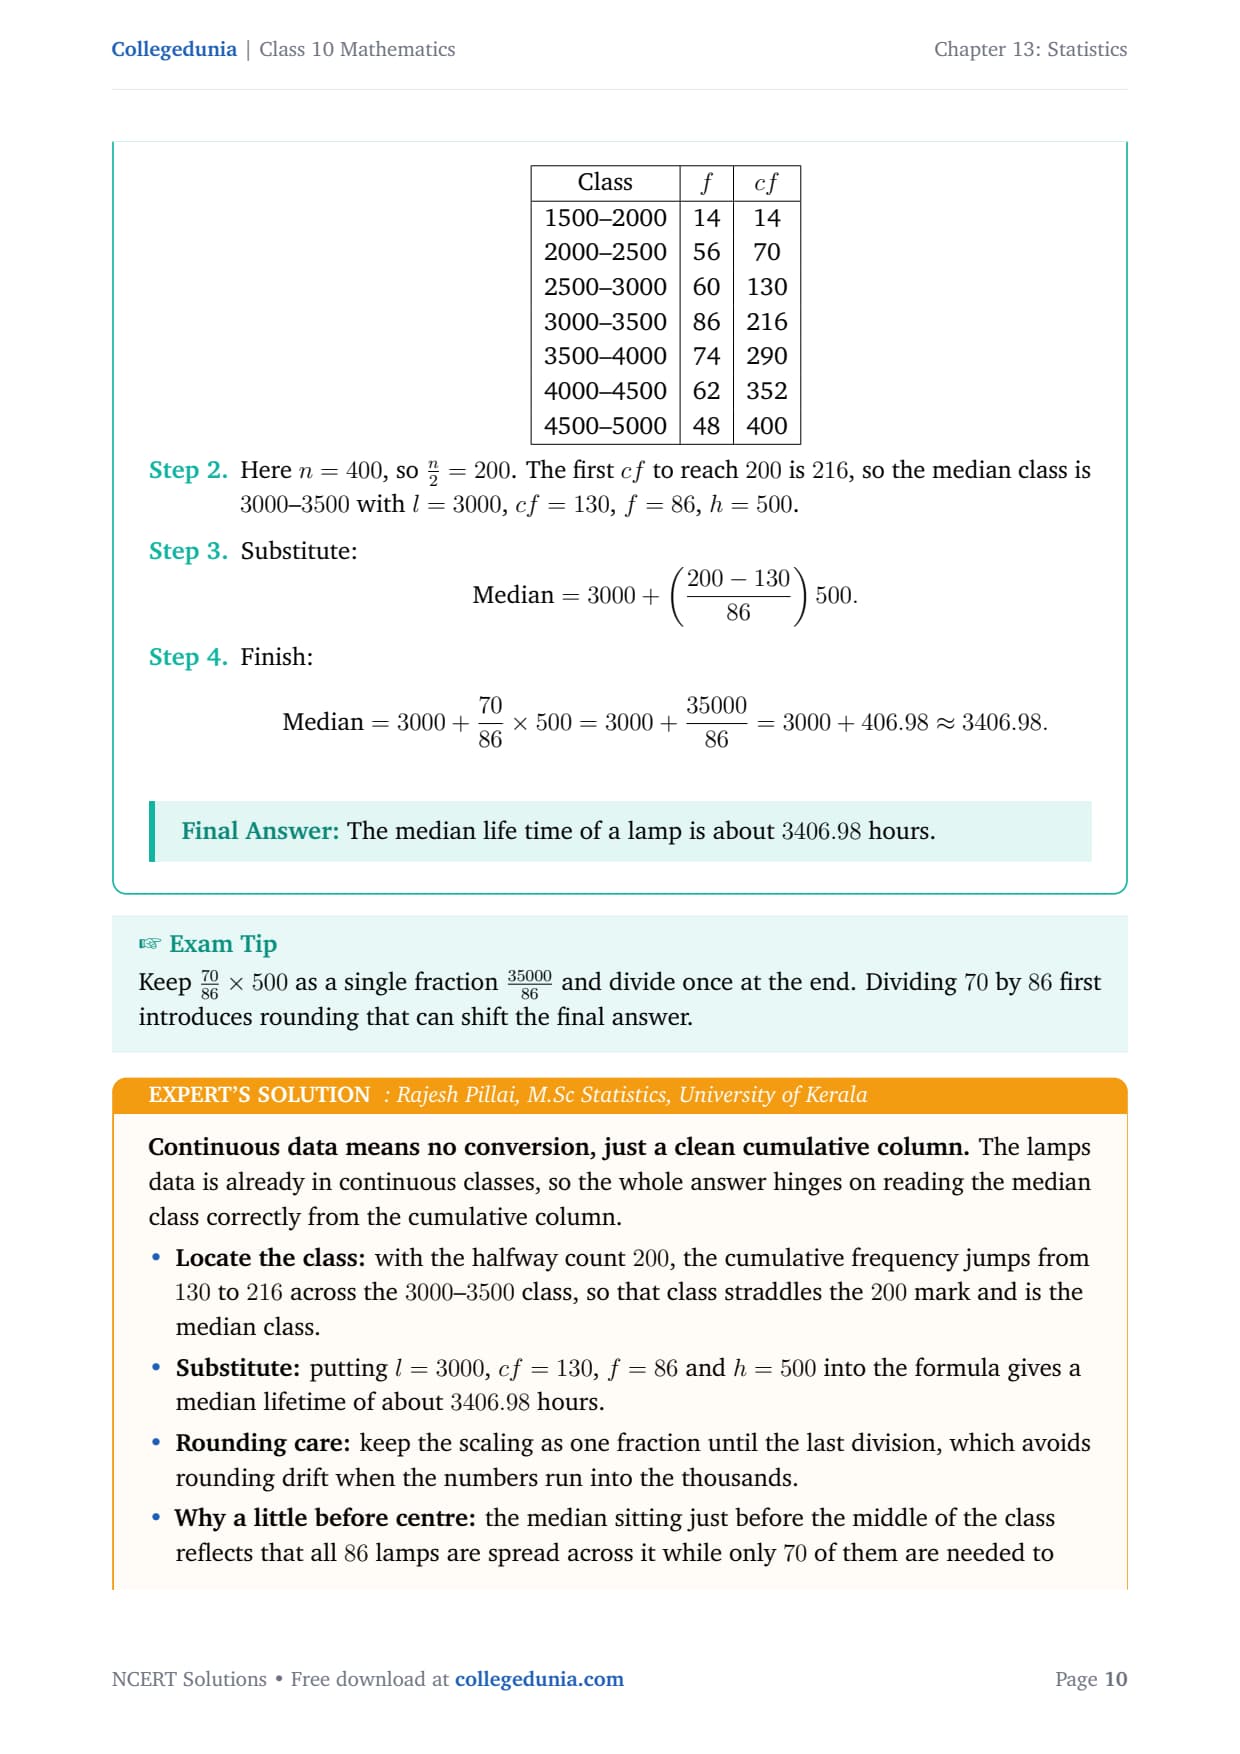
Concept used. The classes are already continuous, so apply the
median formula directly after building the cumulative frequency column:
Median=l+(n2-cff)h.
The median life time of a lamp is about 3406.98 hours.
RP
Rajesh Pillai
M.Sc Statistics, University of Kerala
Verified Expert
Continuous data means no conversion, just a clean cumulative
column. The lamps data is already in continuous classes, so the whole
answer hinges on reading the median class correctly from the cumulative
column.
Locate the class: with the halfway count 200, the
cumulative frequency jumps from 130 to 216 across the
3000–3500 class, so that class straddles the 200 mark and is
the median class.
Substitute: putting l=3000, cf=130, f=86 and h=500
into the formula gives a median lifetime of about 3406.98 hours.
Rounding care: keep the scaling as one fraction until the
last division, which avoids rounding drift when the numbers run into
the thousands.
Why a little before centre: the median sitting just before
the middle of the class reflects that all 86 lamps are spread
across it while only 70 of them are needed to cross the halfway
point.
Reliable habit: underline the first cumulative value that
reaches the halfway count, which keeps the median class unambiguous.
Median=3000+3500086≈ 3406.98 hours.
Q 13.6
100 surnames were randomly picked up from a local telephone
directory and the frequency distribution of the number of letters in the
English alphabets in the surnames was obtained as follows:
tabular|l|c|c|c|c|c|c|
Number of letters & 1–4 & 4–7 & 7–10 & 10–13 & 13–16 & 16–19
Number of surnames & 6 & 30 & 40 & 16 & 4 & 4
tabular
Determine the median number of letters in the surnames. Find the mean
number of letters in the surnames? Also, find the modal size of the
surnames.
Concept used. This question asks for all three measures. Use the
median formula on the cumulative frequency column, the
mode formula on the modal class, and the mean by the
step deviation method (equal width h=3).
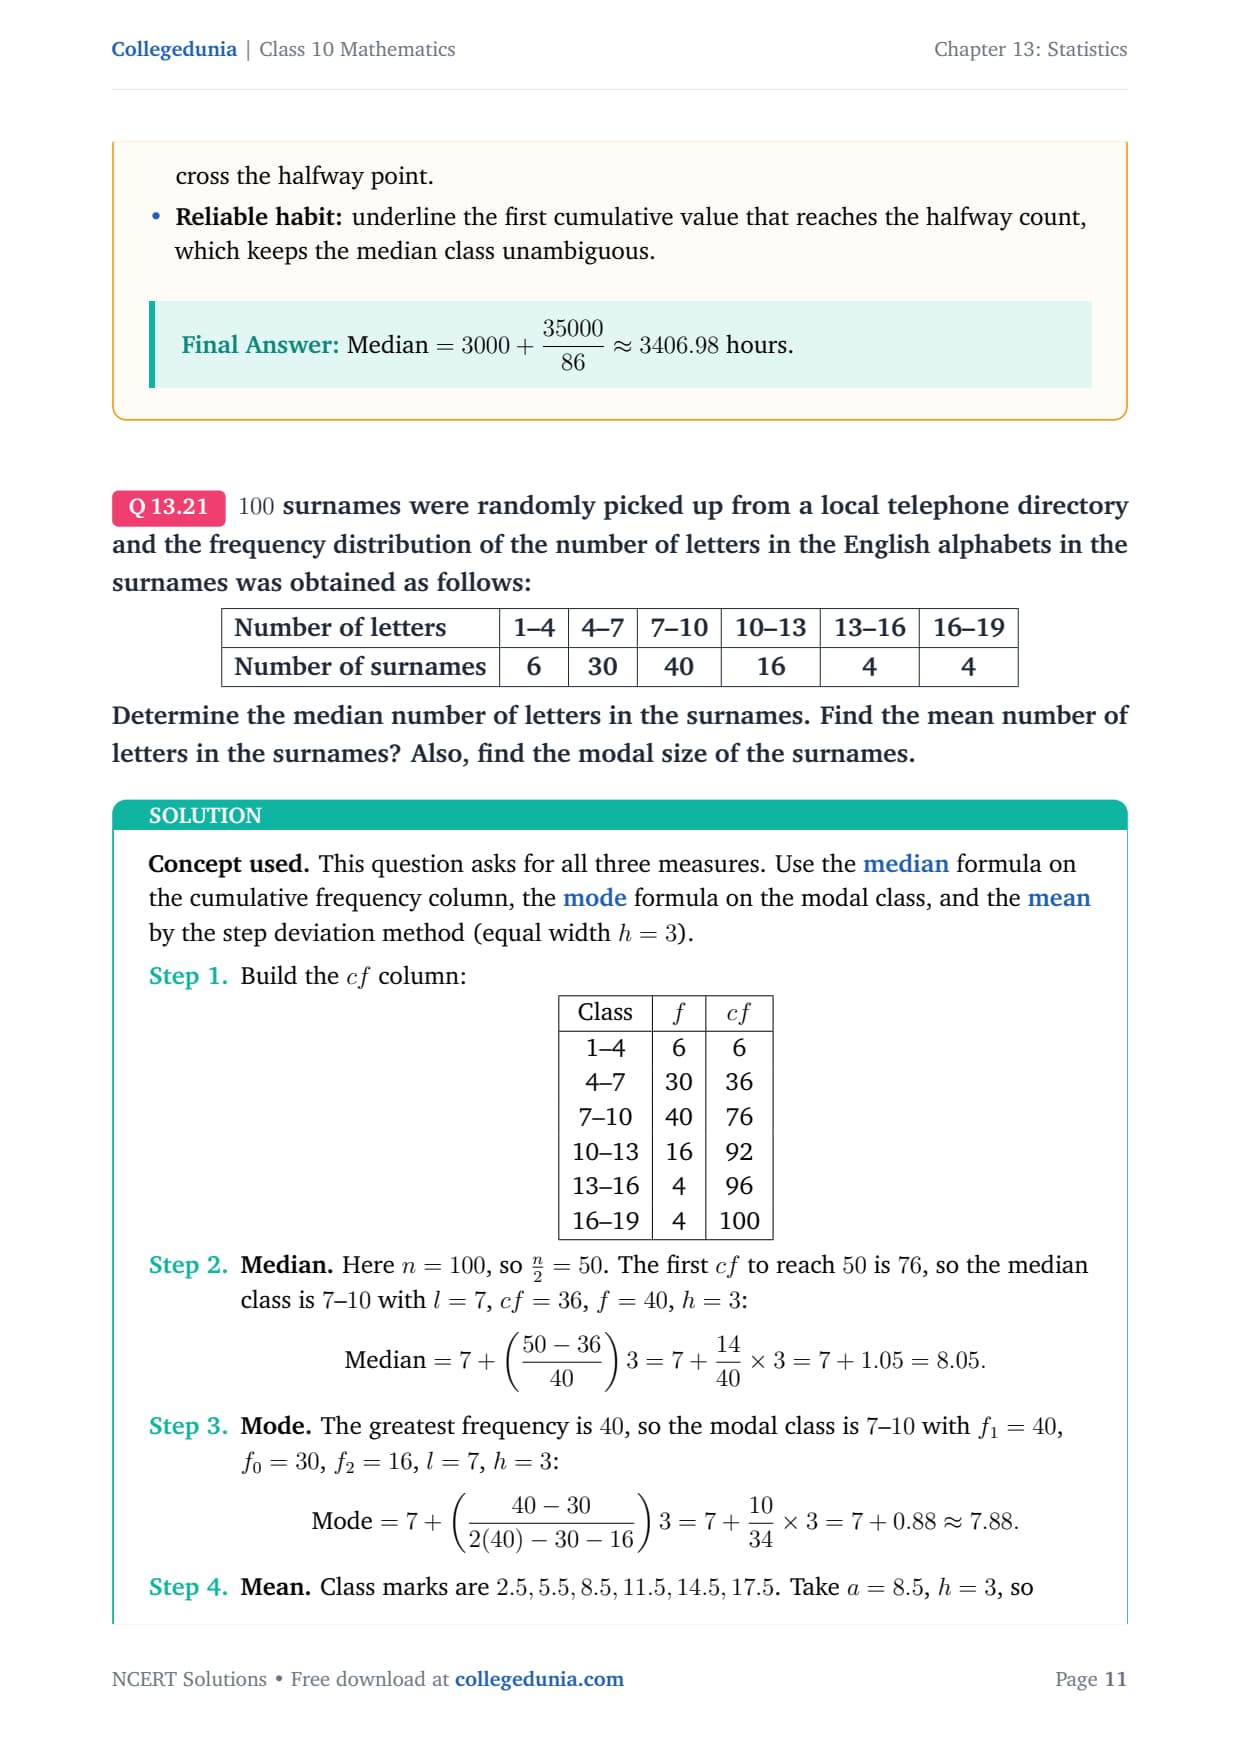
Median. Here n=100, so n2=50. The first
cf to reach 50 is 76, so the median class is 7–10 with
l=7, cf=36, f=40, h=3:
Median=7+(50-3640)3=7+1440× 3=7+1.05=8.05.
Mode. The greatest frequency is 40, so the modal class
is 7–10 with f1=40, f0=30, f2=16, l=7, h=3:
Mode=7+(40-302(40)-30-16)3=7+1034× 3=7+0.88≈ 7.88.
Mean. Class marks are 2.5,5.5,8.5,11.5,14.5,17.5. Take
a=8.5, h=3, so ui=-2,-1,0,1,2,3 and
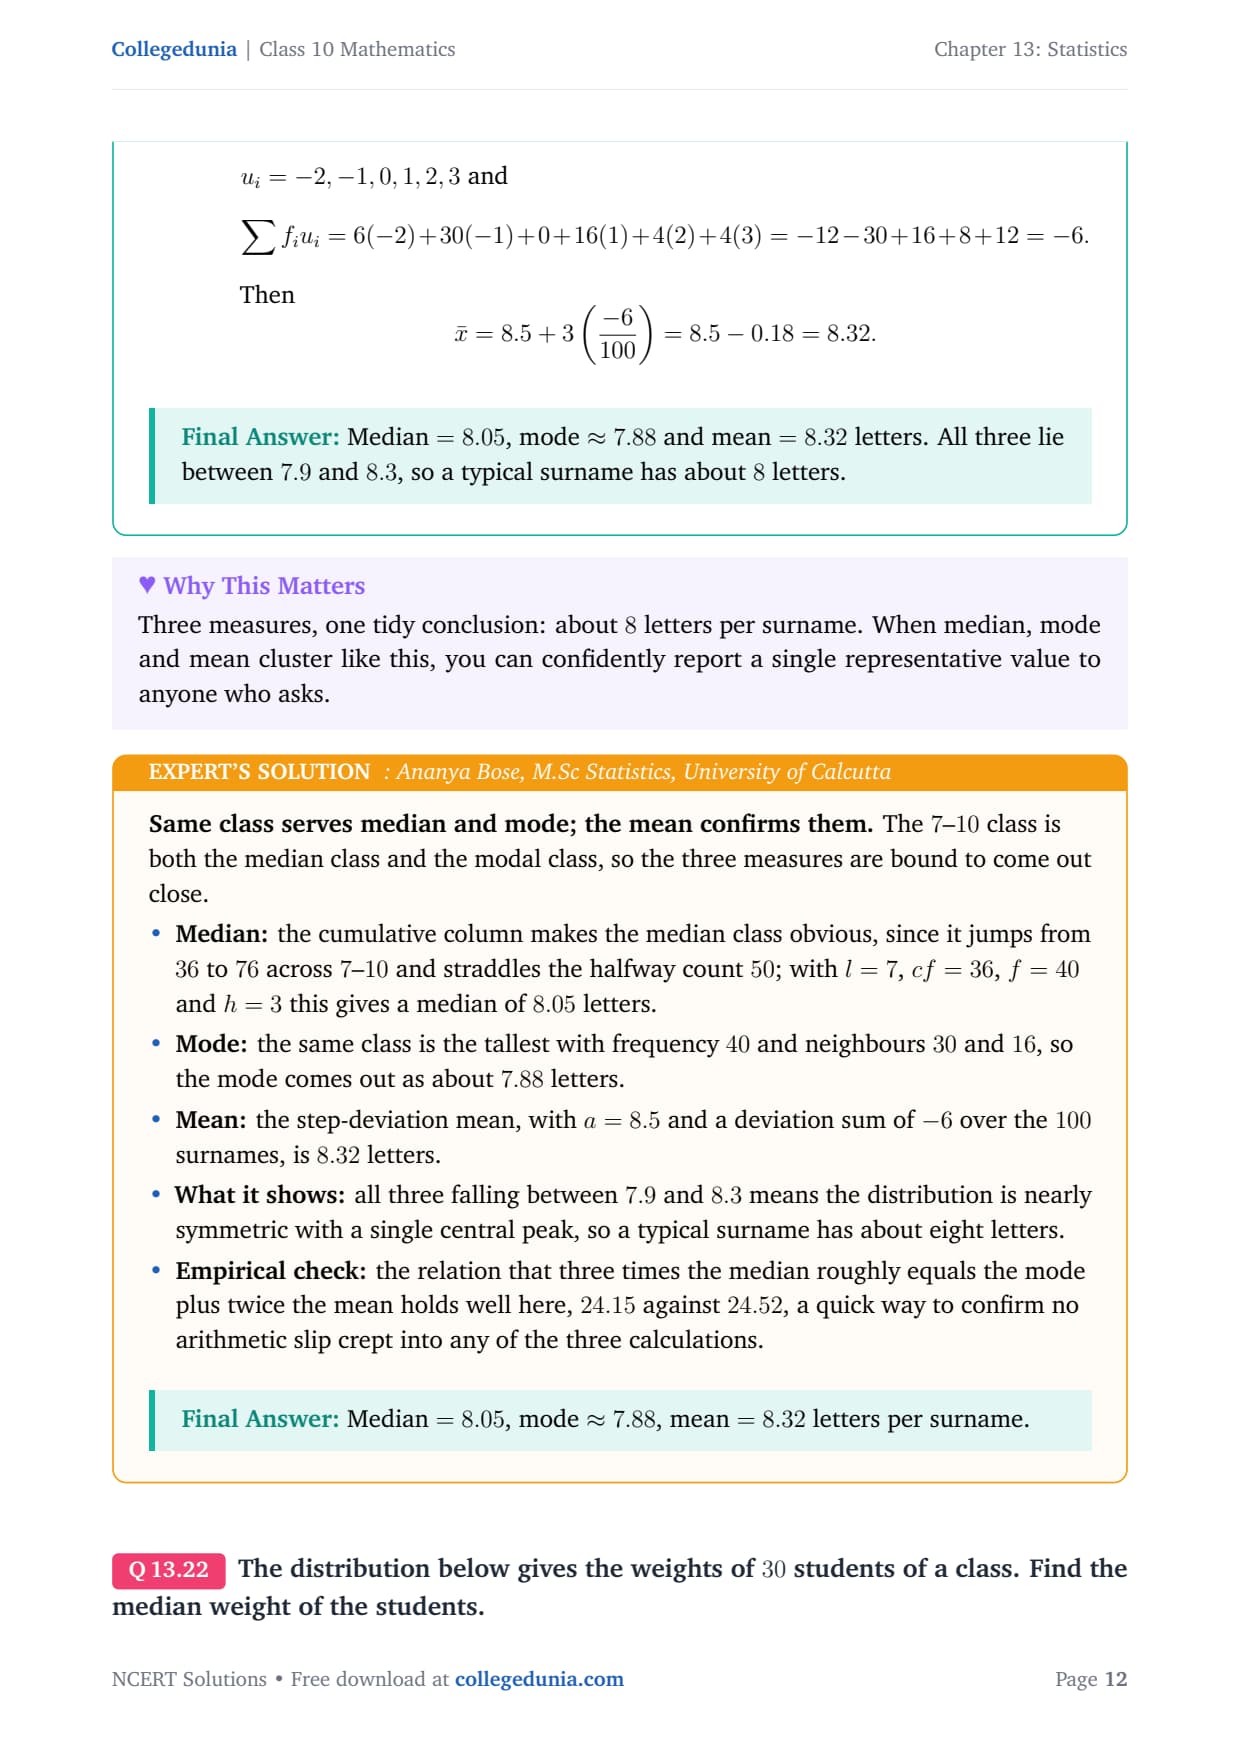
∑ fi ui = 6(-2)+30(-1)+0+16(1)+4(2)+4(3)=-12-30+16+8+12=-6.
Then
x̄=8.5+3(-6100)=8.5-0.18=8.32.
Median =8.05, mode ≈ 7.88 and mean =8.32 letters. All three lie between 7.9 and 8.3, so a typical surname has about 8 letters.
AB
Ananya Bose
M.Sc Statistics, University of Calcutta
Verified Expert
Same class serves median and mode; the mean confirms them. The
7–10 class is both the median class and the modal class, so the three
measures are bound to come out close.
Median: the cumulative column makes the median class
obvious, since it jumps from 36 to 76 across 7–10 and
straddles the halfway count 50; with l=7, cf=36, f=40 and
h=3 this gives a median of 8.05 letters.
Mode: the same class is the tallest with frequency 40 and
neighbours 30 and 16, so the mode comes out as about 7.88
letters.
Mean: the step-deviation mean, with a=8.5 and a deviation
sum of -6 over the 100 surnames, is 8.32 letters.
What it shows: all three falling between 7.9 and 8.3
means the distribution is nearly symmetric with a single central
peak, so a typical surname has about eight letters.
Empirical check: the relation that three times the median
roughly equals the mode plus twice the mean holds well here, 24.15
against 24.52, a quick way to confirm no arithmetic slip crept into
any of the three calculations.
Median =8.05, mode ≈ 7.88, mean =8.32 letters per surname.
Q 13.7
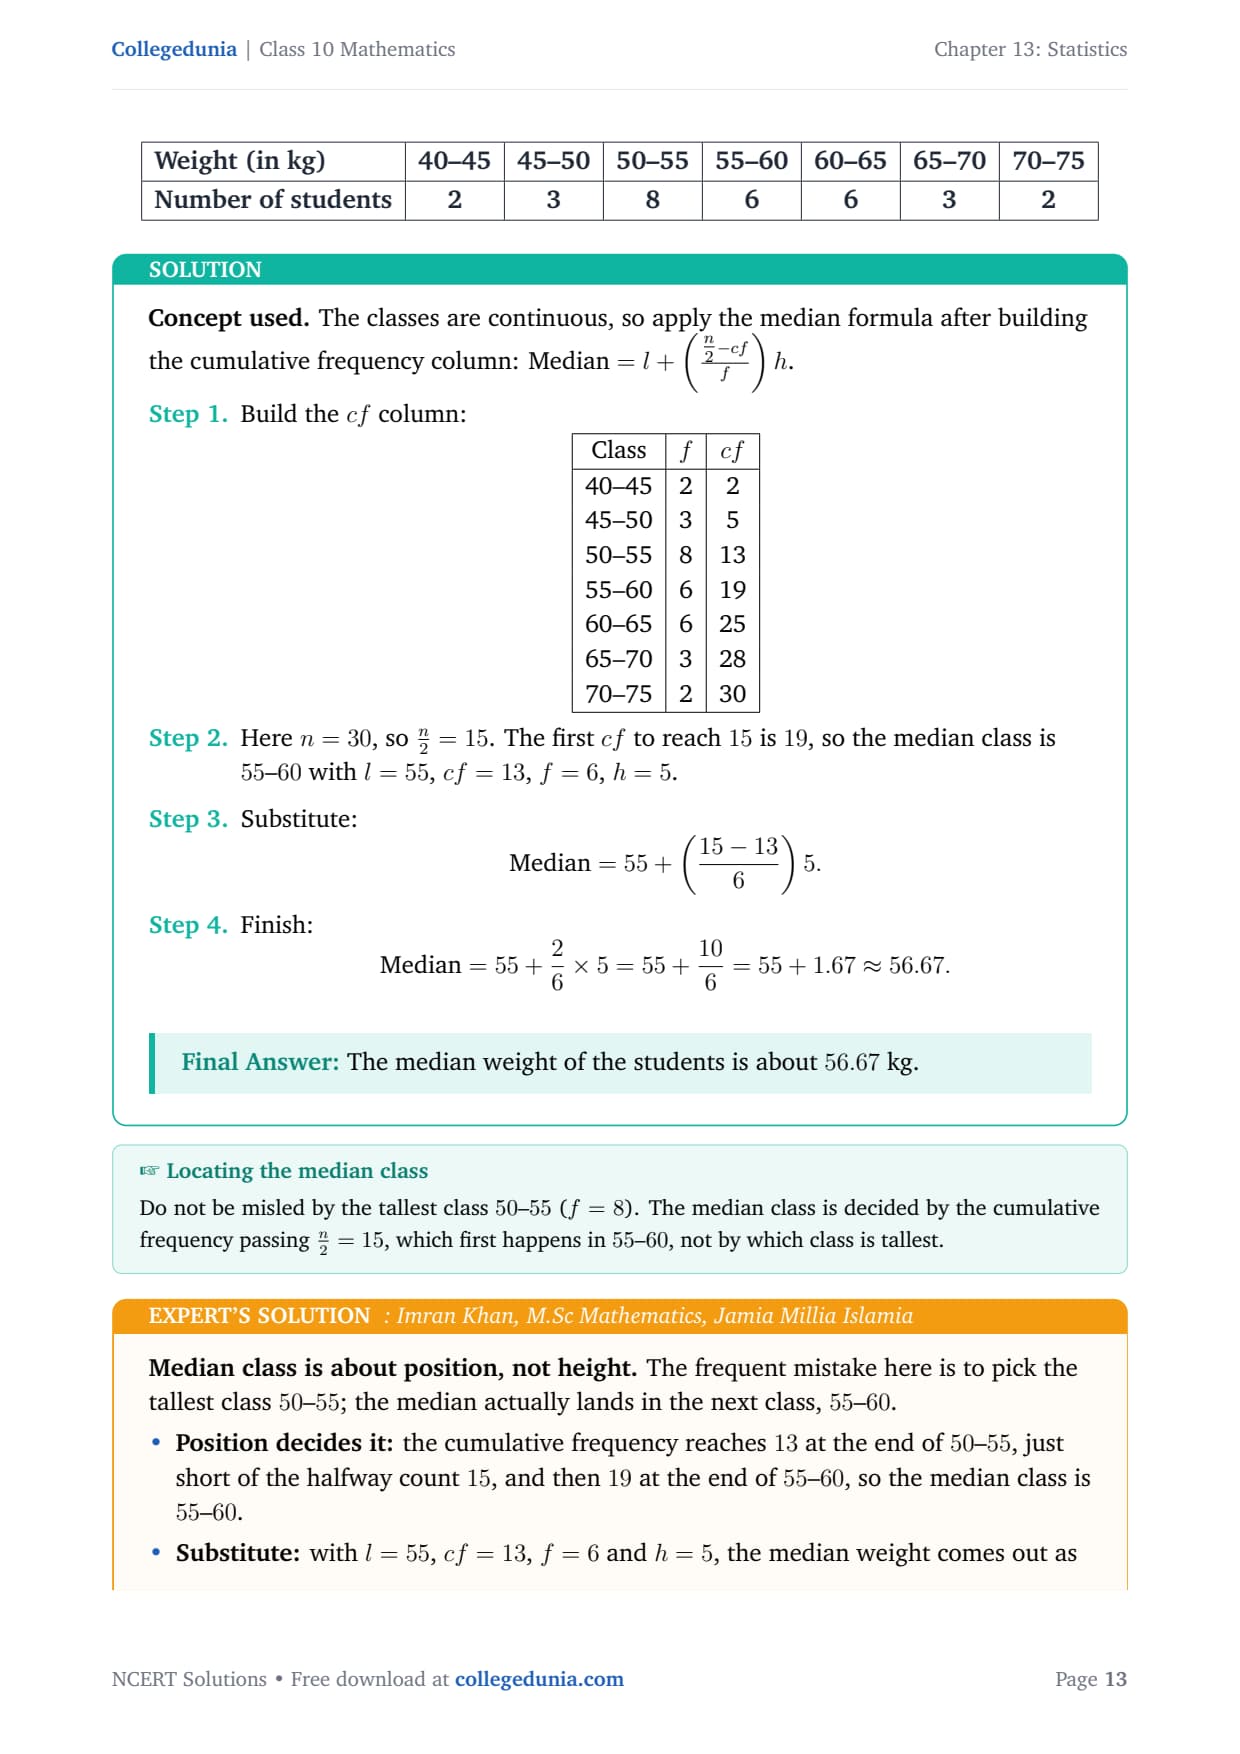
The distribution below gives the weights of 30 students of a
class. Find the median weight of the students.
tabular|l|c|c|c|c|c|c|c|
Weight (in kg) & 40–45 & 45–50 & 50–55 & 55–60 & 60–65 & 65–70 & 70–75
Number of students & 2 & 3 & 8 & 6 & 6 & 3 & 2
tabular
Concept used. The classes are continuous, so apply the median
formula after building the cumulative frequency column:
Median=l+(n2-cff)h.
Here n=30, so n2=15. The first cf to reach 15 is
19, so the median class is 55–60 with l=55, cf=13,
f=6, h=5.
Substitute:
Median=55+(15-136)5.
Finish:
Median=55+26× 5=55+106=55+1.67≈ 56.67.
The median weight of the students is about 56.67 kg.
IK
Imran Khan
M.Sc Mathematics, Jamia Millia Islamia
Verified Expert
Median class is about position, not height. The frequent mistake
here is to pick the tallest class 50–55; the median actually lands in
the next class, 55–60.
Position decides it: the cumulative frequency reaches 13
at the end of 50–55, just short of the halfway count 15, and
then 19 at the end of 55–60, so the median class is 55–60.
Substitute: with l=55, cf=13, f=6 and h=5, the
median weight comes out as about 56.67 kg.
Why a third in: the median sitting only a third of the way
into its class reflects that just 2 of the 6 students there are
needed to cross the halfway mark.
Shape check: the frequencies mirror around the centre, so
the data is symmetric and the median near 56.7 kg is a fair central
weight.
Dependable routine: mark the halfway count first, then scan
the cumulative column top-down for the first value that meets or
exceeds it, because that class, not the tallest one, is always the
median class.
Median=55+106≈ 56.67 kg.
Other Resources for Class 10 Maths Chapter 13 Statistics
Pair this with the other Class 10 Maths resources for this chapter, all linked below.
71% of Class 10 students said Exercise 13.3 was harder than 13.1 and 13.2 because you have to build the cumulative frequency table from scratch before applying the formula. 3 out of 5 students who lost marks in the board exam on median questions picked the wrong class as the median class.
Students who wrote out the full cumulative frequency column and circled the first value that crossed n2 made far fewer errors. The average board question on median of grouped data is worth 3 to 4 marks, so getting the median class right is the single most important step.
Source: 2026-27 Class 10 Mathematics student poll. Sample of 6,200 students from CBSE schools across 10 states, conducted before the 2026 boards.
Frequently Asked Questions about Exercise 13.3 Statistics Class 10
What is the median formula for grouped data used in Exercise 13.3?
The median formula is: Median = l + ((n/2 - cf) / f) x h, where l is the lower boundary of the median class, n is the total number of observations, cf is the cumulative frequency of the class before the median class, f is the frequency of the median class, and h is the class width. This formula is used in all 7 questions of Exercise 13.3.
How do you find the median class in Exercise 13.3?
First, calculate n/2 (half the total frequency). Then build the cumulative frequency column from top to bottom. The median class is the first class whose cumulative frequency reaches or exceeds n/2. For example, in Question 1 with n = 68, you look for the first cf that reaches 34, which is 42 in the class 125-145, so 125-145 is the median class.
Why do you convert inclusive classes to continuous classes in Question 4 of Exercise 13.3?
The median formula assumes that class intervals are continuous (no gaps). In Question 4, the classes 118-126, 127-135, etc. have gaps between them (nothing between 126 and 127). To remove these gaps, you subtract 0.5 from each lower limit and add 0.5 to each upper limit, making them 117.5-126.5, 126.5-135.5, and so on. If you use the original class limits, you get a slightly wrong median.
What is a "less than" type frequency table and how do you handle it in Question 3?
A "less than" or "below x" table gives cumulative totals, not actual class frequencies. For example, "Below 25: 6" means 6 policy holders are under 25, not exactly 6 in the 20-25 class. To use the median formula, first subtract each entry from the next to recover the actual class frequencies. So Below 25 minus Below 20 gives 6 - 2 = 4 policy holders in the 20-25 class.
How many marks does the median of grouped data carry in the CBSE Class 10 board exam?
Median of grouped data questions in the CBSE Class 10 Mathematics board exam typically carry 3 to 4 marks. A standard question asks you to find the median, which requires the complete cumulative frequency table, identification of the median class, and substitution into the formula. Some questions combine median with mean and mode and can carry 5 marks. This topic appears in the Statistics unit, which carries about 11 marks in the board exam.






Comments