



Education Journalist | Study Abroad Lead
Bivariate Analysis is a type of statistical analysis where two variables can be observed. In this analysis, one variable is dependent and the other is independent. These two variables are mostly denoted by X and Y. So, in the bivariate analysis, we analyse what are the changes that occurred between these two variables and to what level. The bivariate analysis can also be denoted as pair (X, Y). There are other two types than bivariate analysis in statistical analysis, one is Multivariate and another is Univariate analysis. Multivariate analysis is used for multiple variables in the analysis and Univariate analysis is used for one variable. In Statistics, we interpret the given collection of data, depicted in a tabular form, make statements and make predictions on observing it.
| Table of Contents |
Key Terms: Bivariate Analysis, Scatter Plots, Regression Analysis, Correlation Coefficients, Variables, Statistical Analysis, Multivariate Analysis, Univariate Analysis
What is Bivariate Analysis?
[Click Here for Sample Questions]
In the Bivariate Analysis, we examine how two variables or attributes are related to each other. The bivariate analysis depicts the relationship between the two variables and also the discrepancies between two variables and any differences.
This type of statistical analysis can be stored in a two-column data table. For analysis of bivariate analysis, we need to recognize it. As we know the data have two variables as X and Y. The bivariate data is shown below in a tabular form:
| Observations | X-Variables | Y-Variables |
|---|---|---|
| 1 | 8 | 4 |
| 2 | 3 | 2 |
| 3 | 10 | 5 |
| 4 | 4 | 5 |
NOTE: The observations are given on the table above can be independent of each other, but not the two measurements.
Bivariate analysis is not like taking two sample data sets for data analysis. In the two-sample data analysis, the X and Y are not directly related to each other. We can also have different numbers of data values in each sample. In the bivariate analysis, there is a Y value for each X.
For example,
Given below is the two sample data analysis
Sample 1:100,20,35,25
Sample 2:42,23,28
Bivariate Analysis
(X, Y) = (100,56), (23,84), (398,63), (56,42)
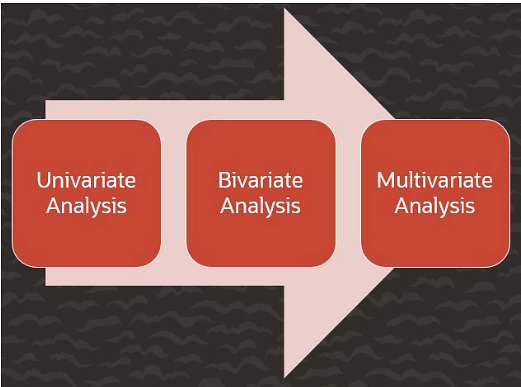
Three Types of Analysis
Read More: Variance: Derivation, Standard Deviation, Formula
Types of Bivariate Analysis
[Click Here for Sample Questions]
The types of bivariate analysis depend upon the types of variables or attributes, we will use for analyzing. The variables can be in numerical and categorical form. Let’s take categorical, in this the variables are independent. In which take the example of pencil, then logit and probit regression can be used. If the variables are independent and dependent then the attributes used will be ordinal, which means they have a position so we will measure it in the rank correlation coefficient. If the variable is dependent ordinal, then ordered logit and ordered probity can be used. Also, if the dependent variable or attribute is either in ratio or interval, then we will measure it in regression.
From the above details, we can now denote types of bivariate analysis. Mainly there are 3 types of bivariate analysis, which are given below:
-
Scatter Plots
In this type, the data is represented using dots to show the values for two different numeric variables. In another form, it's shown as a pictorial representation of data of two different values as shown in the above figure of a graph. In a scatterplot of bivariate data, we use the horizontal or “x-axis” for the independent variable and the vertical as “y-axis” can be said as the dependent variable. Here the points are not at the same levels so we can predict that it does not have a perfect linear relationship between the two variables.

Scatter Plots
-
Regression Analysis
In this type of bivariate analysis, you can get all terms for a variety of tools that can be used to determine how your data points might be related. Regression analysis can also give you the equation for that curve or line. It can also present you with the correlation coefficient.
Read More: Linear Regression Formula
-
Correlation Coefficients
This type of analysis is different as compared to others because calculating values for correlation coefficients are usually done on computers. Basically, a zero denotes that they aren’t correlated (i.e., related in some way), while a 1(either positive or negative) means that the variables are perfectly correlated (i.e., they are perfectly in sync with each other).
Read More: Correlation Coefficient Formula
Things to Remember
- The bivariate analysis explains the relationship between the two variables and also the discrepancies between two variables and any differences.
- In bivariate analysis, one variable is dependent and the other is independent. These two variables are mostly denoted by X and Y.
- There are three types in statistical analysis namely univariate, bivariate and multivariate analysis
- There are three types of bivariate analysis. They are- scatter plots, regression analysis, correlation coefficients.
- In scatter plots we use dots to represent the values for two different numeric variables.
- Regression analysis involves a wide range of tools that can be utilized to determine, how the data points might be related.
- Correlation coefficients show how one particular variable moves about with relation to another.
Sample Questions
Ques. What is bivariate analysis? (3 Marks)
Ans. The analysis of two specific variables to determine the empirical relationship present between them is referred to as bivariate analysis. It is of utmost help easier to predict the value of one particular variable, given the value of the other variable is already known.
In this, one variable is dependent and the other is independent. These two variables are mostly denoted by X and Y. The bivariate analysis can also be denoted as pair (X, Y).
Ques. List the types of Bivariate Analysis. (5 Marks)
Ans. There are three main types of bivariate analysis. They are as given below:
- Scatter Plots: This type involves the use of dots to represent the values for two different numeric variables. In simpler terms, we can say that it provides us with a visual idea of what pattern the variables are following.
- Regression Analysis: This type is inclusive of a wide range of tools that can be utilized to determine just how the data points might be related. Regression analysis tends to provide an equation for the curve/line along with giving out the correlation coefficient.
- Correlation Coefficients: This type of bivariate analysis shows how one particular variable moves about with relation to another. Here, in this, a zero denotes that they aren’t correlated (i.e., related in some way), while a 1(either positive or negative) means that the variables are perfectly correlated.
Ques. What are bivariate variables? (3 Marks)
Ans. In Bivariate Analysis, one variable is dependent and the other is independent. These two variables are mostly denoted by X and Y.
So, in the bivariate analysis, we analyse what are the changes that occurred between these two variables and to what level. The bivariate analysis is usually denoted as pair (X, Y). In the bivariate analysis, there is a Y value for each X.
Ques. List down the difference between univariate and bivariate analysis. (5 Marks)
Ans. As we know in univariate analysis, this type of data consists of only one variable. It is the simplest form of analysis, here the data deals with only one quantity that changes. Following is the example of the heights of 4 students. In which, one variable height is used to denote the information of students regarding height. And it is not dealing with any kind of relationship.
| Heights (in cm) | 162 | 178 | 166 | 164 |
Similarly, in bivariate analysis the data involves two different variables. Here the data deals with causes and relationships and the analysis are done to find out the relationships among the two variables. For example, we can take ice cream sales and temperature.
| Temperature (in Celsius) | Icecream Sales |
| 20 | 2000 |
| 23 | 2500 |
| 35 | 5000 |
| 45 | 7000 |
Here, as per the table, we can find out that these two variables are related two each other and directly dependent on each other. As the temperature increases, the sales of ice cream also increase. So, here the relationship of two variables can be identified.
Ques. What is multivariate analysis? (3 Marks)
Ans. Multivariate analysis is a statistical procedure for the analysis of data involving more than one type of measurement or observation. It may also mean solving problems where more than one dependent variable is analyzed with other variables.
In this type of analysis, data deals with three or more variables. In this, multiple dependent variables result in one outcome. Example of this type of analysis, we cannot predict the weather of any year based on the season. There are various factors like pollution, humidity, precipitation, etc.
Ques. Explain the term Statistical analysis. (3 Marks)
Ans. Statistical analysis is the collection and interpretation of data in order to uncover patterns and trends. It is part of data analytics. Statistical analysis can be used in gathering research interpretations, statistical modelling or designing surveys. It can be useful in business intelligence organizations that have to work with large data volumes.
Thus, we can say that statistical analysis is the science of collecting, exploring and presenting large amounts of data to discover underlying patterns and trends.
Ques. Explain the difference between two sample data analysis and bivariate analysis. (3 Marks)
Ans. Two Sample Data analyses and Bivariate analysis are different and are not the same. In two sample data analysis, variables X and Y are not directly related along with a different number of data values in each sample. However, in bivariate analysis, there is a Y value for each X.
Example of Two sample data analysis
Sample 1: 100,45,88,99
Sample 2: 44,33,101
Example of Bivariate Analysis
(X,Y)= (100,56), (23,84), (398,63), (56,42)
Also Read:



Comments