



The NCERT Notes for Class 7 Mathematics Part 2 Chapter 5 Connecting the Dots explain statistical questions, mean, median, dot plots and double-bar graphs for the 2026-27 textbook. These notes help students revise the data handling chapter before solving Figure it Out questions.
- Resource: Class 7 Maths Part 2 Chapter 5 Notes PDF.
- Chapter focus: mean, median, outliers, dot plots and data graphs.
- Revision use: quick rules, worked examples and graph-reading checks.
Chapter5ConnectingtheDots...Notes.pdf?page=1&dpi=150)
Chapter5ConnectingtheDots...Notes.pdf?page=2&dpi=150)
Chapter5ConnectingtheDots...Notes.pdf?page=3&dpi=150)
Chapter5ConnectingtheDots...Notes.pdf?page=4&dpi=150)
Chapter5ConnectingtheDots...Notes.pdf?page=5&dpi=150)
Chapter5ConnectingtheDots...Notes.pdf?page=6&dpi=150)
Chapter5ConnectingtheDots...Notes.pdf?page=7&dpi=150)
Chapter5ConnectingtheDots...Notes.pdf?page=8&dpi=150)
Chapter5ConnectingtheDots...Notes.pdf?page=9&dpi=150)
Chapter5ConnectingtheDots...Notes.pdf?page=10&dpi=150)
Chapter5ConnectingtheDots...Notes.pdf?page=11&dpi=150)
Chapter5ConnectingtheDots...Notes.pdf?page=12&dpi=150)
Chapter5ConnectingtheDots...Notes.pdf?page=13&dpi=150)
Chapter5ConnectingtheDots...Notes.pdf?page=14&dpi=150)
Chapter5ConnectingtheDots...Notes.pdf?page=15&dpi=150)
Chapter5ConnectingtheDots...Notes.pdf?page=16&dpi=150)
Chapter5ConnectingtheDots...Notes.pdf?page=17&dpi=150)
Chapter5ConnectingtheDots...Notes.pdf?page=18&dpi=150)
Chapter5ConnectingtheDots...Notes.pdf?page=19&dpi=150)
Chapter5ConnectingtheDots...Notes.pdf?page=20&dpi=150)
Chapter5ConnectingtheDots...Notes_flat_MobileCard.pdf?page=1&dpi=150)
Chapter5ConnectingtheDots...Notes_flat_MobileCard.pdf?page=2&dpi=150)
Chapter5ConnectingtheDots...Notes_flat_MobileCard.pdf?page=3&dpi=150)
Chapter5ConnectingtheDots...Notes_flat_MobileCard.pdf?page=4&dpi=150)
Chapter5ConnectingtheDots...Notes_flat_MobileCard.pdf?page=5&dpi=150)
Chapter5ConnectingtheDots...Notes_flat_MobileCard.pdf?page=6&dpi=150)
Chapter5ConnectingtheDots...Notes_flat_MobileCard.pdf?page=7&dpi=150)
Chapter5ConnectingtheDots...Notes_flat_MobileCard.pdf?page=8&dpi=150)
Chapter5ConnectingtheDots...Notes_flat_MobileCard.pdf?page=9&dpi=150)
Chapter5ConnectingtheDots...Notes_flat_MobileCard.pdf?page=10&dpi=150)
Chapter5ConnectingtheDots...Notes_flat_MobileCard.pdf?page=11&dpi=150)
Chapter5ConnectingtheDots...Notes_flat_MobileCard.pdf?page=12&dpi=150)
Chapter5ConnectingtheDots...Notes_flat_MobileCard.pdf?page=13&dpi=150)
Chapter5ConnectingtheDots...Notes_flat_MobileCard.pdf?page=14&dpi=150)
Chapter5ConnectingtheDots...Notes_flat_MobileCard.pdf?page=15&dpi=150)
Chapter5ConnectingtheDots...Notes_flat_MobileCard.pdf?page=16&dpi=150)
Chapter5ConnectingtheDots...Notes_flat_MobileCard.pdf?page=17&dpi=150)
Chapter5ConnectingtheDots...Notes_flat_MobileCard.pdf?page=18&dpi=150)
Chapter5ConnectingtheDots...Notes_flat_MobileCard.pdf?page=19&dpi=150)
Chapter5ConnectingtheDots...Notes_flat_MobileCard.pdf?page=20&dpi=150)
Chapter5ConnectingtheDots...Notes_flat_MobileCard.pdf?page=21&dpi=150)
Chapter5ConnectingtheDots...Notes_flat_MobileCard.pdf?page=22&dpi=150)
Chapter5ConnectingtheDots...Notes_flat_MobileCard.pdf?page=23&dpi=150)
Chapter5ConnectingtheDots...Notes_flat_MobileCard.pdf?page=24&dpi=150)
Chapter5ConnectingtheDots...Notes_flat_MobileCard.pdf?page=25&dpi=150)
Chapter5ConnectingtheDots...Notes_flat_MobileCard.pdf?page=26&dpi=150)
Student Feedback: Students usually improve in this chapter when they compare the mean and median before writing a conclusion.
Connecting the Dots Class 7 Notes Overview
Connecting the Dots is the statistics chapter in Ganita Prakash Part 2. It begins with statistical questions, then moves to representative values and visual data displays. The main skill is not only calculation. Students must decide what the data says and what it does not say.
The chapter uses cricket scores, onion prices, flower counts, pockets on clothes and height data. These examples show why one number cannot always describe a full data set.
Mean and Median in Connecting the Dots
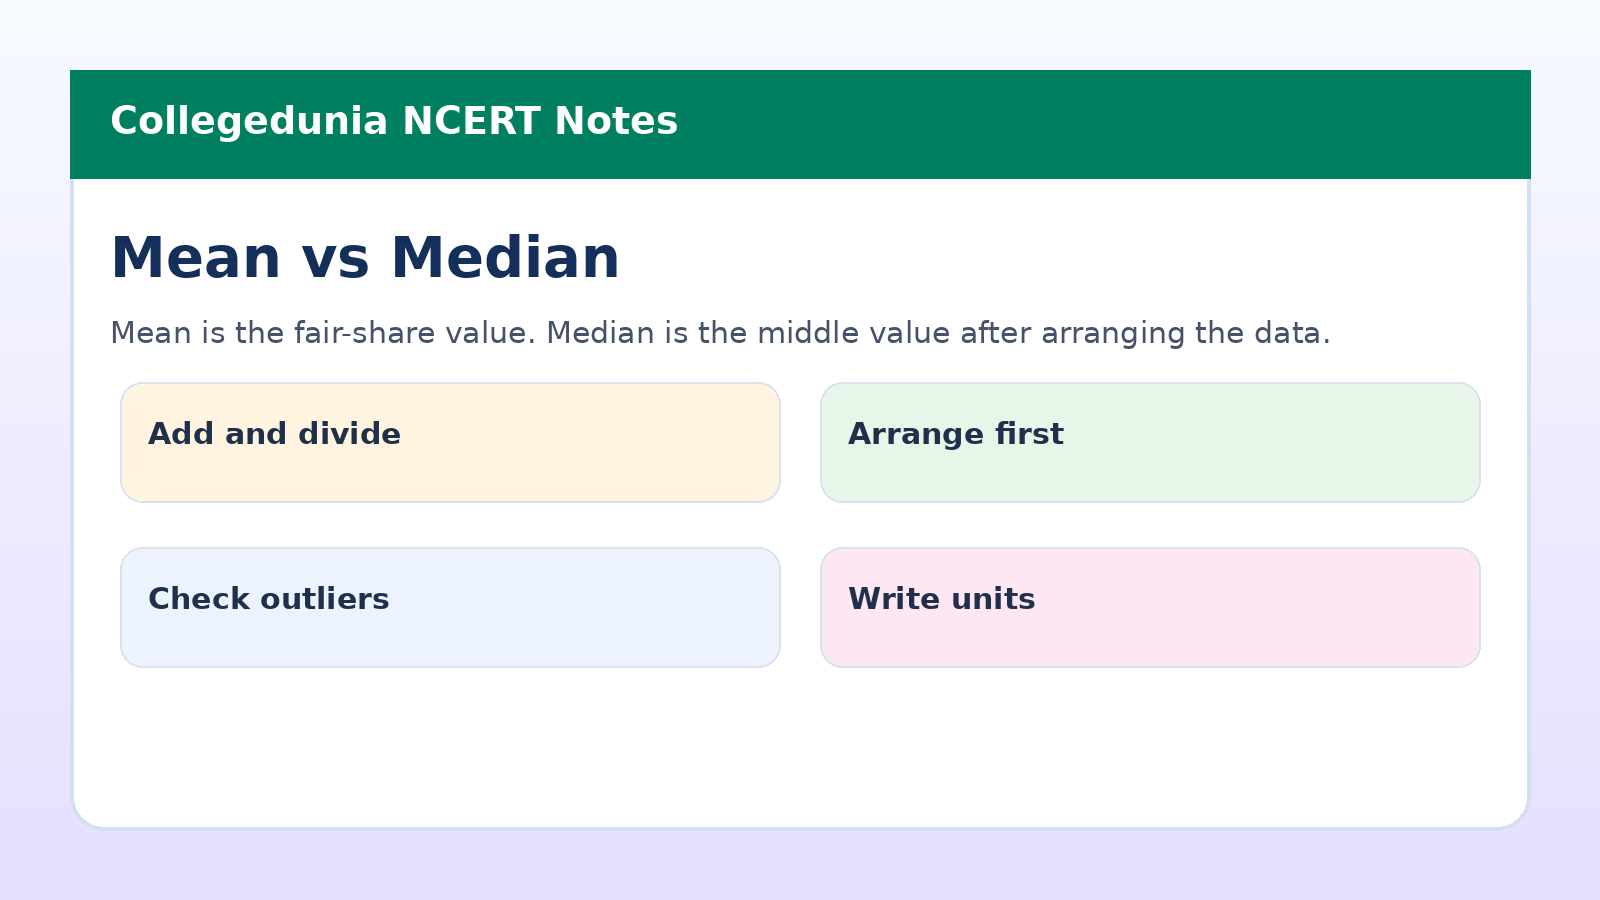
The arithmetic mean is the fair-share value. Add all values and divide by the number of values. The median is the middle value after arranging data in order. Both are useful, but they answer different questions.
| Measure | How to find it | Best use |
|---|---|---|
| Mean | Add all values and divide by count | Fair-share comparison |
| Median | Arrange values and find the middle | Centre when outliers exist |
| Range | Maximum minus minimum | Spread of data |
Connecting the Dots Video Lesson
Source: YouTube classroom video
Dot Plots and Double-Bar Graphs in Class 7 Maths Chapter 5
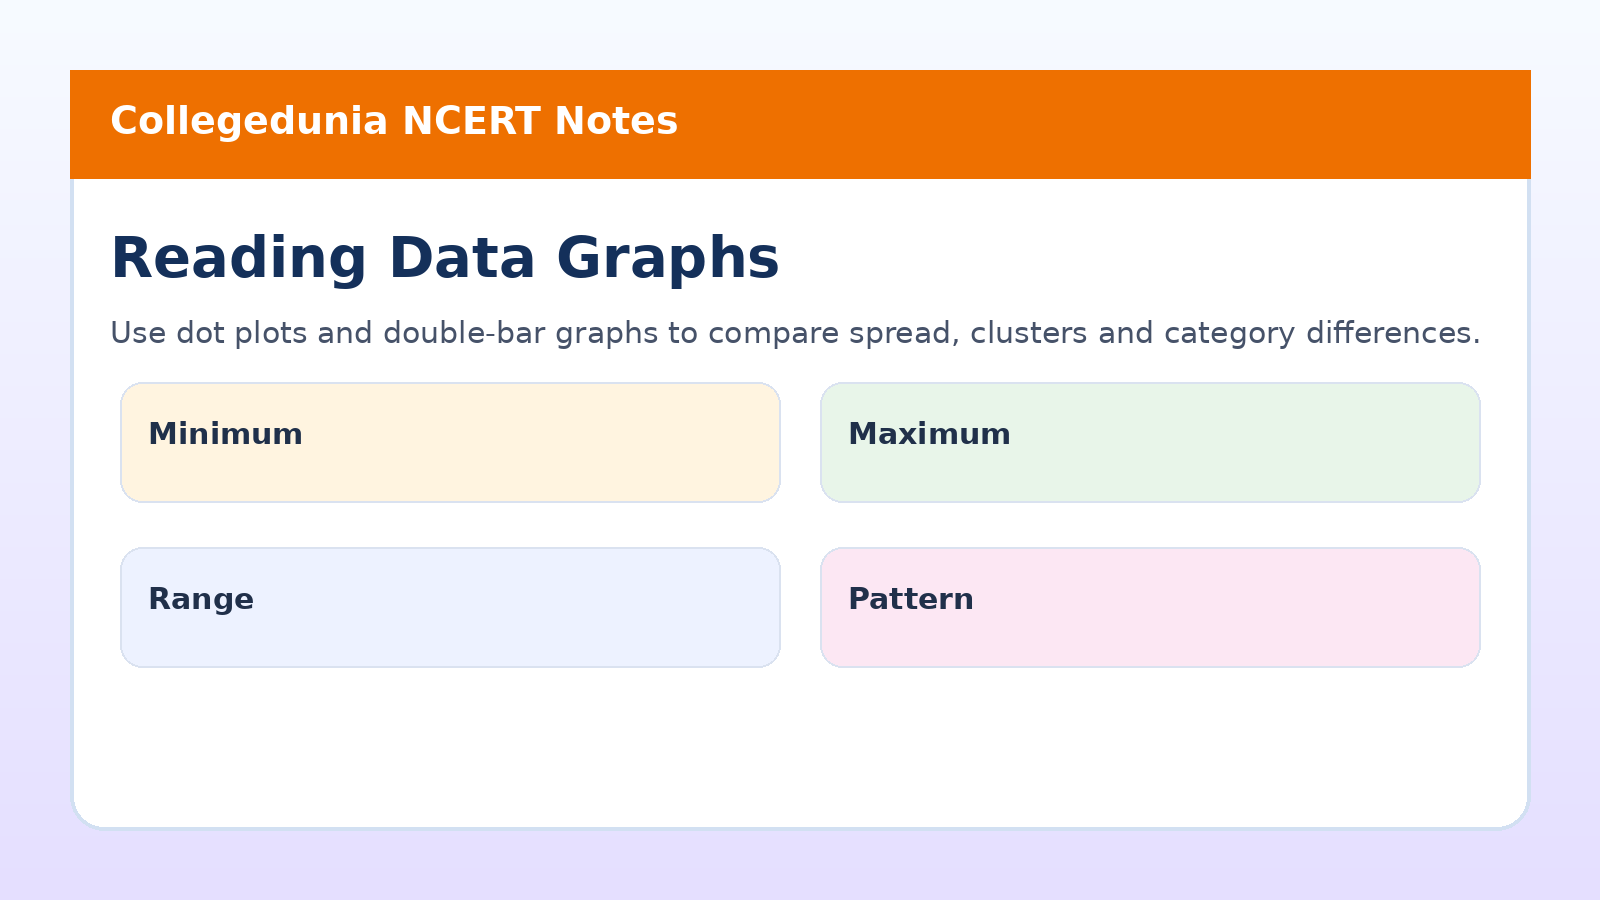
Dot plots show each value as a dot on a number line. They make repeated values, clusters and gaps easy to see. Double-bar graphs compare two related sets across the same categories.
- Look at the smallest and largest values first.
- Check where dots are clustered or stacked.
- Use the same scale for both bars in a double-bar graph.
- Write observations from the graph, not unsupported reasons.
Important Formulas and Rules from Connecting the Dots
| Rule | Formula or method | Example use |
|---|---|---|
| Mean | Sum of values divided by number of values | Average bounces, runs or flowers |
| Median for odd count | Middle value after sorting | Five or seventeen values |
| Median for even count | Average of two middle values | Twelve monthly prices |
| Range | Maximum value minus minimum value | Price variation or score spread |
How to Use These Connecting the Dots Notes
Start with the formula table, then revise the graph rules. After that, solve one mean question, one median question and one graph observation question from the textbook. This order keeps calculation and interpretation together.
- Sort the data before finding the median.
- Use totals only when group sizes are the same.
- For graphs, mention centre, spread and visible clusters.
- Write the unit in answers such as seconds, centimetres, marks or rupees.
Class 7 Maths Part 2 Chapter 5 Resource Links
Use these related resources for textbook reading, solved examples and quick revision.
| Resource | Best use | Link |
|---|---|---|
| NCERT Notes | Quick concept revision | Current notes |
| NCERT Solutions | Step-by-step textbook answers | Open solutions |
| Handwritten Notes | Fast visual revision | Open handwritten notes |
| NCERT Book PDF | Official chapter reading | Open book PDF |
All NCERT Notes for Class 7 Mathematics Part 2 Chapters
| Chapter | Title | Notes link |
|---|---|---|
| Chapter 1 | Geometric Twins | Open Notes |
| Chapter 2 | Operations with Integers | Open Notes |
| Chapter 3 | Finding Common Ground | Open Notes |
| Chapter 4 | Another Peek Beyond the Point | Open Notes |
Connecting the Dots Class 7 Maths NCERT Notes FAQs
Ques. What does Class 7 Maths Chapter 5 Connecting the Dots cover?
Ans. It covers statistical questions, arithmetic mean, median, outliers, dot plots and double-bar graphs from the 2026-27 NCERT textbook.
Ques. What is the formula for mean in Connecting the Dots?
Ans. Mean is the sum of all values divided by the number of values. It gives the fair-share value of the data.
Ques. How is the median different from the mean?
Ans. Median is the middle value after arranging data. Mean uses every value, so it can change more when an outlier is present.
Ques. Do these notes follow the 2026-27 NCERT textbook?
Ans. Yes. These notes follow Ganita Prakash Class 7 Mathematics Part 2 Chapter 5 for the 2026-27 session.



Comments