




Class 7 Maths Part 2 Chapter 5 Connecting the Dots... is the data handling chapter. These class 7 maths handwritten notes chapter 5 Connecting the Dots... follow the 2026-27 NCERT and cover representative values, visualising data and reading it critically.
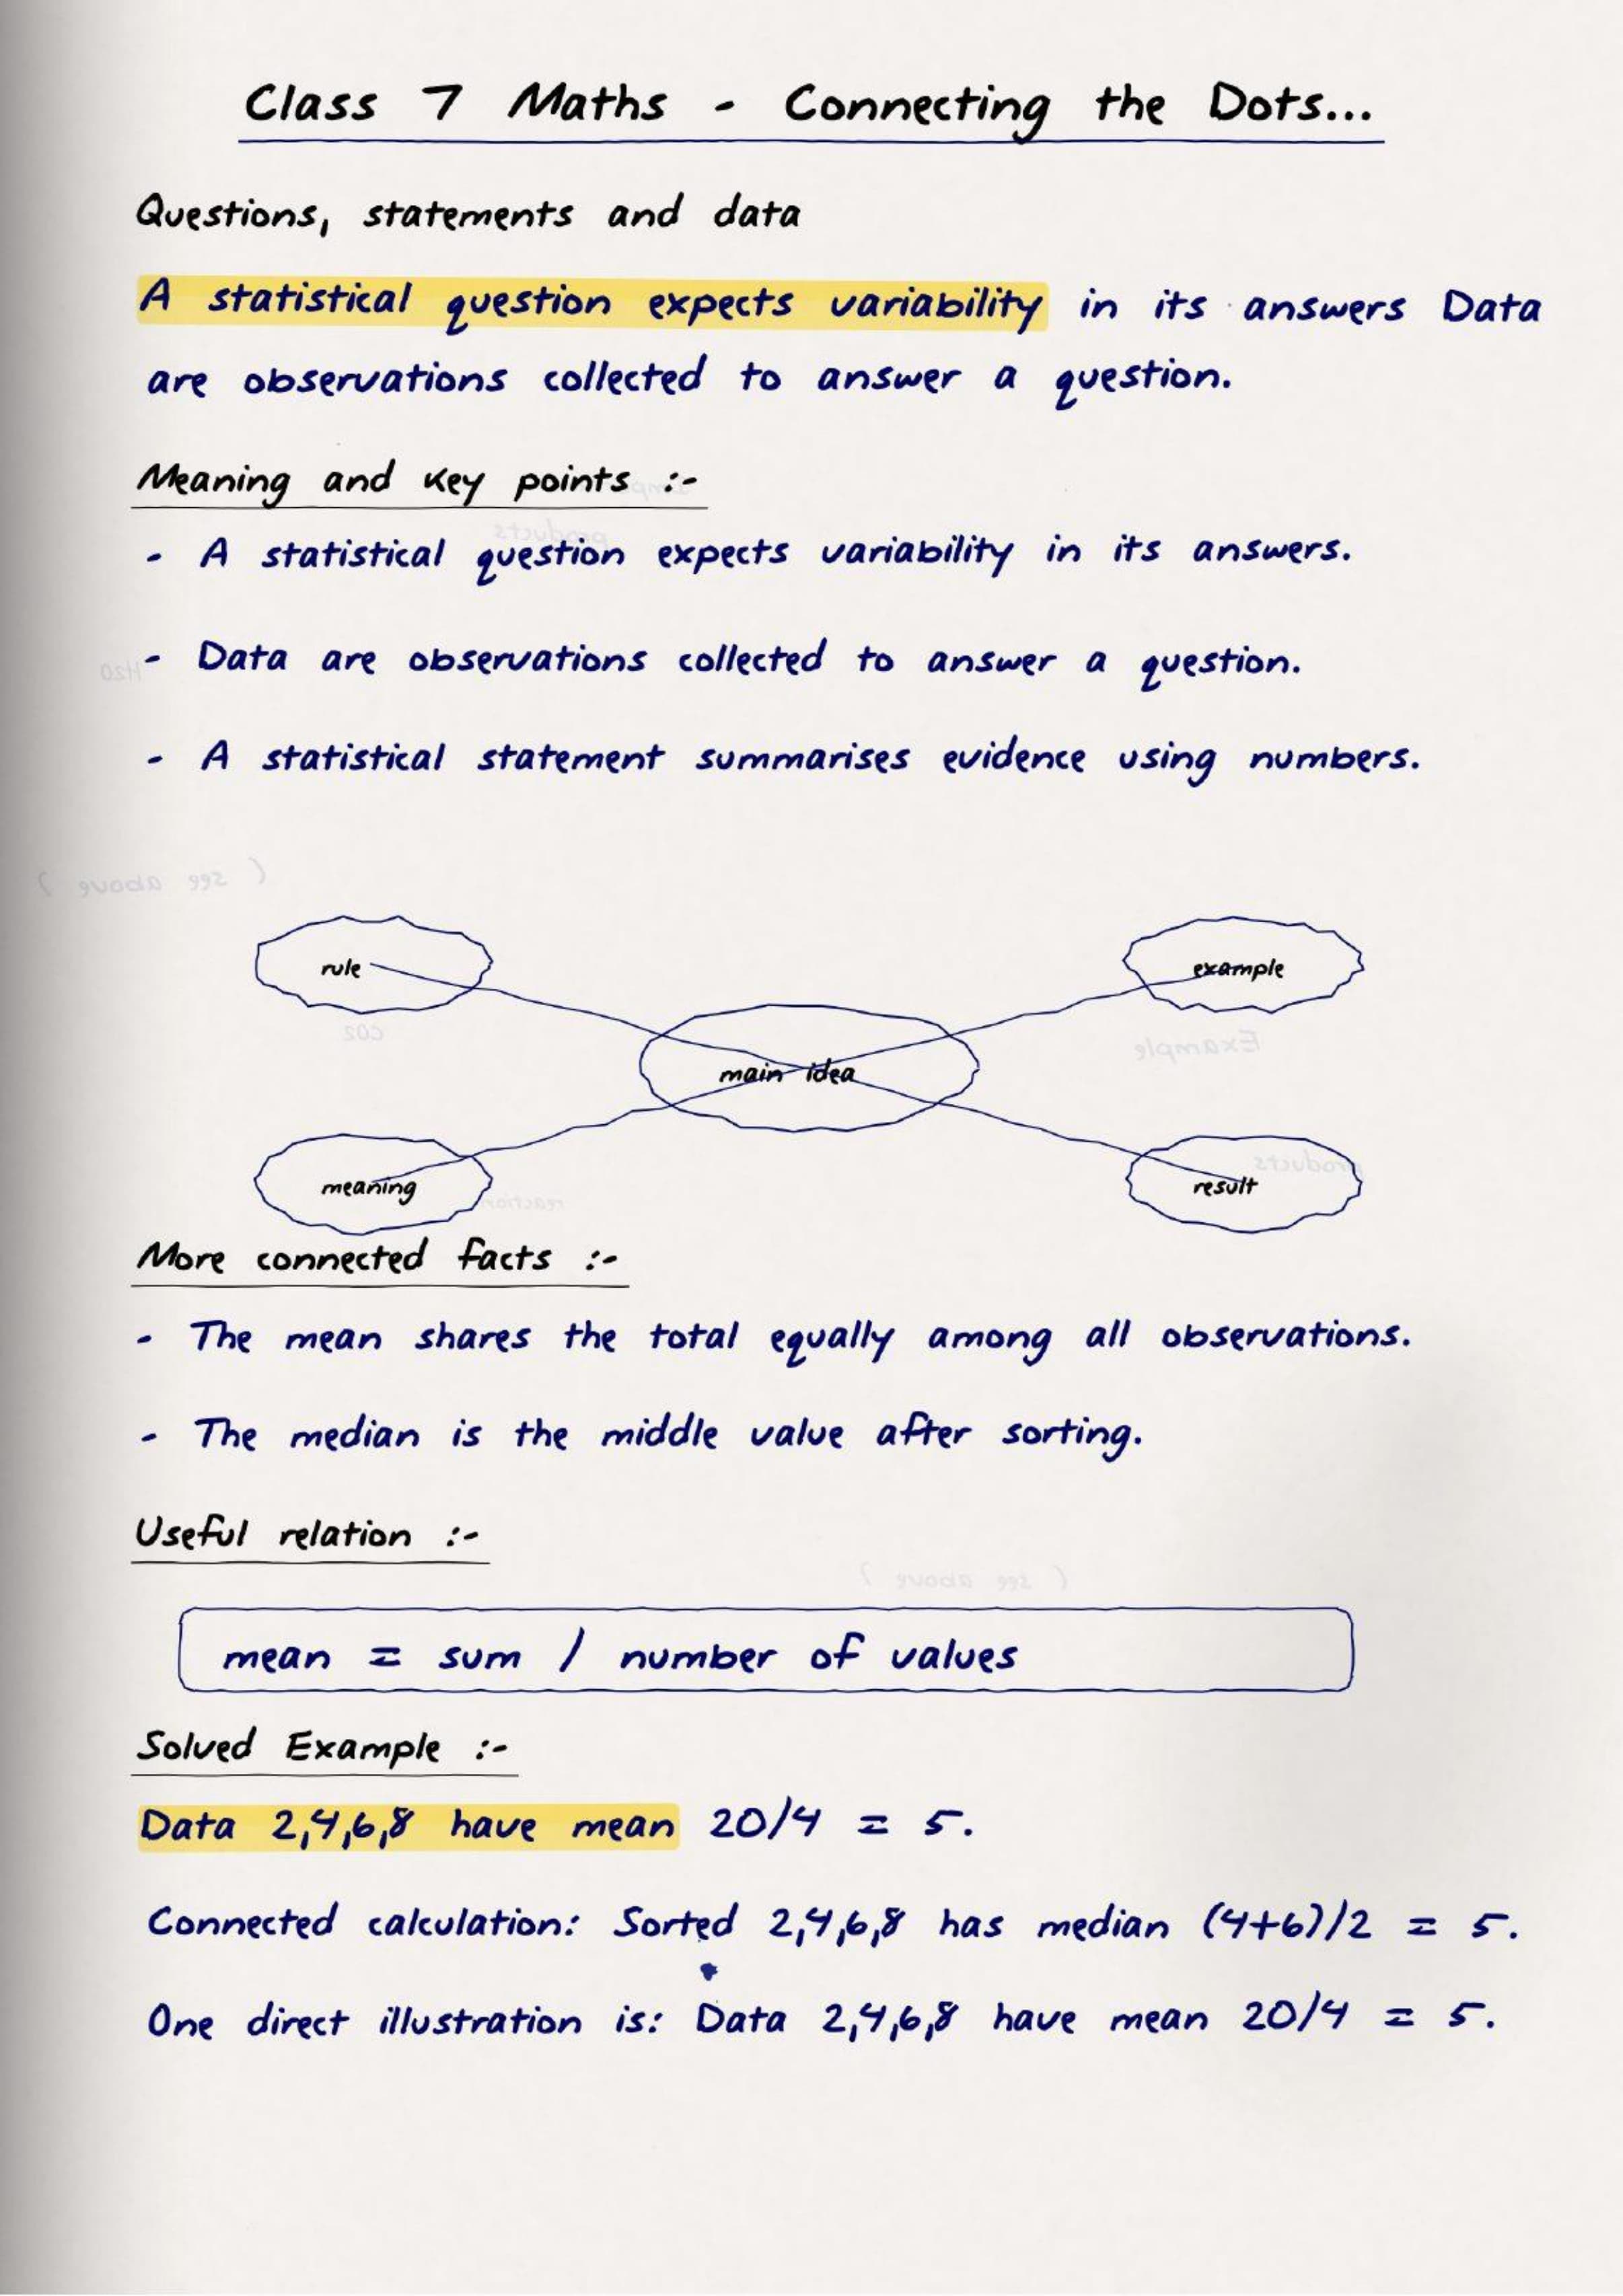
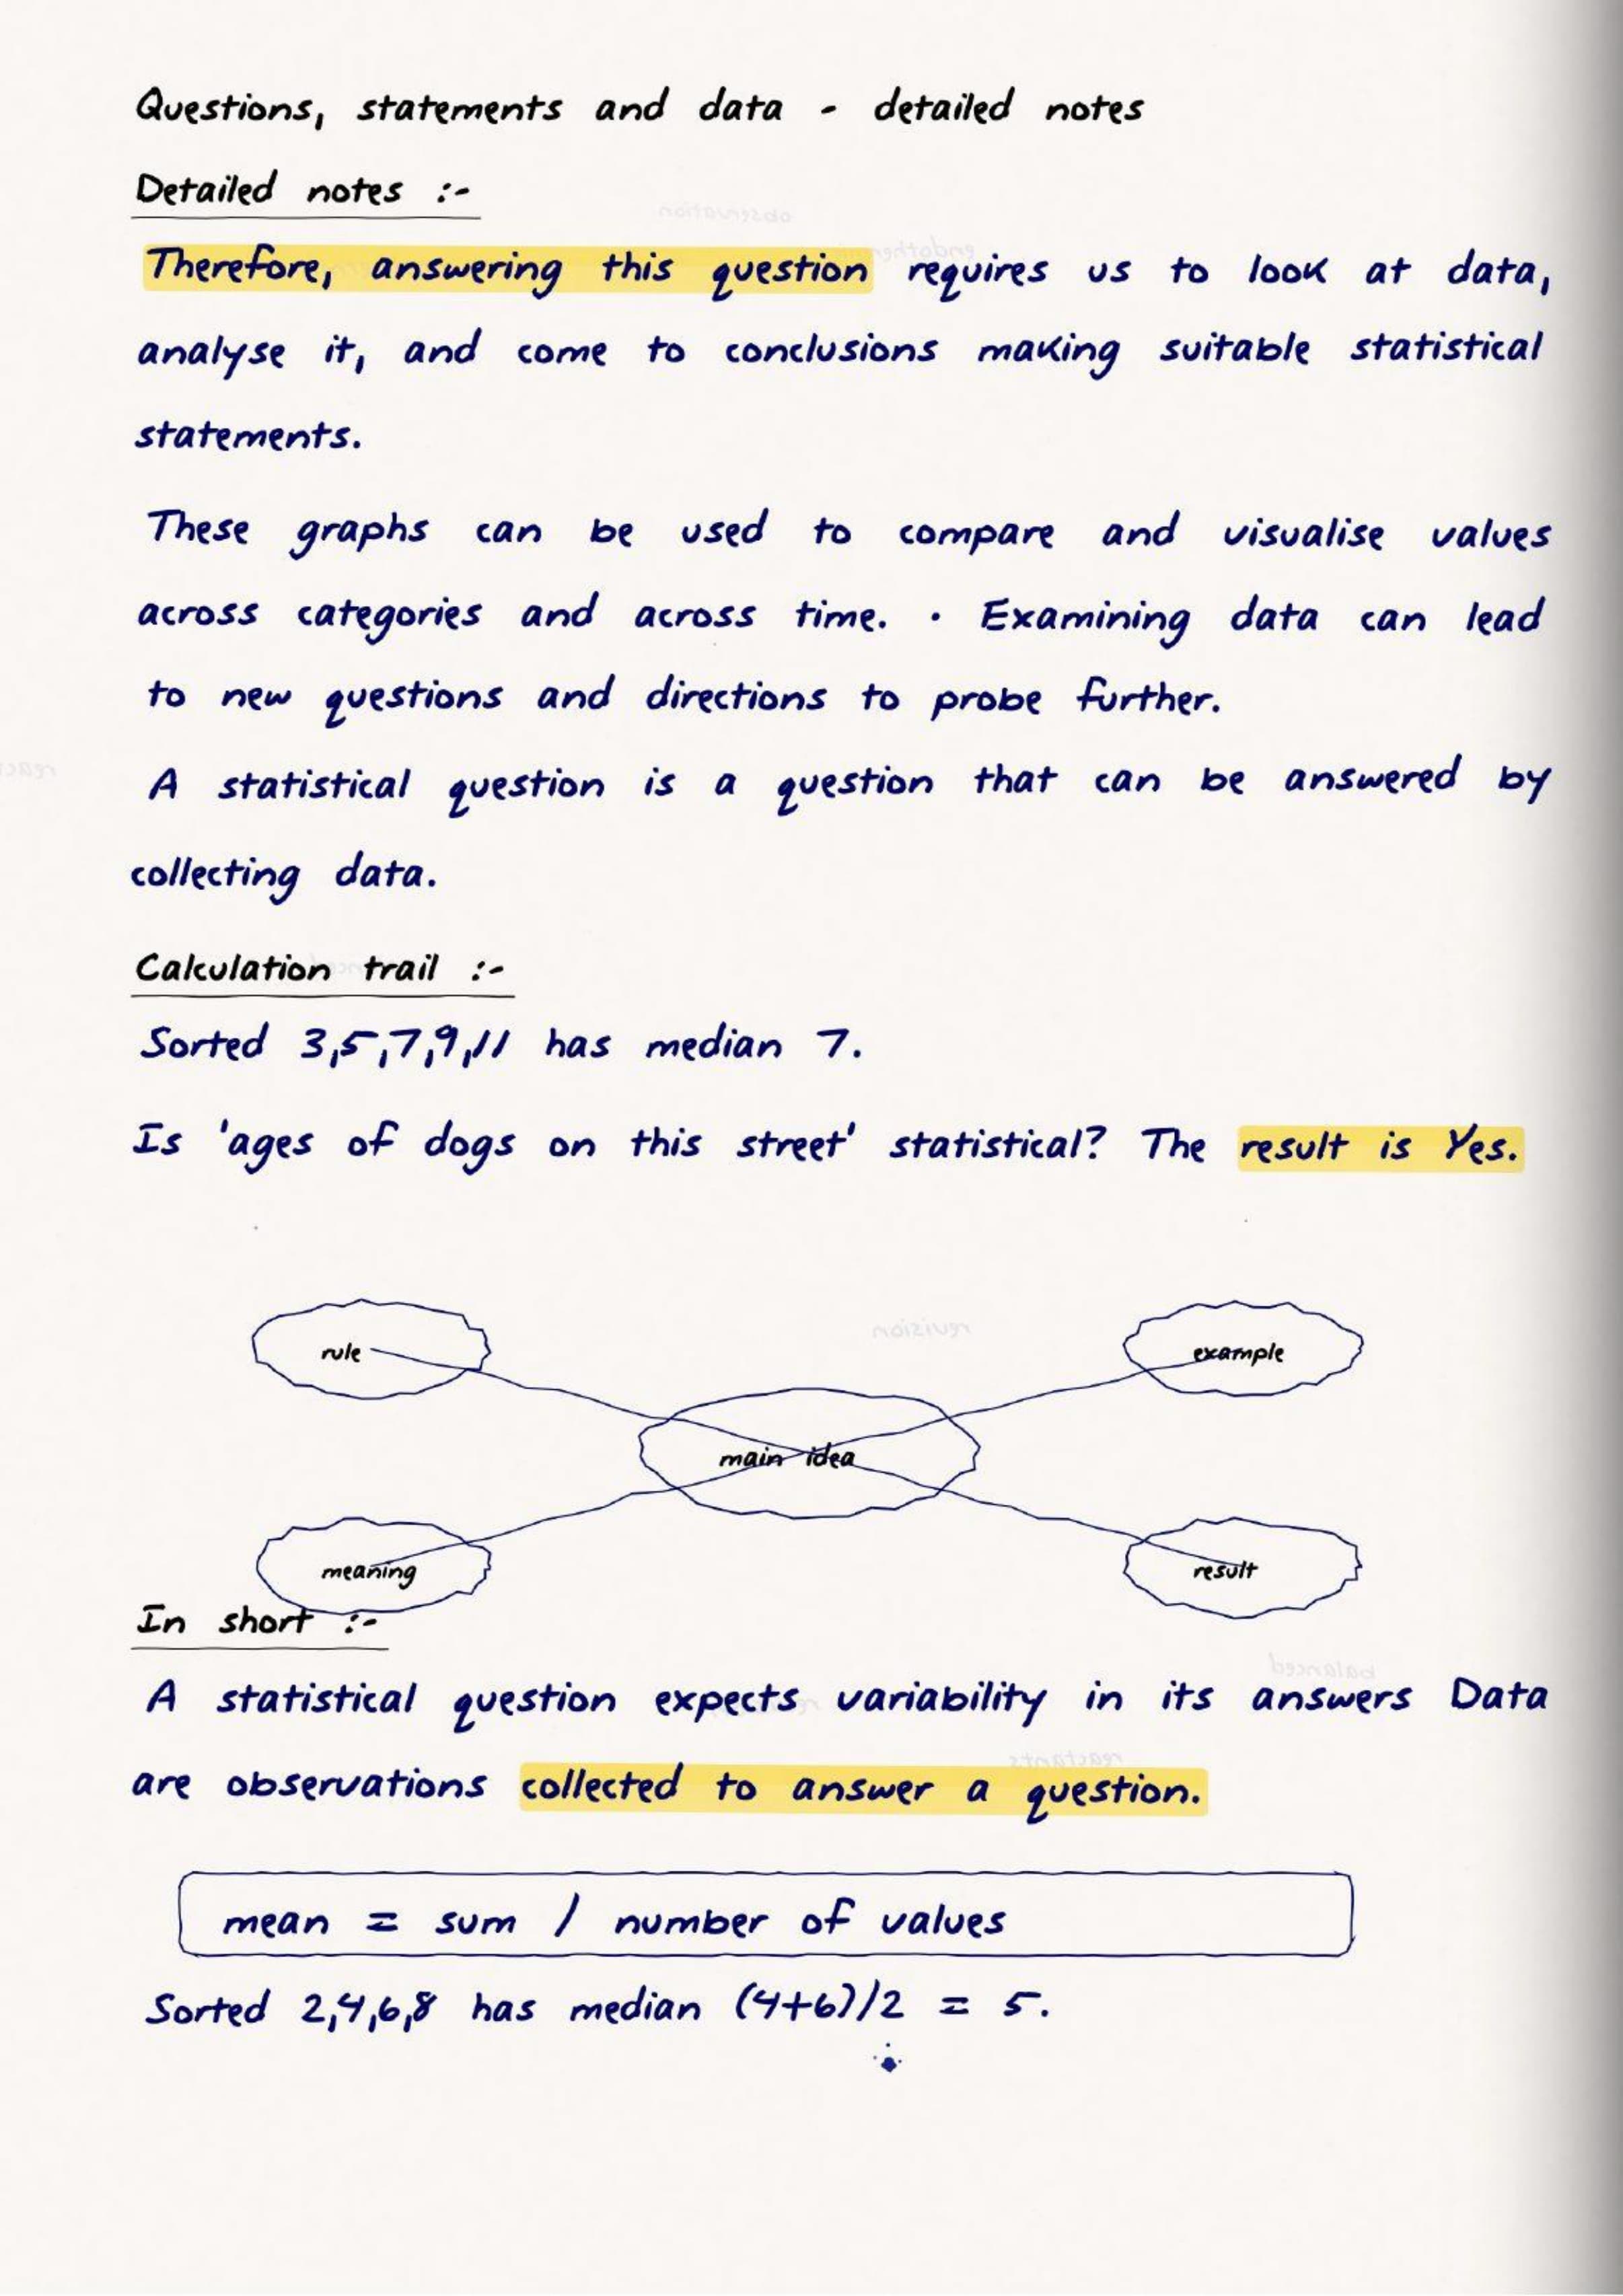
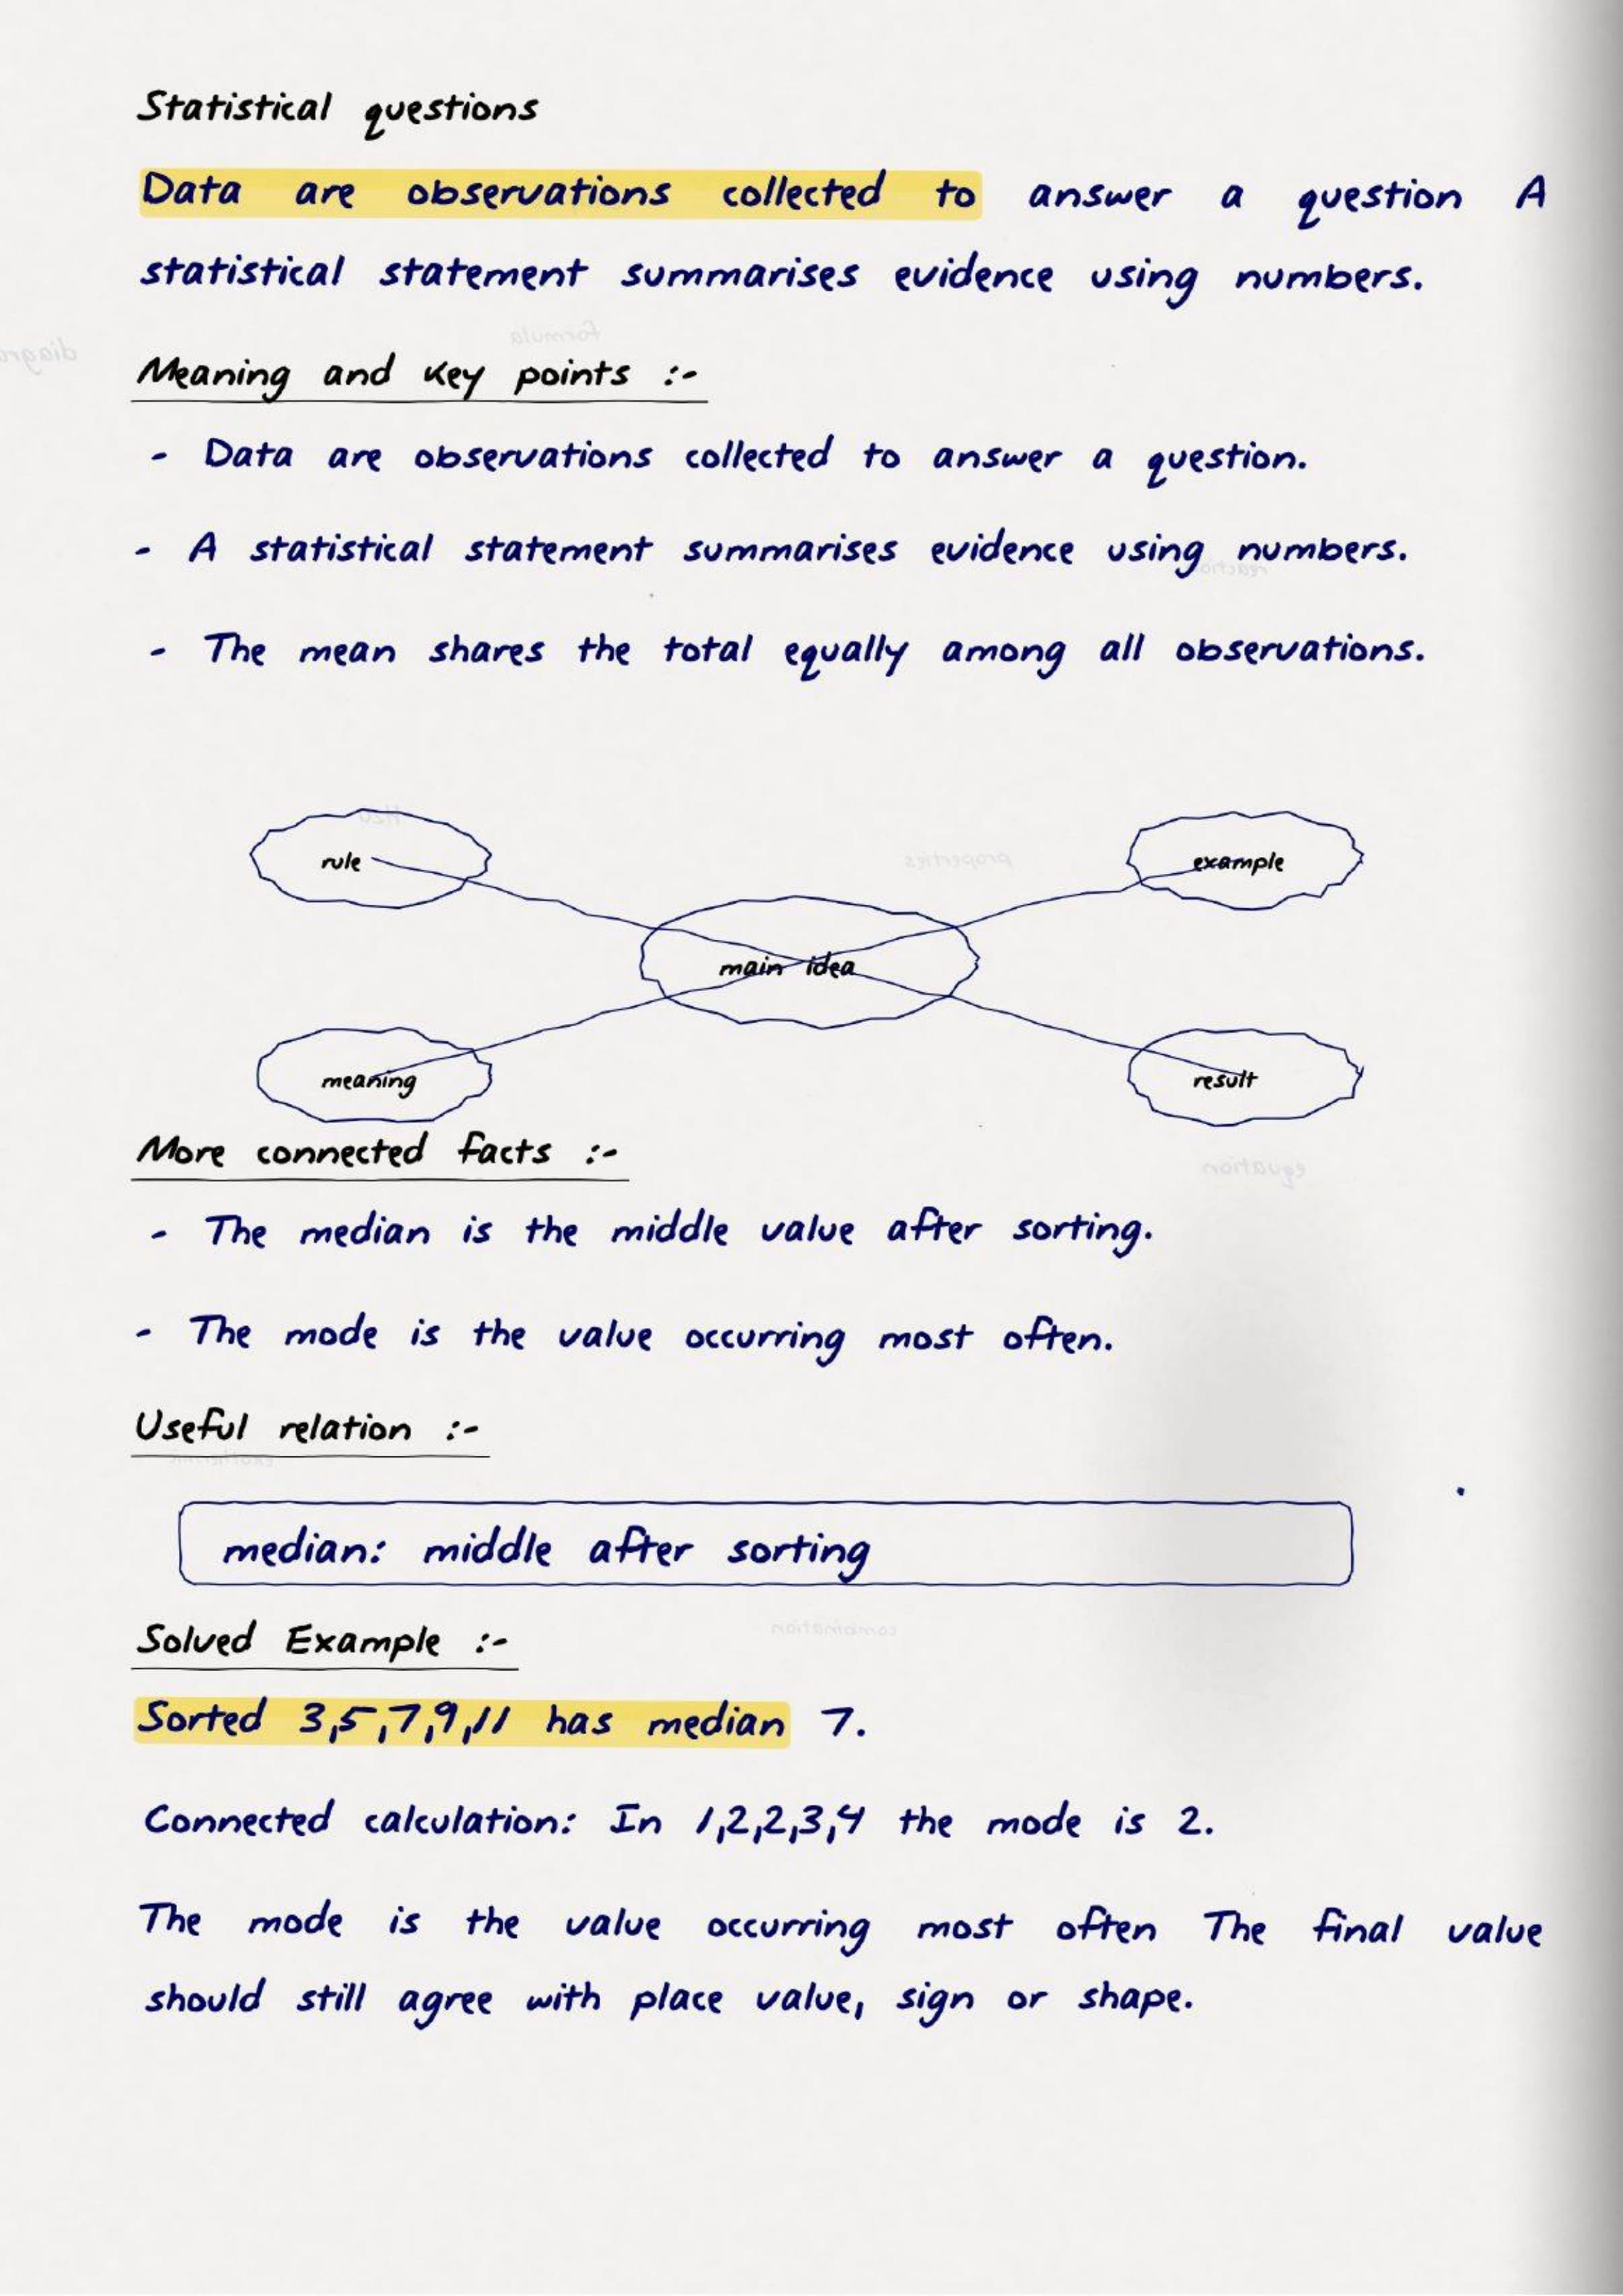
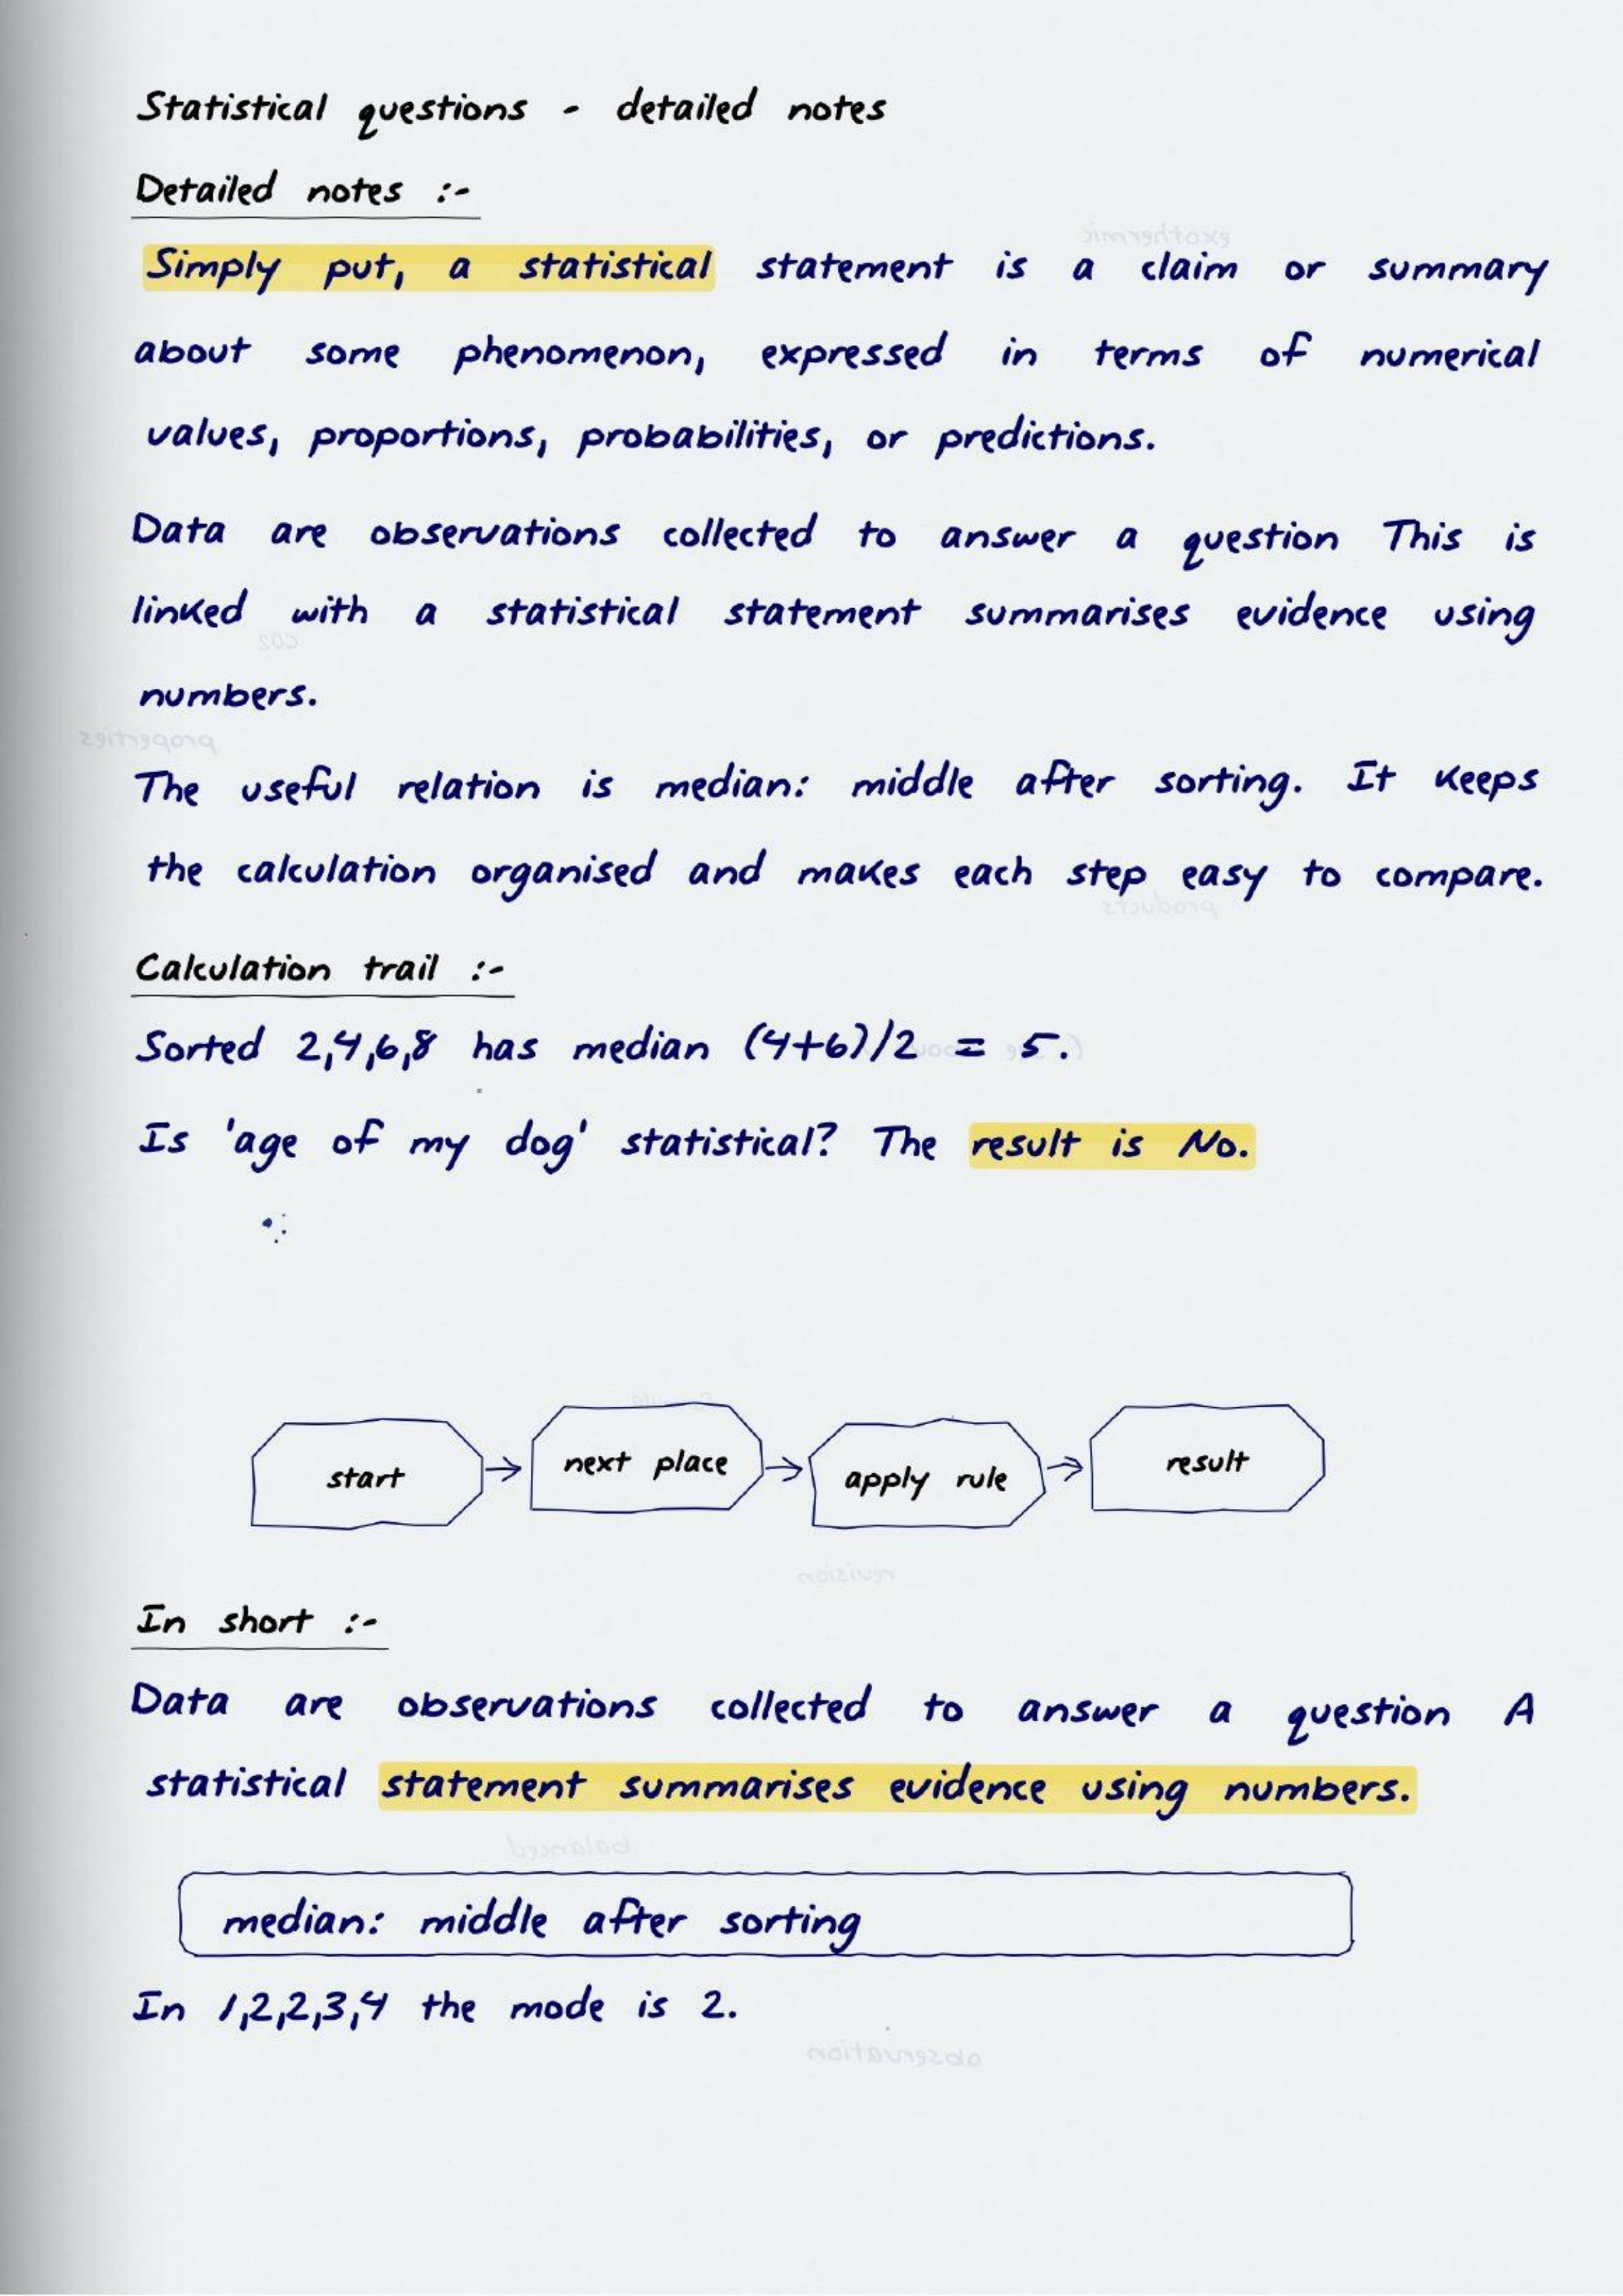
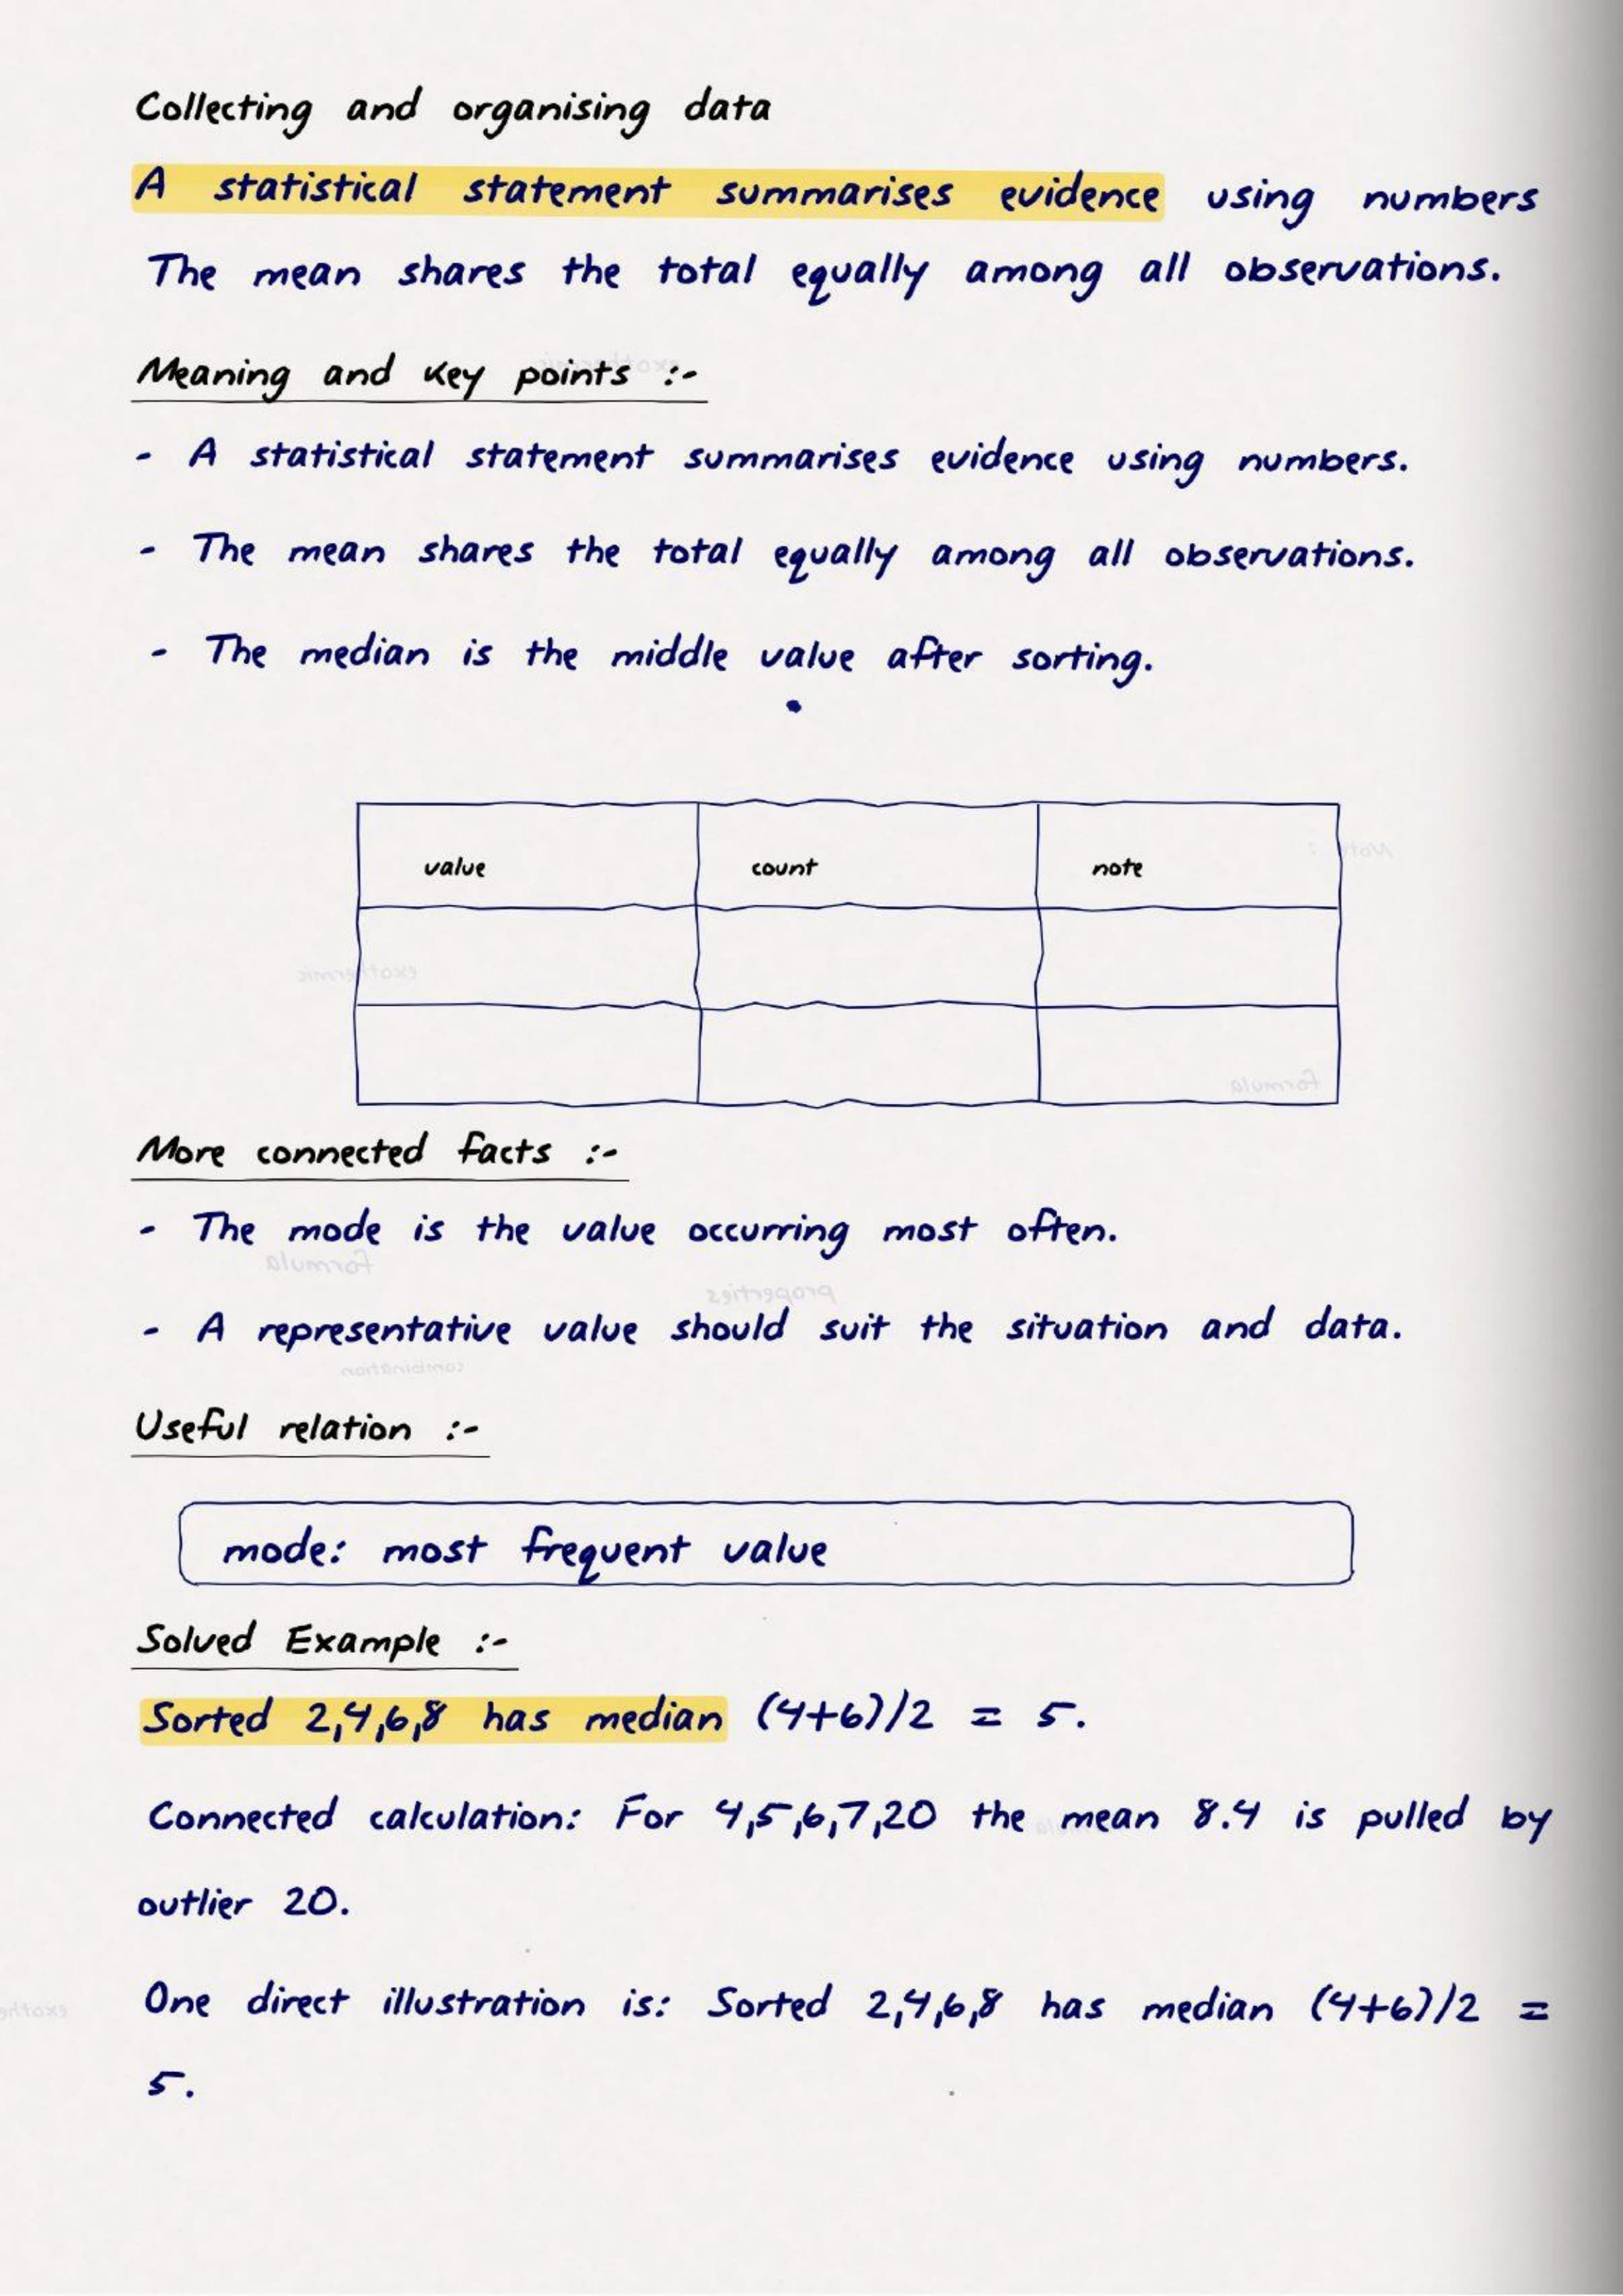
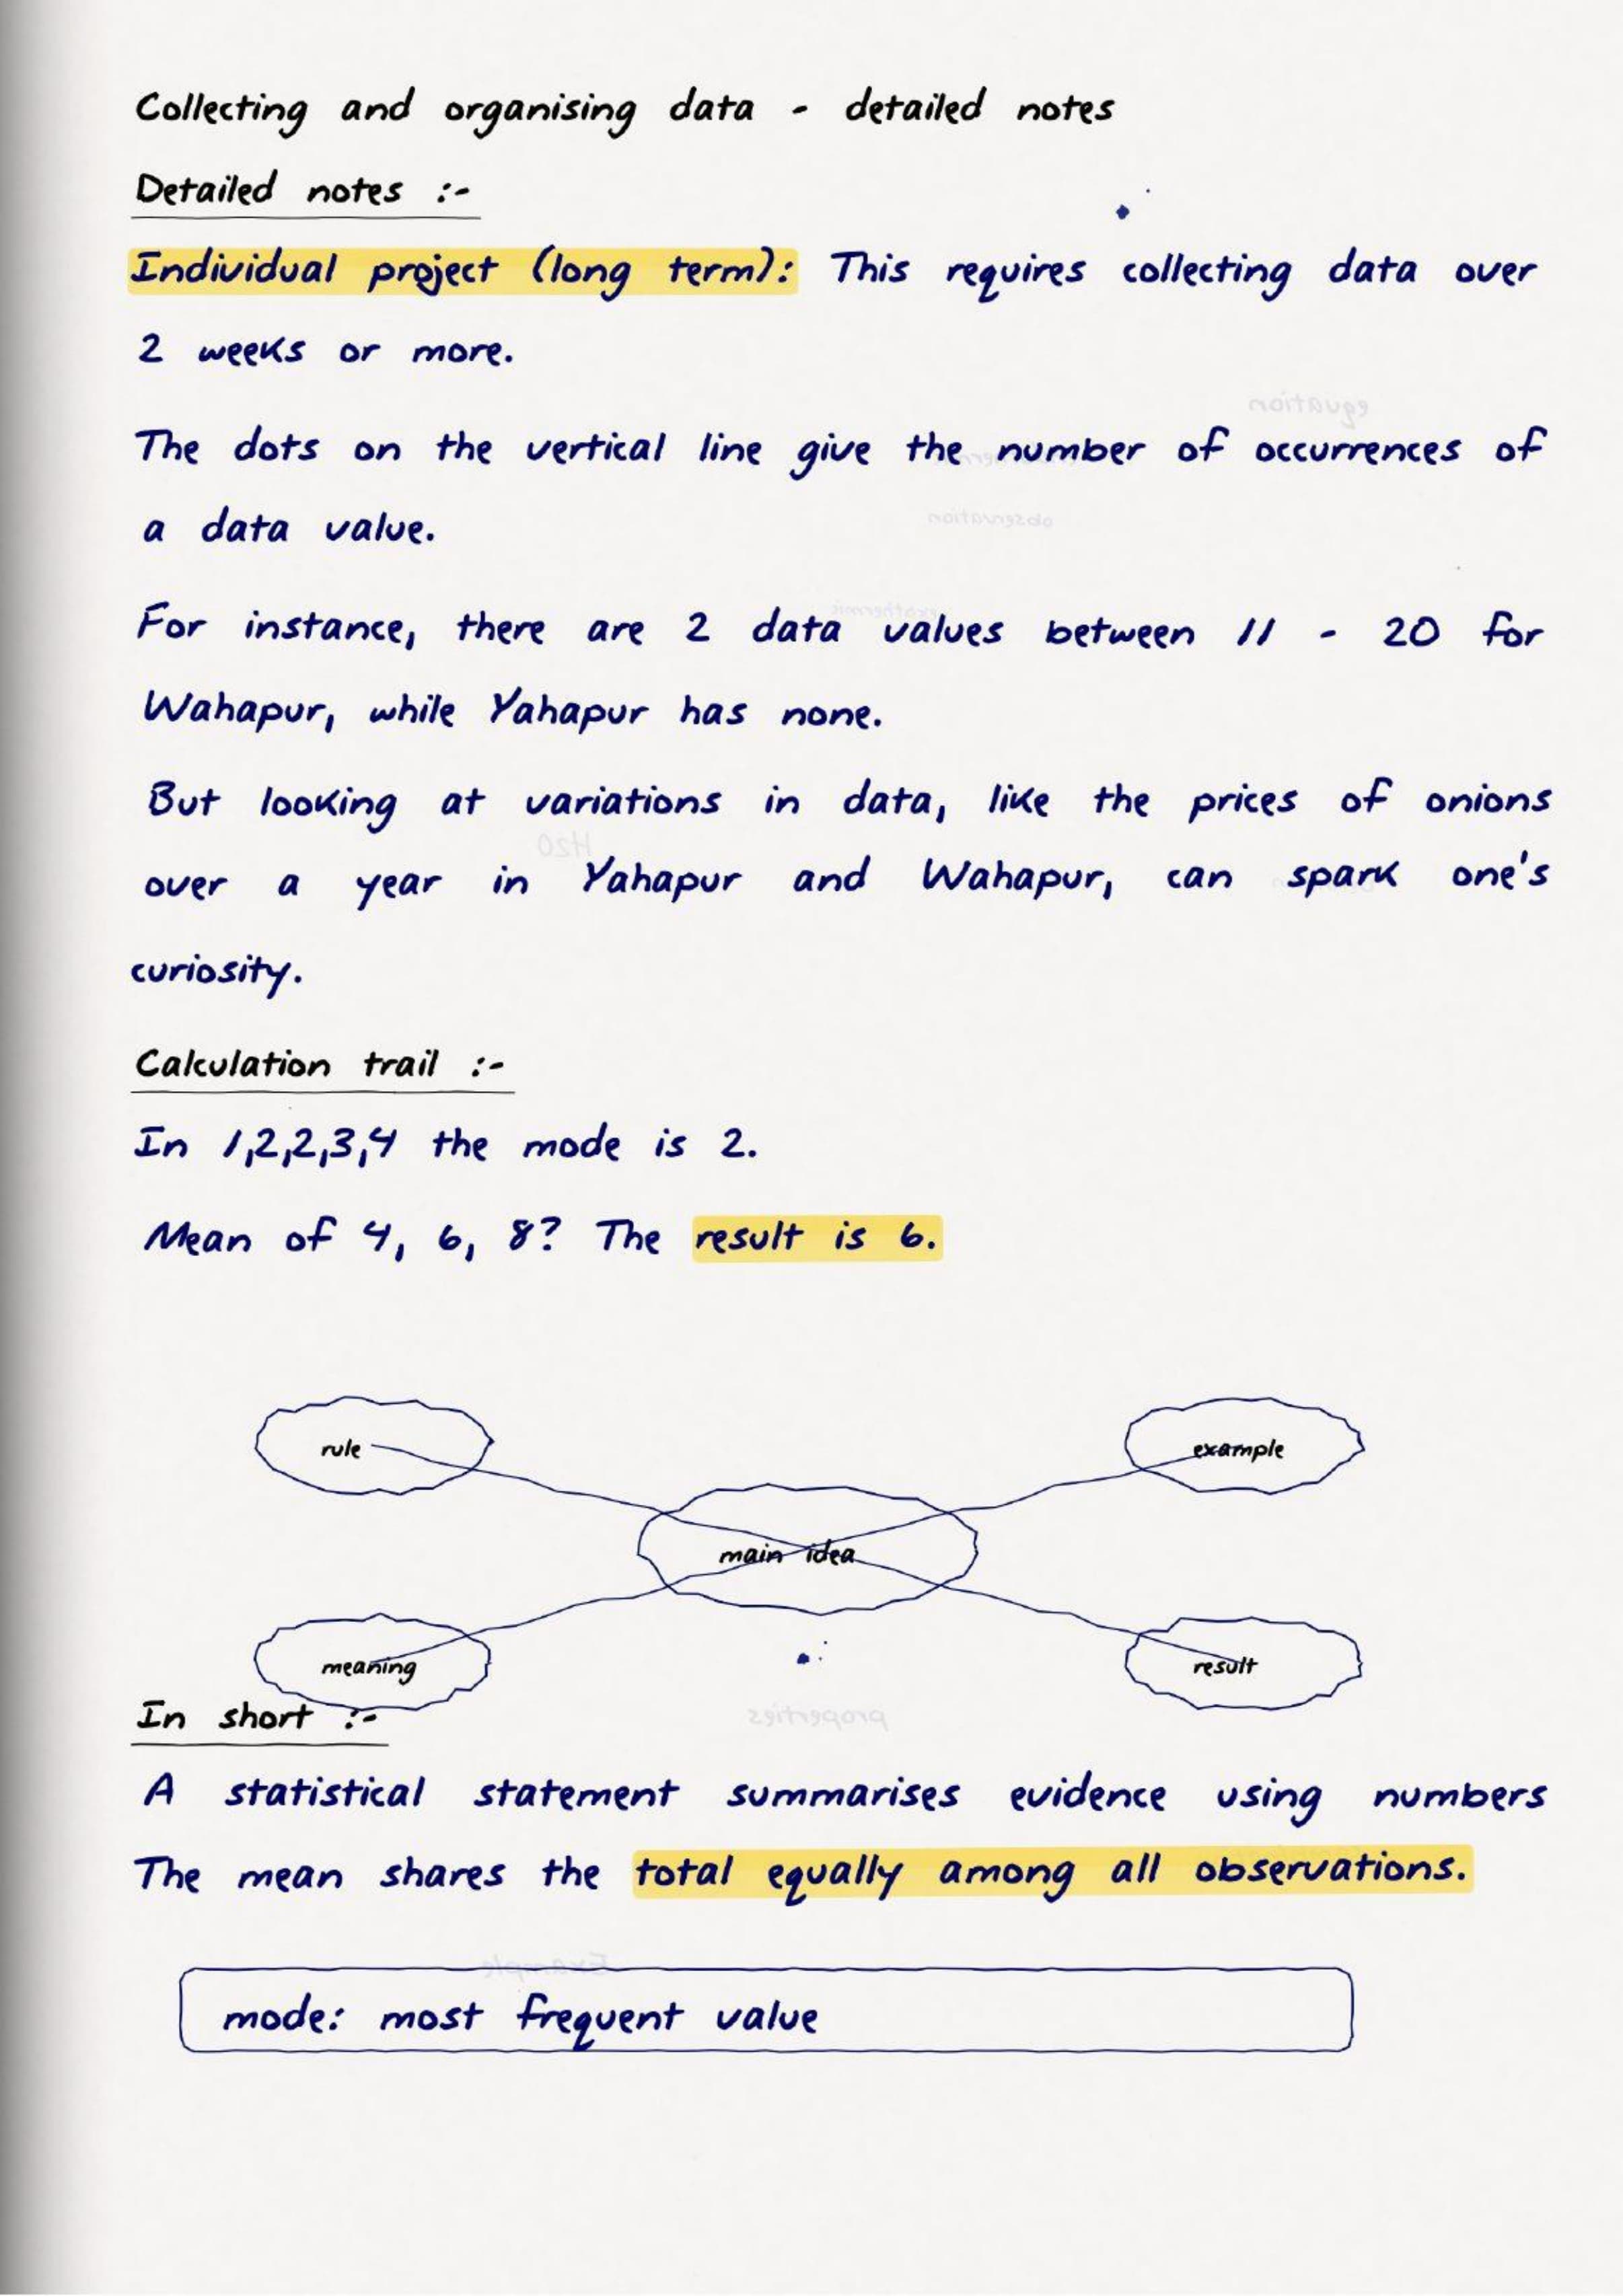
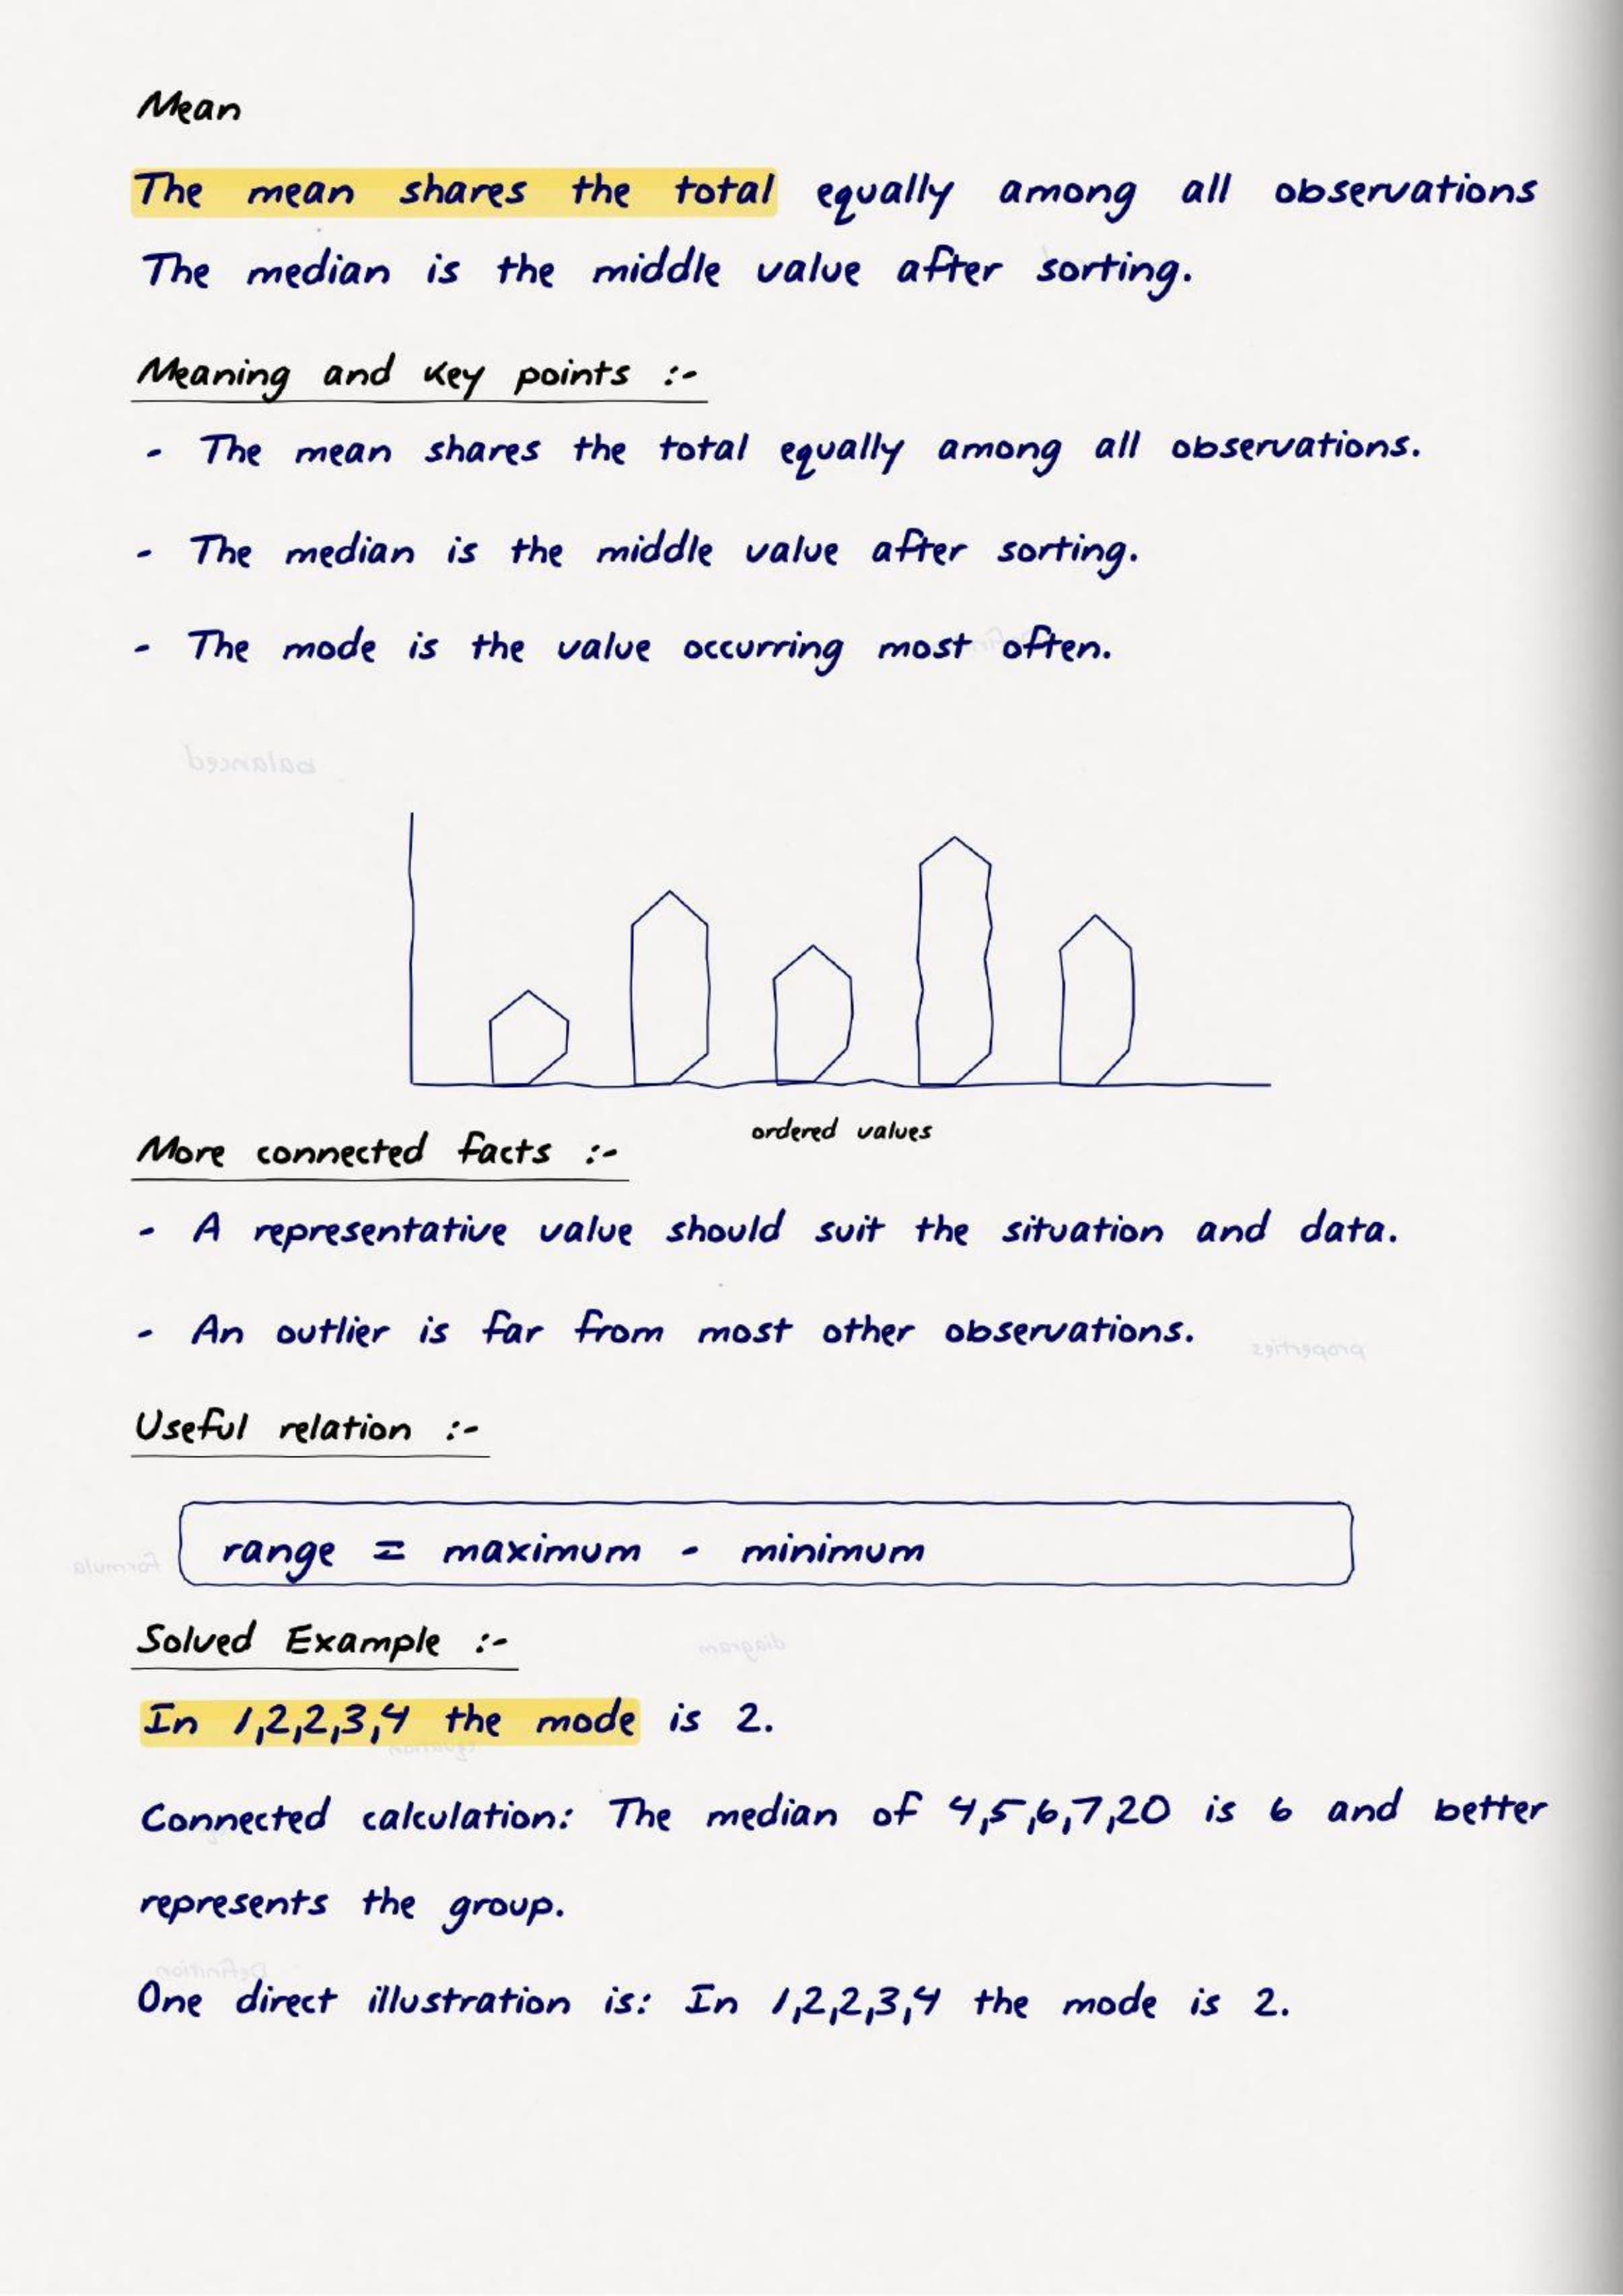
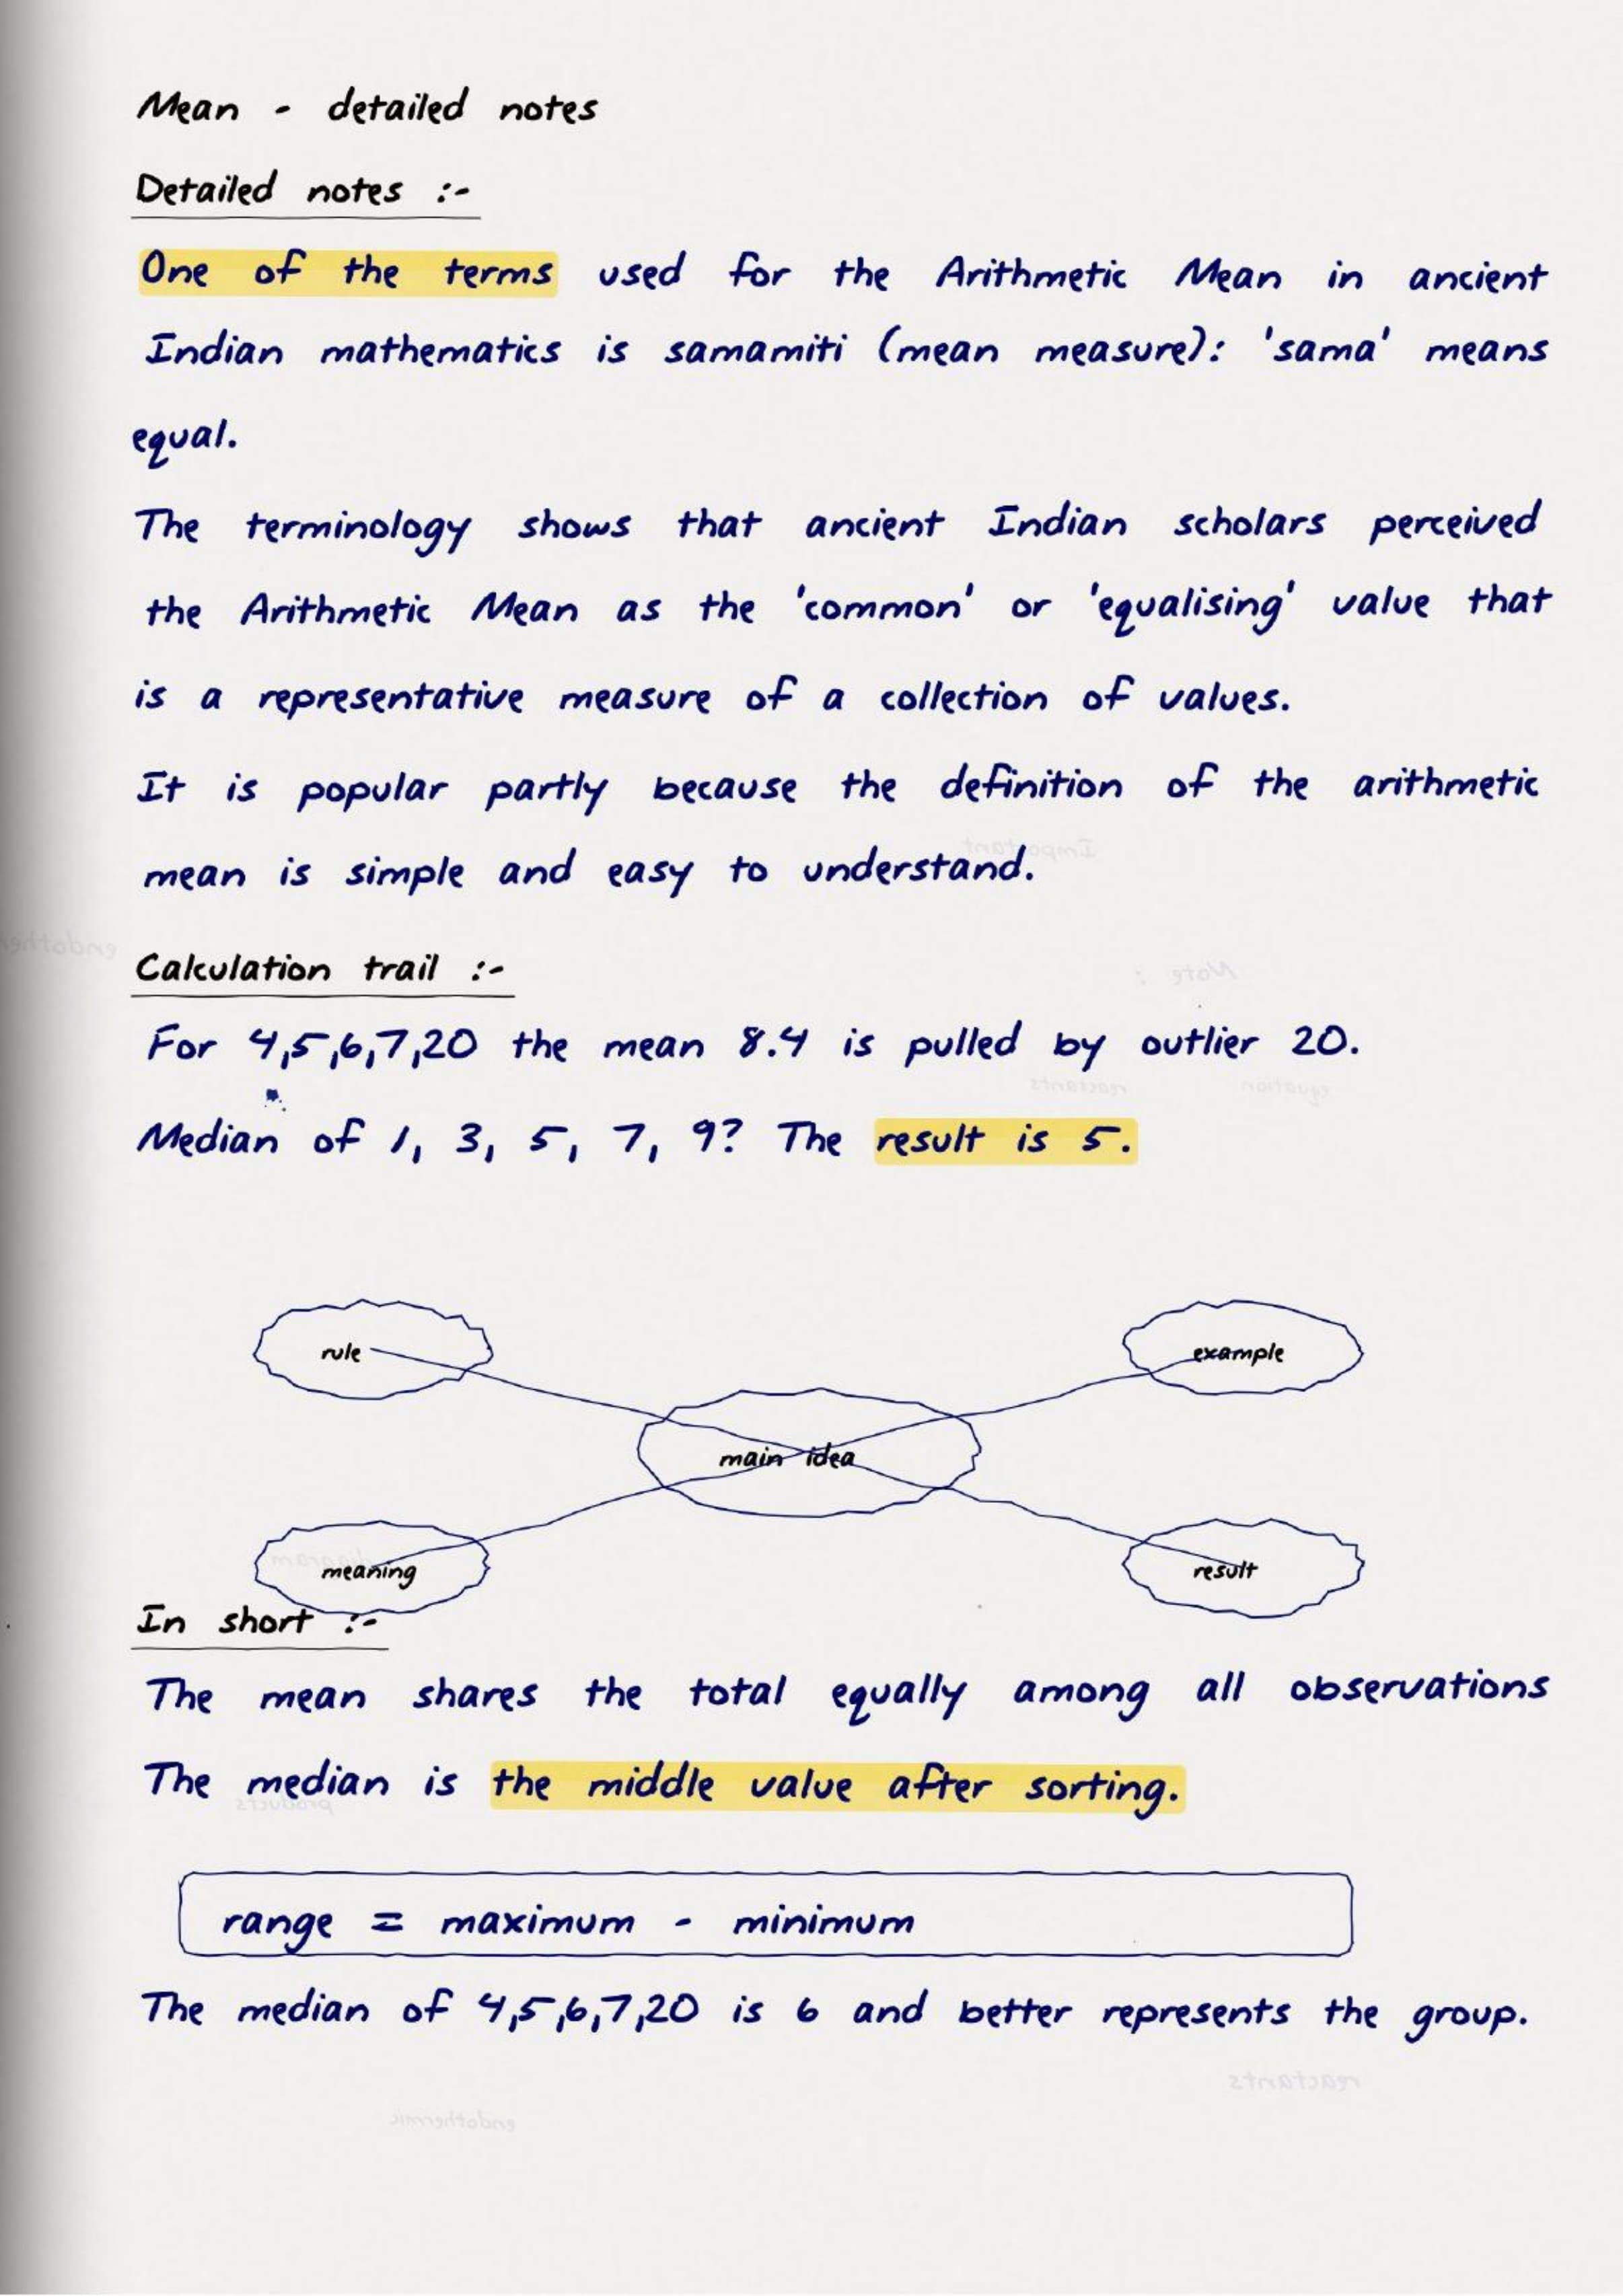
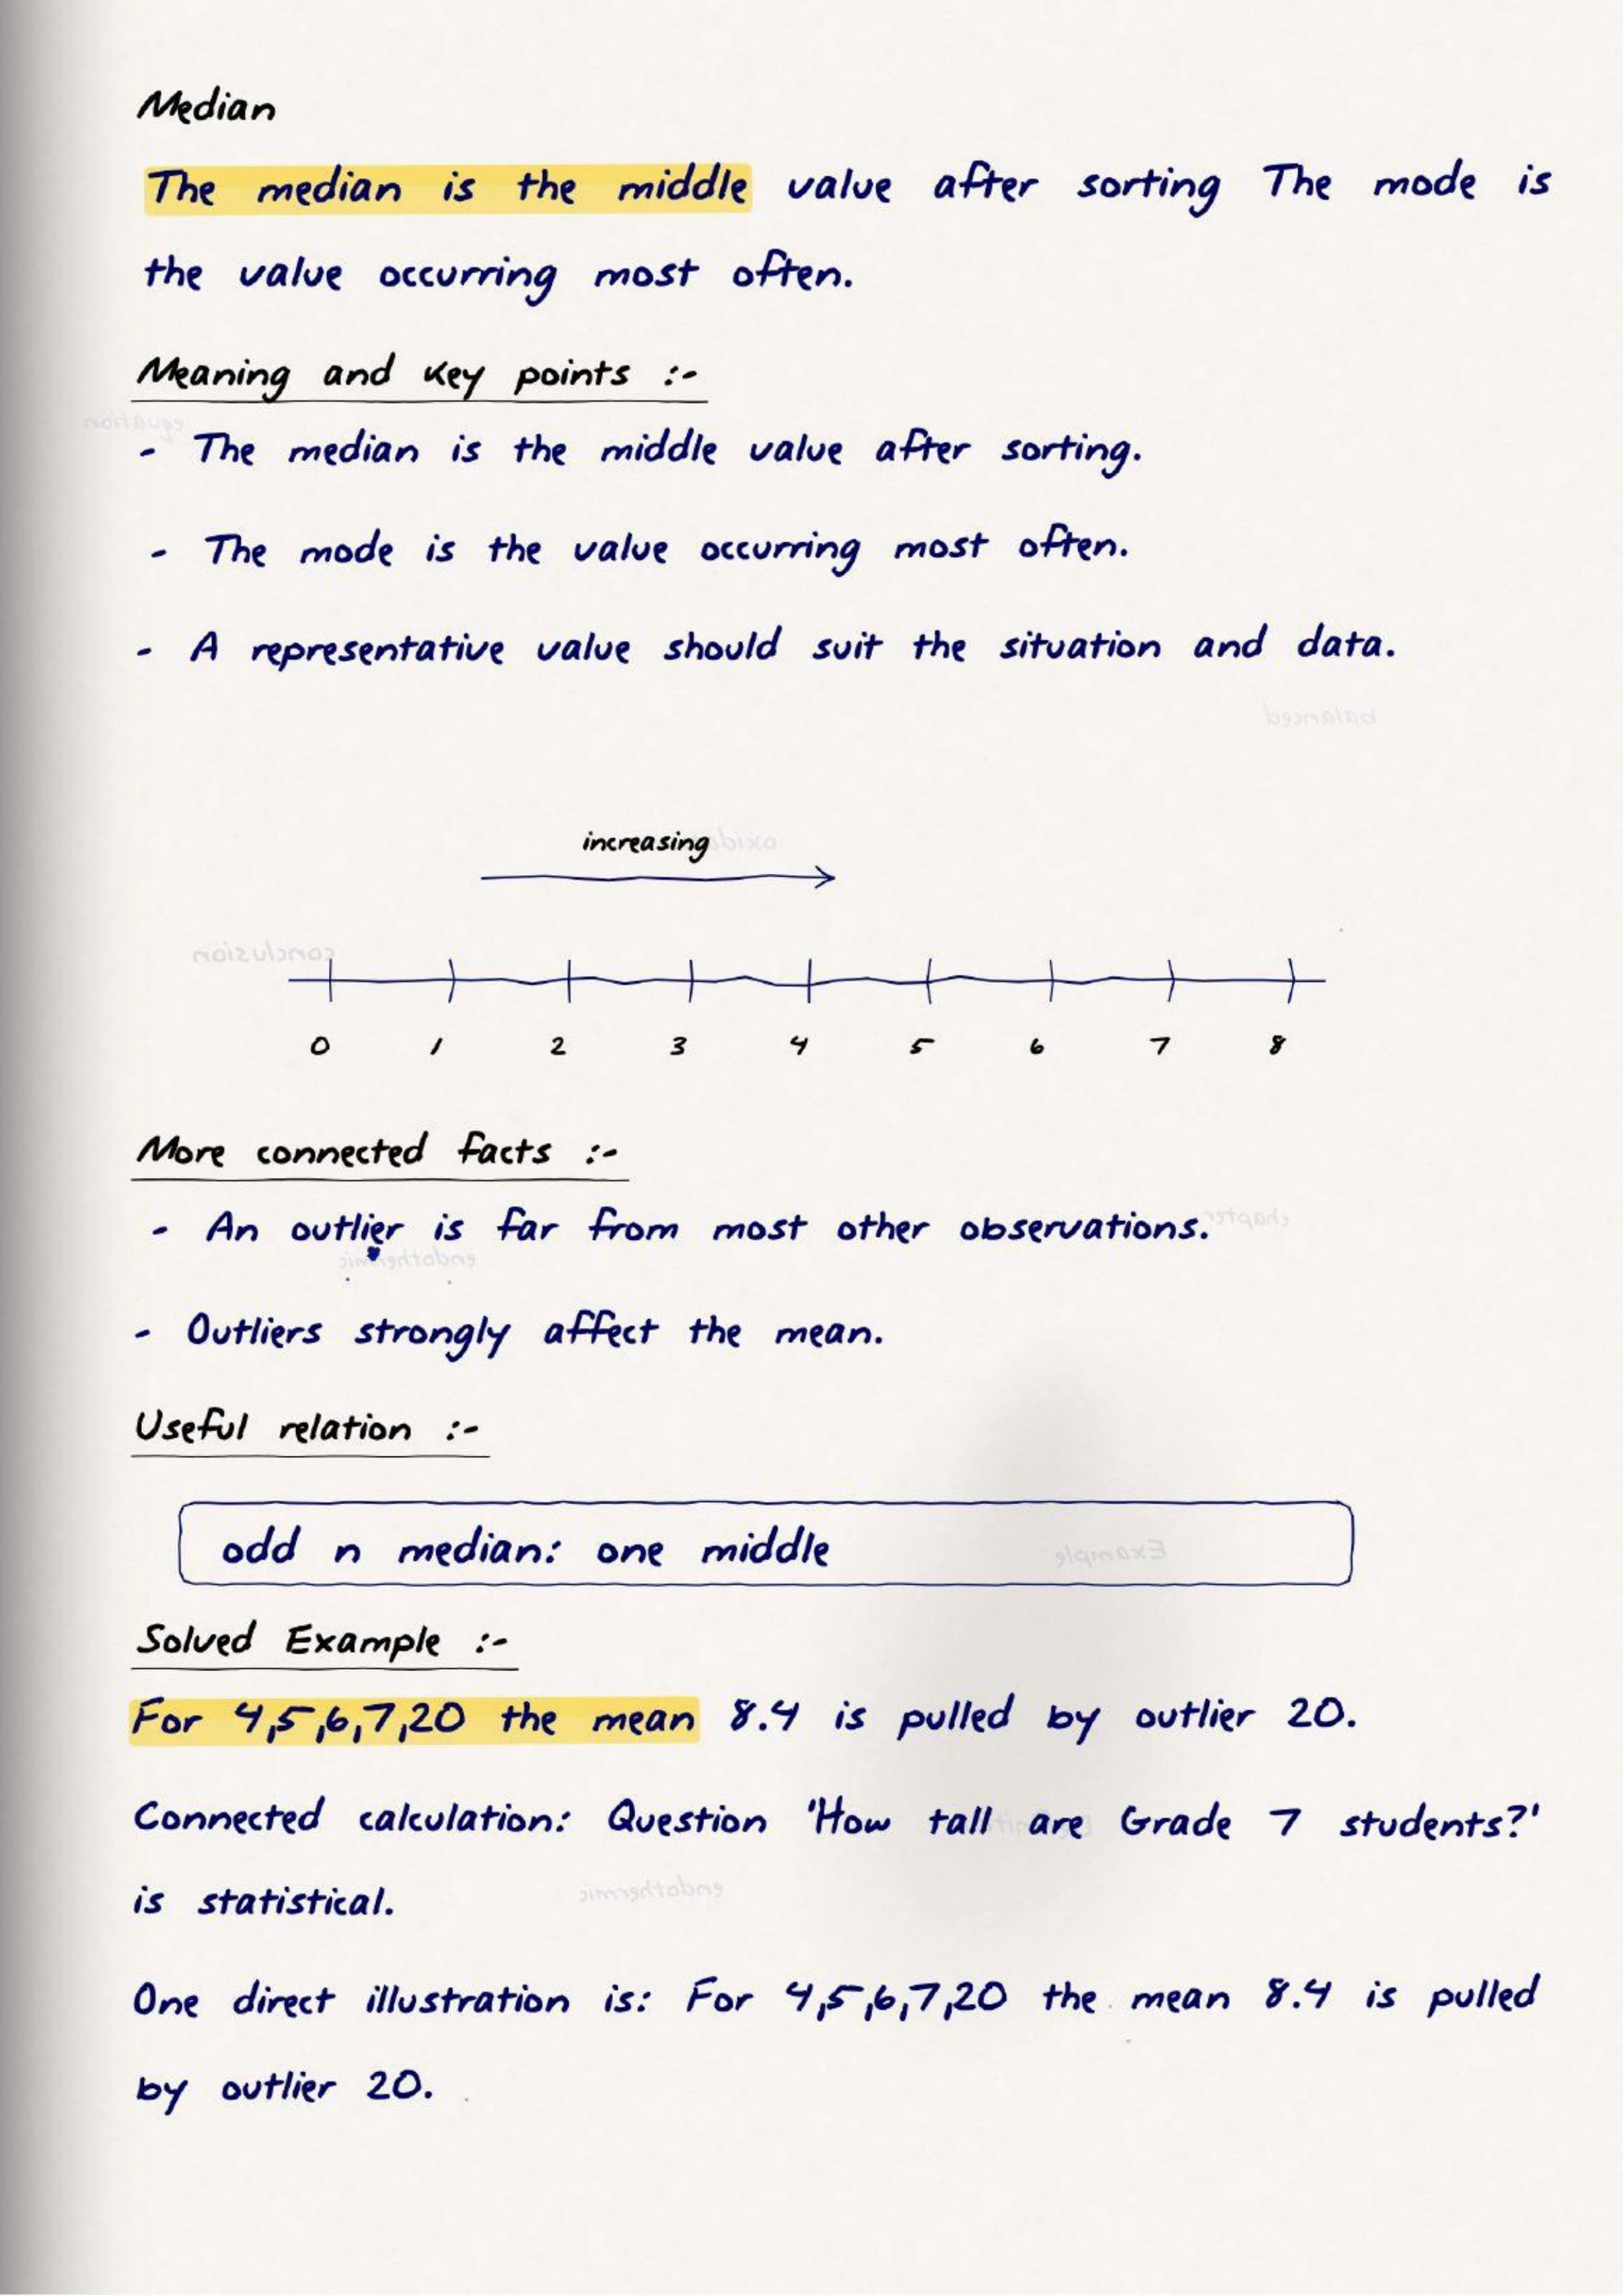
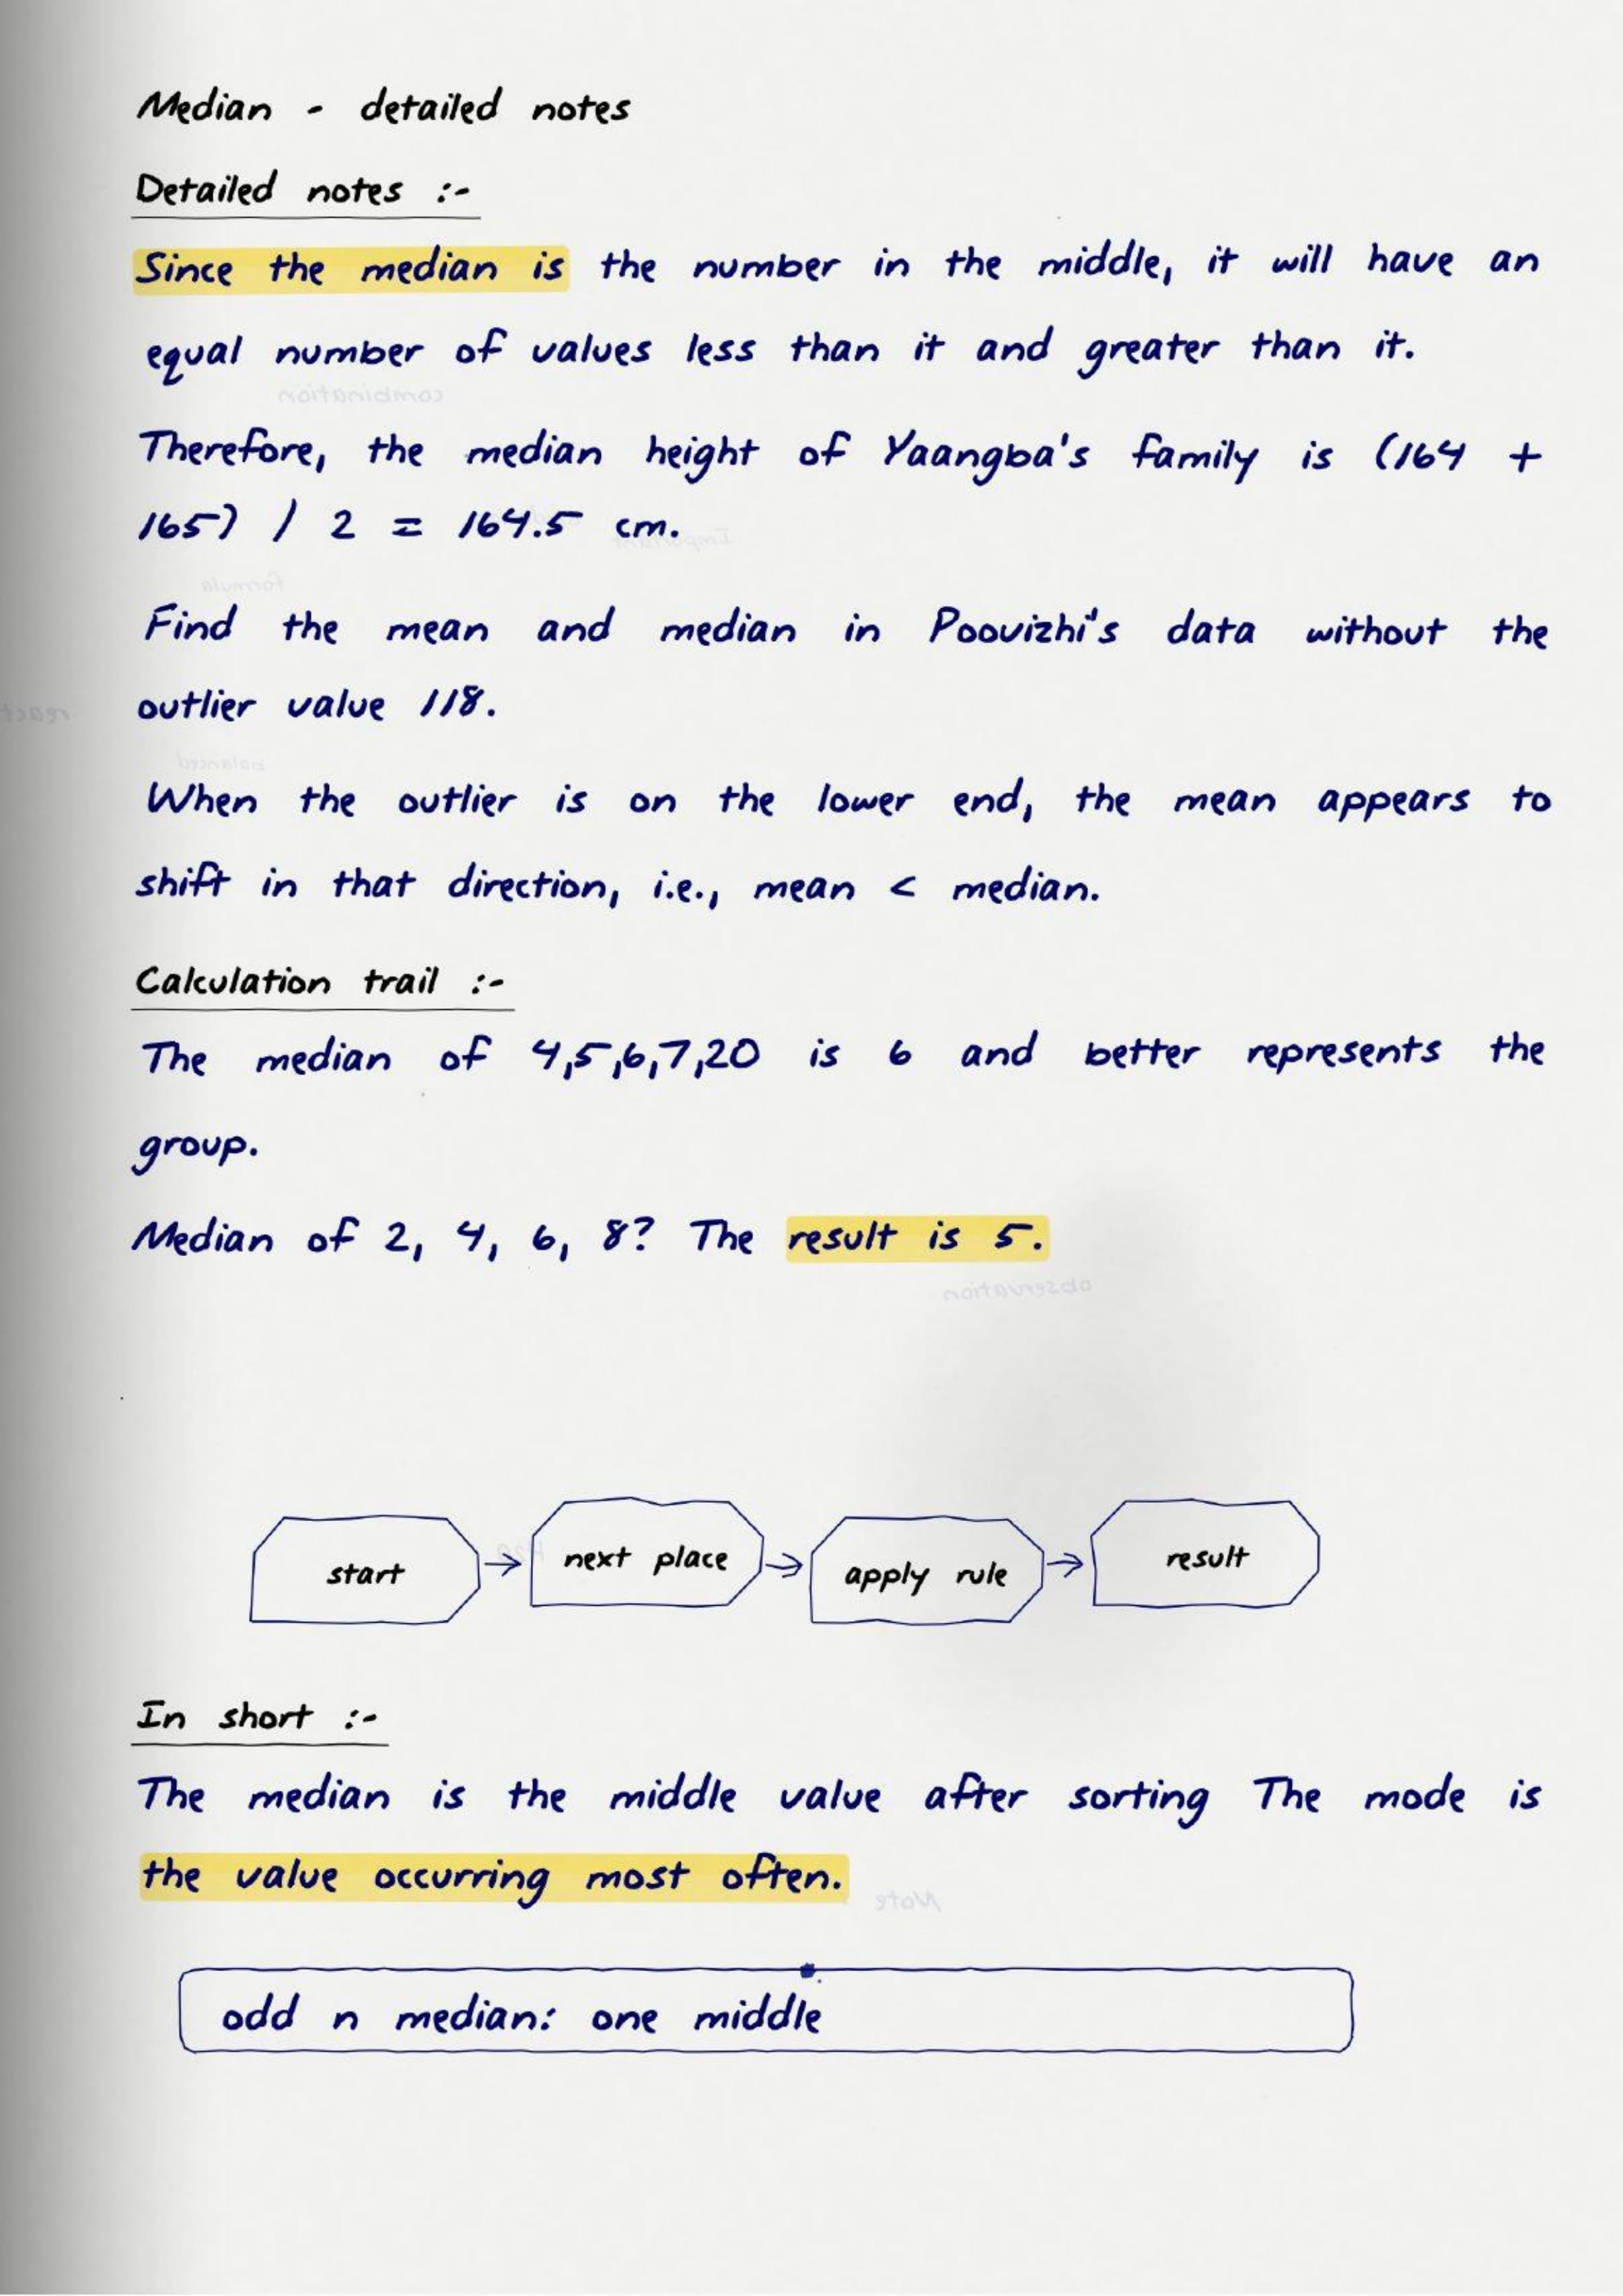
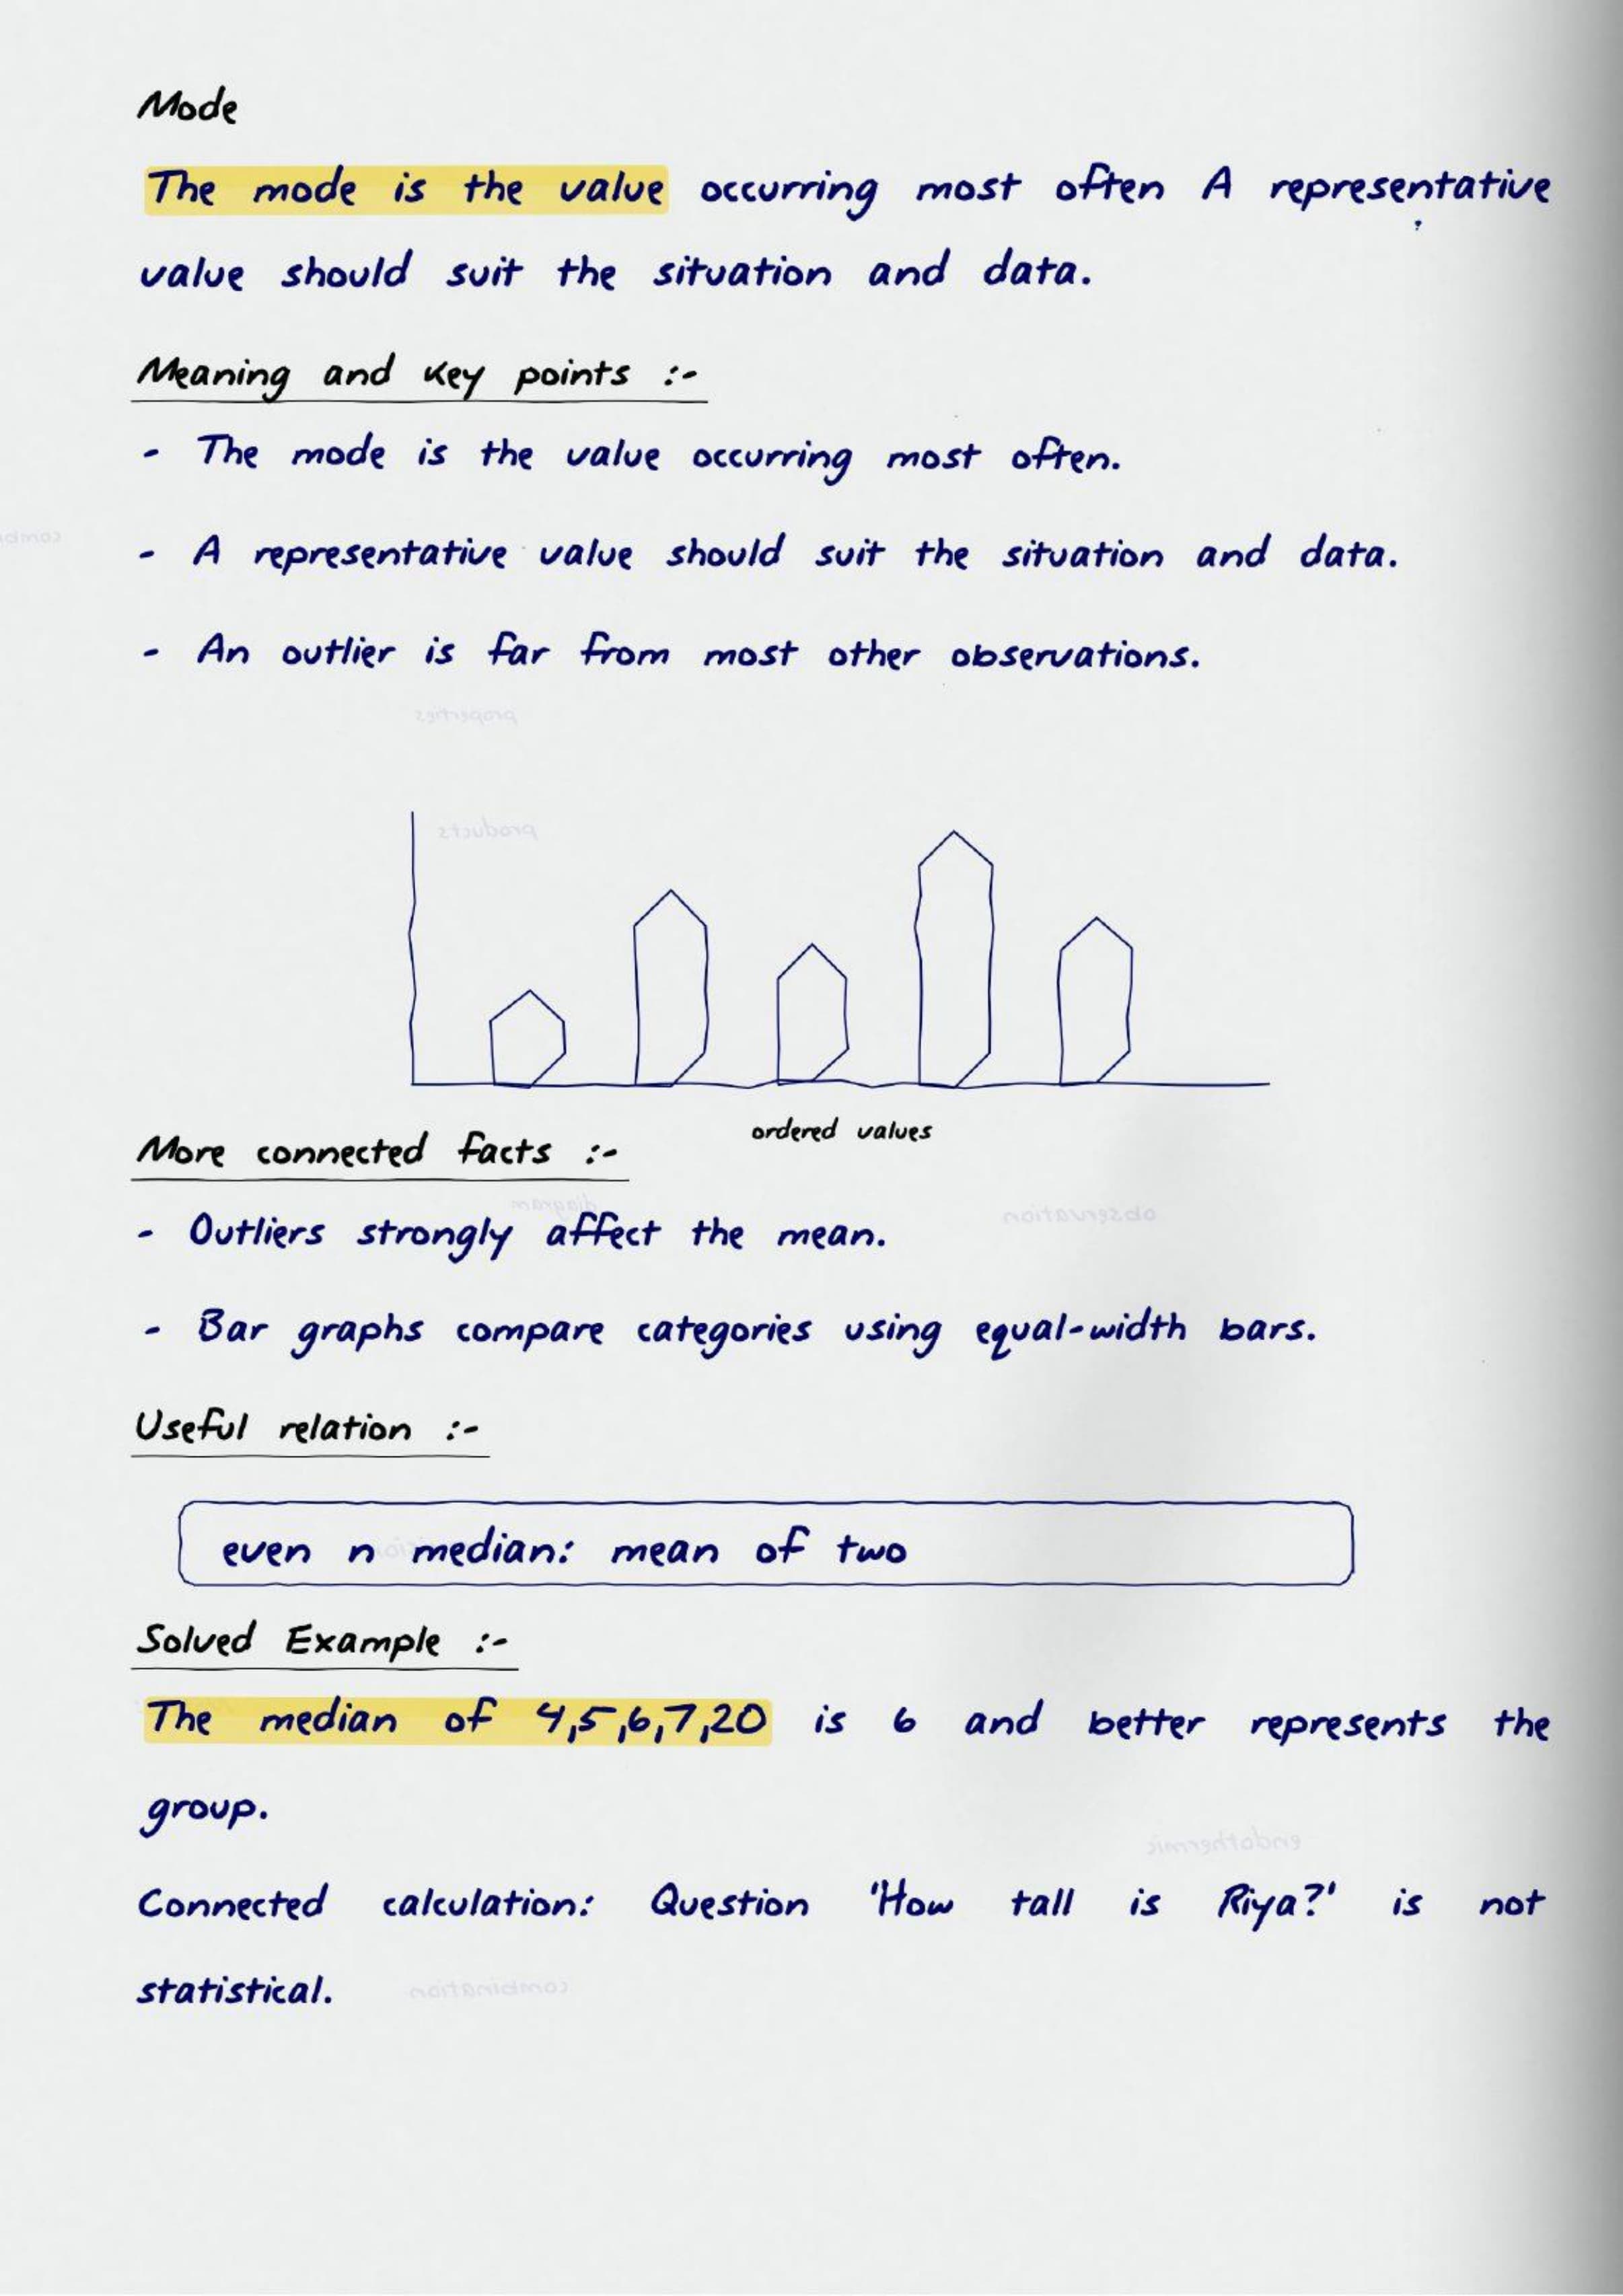
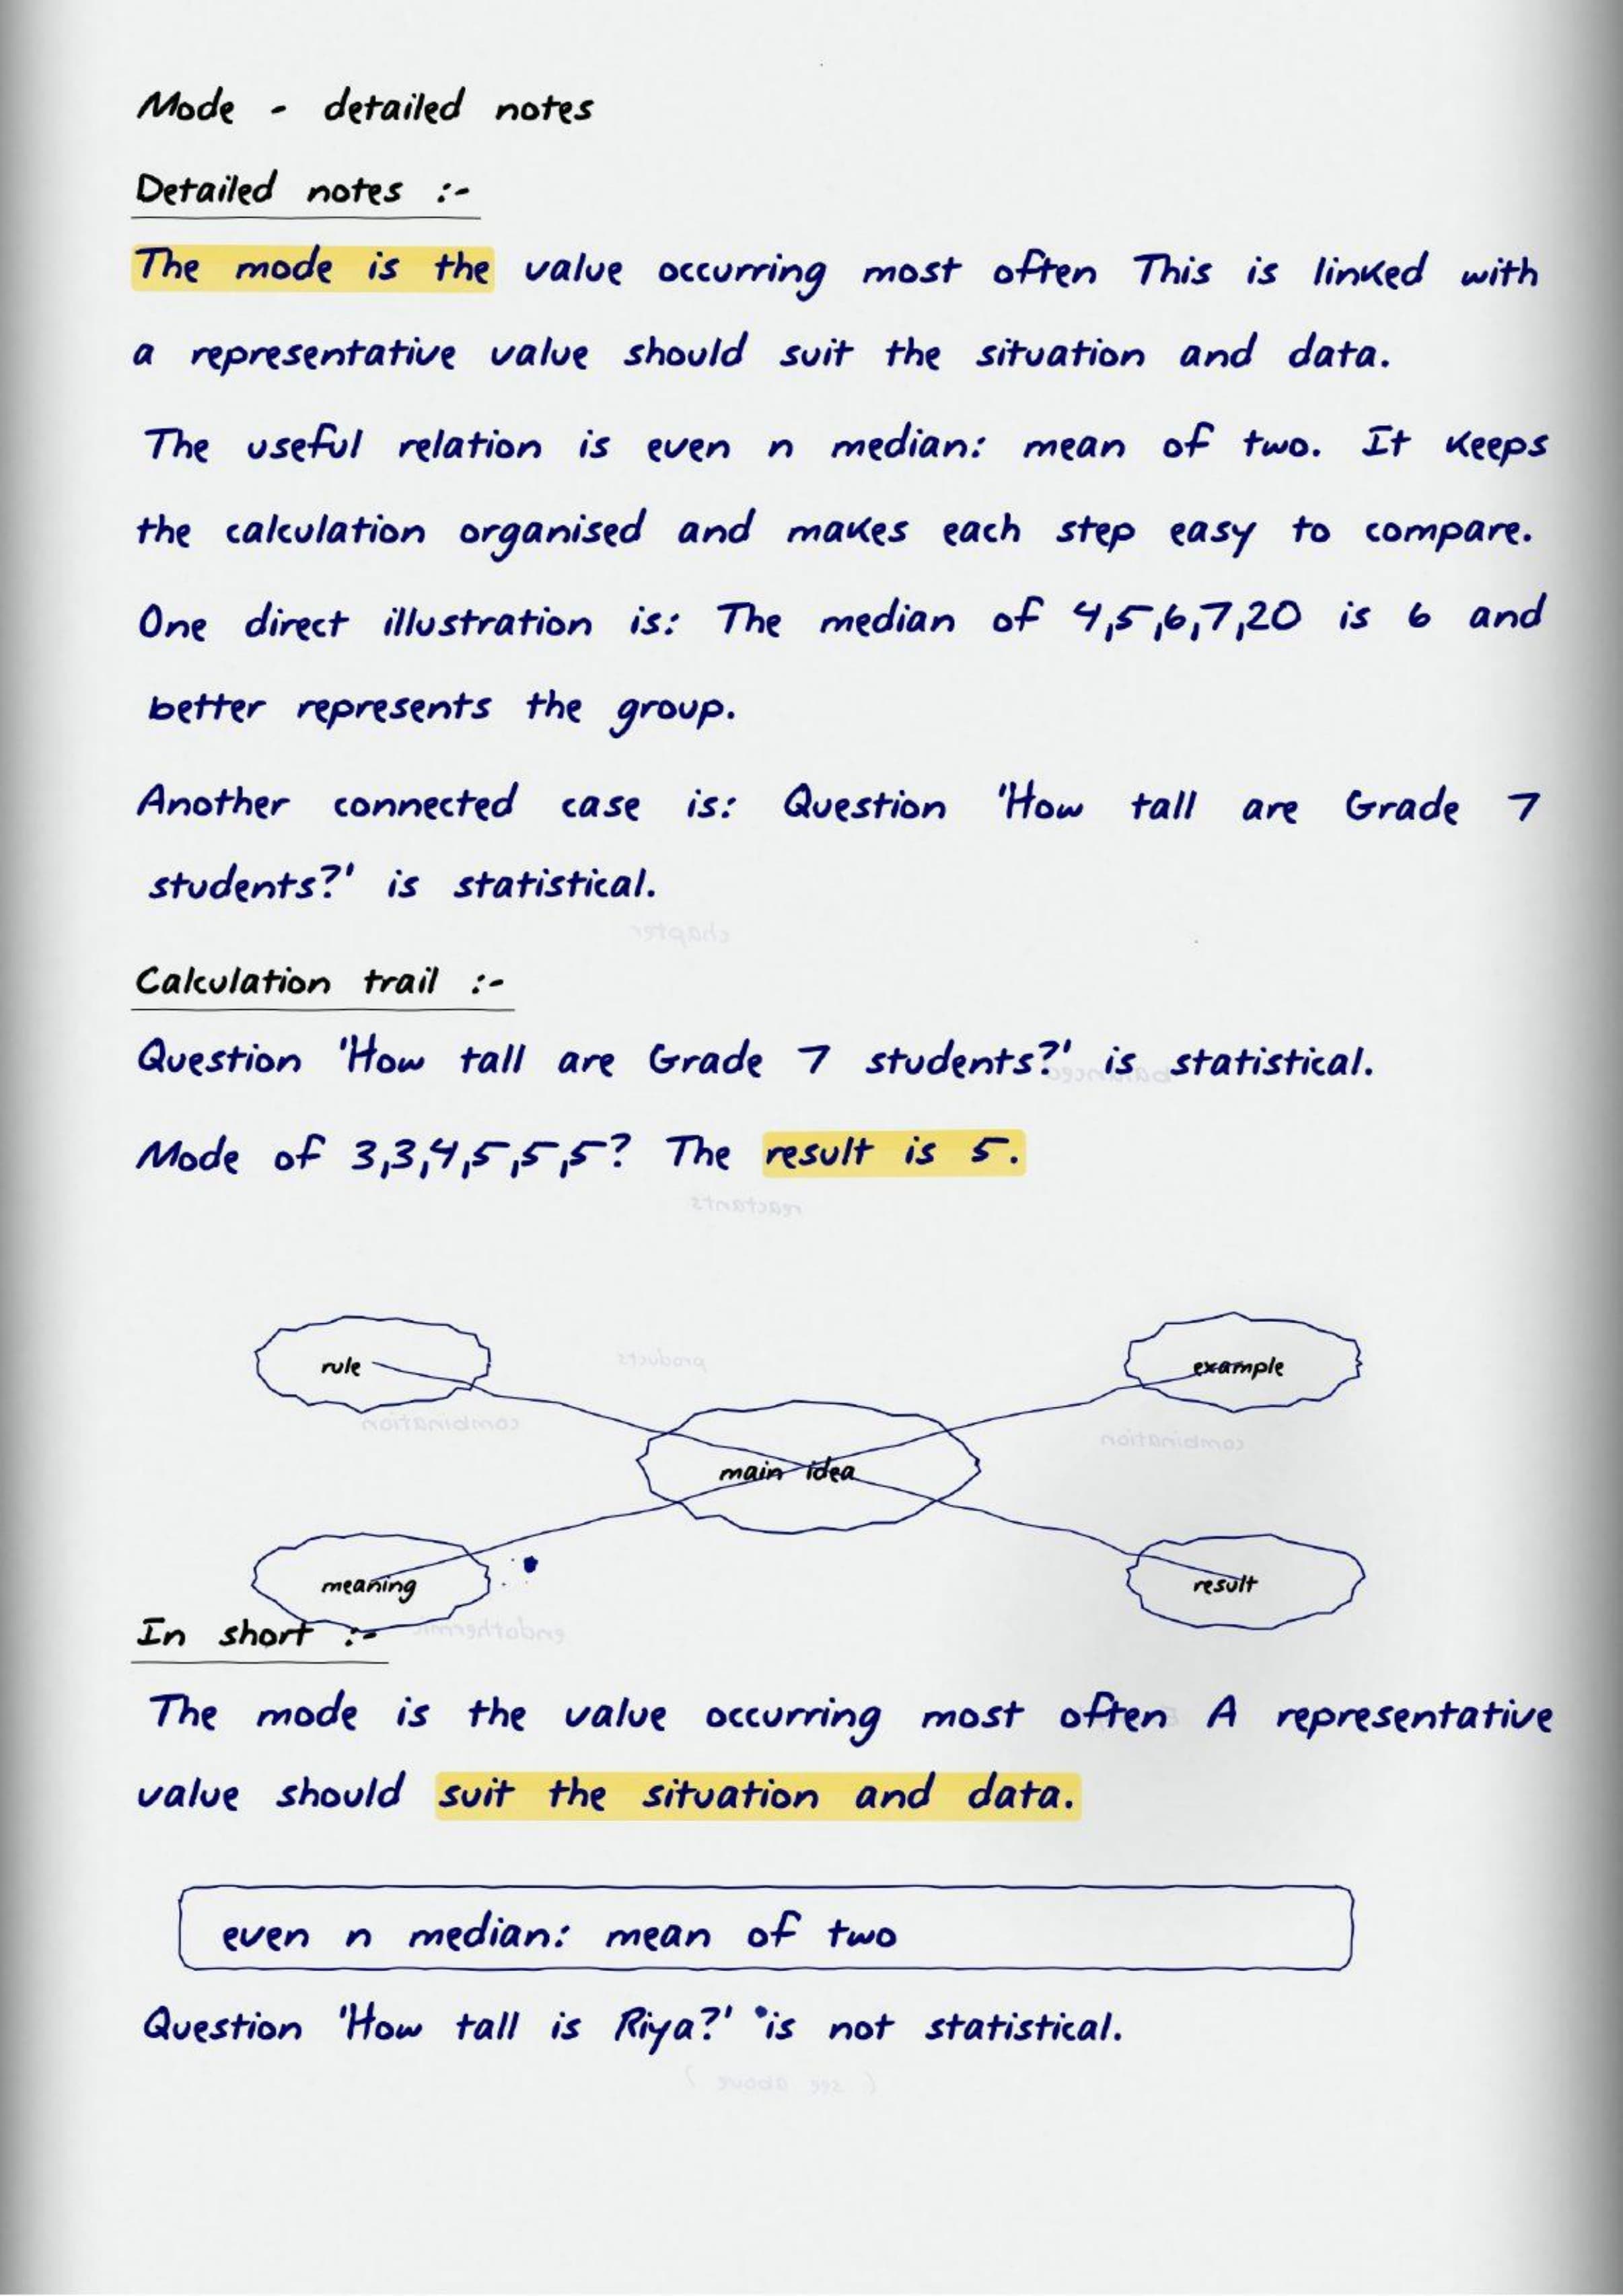
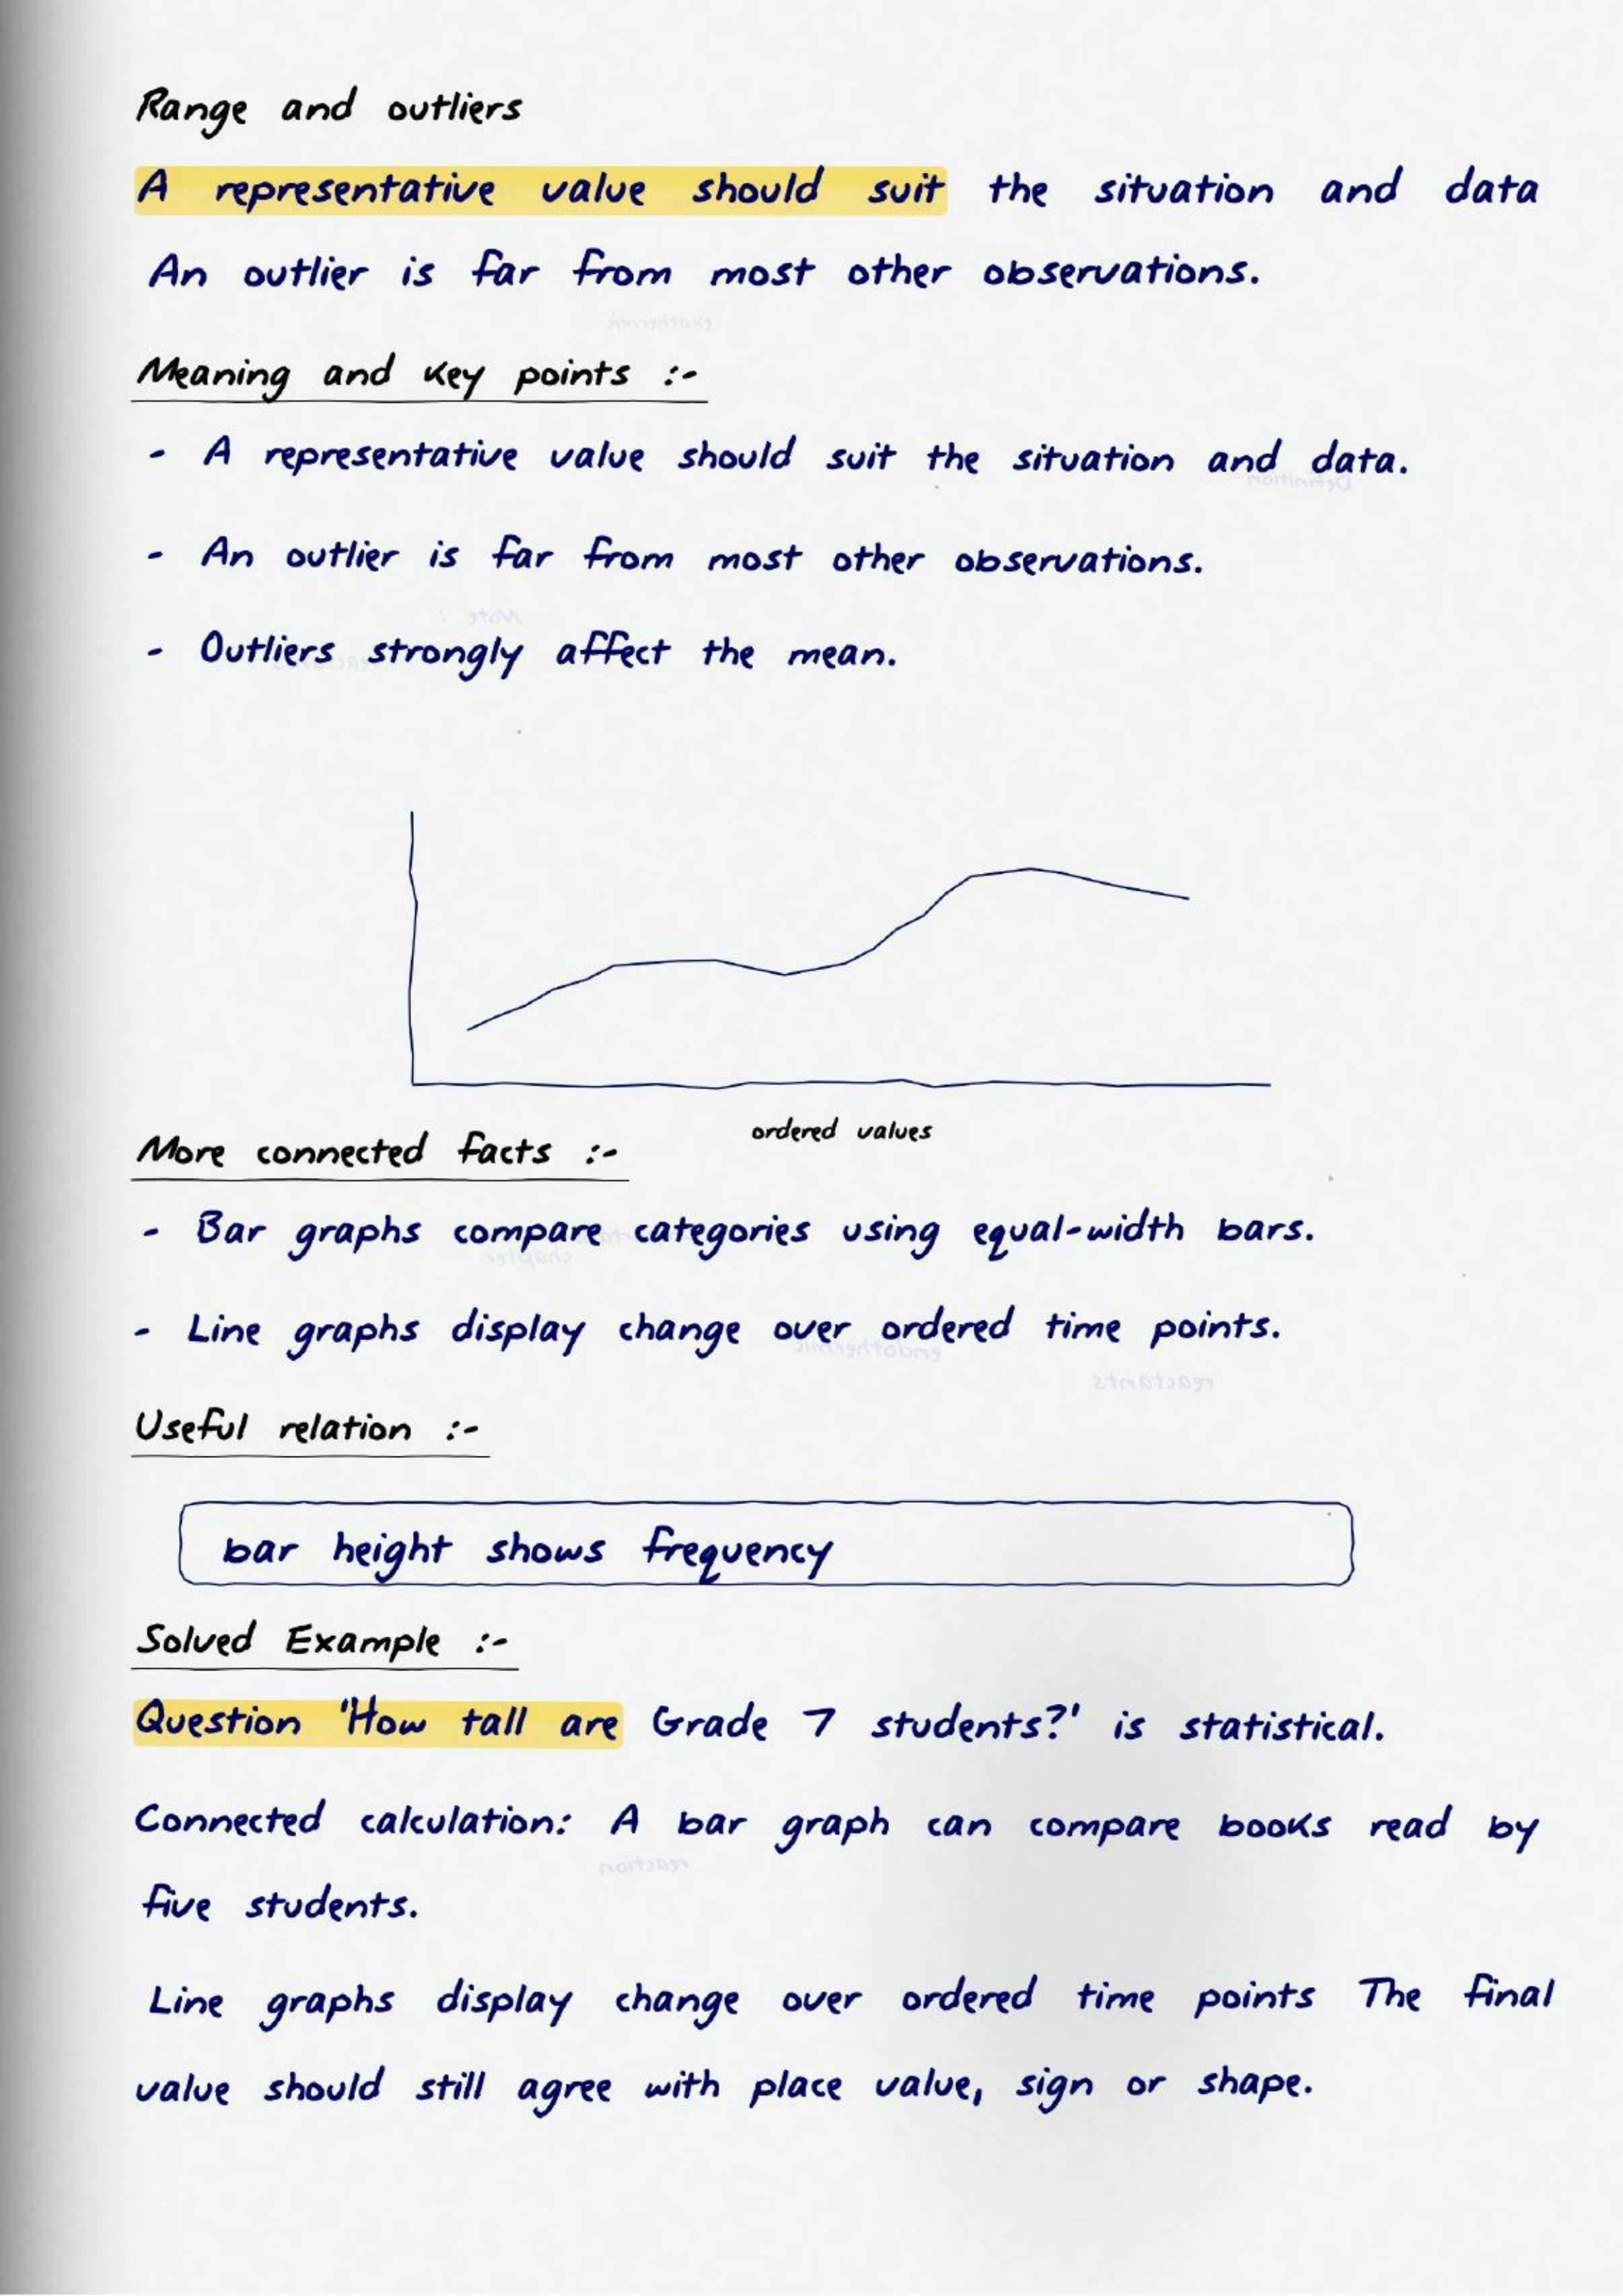
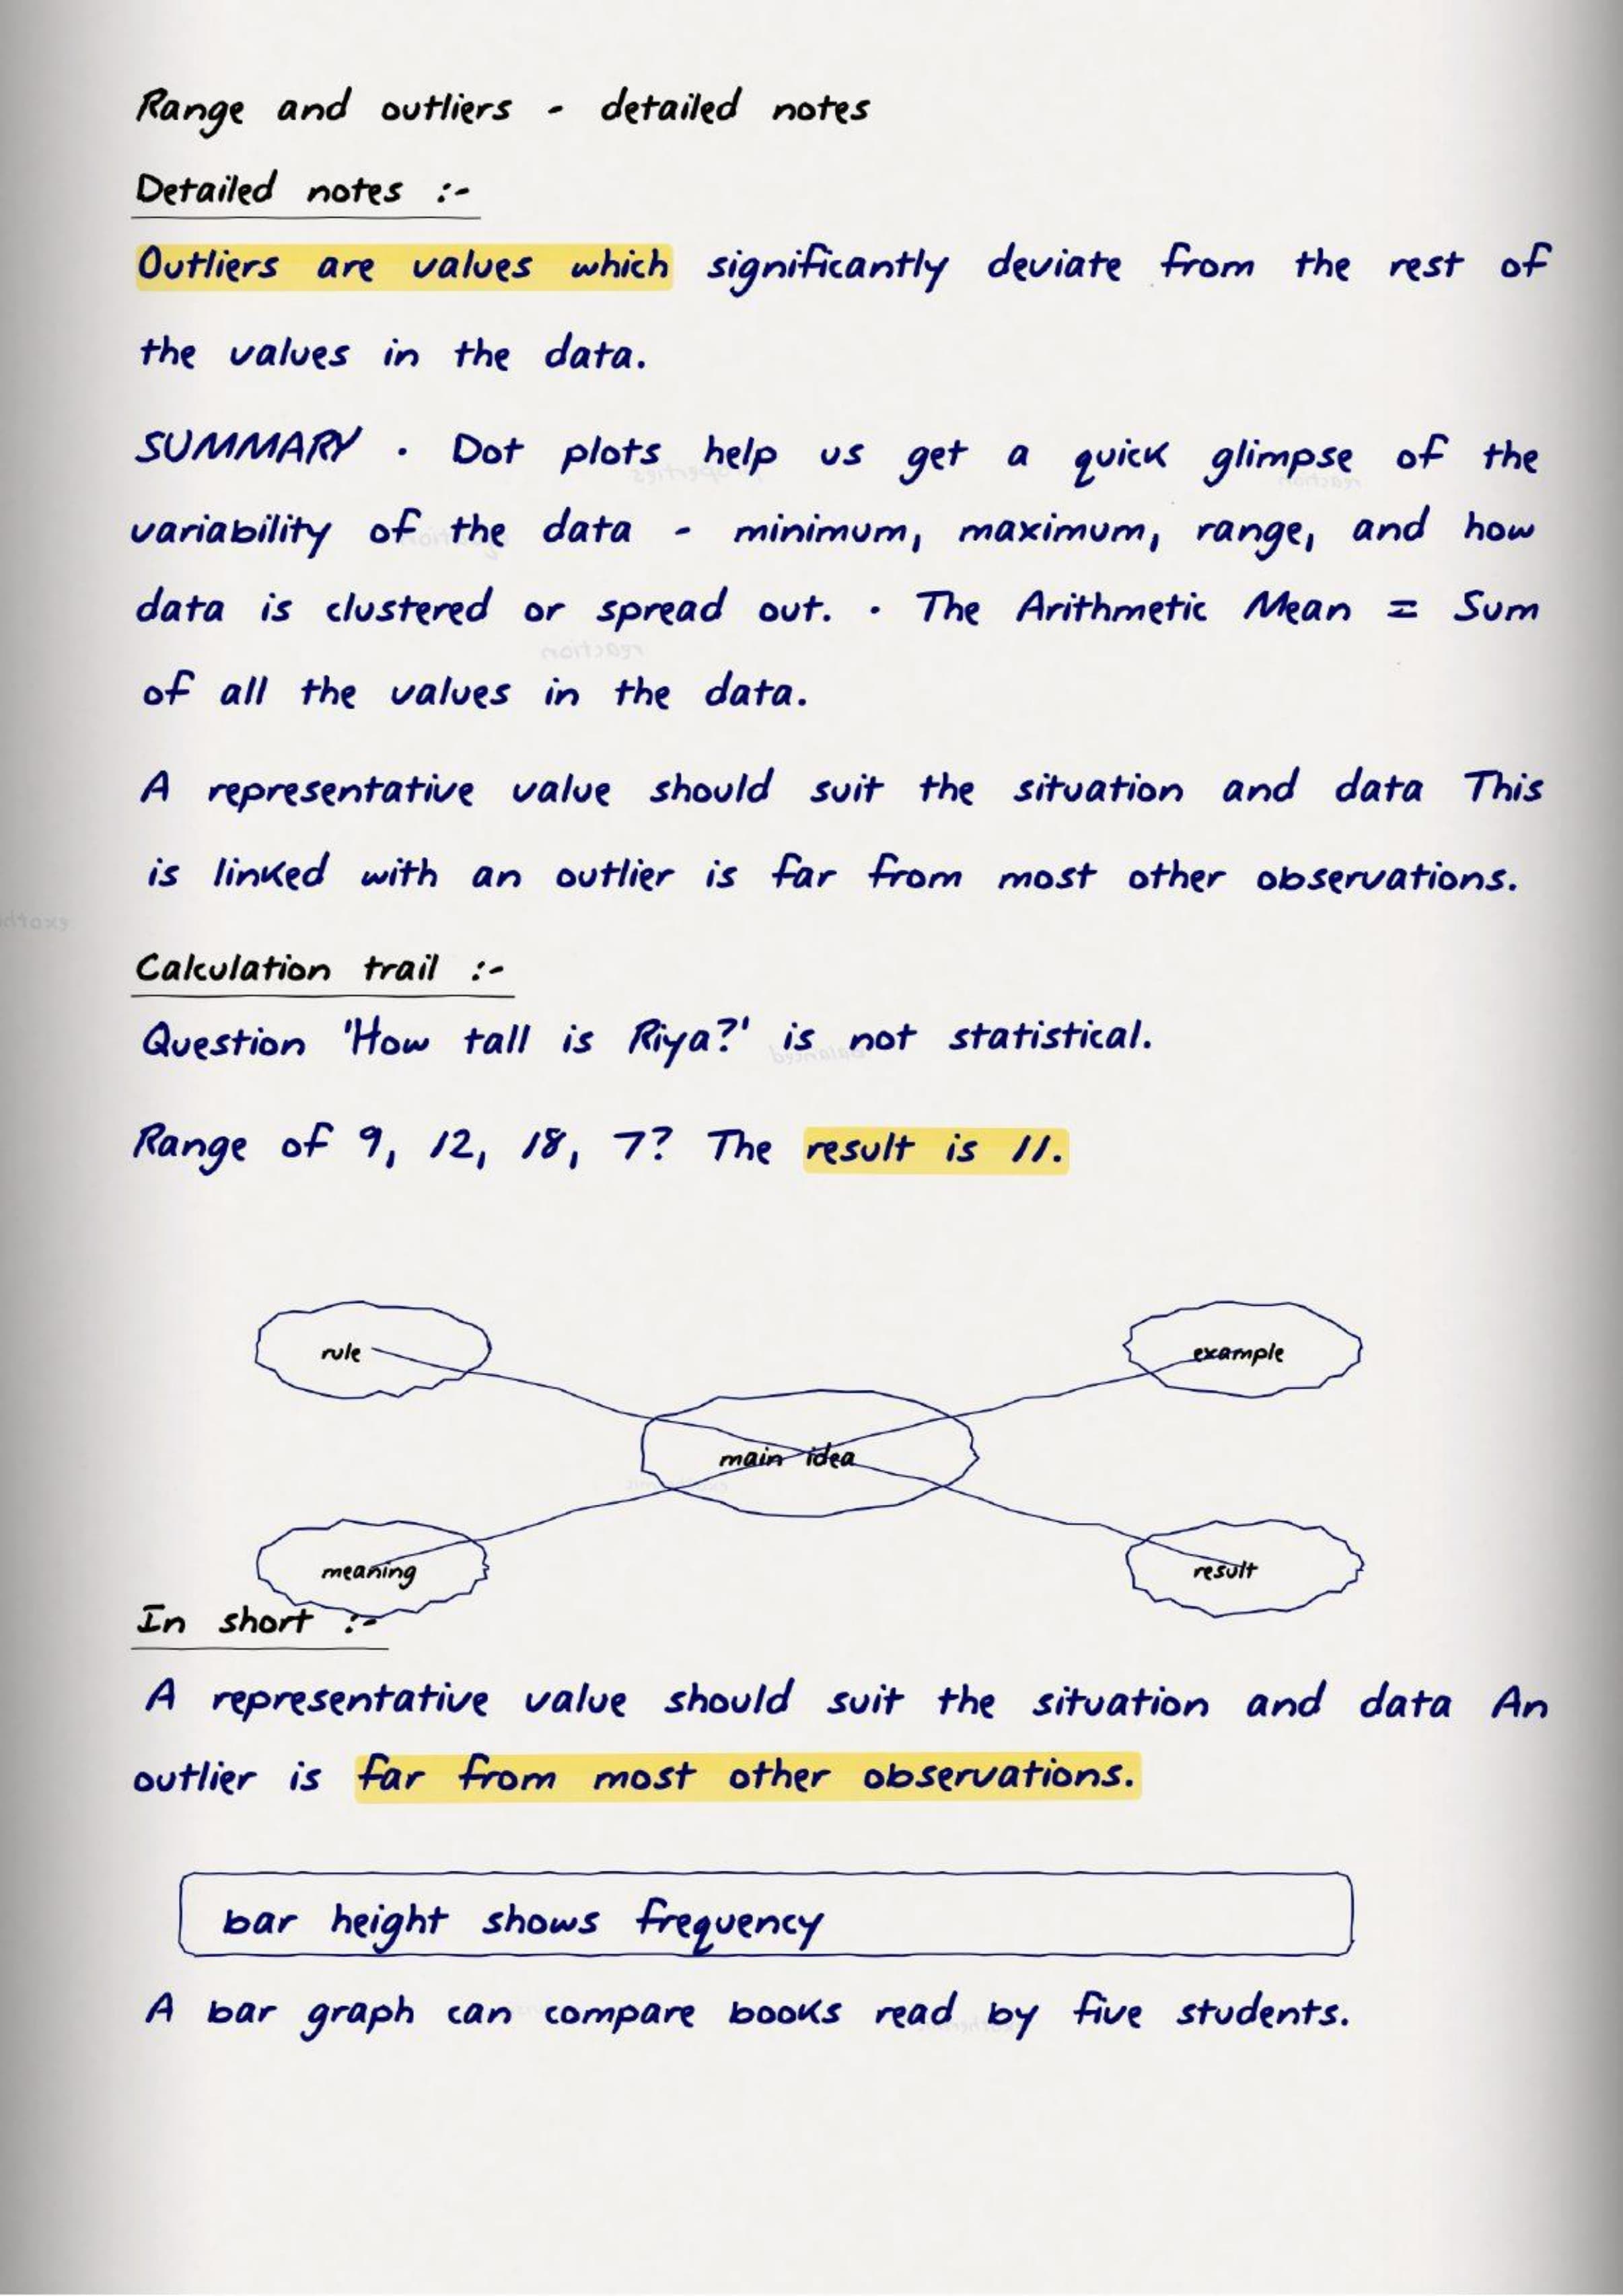
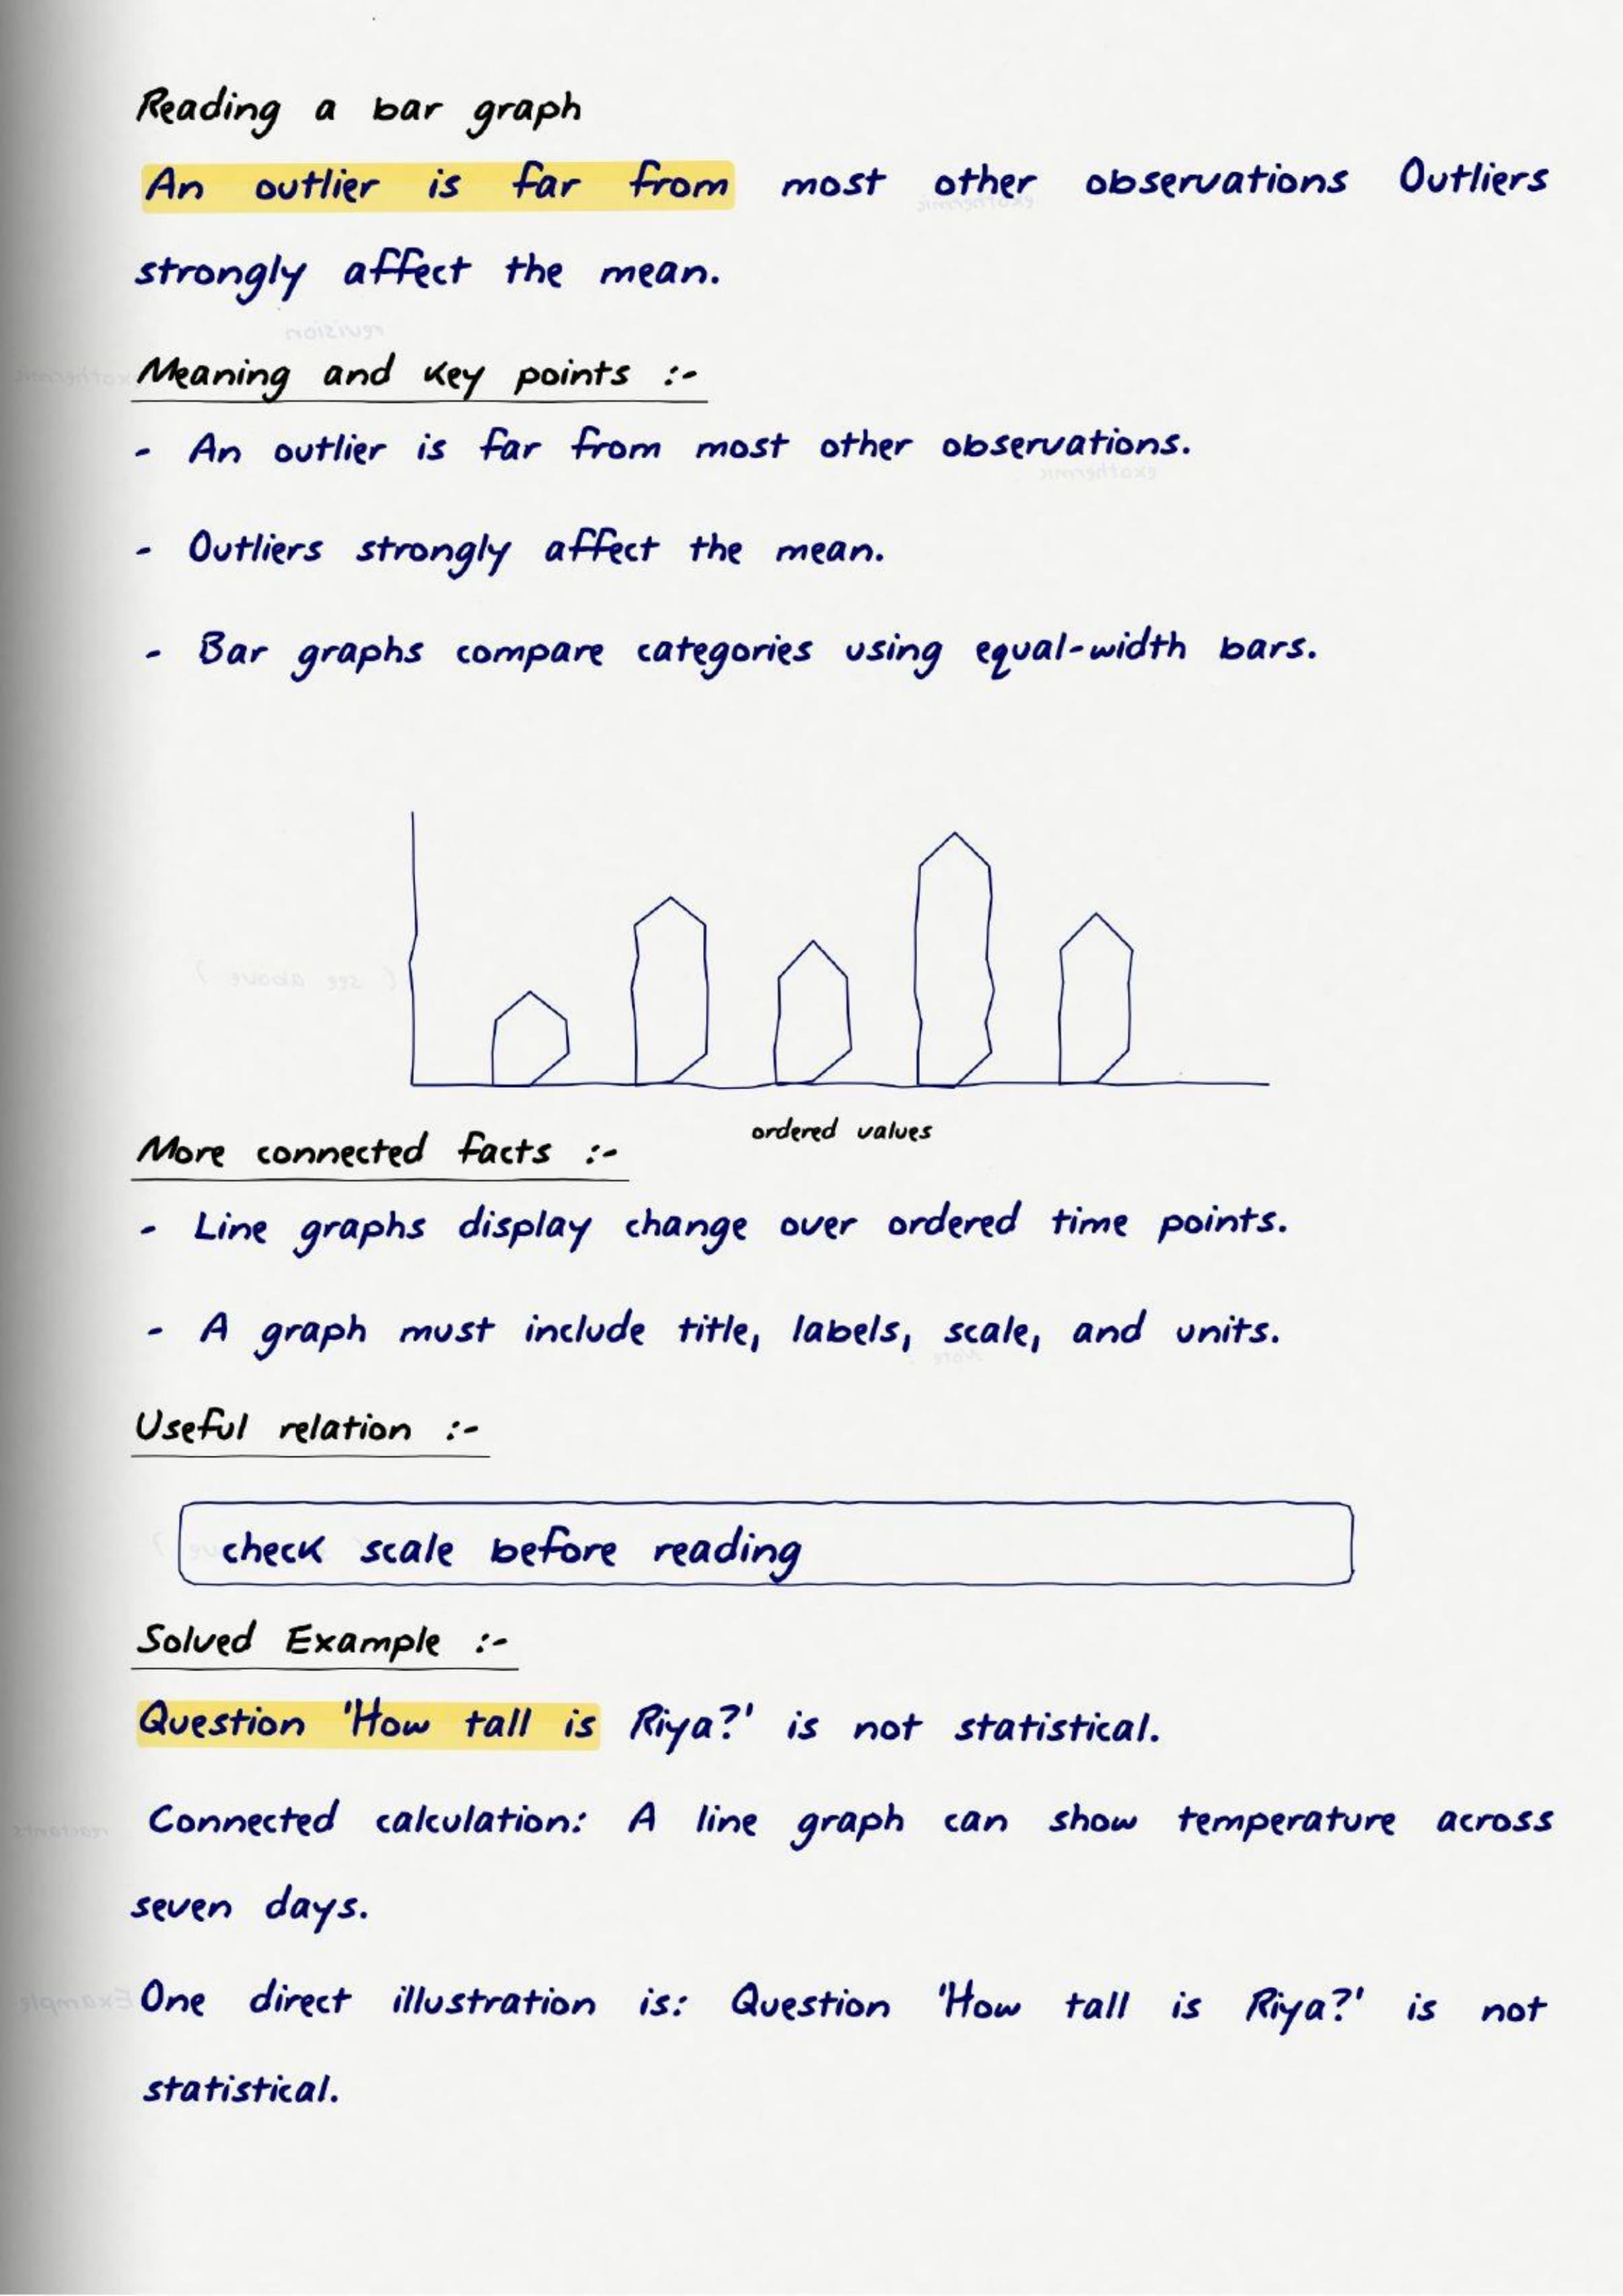
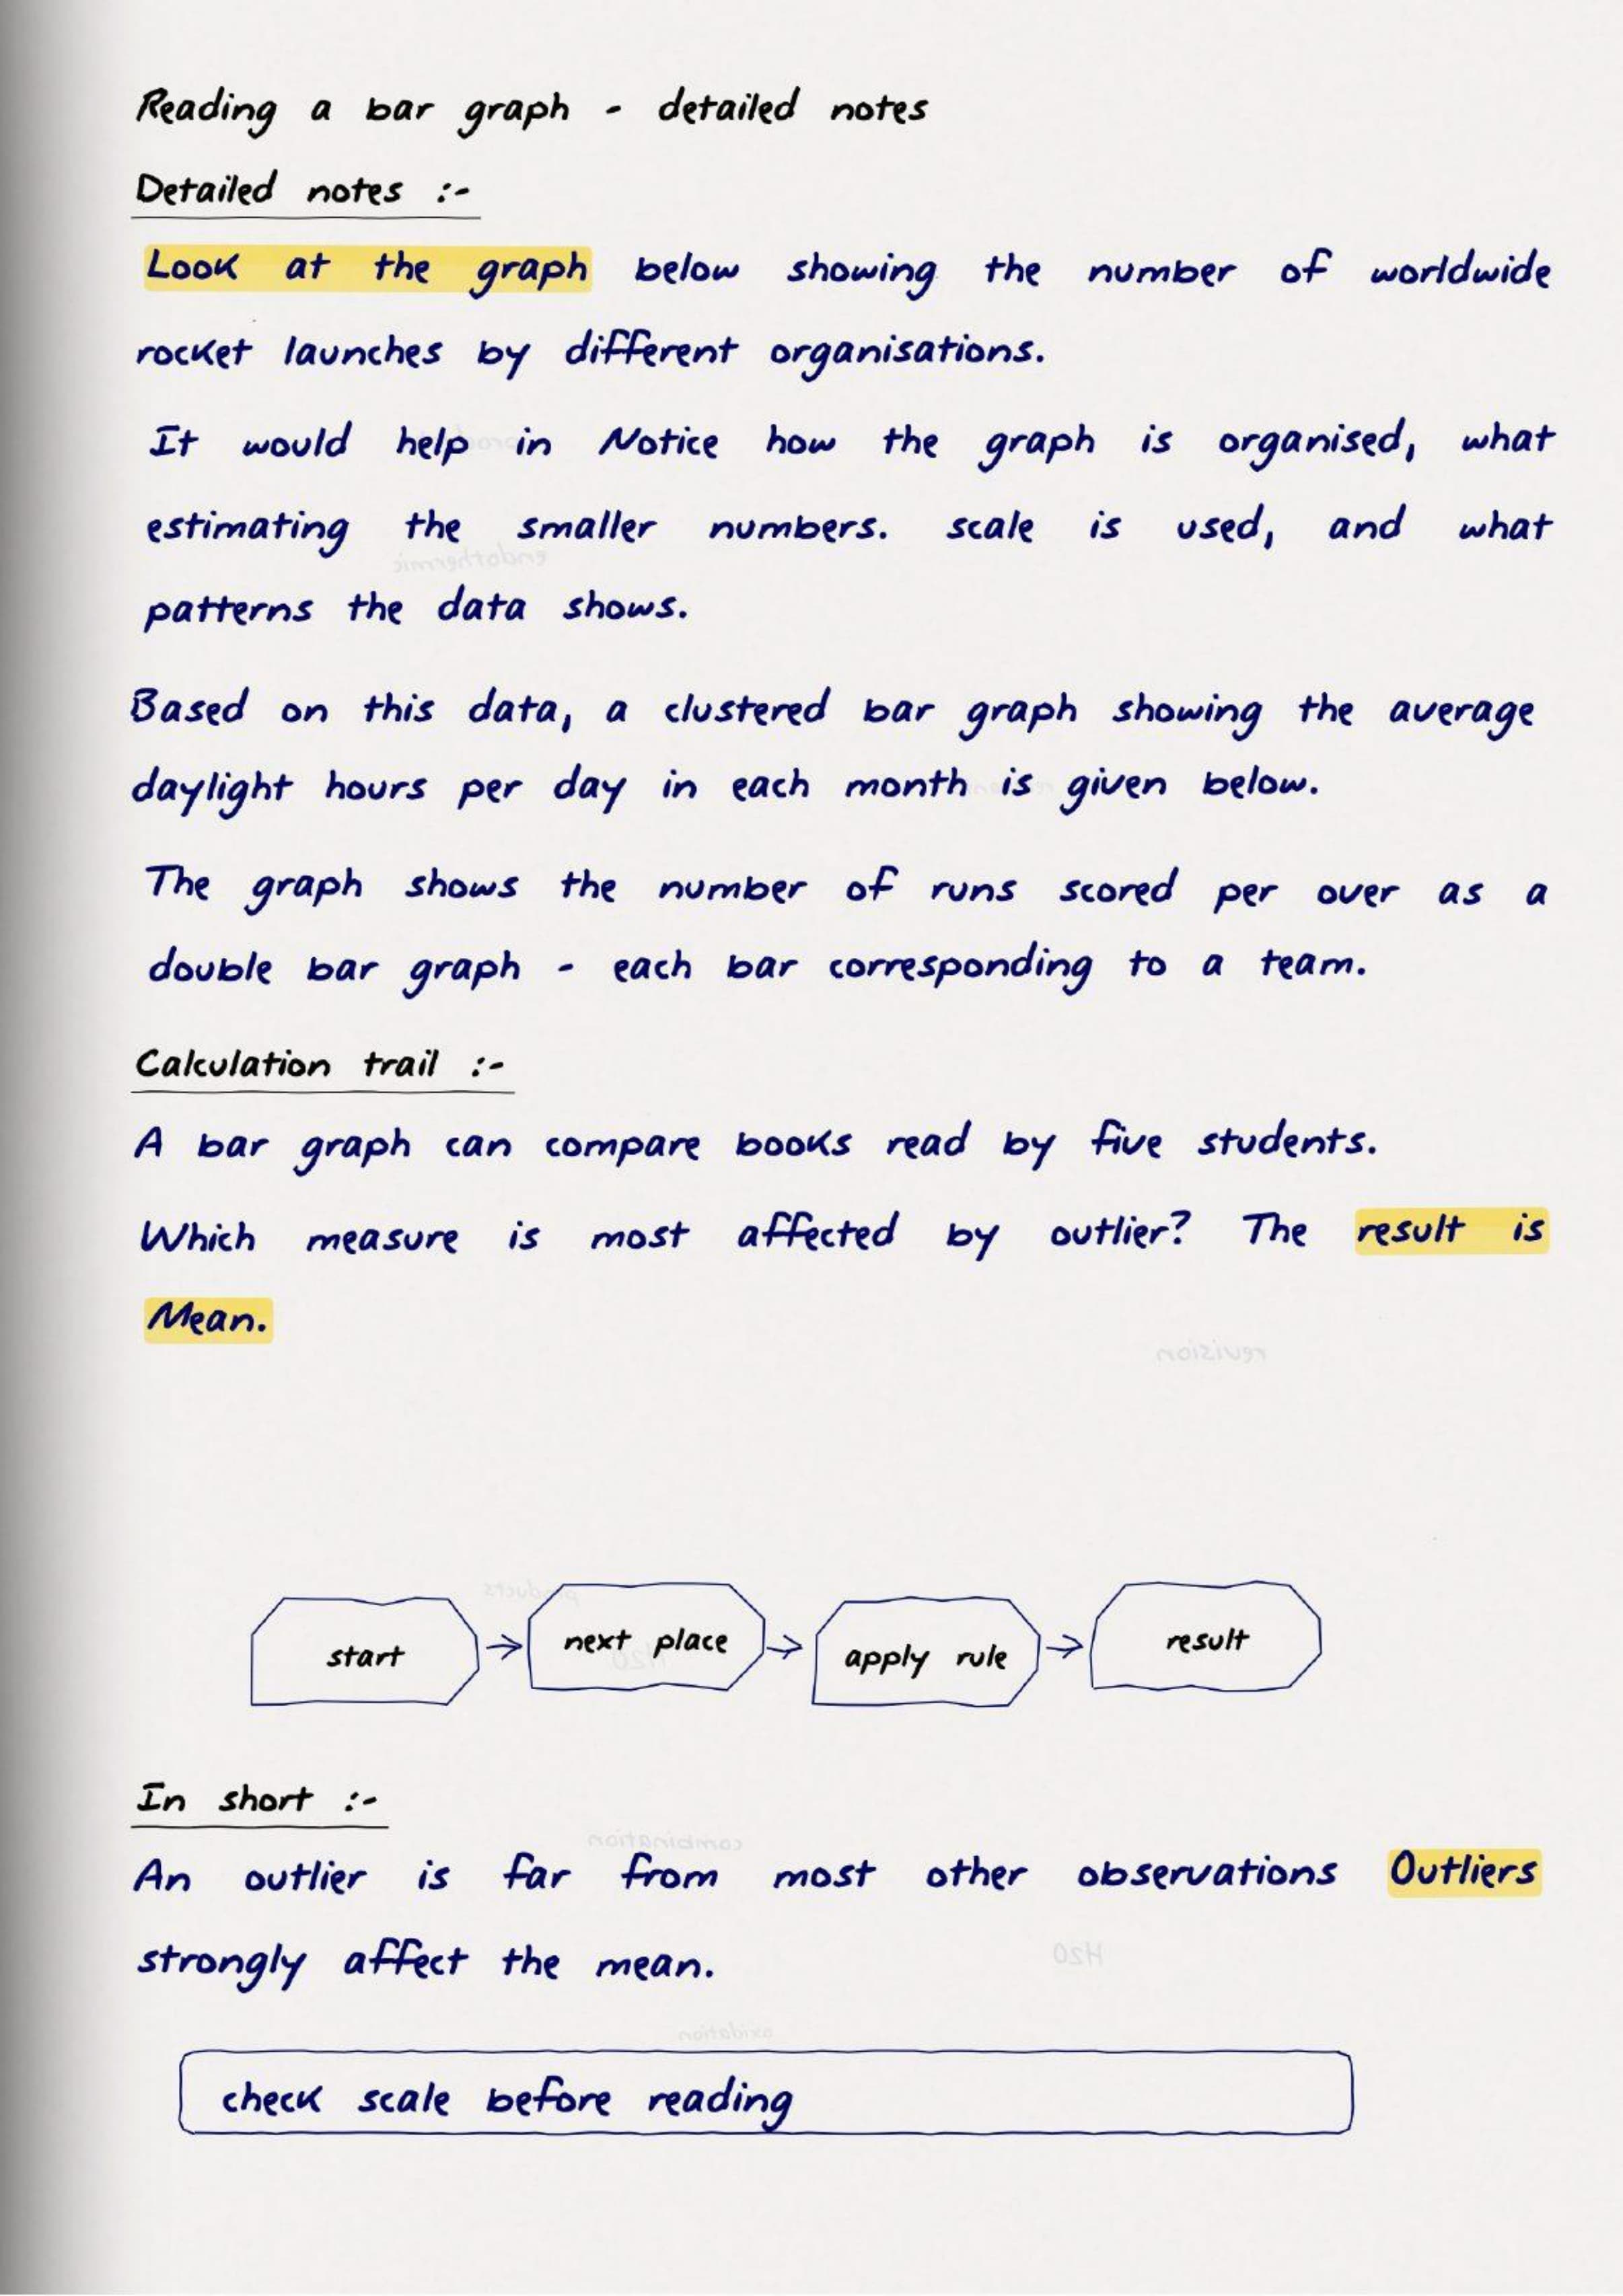
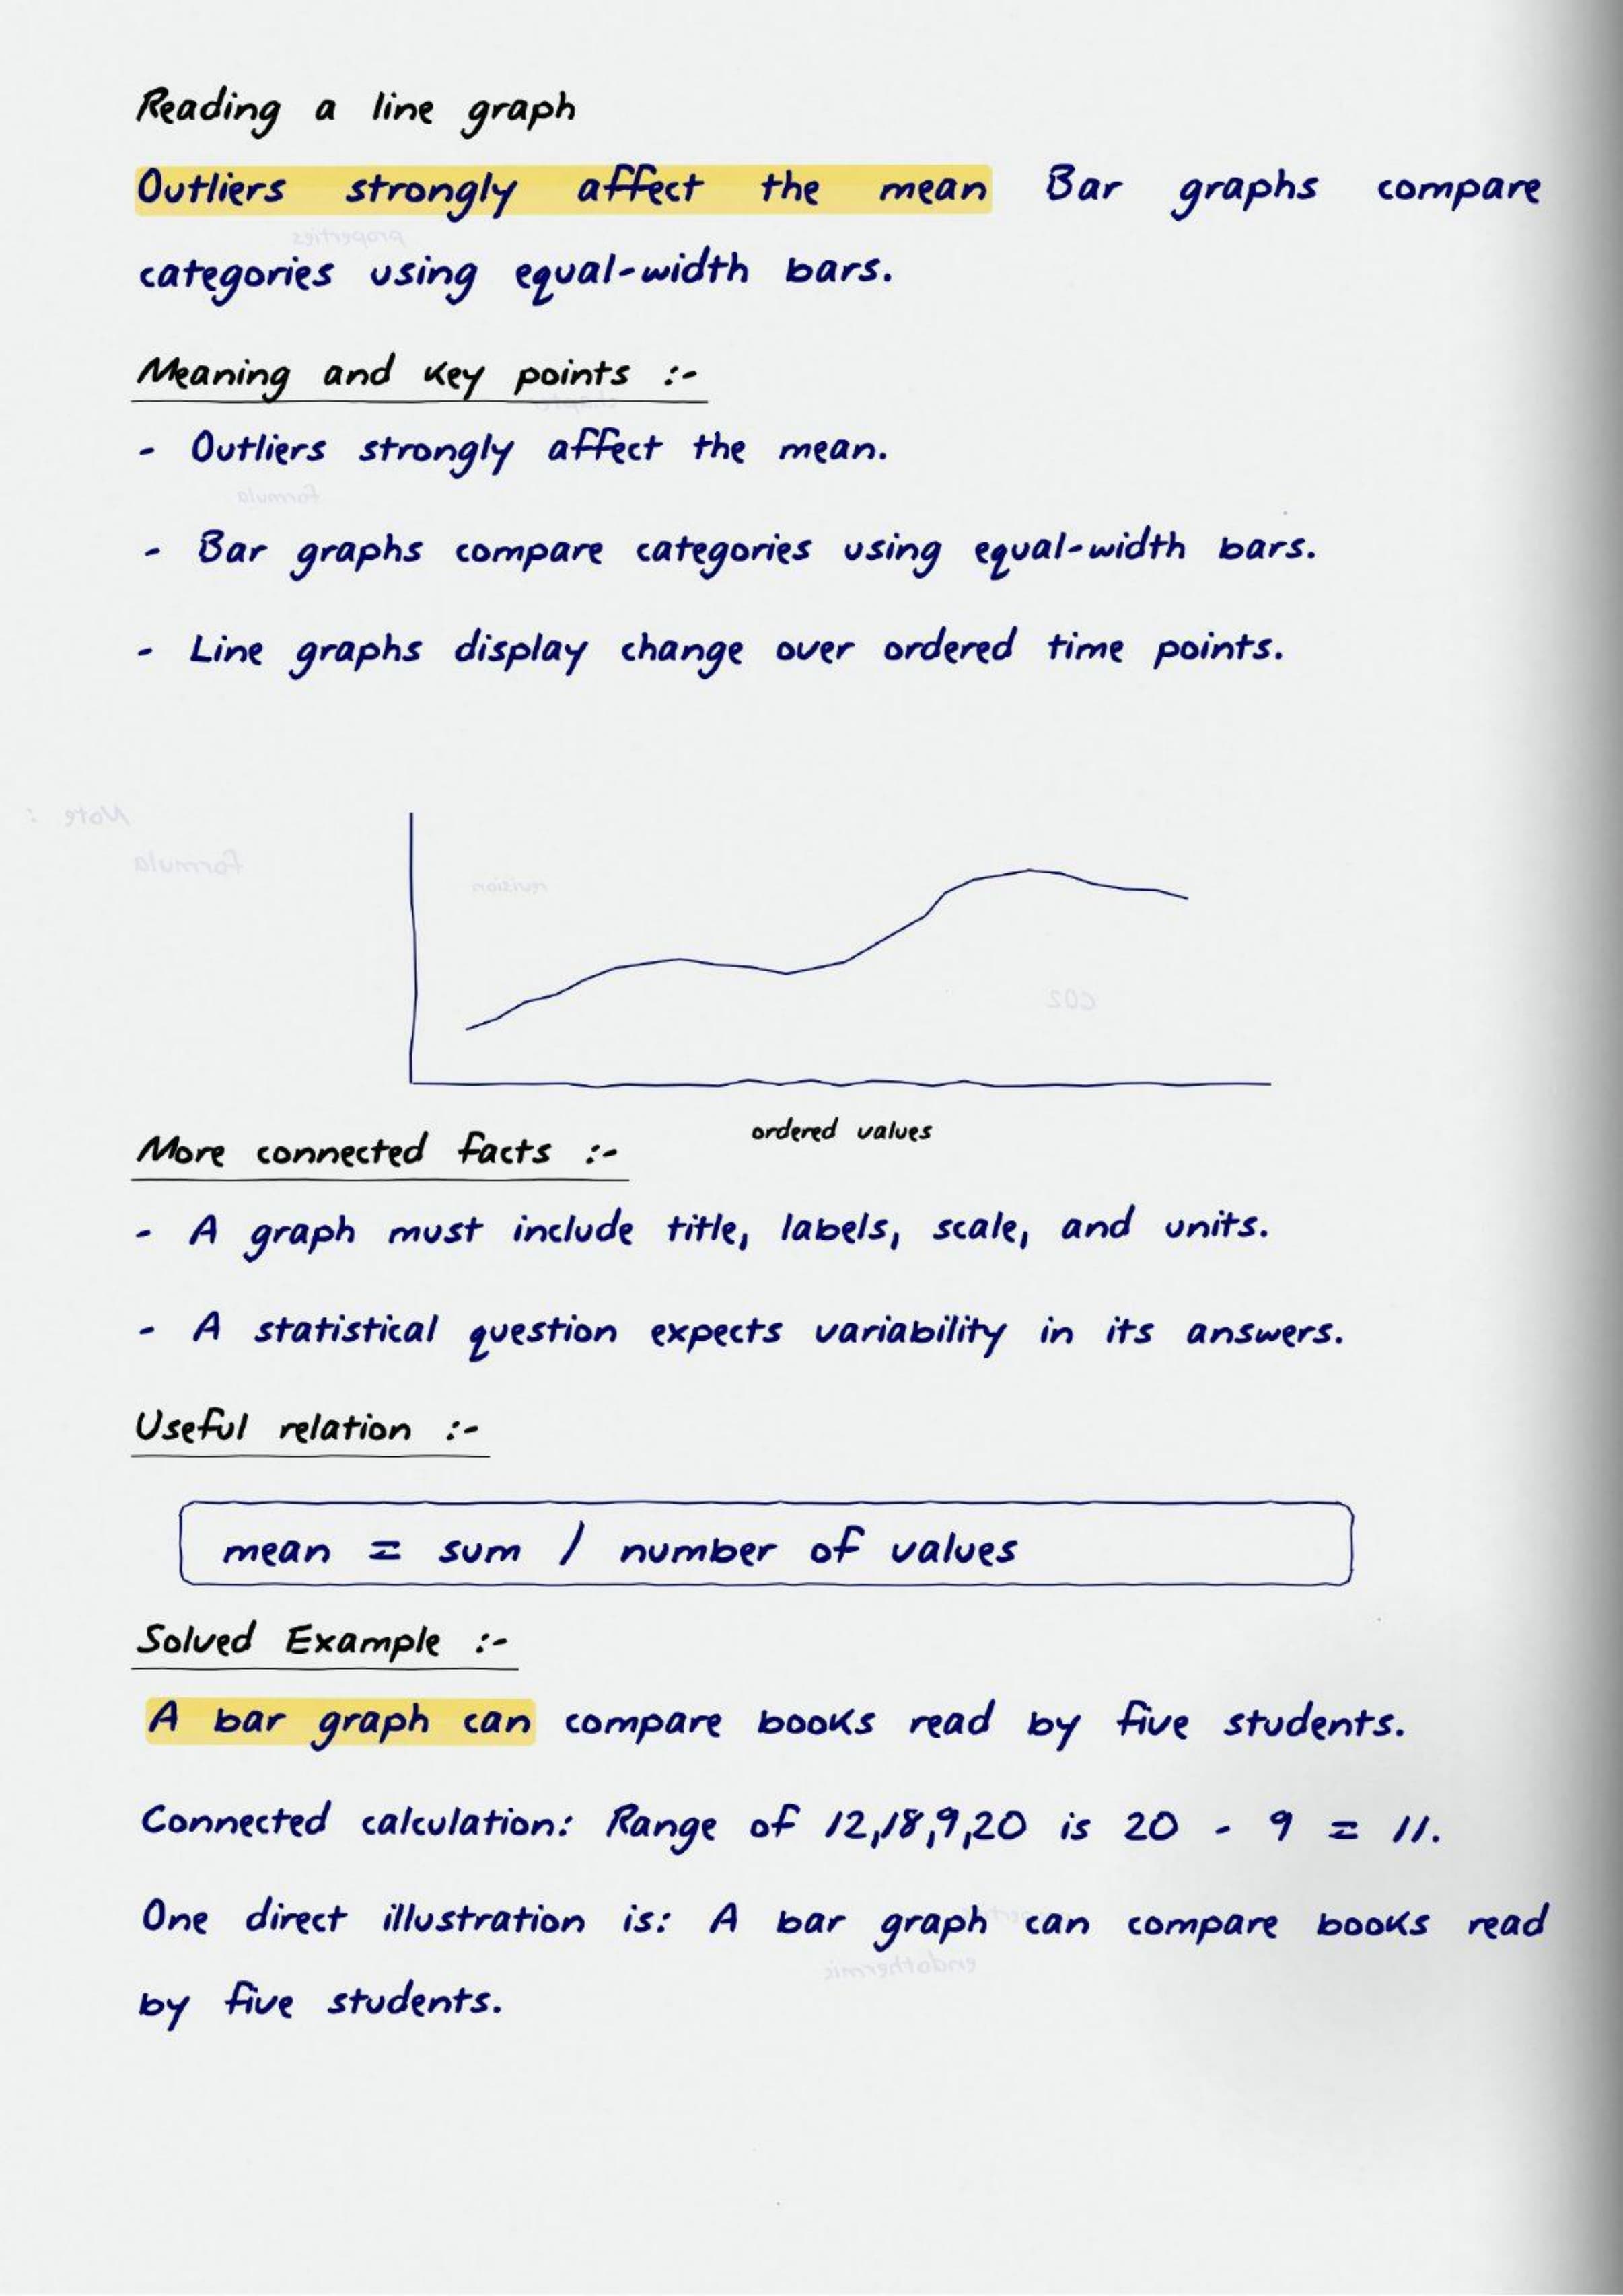
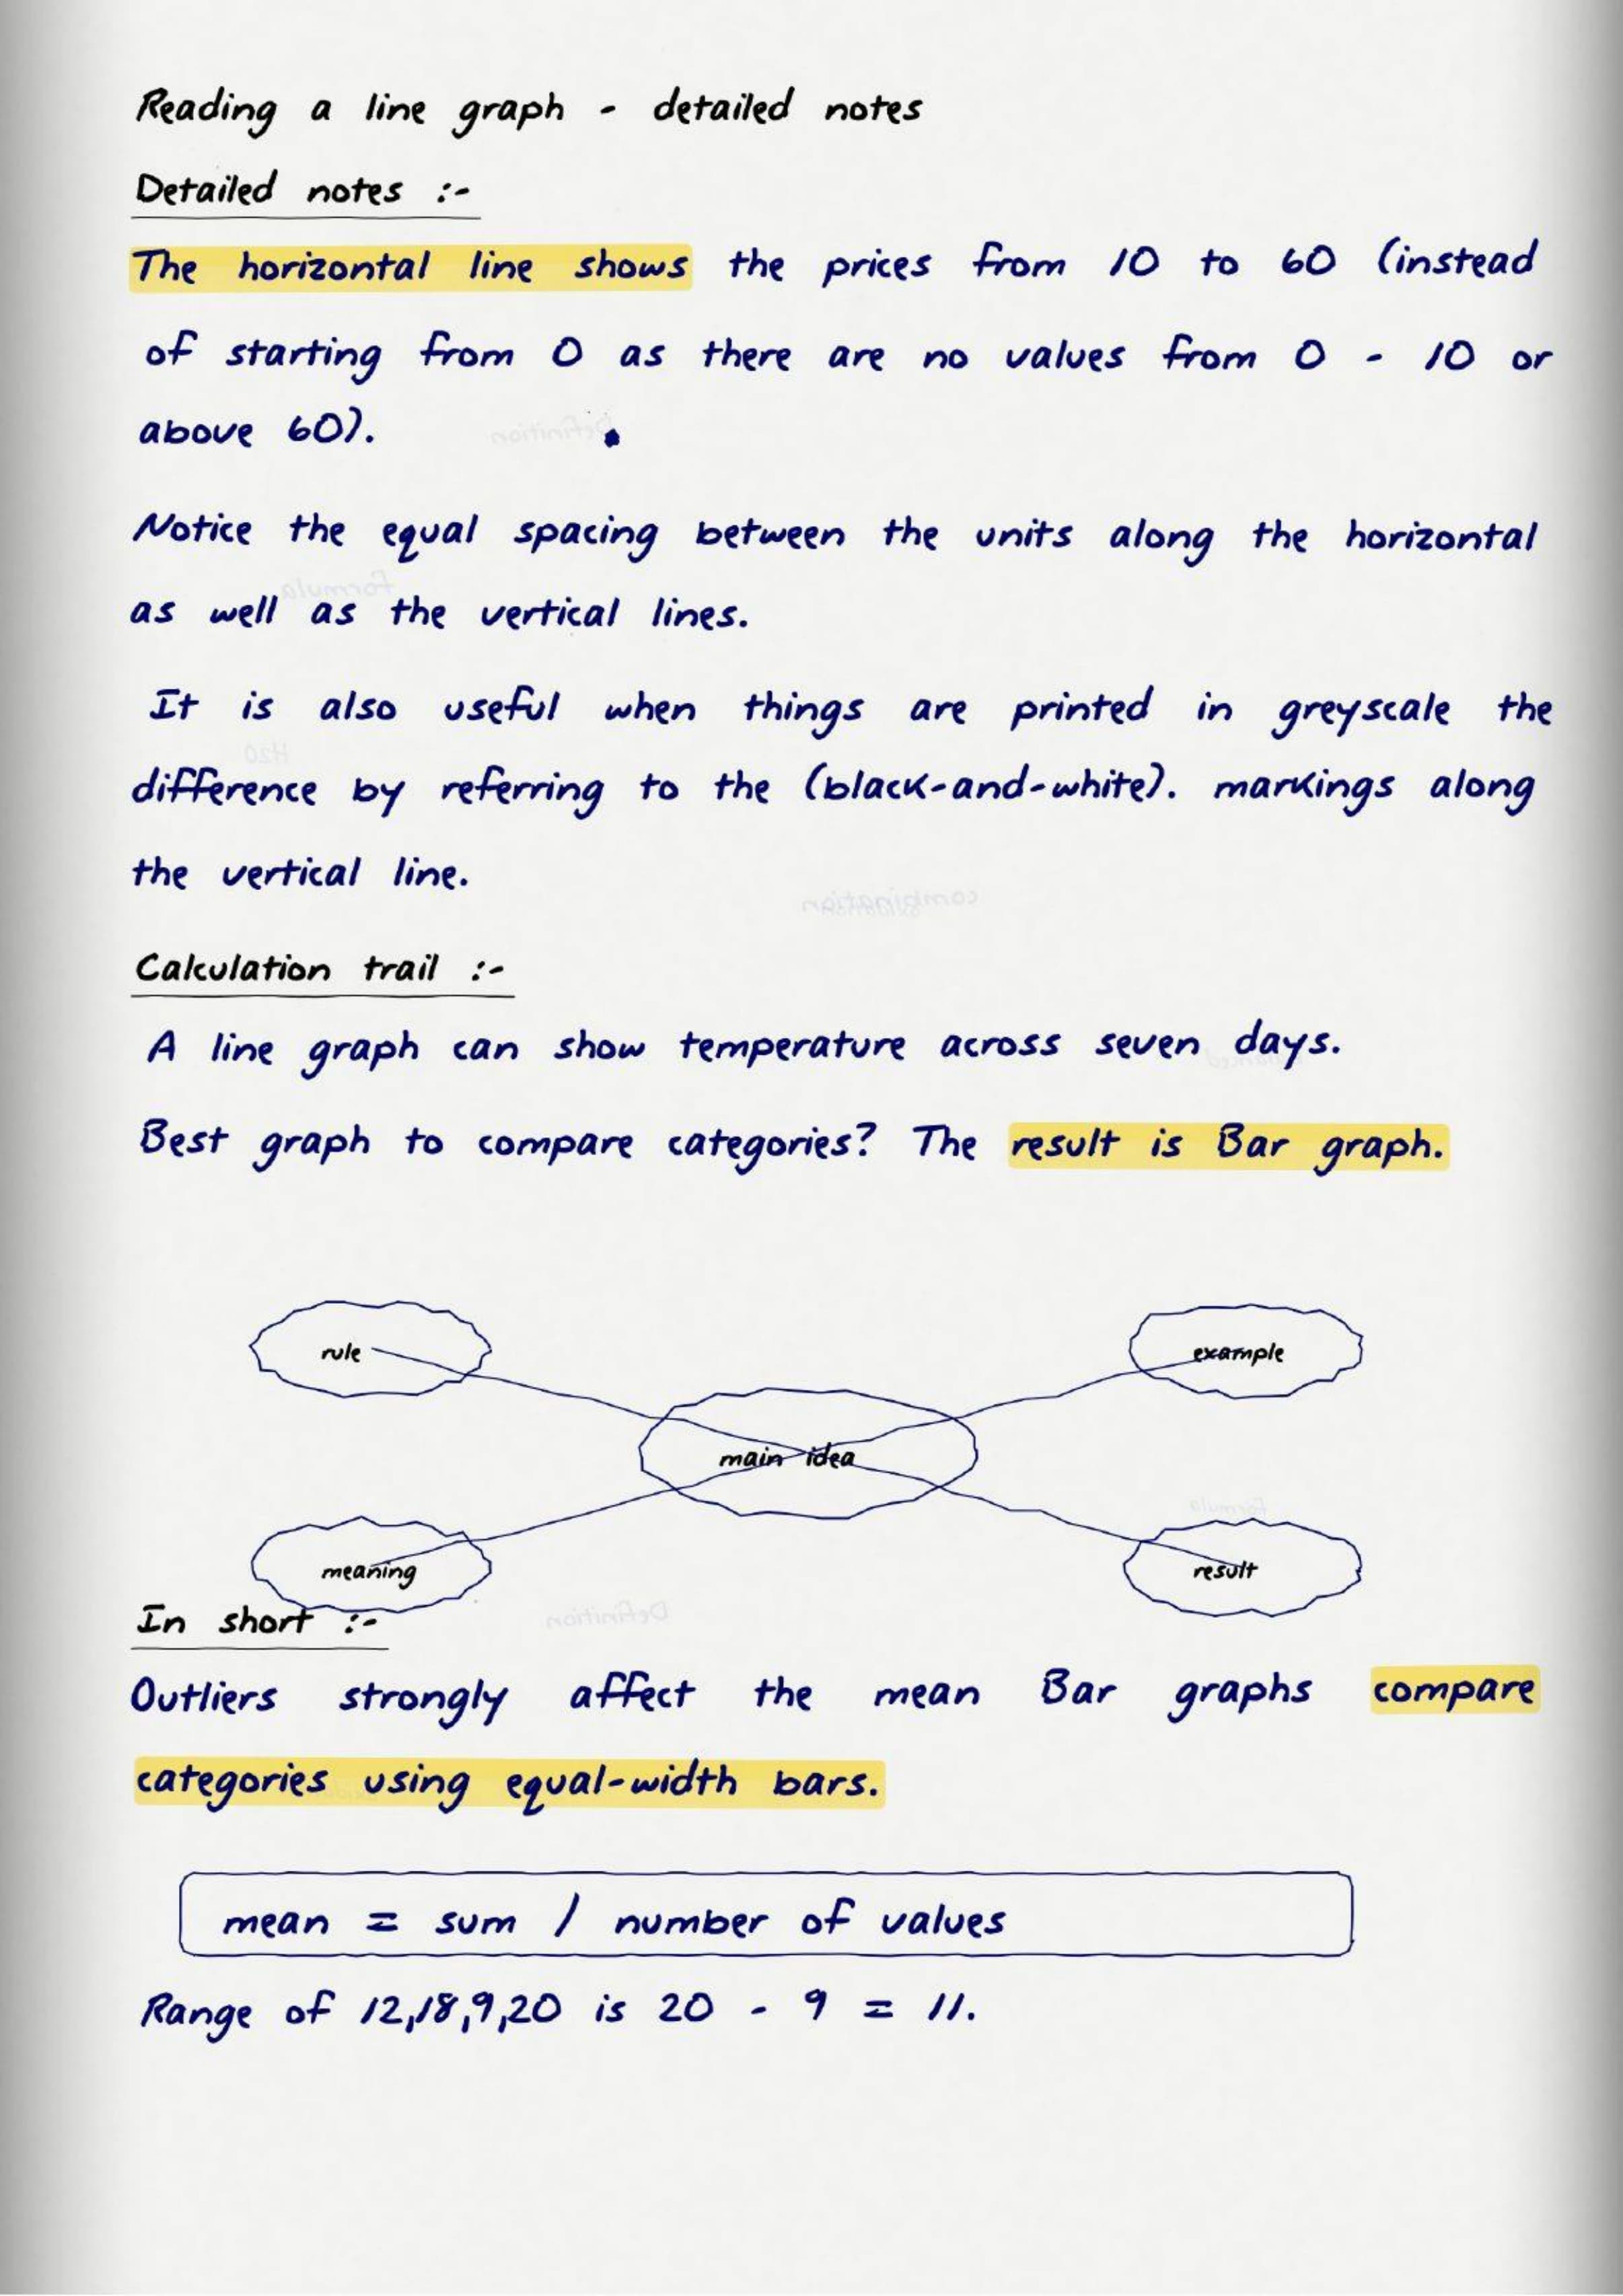
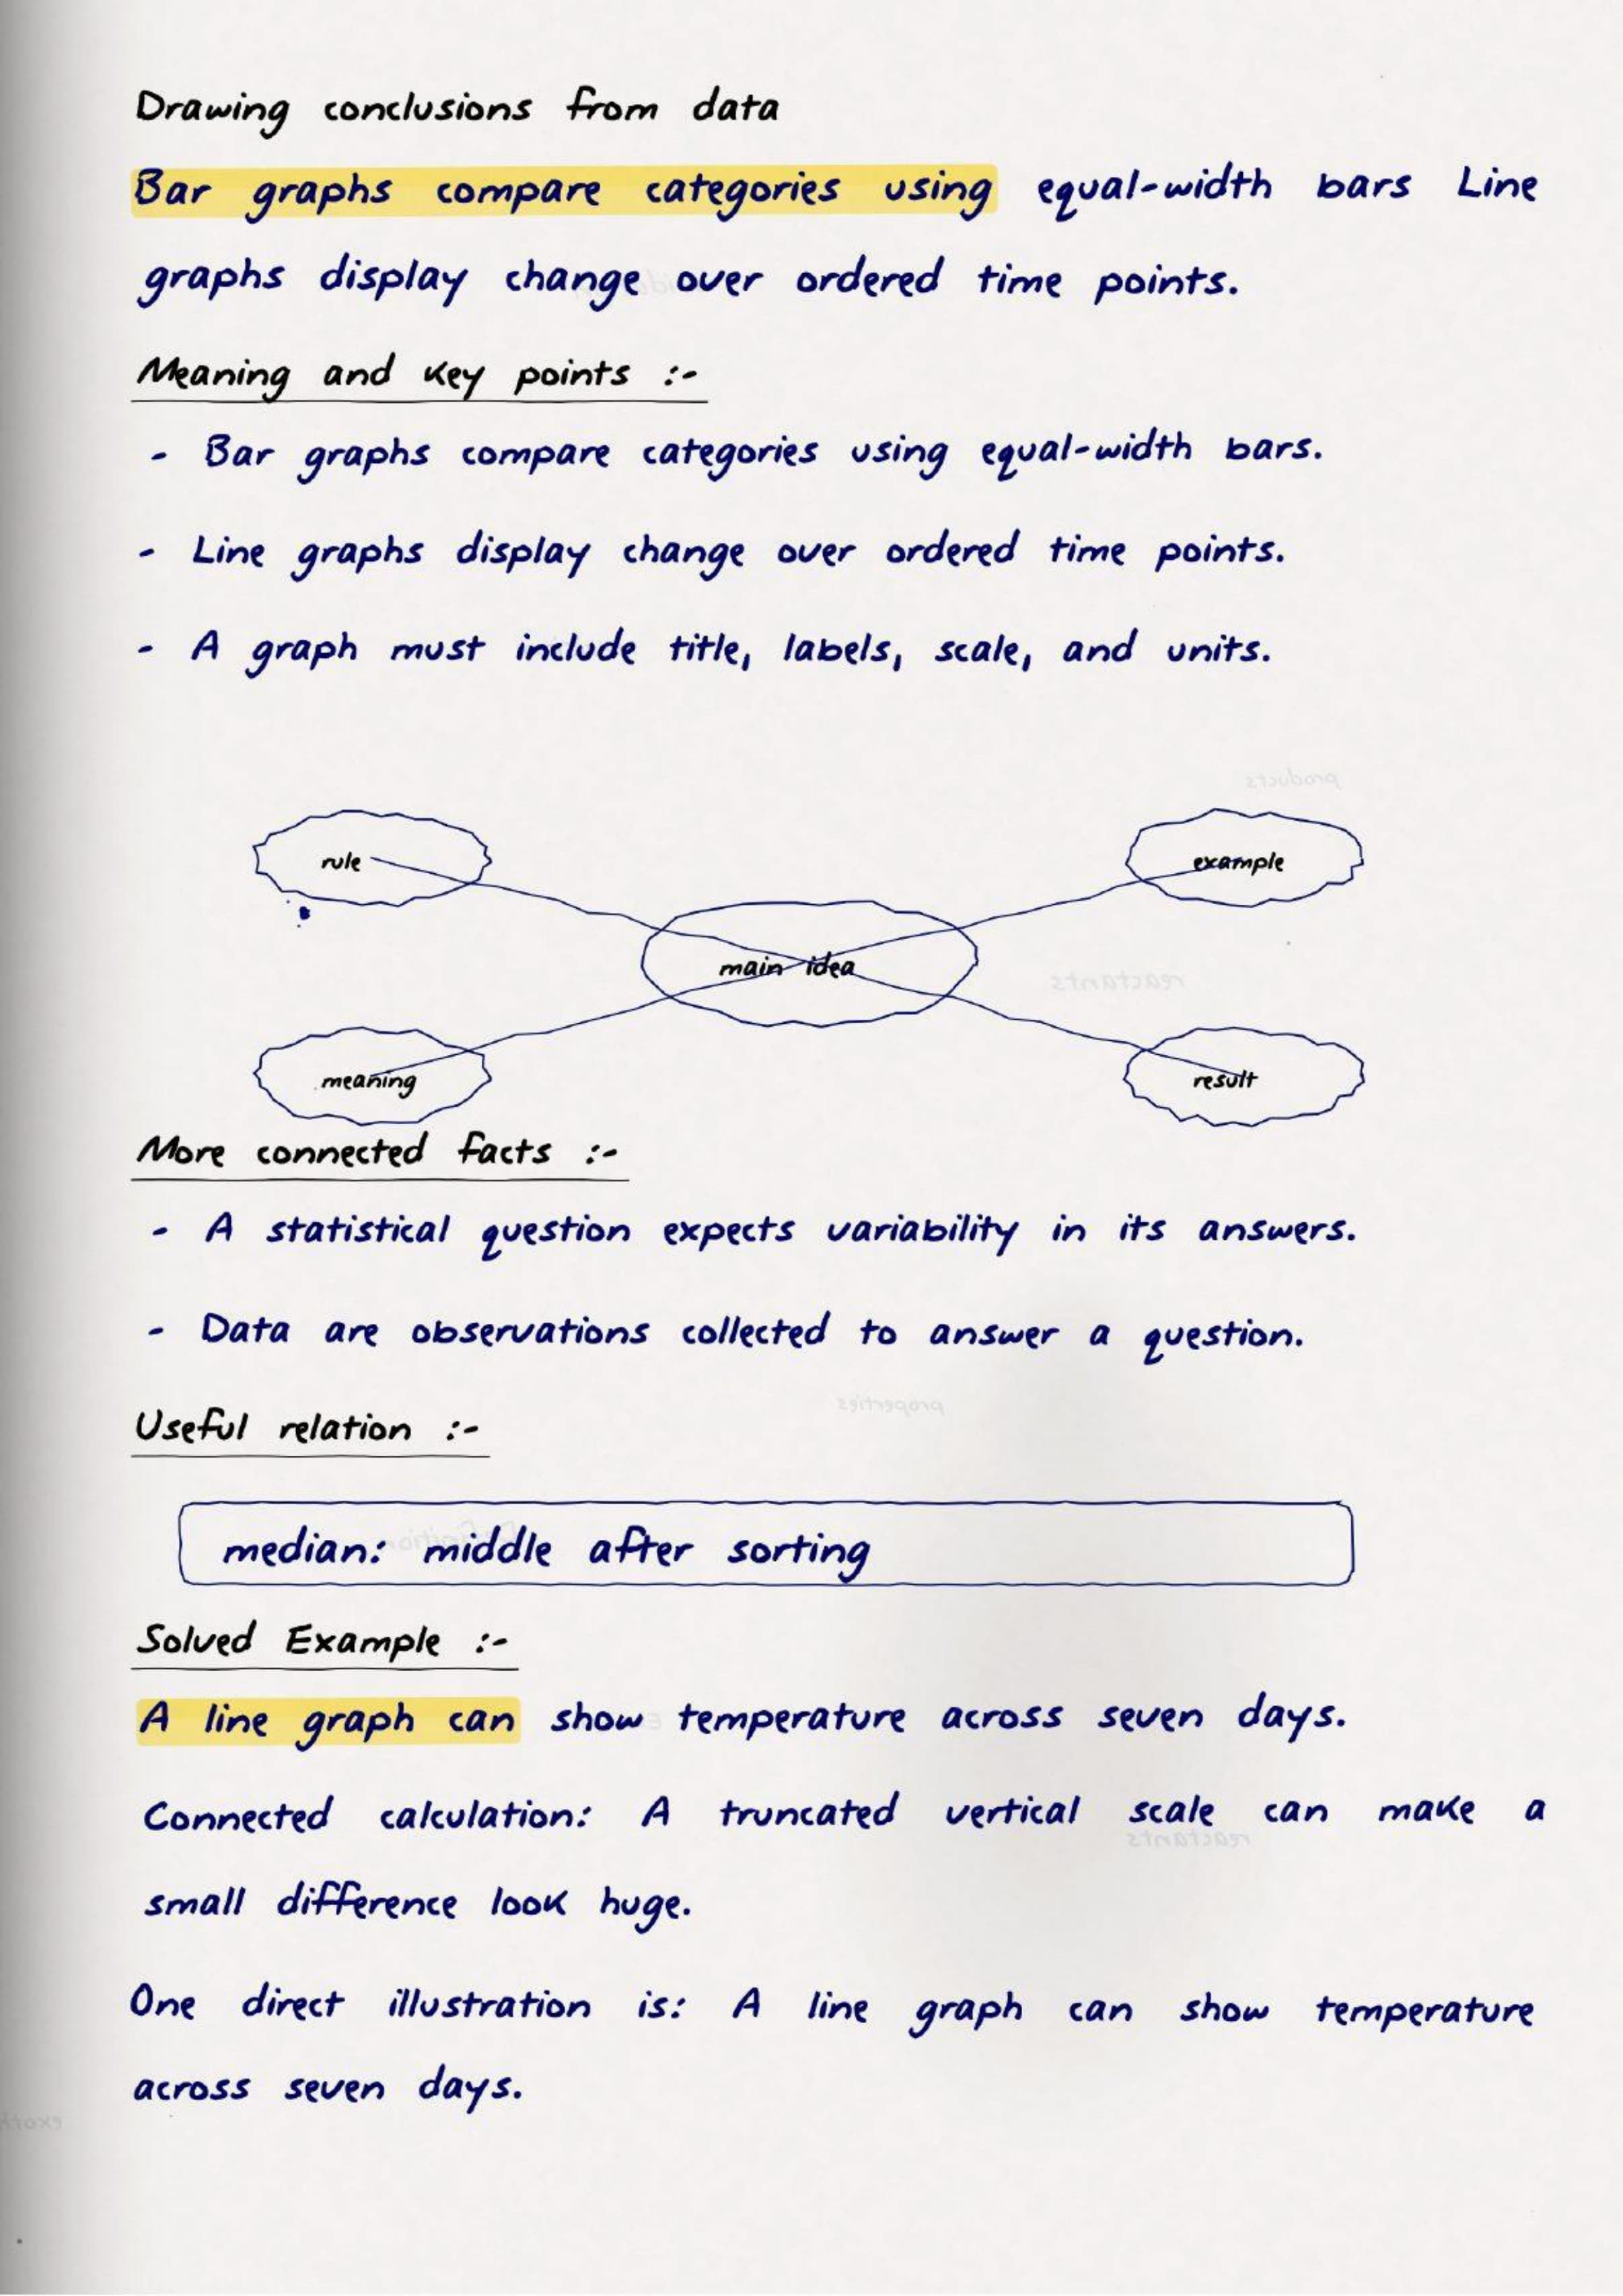
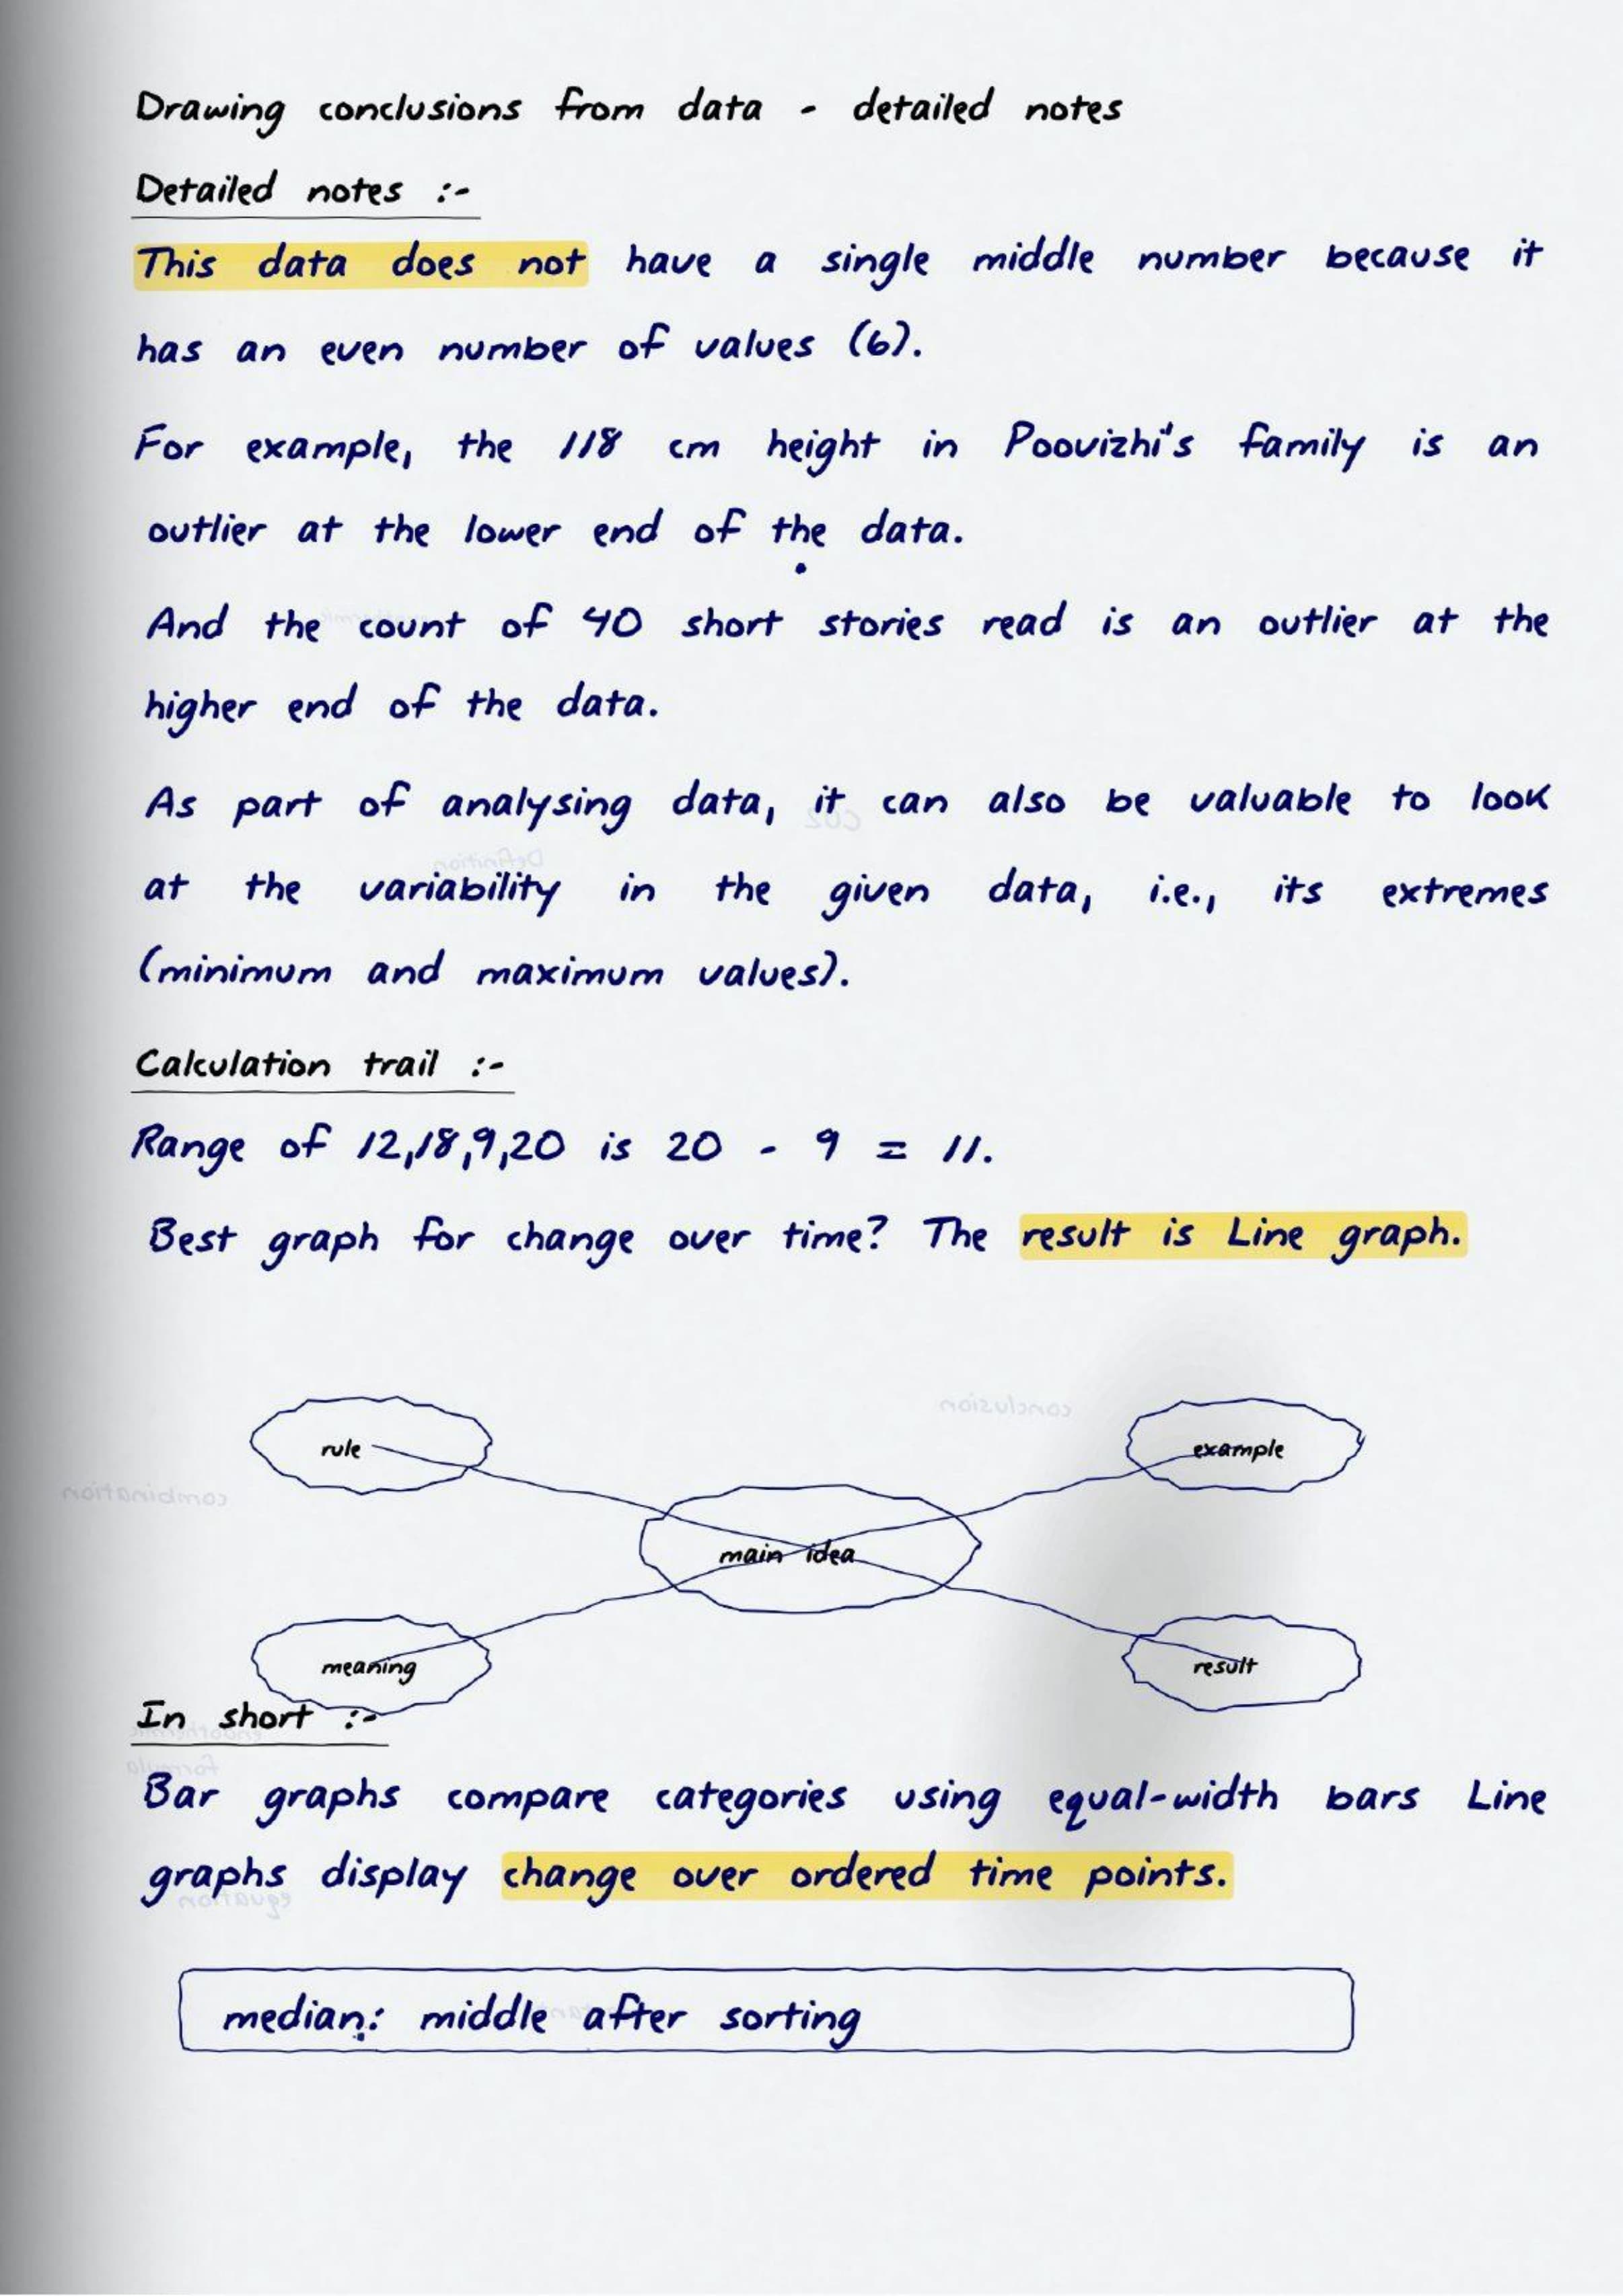
- Three averages boxed: mean, median and mode with how to find each
- What the notes cover: asking good questions of data, representative values, graphs, and reading data carefully
- Best for: the calculate-the-mean question and the read-the-graph question
Everything described here is in the class 7 maths handwritten notes PDF for Connecting the Dots..., linked below.
These handwritten notes are written by Maths teachers, mapped to the 2026-27 NCERT Ganita Prakash book, and checked against Class 7 school question papers.
Section-by-Section Map of the Connecting the Dots... Notes
The chapter opens by asking you to guess two friends' gender from their heights. It shows immediately how data can mislead if you read it carelessly.
- Asking questions that data can answer
- Statements, guesses and evidence
- Representative values of a data set
- The mean and how to calculate it
- The median and how to find it
- The mode and what it tells you
- Visualising data with bar graphs
- Reading a graph correctly
- Data detective: spotting misleading data
How Collegedunia Wrote These Connecting the Dots... Notes
The three averages are worked out on one small data set, so the difference between them is visible. Collegedunia checks every page of these class 7 maths handwritten notes against the textbook.
- Three averages panel: mean, median and mode found on the same data set
- Graph drawing steps: how to set the scale and label the axes
- Misleading data examples: graphs that look convincing but mislead
- Colour-coded sub-headings: sub-topics in red so each average stands out
How CBSE Class 7 Maths Splits Marks Across Connecting the Dots...
Calculating the mean and reading graphs take the most marks.
| Sub-topic | Weightage | How often asked |
|---|---|---|
| Calculating the mean | High | asked often |
| Reading and drawing bar graphs | High | asked often |
| Median and mode | High | asked often |
| Choosing the right representative value | Medium | asked sometimes |
| Spotting misleading data | Medium | asked sometimes |
| Framing a question for data | Low | asked rarely |
The Connecting the Dots... Vocabulary CBSE Class 7 Maths Expects
The three averages sound similar, so keep the definitions apart.
| Term / Idea | What it means |
|---|---|
| Data | a collection of facts or numbers gathered for a purpose |
| Mean | the sum of all values divided by how many values there are |
| Median | the middle value when the data is arranged in order |
| Mode | the value that appears most often |
| Representative value | a single value that stands for the whole set |
| Bar graph | a chart using bars whose heights show the values |
| Range | the difference between the largest and smallest values |
Connecting the Dots... Practice Questions with Answers
Five data handling questions. Tap each to check.
The mean of 4, 6 and 8 is
(a) 6 (b) 18 (c) 8 (d) 4
Answer: (a) 6, since 18 divided by 3 is 6
The median of 3, 7, 5 is
(a) 3 (b) 5 (c) 7 (d) 15
Answer: (b) 5, the middle value after sorting
The mode of 2, 3, 3, 5, 7 is
(a) 2 (b) 3 (c) 4 (d) 7
Answer: (b) 3, the value appearing most often
Before finding the median you must
(a) add all values (b) arrange the data in order (c) draw a graph (d) find the mode
Answer: (b) arrange the data in order
The difference between the largest and smallest value is the
(a) mean (b) mode (c) range (d) median
Answer: (c) range
Why Connecting the Dots... Matters Beyond Class 7
Data handling is the most practical chapter of the year, and its questions are also the quickest marks in the paper.
- A mean calculation appears in almost every test
- A graph reading question follows it in most papers
- Median and mode are set as one-mark questions
- Data handling continues in Class 8 with more graph types
One-Page Recall Card for Connecting the Dots...
The card for the data handling section.
- Mean: add everything, divide by how many
- Median: sort first, then take the middle
- Mode: the value that appears most often
- Range: largest minus smallest
- Always label the axes and the scale on a graph
What the Connecting the Dots... Notes Draw Out for You
Data handling is half about drawing, so the notes include full graphs.
| Figure drawn by hand | What it shows |
|---|---|
| Three averages panel | one data set with mean, median and mode all worked out |
| Bar graph | a full graph with labelled axes and a marked scale |
| Sorted data strip | numbers arranged in order with the median circled |
| Tally and frequency table | raw data turned into a frequency count |
| Misleading graph | a graph with a broken scale, marked to show the problem |
Fitting the Connecting the Dots... Notes Into Your Revision Week
Work all three averages on the same small set. The contrast is what fixes them in memory. Treat the class 7 maths handwritten notes as a revision tool, not as a first-time textbook.
- Find the mean, median and mode of the same five numbers
- Draw one bar graph with a labelled scale and axes
- Read three values off a given graph
- Before the test, revise the three averages panel and the graph steps
Pair the Connecting the Dots... Notes With These
Use the notes with the solved exercises and the Ganita Prakash chapter itself.
Class 7 Maths Handwritten Notes Chapter List
The class 7 maths handwritten notes for all chapters are listed below. Ganita Prakash Part 1 has eight chapters and Part 2 has seven.
| Chapter | Resource |
|---|---|
| Part 1 Chapter 1 | Large Numbers Around Us Handwritten Notes |
| Part 1 Chapter 2 | Arithmetic Expressions Handwritten Notes |
| Part 1 Chapter 3 | A Peek Beyond the Point Handwritten Notes |
| Part 1 Chapter 4 | Expressions using Letter-Numbers Handwritten Notes |
| Part 1 Chapter 5 | Parallel and Intersecting Lines Handwritten Notes |
| Part 1 Chapter 6 | Number Play Handwritten Notes |
| Part 1 Chapter 7 | A Tale of Three Intersecting Lines Handwritten Notes |
| Part 1 Chapter 8 | Working with Fractions Handwritten Notes |
| Part 2 Chapter 1 | Geometric Twins Handwritten Notes |
| Part 2 Chapter 2 | Operations with Integers Handwritten Notes |
| Part 2 Chapter 3 | Finding Common Ground Handwritten Notes |
| Part 2 Chapter 4 | Another Peek Beyond the Point Handwritten Notes |
| Part 2 Chapter 5 | Connecting the Dots... Handwritten Notes |
| Part 2 Chapter 6 | Constructions and Tilings Handwritten Notes |
| Part 2 Chapter 7 | Finding the Unknown Handwritten Notes |
Connecting the Dots... Class 7 Maths Handwritten Notes FAQs
Ques. Where can I download the Connecting the Dots Class 7 Maths Handwritten Notes PDF?
Ans. The PDF is free on this page in both the normal and the HD version.
Ques. What is the difference between mean, median and mode?
Ans. The mean is the total divided by the number of values. The median is the middle value once the data is sorted. The mode is the value that appears most often.
Ques. How many pages is the Part 2 Chapter 5 handwritten notes PDF?
Ans. It runs 20 pages and covers all four sections of the chapter plus a quiz.
Ques. How do you calculate the mean?
Ans. Add all the values together, then divide by how many values there are. For 4, 6 and 8 the total is 18 and there are three values, so the mean is 6.
Ques. Why must data be sorted before finding the median?
Ans. Because the median is defined as the middle value in order. If the list is unsorted, the value sitting in the middle position is not the median.



Comments