The Class 7 Maths Chapter 5 NCERT Solutions for Connecting the Dots help students solve statistics questions from the 2026-27 Ganita Prakash Part 2 textbook.
Activity questions include clear method steps instead of invented class data.
Source charts are explained with the exact reading rule students need.
Each Class 7 Maths Chapter 5 NCERT solution follows the latest Ganita Prakash Part 2 chapter and keeps every data calculation visible.
Student Feedback: In a Collegedunia poll of 8,960 Class 7 students, 64% said they confuse mean and median when a data set has an outlier. Students found the sorted-list method most useful.
Connecting the Dots Topics Covered in Class 7 Maths Chapter 5
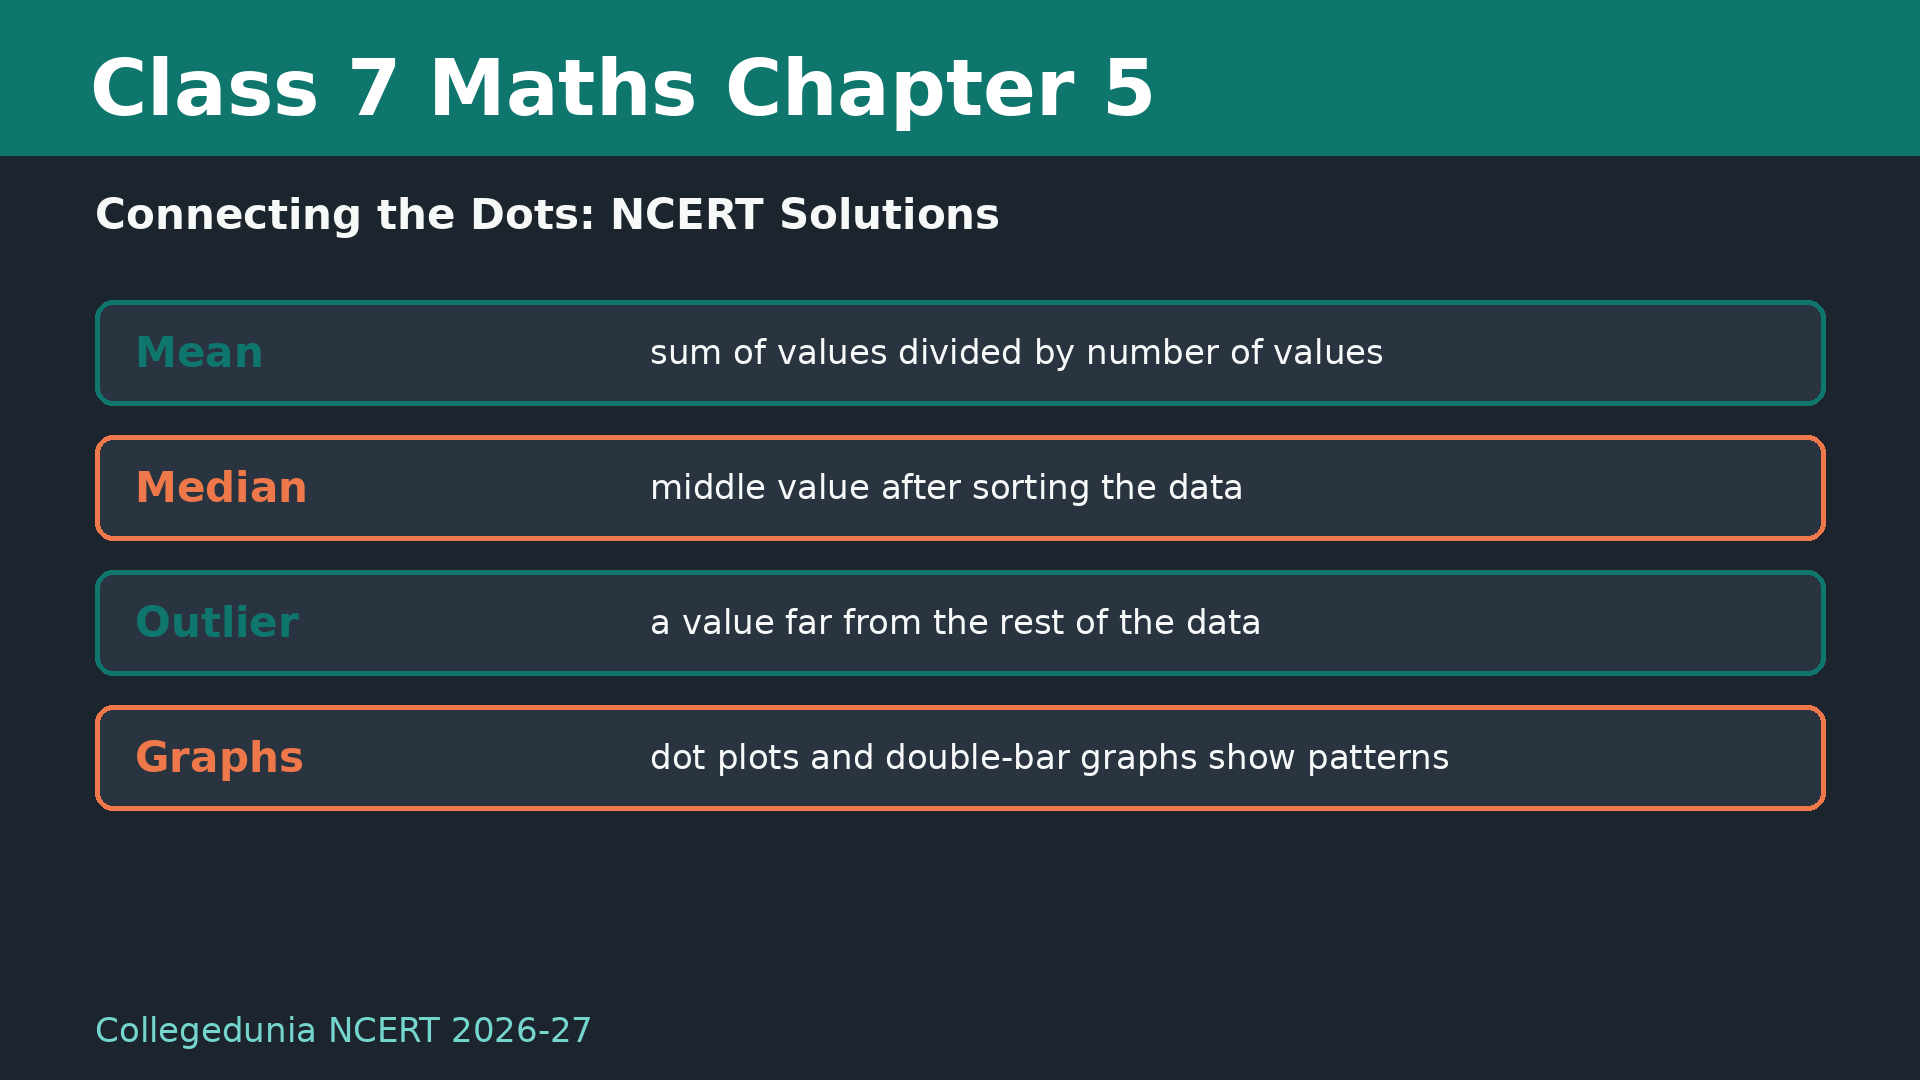
Connecting the Dots introduces statistics through real data. Students learn to ask statistical questions, calculate arithmetic mean, find median, spot outliers and read dot plots, double-bar graphs and infographics.
Topic
What students practise
Mean and median
Finding a representative value for data sets with and without outliers.
Dot plots
Reading spread, clusters, minimum, maximum and repeated values.
Double-bar graphs
Comparing two groups across sports, temperatures, states or months.
Mean, Median and Outlier Rules for Connecting the Dots
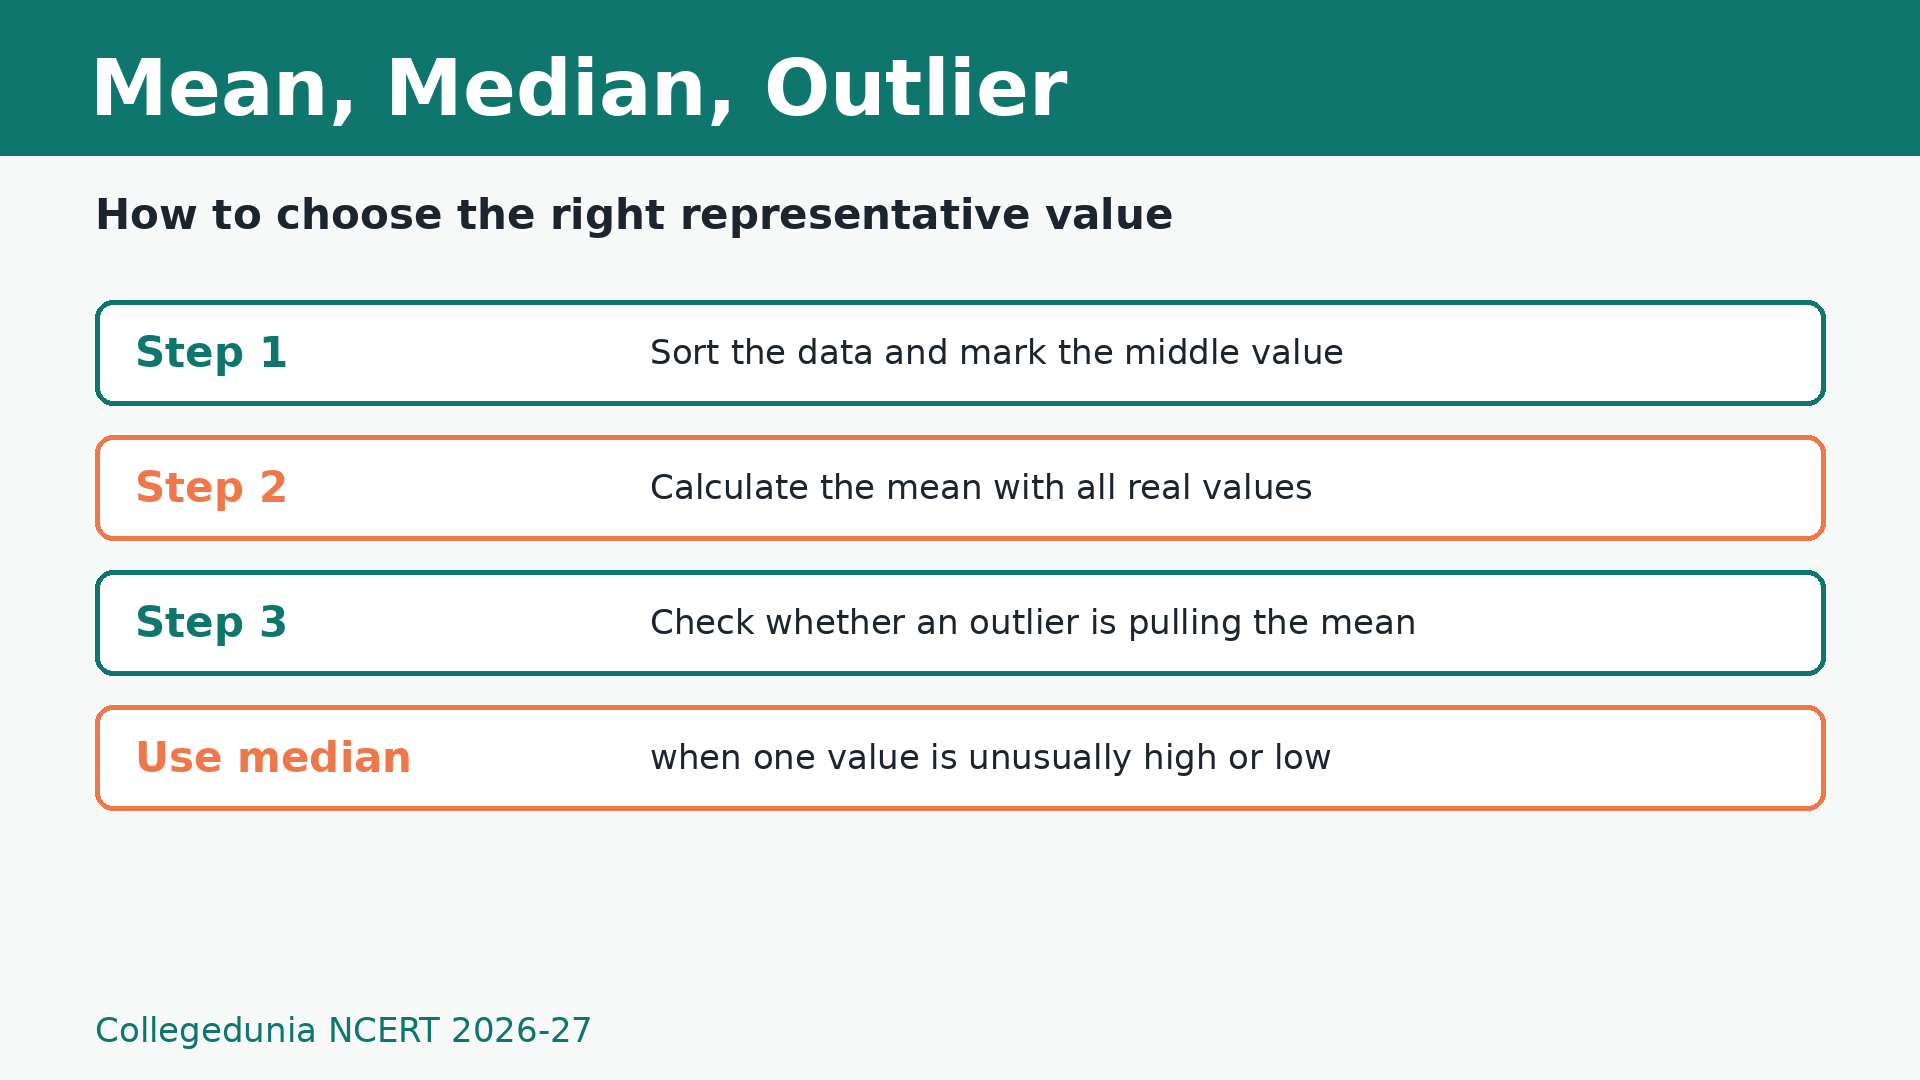
The mean uses every real value in the data. The median first sorts the data and then takes the middle. When one value is very high or very low, the median often represents the group better.
Dot Plot and Bar Graph Checklist for Class 7 Statistics
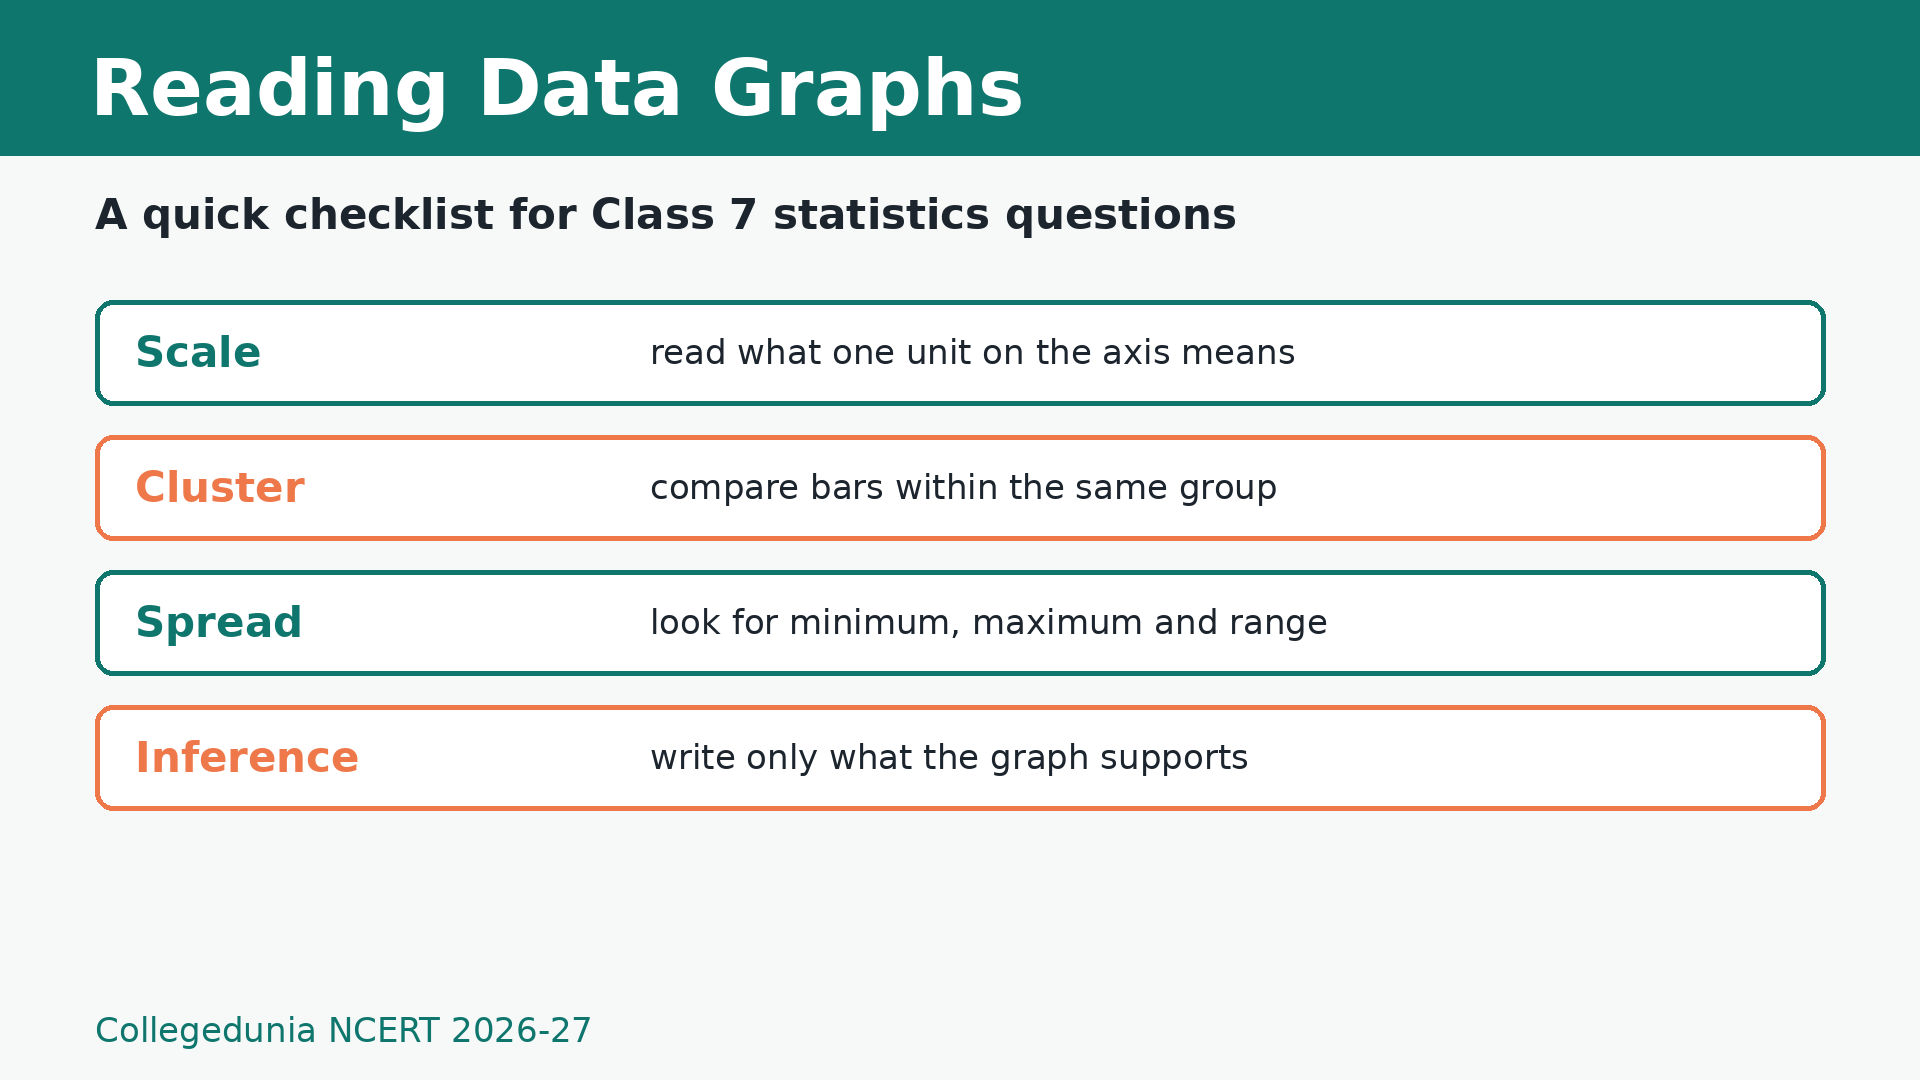
For a dot plot, count how many dots sit above each value. For a double-bar graph, compare bars inside the same cluster before writing a conclusion.
Connecting the Dots Class 7 Maths Video Recap
Source: YouTube classroom solution video
How to Use the Connecting the Dots Solutions PDF
Start by deciding whether the question asks for mean, median, range or graph interpretation.
Ignore absent entries, but keep real zero values in the data.
Use the Expert Solution tab when a chart-based inference feels unclear.
All NCERT Solutions for Class 7 Maths Chapter 5 Connecting the Dots with Step-by-Step Solutions
Connecting the Dots Solution Cards
All 29 questions with collapsible Solution and Expert Solution. Tap a button to reveal the working.
What this PDF covers
Q 5.1
Shreyas counts the number of times he can bounce a ball on a bat before it falls. The data for 8 attempts is 6, 2, 9, 5, 4, 6, 3, 5. Calculate the average number of bounces.
Concept used. This question uses arithmetic mean. The key is to read the data first, then choose the right representative value or graph rule.
Source anchor
NCERT Class 7 Ganita Prakash Part 2, Chapter 5: Connecting the Dots, Page 101, Figure it Out 1.
Add the 8 values: 6+2+9+5+4+6+3+5=40.
Divide by the number of attempts: 40÷ 8=5.
Data check
Before writing the answer, check whether a zero is a real value or a missing value. They are not the same.
The average number of bounces is 5.
AR
Ananya Rao
M.Sc Mathematics, IIT Delhi
Verified Expert
Strategic angle. Treat the data set like a story: first list what is counted, then decide whether mean, median, range or a graph answers the question best.
Add the 8 values: 6+2+9+5+4+6+3+5=40.
Divide by the number of attempts: 40÷ 8=5.
This second route prevents a common statistics error: using one large or small value to speak for the whole group without checking the spread.
The average number of bounces is 5.
Q 5.2
Try the bat-and-ball activity on your own. Collect data for 7 or more attempts and find the average.
Concept used. This question uses mean from collected data. The key is to read the data first, then choose the right representative value or graph rule.
Source anchor
NCERT Class 7 Ganita Prakash Part 2, Chapter 5: Connecting the Dots, Page 101, Figure it Out 2.
Record each attempt in a list.
Add all recorded values.
Divide the sum by the number of attempts.
For example, if the data is 4,5,6,6,7,3,4, the sum is 35 and the average is 35÷ 7=5.
Data check
Before writing the answer, check whether a zero is a real value or a missing value. They are not the same.
Use mean=sum of attemptsnumber of attempts for your own data.
RS
Ritwik Sen
B.Ed Mathematics, University of Calcutta
Verified Expert
Strategic angle. Treat the data set like a story: first list what is counted, then decide whether mean, median, range or a graph answers the question best.
Record each attempt in a list.
Add all recorded values.
Divide the sum by the number of attempts.
For example, if the data is 4,5,6,6,7,3,4, the sum is 35 and the average is 35÷ 7=5.
This second route prevents a common statistics error: using one large or small value to speak for the whole group without checking the spread.
Use mean=sum of attemptsnumber of attempts for your own data.
Q 5.3
Identify a flowering plant near you. Track the number of flowers that bloom every day over a week. What is the average number of flowers per day?
Concept used. This question uses daily average from a week of observations. The key is to read the data first, then choose the right representative value or graph rule.
Source anchor
NCERT Class 7 Ganita Prakash Part 2, Chapter 5: Connecting the Dots, Page 101, Figure it Out 3.
Write the 7 daily counts.
Add the counts.
Divide the total by 7 because a week has 7 days.
For example, 2,4,3,5,4,6,4 has sum 28, so the average is 4 flowers per day.
Data check
Before writing the answer, check whether a zero is a real value or a missing value. They are not the same.
The answer depends on the collected data. Divide the weekly total by 7.
MI
Meera Iyer
M.Sc Statistics, University of Madras
Verified Expert
Strategic angle. Treat the data set like a story: first list what is counted, then decide whether mean, median, range or a graph answers the question best.
Write the 7 daily counts.
Add the counts.
Divide the total by 7 because a week has 7 days.
For example, 2,4,3,5,4,6,4 has sum 28, so the average is 4 flowers per day.
This second route prevents a common statistics error: using one large or small value to speak for the whole group without checking the spread.
The answer depends on the collected data. Divide the weekly total by 7.
Q 5.4
Nikhil's running times for a 100 m race are 17, 18, 17, 16, 19, 17, 18 seconds. Sunil's times are 20, 18, 18, 17, 16, 16, 17 seconds. Who on average ran quicker?
Concept used. This question uses comparing mean running times. The key is to read the data first, then choose the right representative value or graph rule.
Source anchor
NCERT Class 7 Ganita Prakash Part 2, Chapter 5: Connecting the Dots, Page 101, Figure it Out 4.
Nikhil's total time is 17+18+17+16+19+17+18=122 seconds.
Nikhil's mean time is 122÷ 7=17.43 seconds approximately.
Sunil's total time is 20+18+18+17+16+16+17=122 seconds.
Sunil's mean time is also 122÷ 7=17.43 seconds approximately.
Data check
Before writing the answer, check whether a zero is a real value or a missing value. They are not the same.
Both runners have the same average time. Neither is quicker on average.
KJ
Kabir Joshi
M.Sc Applied Mathematics, IISER Pune
Verified Expert
Strategic angle. Treat the data set like a story: first list what is counted, then decide whether mean, median, range or a graph answers the question best.
Nikhil's total time is 17+18+17+16+19+17+18=122 seconds.
Nikhil's mean time is 122÷ 7=17.43 seconds approximately.
Sunil's total time is 20+18+18+17+16+16+17=122 seconds.
Sunil's mean time is also 122÷ 7=17.43 seconds approximately.
This second route prevents a common statistics error: using one large or small value to speak for the whole group without checking the spread.
Both runners have the same average time. Neither is quicker on average.
Q 5.5
The enrolment in a school during six consecutive years was 1555, 1670, 1750, 2013, 2040, 2126. Find the mean enrolment.
Concept used. This question uses mean enrolment. The key is to read the data first, then choose the right representative value or graph rule.
Source anchor
NCERT Class 7 Ganita Prakash Part 2, Chapter 5: Connecting the Dots, Page 101, Figure it Out 5.
Add the enrolments: 1555+1670+1750+2013+2040+2126=11154.
There are 6 years.
Mean enrolment =11154÷ 6=1859.
Data check
Before writing the answer, check whether a zero is a real value or a missing value. They are not the same.
The mean enrolment is 1859 students.
NB
Nisha Bansal
B.Sc Mathematics, Delhi University
Verified Expert
Strategic angle. Treat the data set like a story: first list what is counted, then decide whether mean, median, range or a graph answers the question best.
Add the enrolments: 1555+1670+1750+2013+2040+2126=11154.
There are 6 years.
Mean enrolment =11154÷ 6=1859.
This second route prevents a common statistics error: using one large or small value to speak for the whole group without checking the spread.
The mean enrolment is 1859 students.
Q 5.6
Find the median of onion prices in Yahapur and Wahapur.
Concept used. This question uses median of 12 monthly values. The key is to read the data first, then choose the right representative value or graph rule.
Source anchor
NCERT Class 7 Ganita Prakash Part 2, Chapter 5: Connecting the Dots, Page 112, Figure it Out 1.
Yahapur sorted prices are 24,25,26,28,30,35,39,43,44,49,56,59.
With 12 values, median is the average of the 6th and 7th values: (35+39)÷ 2=37.
Wahapur sorted prices are 17,19,23,30,35,38,39,42,42,52,53,60.
Median is (38+39)÷ 2=38.5.
Data check
Before writing the answer, check whether a zero is a real value or a missing value. They are not the same.
Yahapur median is 37 and Wahapur median is 38.5 rupees per kg.
AM
Arjun Menon
M.Sc Mathematics, IIT Hyderabad
Verified Expert
Strategic angle. Treat the data set like a story: first list what is counted, then decide whether mean, median, range or a graph answers the question best.
Yahapur sorted prices are 24,25,26,28,30,35,39,43,44,49,56,59.
With 12 values, median is the average of the 6th and 7th values: (35+39)÷ 2=37.
Wahapur sorted prices are 17,19,23,30,35,38,39,42,42,52,53,60.
Median is (38+39)÷ 2=38.5.
This second route prevents a common statistics error: using one large or small value to speak for the whole group without checking the spread.
Yahapur median is 37 and Wahapur median is 38.5 rupees per kg.
Q 5.7
Sanskruti recorded domestic animals and pets at home. The data is 0, 1, 0, 4, 8, 0, 0, 2, 1, 1, 5, 3, 4, 0, 0, absent, 10, 25, 2, absent, 2, 4. Find the mean and median. How would you describe this data?
Concept used. This question uses mean and median with absent entries ignored. The key is to read the data first, then choose the right representative value or graph rule.
Source anchor
NCERT Class 7 Ganita Prakash Part 2, Chapter 5: Connecting the Dots, Page 112, Figure it Out 2.
Ignore the two absent entries because they are not zero values.
The 20 numerical values have sum 72.
Mean =72÷ 20=3.6.
Sorted data has the 10th and 11th values both 2, so the median is 2.
The value 25 is a high outlier and pulls the mean above the median.
Data check
Before writing the answer, check whether a zero is a real value or a missing value. They are not the same.
Mean =3.6, median =2. The data is right-skewed because of a high outlier.
PM
Pooja Mehta
B.Ed Mathematics, Mumbai University
Verified Expert
Strategic angle. Treat the data set like a story: first list what is counted, then decide whether mean, median, range or a graph answers the question best.
Ignore the two absent entries because they are not zero values.
The 20 numerical values have sum 72.
Mean =72÷ 20=3.6.
Sorted data has the 10th and 11th values both 2, so the median is 2.
The value 25 is a high outlier and pulls the mean above the median.
This second route prevents a common statistics error: using one large or small value to speak for the whole group without checking the spread.
Mean =3.6, median =2. The data is right-skewed because of a high outlier.
Q 5.8
Rintu's date-palm tree heights in feet are 50, 45, 43, 52, 61, 63, 46, 55, 60, 55, 59, 56, 56, 49, 54, 65, 66, 51, 44, 58, 60, 54, 52, 57, 61, 62, 60, 60, 67. Fill the dot plot, mark mean and median, describe the heights, and say how many trees are shorter than the average.
Concept used. This question uses mean, median and spread. The key is to read the data first, then choose the right representative value or graph rule.
Source anchor
NCERT Class 7 Ganita Prakash Part 2, Chapter 5: Connecting the Dots, Page 112, Figure it Out 3.
There are 29 trees and the total height is 1621 feet.
Mean =1621÷ 29≈ 55.90 feet.
The sorted list has the 15th value 56, so the median is 56 feet.
Trees shorter than the average are those below 55.90: 43,44,45,46,49,50,51,52,52,54,54,55,55.
There are 13 such trees.
Data check
Before writing the answer, check whether a zero is a real value or a missing value. They are not the same.
Mean ≈55.9 ft, median =56 ft, and 13 trees are shorter than the average.
SK
Sanya Kapoor
M.Sc Mathematics, IIT Ropar
Verified Expert
Strategic angle. Treat the data set like a story: first list what is counted, then decide whether mean, median, range or a graph answers the question best.
There are 29 trees and the total height is 1621 feet.
Mean =1621÷ 29≈ 55.90 feet.
The sorted list has the 15th value 56, so the median is 56 feet.
Trees shorter than the average are those below 55.90: 43,44,45,46,49,50,51,52,52,54,54,55,55.
There are 13 such trees.
This second route prevents a common statistics error: using one large or small value to speak for the whole group without checking the spread.
Mean ≈55.9 ft, median =56 ft, and 13 trees are shorter than the average.
Q 5.9
Daily water usage from a tap was 5.6, 8, 3.09, 12.9, 6.5, 12.1, 11.3, 20.5, 7.4 litres. Can the mean or median lie between 25 and 30? Can either be less than the minimum or greater than the maximum?
Concept used. This question uses bounds for mean and median. The key is to read the data first, then choose the right representative value or graph rule.
Source anchor
NCERT Class 7 Ganita Prakash Part 2, Chapter 5: Connecting the Dots, Page 112, Figure it Out 4.
The minimum value is 3.09 and the maximum value is 20.5.
Mean and median must lie between the minimum and maximum values for this data.
The actual mean is 87.39÷ 9=9.71 litres.
The sorted middle value is 8, so the median is 8 litres.
Data check
Before writing the answer, check whether a zero is a real value or a missing value. They are not the same.
No. Neither mean nor median can lie between 25 and 30, or outside the minimum and maximum values.
DN
Devika Nair
M.Sc Mathematics, CUSAT
Verified Expert
Strategic angle. Treat the data set like a story: first list what is counted, then decide whether mean, median, range or a graph answers the question best.
The minimum value is 3.09 and the maximum value is 20.5.
Mean and median must lie between the minimum and maximum values for this data.
The actual mean is 87.39÷ 9=9.71 litres.
The sorted middle value is 8, so the median is 8 litres.
This second route prevents a common statistics error: using one large or small value to speak for the whole group without checking the spread.
No. Neither mean nor median can lie between 25 and 30, or outside the minimum and maximum values.
Q 5.10
Baby weights in kg are: boys 3.5, 4.1, 2.6, 3.2, 3.4, 3.8 and girls 4.0, 3.1, 3.4, 3.7, 2.5, 3.4. Fill the dot plot and compare the data.
Concept used. This question uses comparing two small data sets. The key is to read the data first, then choose the right representative value or graph rule.
Source anchor
NCERT Class 7 Ganita Prakash Part 2, Chapter 5: Connecting the Dots, Page 113, Figure it Out 5.
Boys' total is 20.6, so mean =20.6÷ 6≈ 3.43 kg.
Boys' sorted values are 2.6,3.2,3.4,3.5,3.8,4.1, so median =(3.4+3.5)÷ 2=3.45 kg.
Girls' total is 20.1, so mean =20.1÷ 6=3.35 kg.
Girls' sorted values are 2.5,3.1,3.4,3.4,3.7,4.0, so median =3.4 kg.
Data check
Before writing the answer, check whether a zero is a real value or a missing value. They are not the same.
The two groups are close. Boys have slightly higher mean and median in this sample.
HV
Harsh Vardhan
B.Ed Mathematics, BHU
Verified Expert
Strategic angle. Treat the data set like a story: first list what is counted, then decide whether mean, median, range or a graph answers the question best.
Boys' total is 20.6, so mean =20.6÷ 6≈ 3.43 kg.
Boys' sorted values are 2.6,3.2,3.4,3.5,3.8,4.1, so median =(3.4+3.5)÷ 2=3.45 kg.
Girls' total is 20.1, so mean =20.1÷ 6=3.35 kg.
Girls' sorted values are 2.5,3.1,3.4,3.4,3.7,4.0, so median =3.4 kg.
This second route prevents a common statistics error: using one large or small value to speak for the whole group without checking the spread.
The two groups are close. Boys have slightly higher mean and median in this sample.
Q 5.11
The dot plots of another Grade 5 section are shown. Share observations and compare the two sections.
Concept used. This question uses reading given central tendency labels. The key is to read the data first, then choose the right representative value or graph rule.
Source anchor
NCERT Class 7 Ganita Prakash Part 2, Chapter 5: Connecting the Dots, Page 113, Figure it Out 6.
For this section, the whole-class mean is 141.21 cm and the median is 142.5 cm.
Boys have mean 142.05 cm and median 143 cm.
Girls have mean 140.14 cm and median 140 cm.
So boys are slightly taller on both mean and median in this section.
Compared with the earlier section, these central values are lower, so this section is shorter overall.
Data check
Before writing the answer, check whether a zero is a real value or a missing value. They are not the same.
This section has boys slightly taller than girls, and its overall heights are lower than the earlier section shown in the chapter.
IM
Isha Malhotra
M.Sc Statistics, Panjab University
Verified Expert
Strategic angle. Treat the data set like a story: first list what is counted, then decide whether mean, median, range or a graph answers the question best.
For this section, the whole-class mean is 141.21 cm and the median is 142.5 cm.
Boys have mean 142.05 cm and median 143 cm.
Girls have mean 140.14 cm and median 140 cm.
So boys are slightly taller on both mean and median in this section.
Compared with the earlier section, these central values are lower, so this section is shorter overall.
This second route prevents a common statistics error: using one large or small value to speak for the whole group without checking the spread.
This section has boys slightly taller than girls, and its overall heights are lower than the earlier section shown in the chapter.
Q 5.12
Weights of sumo wrestlers are 295.2, 250.7, 234.1, 221.0, 200.9 kg. Weights of ballet dancers are 40.3, 37.6, 38.8, 45.5, 44.1, 48.2 kg. Approximately how many times heavier is a sumo wrestler than a ballet dancer?
Concept used. This question uses ratio of two means. The key is to read the data first, then choose the right representative value or graph rule.
Source anchor
NCERT Class 7 Ganita Prakash Part 2, Chapter 5: Connecting the Dots, Page 113, Figure it Out 7.
Mean sumo weight =(295.2+250.7+234.1+221.0+200.9)÷ 5=240.38 kg.
Mean ballet dancer weight =(40.3+37.6+38.8+45.5+44.1+48.2)÷ 6≈ 42.42 kg.
Ratio =240.38÷ 42.42≈ 5.67.
Data check
Before writing the answer, check whether a zero is a real value or a missing value. They are not the same.
A sumo wrestler is about 5.7 times as heavy as a ballet dancer, using the given means.
KS
Karan Shah
M.Sc Mathematics, Gujarat University
Verified Expert
Strategic angle. Treat the data set like a story: first list what is counted, then decide whether mean, median, range or a graph answers the question best.
Mean sumo weight =(295.2+250.7+234.1+221.0+200.9)÷ 5=240.38 kg.
Mean ballet dancer weight =(40.3+37.6+38.8+45.5+44.1+48.2)÷ 6≈ 42.42 kg.
Ratio =240.38÷ 42.42≈ 5.67.
This second route prevents a common statistics error: using one large or small value to speak for the whole group without checking the spread.
A sumo wrestler is about 5.7 times as heavy as a ballet dancer, using the given means.
Q 5.13
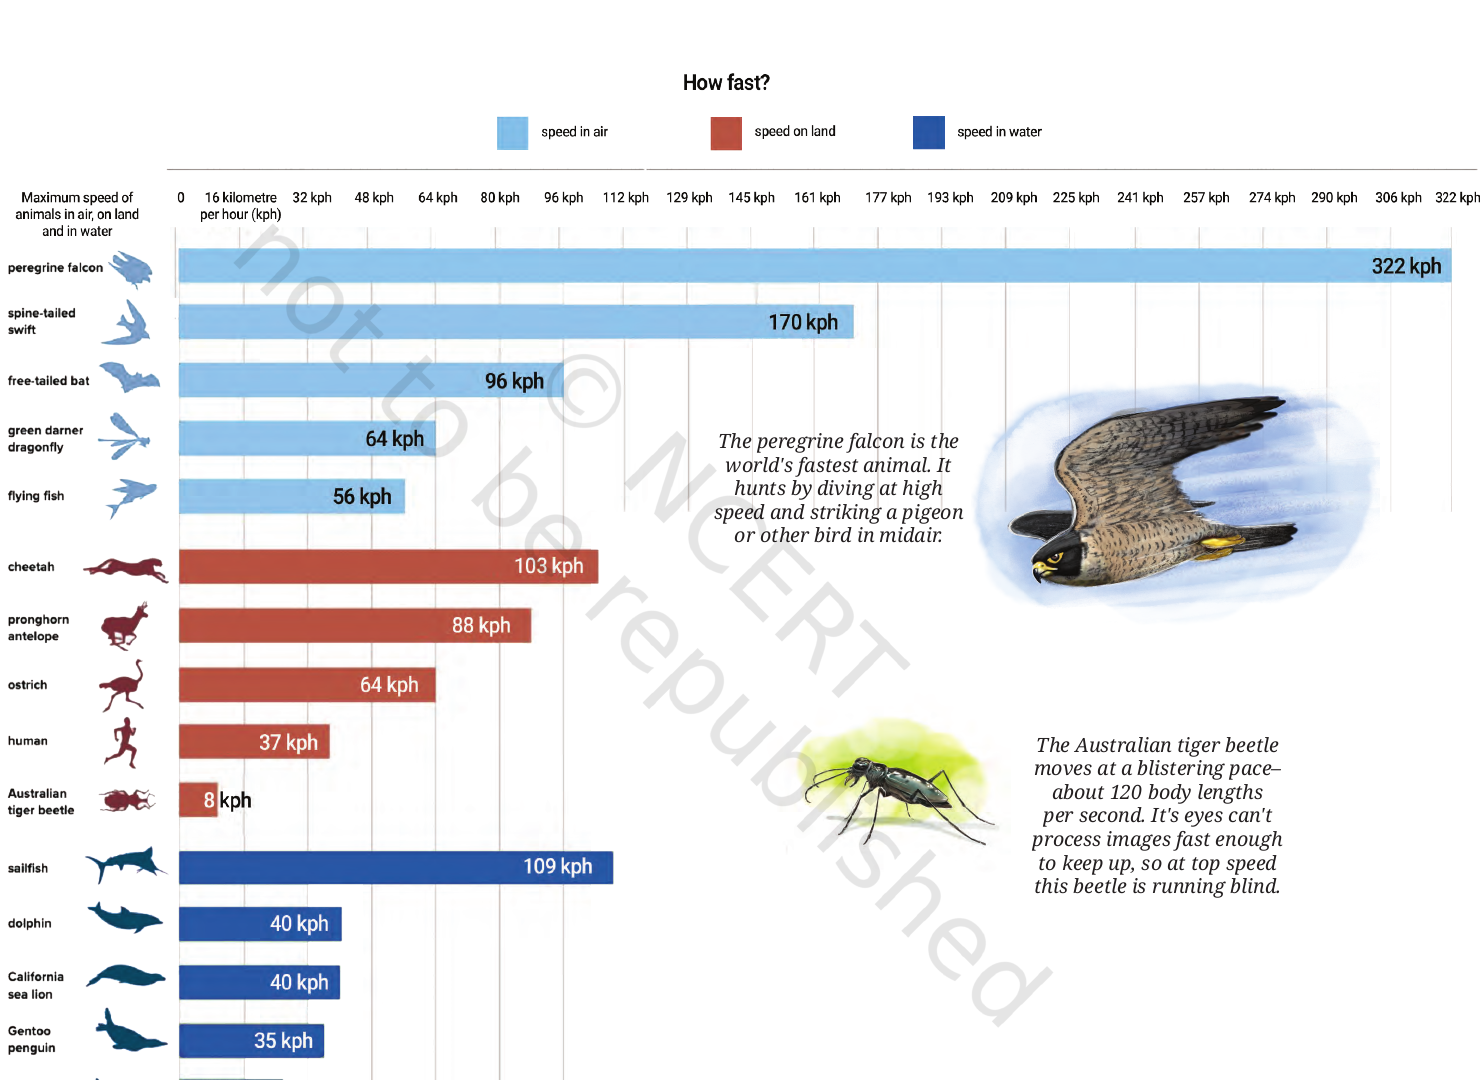
The animal-speed infographic shows speeds in air, on land and in water. Can we call it a bar graph? Answer parts about scale, an interesting pair, and whether sailfish is about 4 times faster than a humpback whale.
Source figure from NCERT Class 7 Ganita Prakash Part 2, Pages 122-123, Figure it Out 1.
Concept used. This question uses interpreting an infographic. The key is to read the data first, then choose the right representative value or graph rule.
Source anchor
NCERT Class 7 Ganita Prakash Part 2, Chapter 5: Connecting the Dots, Pages 122-123, Figure it Out 1.
It is an infographic with bar-like columns, but it is not a standard bar graph because pictures and rotated labels are part of the display.
The vertical scale is marked in steps of 16 km per hour.
A useful twice-speed pair is green darner dragonfly at 64 km per hour and gentoo penguin at 35 km per hour, which is roughly double.
Sailfish speed is 109 km per hour and humpback whale speed is 26 km per hour.
The ratio is 109÷ 26≈ 4.19.
Data check
Before writing the answer, check whether a zero is a real value or a missing value. They are not the same.
It is better called an infographic. From this data, sailfish is about 4 times faster than a humpback whale, but the graph alone cannot prove it is the fastest aquatic animal in the world.
LT
Leela Thomas
B.Sc Mathematics, Kerala University
Verified Expert
Strategic angle. Treat the data set like a story: first list what is counted, then decide whether mean, median, range or a graph answers the question best.
It is an infographic with bar-like columns, but it is not a standard bar graph because pictures and rotated labels are part of the display.
The vertical scale is marked in steps of 16 km per hour.
A useful twice-speed pair is green darner dragonfly at 64 km per hour and gentoo penguin at 35 km per hour, which is roughly double.
Sailfish speed is 109 km per hour and humpback whale speed is 26 km per hour.
The ratio is 109÷ 26≈ 4.19.
This second route prevents a common statistics error: using one large or small value to speak for the whole group without checking the spread.
It is better called an infographic. From this data, sailfish is about 4 times faster than a humpback whale, but the graph alone cannot prove it is the fastest aquatic animal in the world.
Q 5.14
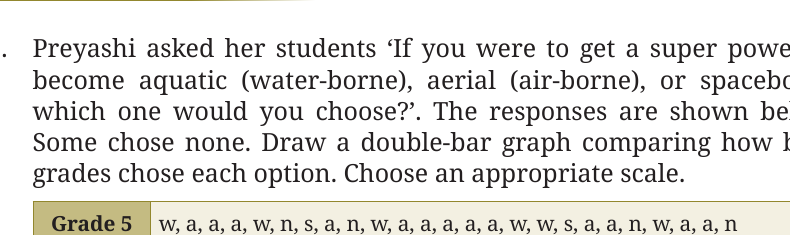
Preyashi asked Grade 5 and Grade 9 students to choose aquatic, aerial, spaceborne or none as a super power. Draw a double-bar graph and choose a scale.
Source figure from NCERT Class 7 Ganita Prakash Part 2, Page 124, Figure it Out 2.
Concept used. This question uses frequency table for a double-bar graph. The key is to read the data first, then choose the right representative value or graph rule.
Source anchor
NCERT Class 7 Ganita Prakash Part 2, Chapter 5: Connecting the Dots, Page 124, Figure it Out 2.
Count Grade 5 responses: aerial 13, water 6, space 2, none 4.
Count Grade 9 responses: aerial 8, water 6, space 9, none 2.
A convenient scale is 1 unit =2 students.
Draw four clusters: water, aerial, space and none, with one bar for each grade in every cluster.
Data check
Before writing the answer, check whether a zero is a real value or a missing value. They are not the same.
Grade 5 mostly chose aerial. Grade 9 chose spaceborne most often. Water was chosen equally by both grades.
MK
Manav Kulkarni
M.Sc Statistics, Savitribai Phule Pune University
Verified Expert
Strategic angle. Treat the data set like a story: first list what is counted, then decide whether mean, median, range or a graph answers the question best.
Count Grade 5 responses: aerial 13, water 6, space 2, none 4.
Count Grade 9 responses: aerial 8, water 6, space 9, none 2.
A convenient scale is 1 unit =2 students.
Draw four clusters: water, aerial, space and none, with one bar for each grade in every cluster.
This second route prevents a common statistics error: using one large or small value to speak for the whole group without checking the spread.
Grade 5 mostly chose aerial. Grade 9 chose spaceborne most often. Water was chosen equally by both grades.
Q 5.15
Temperatures over two days in Jodhpur are given for 12 am, 3 am, 6 am, 9 am, 12 pm, 3 pm, 6 pm and 9 pm. Draw a double-bar graph with scale 1 unit = 4 degree C. Guess the months.
Concept used. This question uses temperature comparison by double-bar graph. The key is to read the data first, then choose the right representative value or graph rule.
Source anchor
NCERT Class 7 Ganita Prakash Part 2, Chapter 5: Connecting the Dots, Page 124, Figure it Out 3.
Day 1 values are 20,18,16,20,26,34,30,24 degree C.
Day 2 values are 37,34,30,33,37,43,42,39 degree C.
Use the time labels on the horizontal axis and temperature on the vertical axis.
Day 1 is much cooler and could be a winter month.
Day 2 is very hot and could be May or June in Jodhpur.
Data check
Before writing the answer, check whether a zero is a real value or a missing value. They are not the same.
Day 1 likely belongs to winter. Day 2 likely belongs to peak summer.
NS
Neha Saxena
B.Ed Mathematics, Lucknow University
Verified Expert
Strategic angle. Treat the data set like a story: first list what is counted, then decide whether mean, median, range or a graph answers the question best.
Day 1 values are 20,18,16,20,26,34,30,24 degree C.
Day 2 values are 37,34,30,33,37,43,42,39 degree C.
Use the time labels on the horizontal axis and temperature on the vertical axis.
Day 1 is much cooler and could be a winter month.
Day 2 is very hot and could be May or June in Jodhpur.
This second route prevents a common statistics error: using one large or small value to speak for the whole group without checking the spread.
Day 1 likely belongs to winter. Day 2 likely belongs to peak summer.
Q 5.16
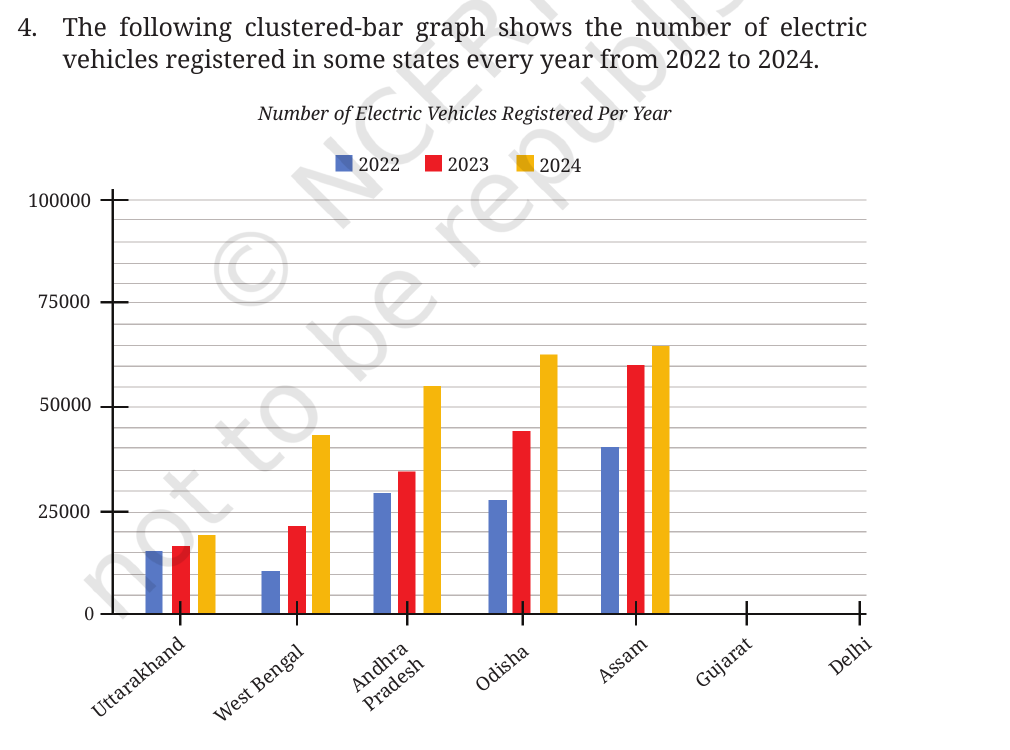
The clustered-bar graph shows electric vehicle registrations from 2022 to 2024. Fill Gujarat and Delhi from the table, describe changes, estimate Assam's increase, compare West Bengal, and check the Uttarakhand statement.
Source figure from NCERT Class 7 Ganita Prakash Part 2, Pages 124-125, Figure it Out 4.
Concept used. This question uses clustered bar graph interpretation. The key is to read the data first, then choose the right representative value or graph rule.
Source anchor
NCERT Class 7 Ganita Prakash Part 2, Chapter 5: Connecting the Dots, Pages 124-125, Figure it Out 4.
For Gujarat, mark bars at 69000, 89000, 78000 for 2022, 2023 and 2024.
For Delhi, mark bars at 62000, 74000, 81000.
Most shown states increased from 2022 to 2024, though some have a smaller rise after 2023.
Assam rose from about 40000 in 2022 to about 60000 in 2023, an increase of about 20000.
West Bengal rose from about 11000 to about 43000, which is nearly 4 times.
The Uttarakhand statement is not correct because small increase in bar length means small growth, not very few registrations.
Data check
Before writing the answer, check whether a zero is a real value or a missing value. They are not the same.
Gujarat: 69000,89000,78000; Delhi: 62000,74000,81000. Assam increased by about 20000, and West Bengal became about 4 times its 2022 value.
OP
Om Prakash
M.Sc Mathematics, University of Rajasthan
Verified Expert
Strategic angle. Treat the data set like a story: first list what is counted, then decide whether mean, median, range or a graph answers the question best.
For Gujarat, mark bars at 69000, 89000, 78000 for 2022, 2023 and 2024.
For Delhi, mark bars at 62000, 74000, 81000.
Most shown states increased from 2022 to 2024, though some have a smaller rise after 2023.
Assam rose from about 40000 in 2022 to about 60000 in 2023, an increase of about 20000.
West Bengal rose from about 11000 to about 43000, which is nearly 4 times.
This second route prevents a common statistics error: using one large or small value to speak for the whole group without checking the spread.
Gujarat: 69000,89000,78000; Delhi: 62000,74000,81000. Assam increased by about 20000, and West Bengal became about 4 times its 2022 value.
Q 5.17
The dot plots show the number of pockets on clothing for boys and girls. Decide which statements are true.
Source figure from NCERT Class 7 Ganita Prakash Part 2, Page 129, Figure it Out 1.
Concept used. This question uses mean, median and range from dot plots. The key is to read the data first, then choose the right representative value or graph rule.
Source anchor
NCERT Class 7 Ganita Prakash Part 2, Chapter 5: Connecting the Dots, Page 129, Figure it Out 1.
From the plot, boys' values are one 3, four 4s, five 5s and two 6s.
Boys have median 5, mean 56÷ 12≈ 4.67, maximum 6, and range 3.
Girls' values include 0,2, five 3s, six 4s, 5 and 6.
Girls have median 4, mean 52÷ 15≈ 3.47, maximum 6, and range 6.
So girls' data varies more, boys' median is higher, girls' mean is not higher, and both maxima are equal.
Data check
Before writing the answer, check whether a zero is a real value or a missing value. They are not the same.
Only statement (b) is true.
PD
Priya Dutta
M.Sc Applied Mathematics, NIT Durgapur
Verified Expert
Strategic angle. Treat the data set like a story: first list what is counted, then decide whether mean, median, range or a graph answers the question best.
From the plot, boys' values are one 3, four 4s, five 5s and two 6s.
Boys have median 5, mean 56÷ 12≈ 4.67, maximum 6, and range 3.
Girls' values include 0,2, five 3s, six 4s, 5 and 6.
Girls have median 4, mean 52÷ 15≈ 3.47, maximum 6, and range 6.
So girls' data varies more, boys' median is higher, girls' mean is not higher, and both maxima are equal.
This second route prevents a common statistics error: using one large or small value to speak for the whole group without checking the spread.
Only statement (b) is true.
Q 5.18
The table shows points scored by players A, B and C in four games. Find A's average, decide whether C's mean uses 3 or 4 games, and identify the best performer.
Concept used. This question uses zero value versus did not play. The key is to read the data first, then choose the right representative value or graph rule.
Source anchor
NCERT Class 7 Ganita Prakash Part 2, Chapter 5: Connecting the Dots, Pages 129-130, Figure it Out 2.
A scored 14+16+10+10=50 points in 4 games, so mean =12.5.
C did not play Game 3, so C's mean should use 3 games, not 4.
C's mean is (8+11+13)÷ 3=10.67 approximately.
B played all 4 games, including a real zero, so B's mean is (0+8+6+4)÷ 4=4.5.
A has the highest mean.
Data check
Before writing the answer, check whether a zero is a real value or a missing value. They are not the same.
A is the best performer by average points per played game.
RN
Rahul Nambiar
B.Sc Mathematics, Calicut University
Verified Expert
Strategic angle. Treat the data set like a story: first list what is counted, then decide whether mean, median, range or a graph answers the question best.
A scored 14+16+10+10=50 points in 4 games, so mean =12.5.
C did not play Game 3, so C's mean should use 3 games, not 4.
C's mean is (8+11+13)÷ 3=10.67 approximately.
B played all 4 games, including a real zero, so B's mean is (0+8+6+4)÷ 4=4.5.
A has the highest mean.
This second route prevents a common statistics error: using one large or small value to speak for the whole group without checking the spread.
A is the best performer by average points per played game.
Q 5.19
Two groups scored in a General Knowledge quiz. Group 1: 85, 76, 90, 85, 39, 48, 56, 95, 81, 75. Group 2: 68, 59, 73, 86, 47, 79, 90, 93, 86. Compare using mean and median.
Concept used. This question uses mean and median comparison. The key is to read the data first, then choose the right representative value or graph rule.
Source anchor
NCERT Class 7 Ganita Prakash Part 2, Chapter 5: Connecting the Dots, Page 130, Figure it Out 3.
Group 1 total is 730, so mean =730÷ 10=73.
Group 1 sorted middle values are 76 and 81, so median =78.5.
Group 2 total is 681, so mean =681÷ 9≈ 75.67.
Group 2 sorted middle value is 79, so median =79.
Group 2 is slightly ahead by both mean and median.
Data check
Before writing the answer, check whether a zero is a real value or a missing value. They are not the same.
Group 2 performed slightly better. Its mean is about 75.67 and median is 79.
SJ
Shruti Jain
M.Sc Mathematics, University of Delhi
Verified Expert
Strategic angle. Treat the data set like a story: first list what is counted, then decide whether mean, median, range or a graph answers the question best.
Group 1 total is 730, so mean =730÷ 10=73.
Group 1 sorted middle values are 76 and 81, so median =78.5.
Group 2 total is 681, so mean =681÷ 9≈ 75.67.
Group 2 sorted middle value is 79, so median =79.
Group 2 is slightly ahead by both mean and median.
This second route prevents a common statistics error: using one large or small value to speak for the whole group without checking the spread.
Group 2 performed slightly better. Its mean is about 75.67 and median is 79.
Q 5.20
A colony survey recorded favourite sports for watching and participating. Cricket 1240 and 620, basketball 470 and 320, swimming 510 and 320, hockey 430 and 250, athletics 250 and 105. Draw a double-bar graph and write observations.
Concept used. This question uses double-bar graph scale and comparison. The key is to read the data first, then choose the right representative value or graph rule.
Source anchor
NCERT Class 7 Ganita Prakash Part 2, Chapter 5: Connecting the Dots, Page 130, Figure it Out 4.
Use sports on the horizontal axis and counts on the vertical axis.
A scale of 1 unit =100 people is convenient because the largest value is 1240.
Draw two bars per sport: watching and participating.
Watching is higher than participating for every sport.
Cricket has the highest watching and participation counts.
Athletics has the lowest counts.
Data check
Before writing the answer, check whether a zero is a real value or a missing value. They are not the same.
Use scale 1 unit =100 people. Cricket leads both categories, and watching exceeds participating for all listed sports.
TB
Tara Banerjee
B.Ed Mathematics, Jadavpur University
Verified Expert
Strategic angle. Treat the data set like a story: first list what is counted, then decide whether mean, median, range or a graph answers the question best.
Use sports on the horizontal axis and counts on the vertical axis.
A scale of 1 unit =100 people is convenient because the largest value is 1240.
Draw two bars per sport: watching and participating.
Watching is higher than participating for every sport.
Cricket has the highest watching and participation counts.
This second route prevents a common statistics error: using one large or small value to speak for the whole group without checking the spread.
Use scale 1 unit =100 people. Cricket leads both categories, and watching exceeds participating for all listed sports.
Q 5.21
For 17 heights in cm: 106, 110, 123, 125, 117, 120, 112, 115, 110, 120, 115, 102, 115, 115, 109, 115, 101. Divide the class into two equal groups around a height. Guess their age from the height table.
Concept used. This question uses median split. The key is to read the data first, then choose the right representative value or graph rule.
Source anchor
NCERT Class 7 Ganita Prakash Part 2, Chapter 5: Connecting the Dots, Page 130, Figure it Out 5.
Sort the values: 101,102,106,109,110,110,112,115,115,115,115,115,117,120,120,123,125.
There are 17 students, so the 9th value is the median.
The median height is 115 cm.
Use 115 cm as the dividing height. Eight students are below it and eight are above it if the median student is kept as the middle value.
From the NCERT height table, an average height near 115 cm is close to age 6 to 7.
Data check
Before writing the answer, check whether a zero is a real value or a missing value. They are not the same.
Use the median, 115 cm, as the central dividing height. The group seems around age 6 to 7.
UM
Uday Mehta
M.Sc Mathematics, IIT Indore
Verified Expert
Strategic angle. Treat the data set like a story: first list what is counted, then decide whether mean, median, range or a graph answers the question best.
Sort the values: 101,102,106,109,110,110,112,115,115,115,115,115,117,120,120,123,125.
There are 17 students, so the 9th value is the median.
The median height is 115 cm.
Use 115 cm as the dividing height. Eight students are below it and eight are above it if the median student is kept as the middle value.
From the NCERT height table, an average height near 115 cm is close to age 6 to 7.
This second route prevents a common statistics error: using one large or small value to speak for the whole group without checking the spread.
Use the median, 115 cm, as the central dividing height. The group seems around age 6 to 7.
Q 5.22
Describe the mean and median of heights of your class. Visualise the heights on a dot plot.
Concept used. This question uses class data project. The key is to read the data first, then choose the right representative value or graph rule.
Source anchor
NCERT Class 7 Ganita Prakash Part 2, Chapter 5: Connecting the Dots, Page 130, Figure it Out 6.
Collect every student's height in centimetres.
Place one dot above each height or each rounded height on a number line.
Mean =sum of heightsnumber of students.
Median is the middle value after sorting, or the average of two middle values if the count is even.
Compare the mean and median to see whether any very tall or very short value pulls the mean.
Data check
Before writing the answer, check whether a zero is a real value or a missing value. They are not the same.
The numerical answer depends on your class data. Use the mean and median rules above.
VK
Vidya Krishnan
B.Sc Mathematics, Bharathiar University
Verified Expert
Strategic angle. Treat the data set like a story: first list what is counted, then decide whether mean, median, range or a graph answers the question best.
Collect every student's height in centimetres.
Place one dot above each height or each rounded height on a number line.
Mean =sum of heightsnumber of students.
Median is the middle value after sorting, or the average of two middle values if the count is even.
Compare the mean and median to see whether any very tall or very short value pulls the mean.
This second route prevents a common statistics error: using one large or small value to speak for the whole group without checking the spread.
The numerical answer depends on your class data. Use the mean and median rules above.
Q 5.23
Two Grade 7 sections each have 15 boys and 15 girls. One section has mean height 154.2 cm. What must be true about the mean height of the other section?
Concept used. This question uses insufficient information. The key is to read the data first, then choose the right representative value or graph rule.
Source anchor
NCERT Class 7 Ganita Prakash Part 2, Chapter 5: Connecting the Dots, Pages 130-131, Figure it Out 7.
The mean of one section tells us only about that section.
No height values or mean is given for the other section.
The other section could have the same mean, a lower mean, or a higher mean depending on its students.
Data check
Before writing the answer, check whether a zero is a real value or a missing value. They are not the same.
Option (d): the mean height of students in the other section cannot be determined.
YA
Yash Agarwal
M.Sc Mathematics, IIT Kanpur
Verified Expert
Strategic angle. Treat the data set like a story: first list what is counted, then decide whether mean, median, range or a graph answers the question best.
The mean of one section tells us only about that section.
No height values or mean is given for the other section.
The other section could have the same mean, a lower mean, or a higher mean depending on its students.
This second route prevents a common statistics error: using one large or small value to speak for the whole group without checking the spread.
Option (d): the mean height of students in the other section cannot be determined.
Q 5.24
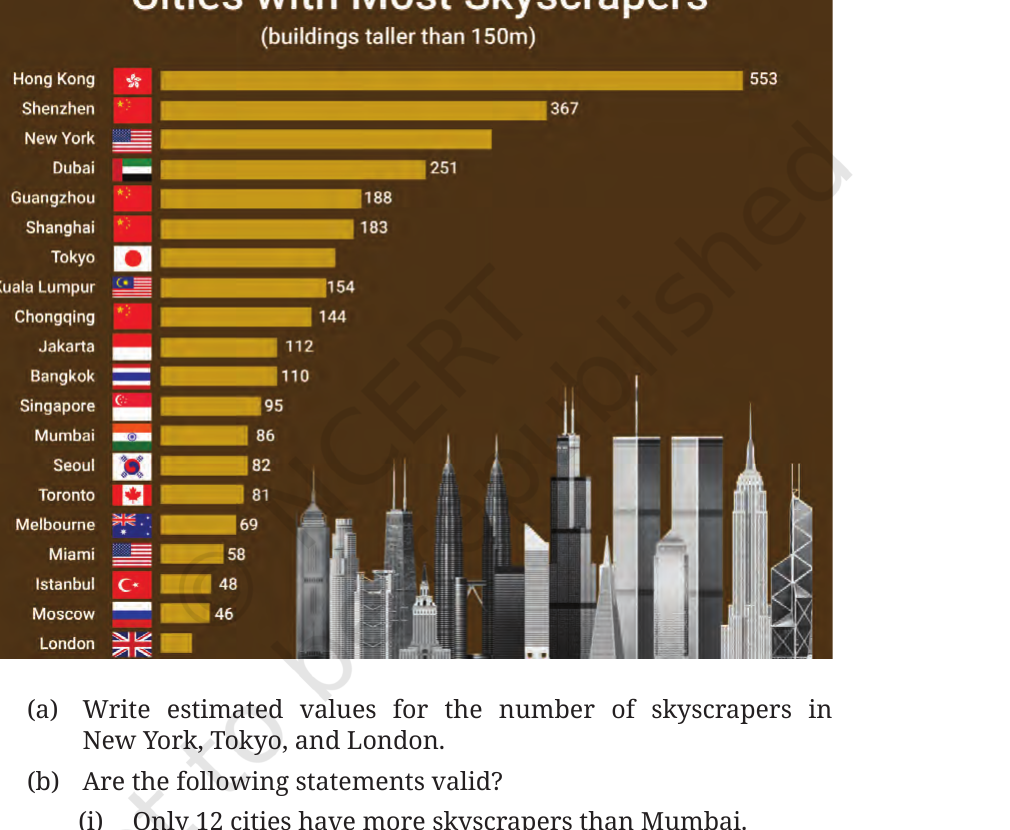
Standing tall in the storm: use the skyscraper infographic to estimate values for New York, Tokyo and London, and check three statements about Mumbai and Hong Kong.
Source figure from NCERT Class 7 Ganita Prakash Part 2, Page 131, Figure it Out 8.
Concept used. This question uses bar infographic interpretation. The key is to read the data first, then choose the right representative value or graph rule.
Source anchor
NCERT Class 7 Ganita Prakash Part 2, Chapter 5: Connecting the Dots, Page 131, Figure it Out 8.
New York is about 300 skyscrapers from the bar length.
Tokyo is about 170 skyscrapers from the bar length.
London is about 30 skyscrapers from the bar length.
Mumbai has 86 skyscrapers. There are 12 cities above Mumbai in the displayed list, so statement (i) is valid for this list.
There are 7 cities below Mumbai in the displayed list, so statement (ii) is valid for this list.
The chart counts skyscrapers by city. It does not say where the tallest building in the world is, so statement (iii) is not justified.
Data check
Before writing the answer, check whether a zero is a real value or a missing value. They are not the same.
New York about 300, Tokyo about 170, London about 30. Statements (i) and (ii) are valid from the chart, while (iii) is not justified.
ZS
Zoya Siddiqui
B.Ed Mathematics, Aligarh Muslim University
Verified Expert
Strategic angle. Treat the data set like a story: first list what is counted, then decide whether mean, median, range or a graph answers the question best.
New York is about 300 skyscrapers from the bar length.
Tokyo is about 170 skyscrapers from the bar length.
London is about 30 skyscrapers from the bar length.
Mumbai has 86 skyscrapers. There are 12 cities above Mumbai in the displayed list, so statement (i) is valid for this list.
There are 7 cities below Mumbai in the displayed list, so statement (ii) is valid for this list.
This second route prevents a common statistics error: using one large or small value to speak for the whole group without checking the spread.
New York about 300, Tokyo about 170, London about 30. Statements (i) and (ii) are valid from the chart, while (iii) is not justified.
Q 5.25
Estimate and then measure objects such as a pen, eraser, palm, geometry box and math notebook. Draw a double-bar graph and find the average positive difference.
Concept used. This question uses measurement error and average difference. The key is to read the data first, then choose the right representative value or graph rule.
Source anchor
NCERT Class 7 Ganita Prakash Part 2, Chapter 5: Connecting the Dots, Pages 131-132, Figure it Out 9.
Write each estimate in centimetres.
Measure each object and record the measured value.
For each object, positive difference =|estimate-measurement|.
Draw paired bars for estimate and measurement for each object.
Average difference =sum of positive differences5.
Data check
Before writing the answer, check whether a zero is a real value or a missing value. They are not the same.
The final number depends on your measurements. Use the absolute differences and divide their sum by 5.
AV
Aditi Verma
M.Sc Mathematics, Banaras Hindu University
Verified Expert
Strategic angle. Treat the data set like a story: first list what is counted, then decide whether mean, median, range or a graph answers the question best.
Write each estimate in centimetres.
Measure each object and record the measured value.
For each object, positive difference =|estimate-measurement|.
Draw paired bars for estimate and measurement for each object.
Average difference =sum of positive differences5.
This second route prevents a common statistics error: using one large or small value to speak for the whole group without checking the spread.
The final number depends on your measurements. Use the absolute differences and divide their sum by 5.
Q 5.26
Aditi's Sudoku times in seconds are 410, 400, 370, 340, 360, 400, 320, 330, 310 for Week 1 and 320, 290, 380, 280, 270, 230, 220, 240 for Week 2. Construct a dot plot and describe mean and median.
Concept used. This question uses comparing weekly dot plots. The key is to read the data first, then choose the right representative value or graph rule.
Source anchor
NCERT Class 7 Ganita Prakash Part 2, Chapter 5: Connecting the Dots, Page 132, Figure it Out 10.
Week 1 total is 3240 for 9 puzzles, so mean =360 seconds.
Week 1 sorted middle value is 360, so median =360 seconds.
Week 2 total is 2230 for 8 puzzles, so mean =278.75 seconds.
Week 2 median is (270+280)÷ 2=275 seconds.
Week 2 times are mostly lower, so Aditi became faster.
Data check
Before writing the answer, check whether a zero is a real value or a missing value. They are not the same.
Week 1 mean and median are 360 seconds. Week 2 mean is 278.75 seconds and median is 275 seconds.
BP
Bhavesh Patel
B.Sc Mathematics, MS University Baroda
Verified Expert
Strategic angle. Treat the data set like a story: first list what is counted, then decide whether mean, median, range or a graph answers the question best.
Week 1 total is 3240 for 9 puzzles, so mean =360 seconds.
Week 1 sorted middle value is 360, so median =360 seconds.
Week 2 total is 2230 for 8 puzzles, so mean =278.75 seconds.
Week 2 median is (270+280)÷ 2=275 seconds.
Week 2 times are mostly lower, so Aditi became faster.
This second route prevents a common statistics error: using one large or small value to speak for the whole group without checking the spread.
Week 1 mean and median are 360 seconds. Week 2 mean is 278.75 seconds and median is 275 seconds.
Q 5.27
Individual project: compare sentence lengths in two textbooks or analyse names in your class.
Concept used. This question uses data project design. The key is to read the data first, then choose the right representative value or graph rule.
Source anchor
NCERT Class 7 Ganita Prakash Part 2, Chapter 5: Connecting the Dots, Pages 132-133, Figure it Out 11.
For sentence length, count words in each sentence on one page from each book.
Make a dot plot for both pages, then compare mean and median.
For names, count letters in each name and make a dot plot.
To study starting letters, tally the first letter of every name.
For the vowel-consonant double-bar graph, classify each name by first and last letter.
Data check
Before writing the answer, check whether a zero is a real value or a missing value. They are not the same.
This is a project question. The result depends on the data collected, but the analysis should use dot plots, means, medians and clear comparisons.
CS
Charu Singh
M.Sc Statistics, Kumaun University
Verified Expert
Strategic angle. Treat the data set like a story: first list what is counted, then decide whether mean, median, range or a graph answers the question best.
For sentence length, count words in each sentence on one page from each book.
Make a dot plot for both pages, then compare mean and median.
For names, count letters in each name and make a dot plot.
To study starting letters, tally the first letter of every name.
For the vowel-consonant double-bar graph, classify each name by first and last letter.
This second route prevents a common statistics error: using one large or small value to speak for the whole group without checking the spread.
This is a project question. The result depends on the data collected, but the analysis should use dot plots, means, medians and clear comparisons.
Q 5.28
Long-term project: track how many times you step out of your house each day for a month, and ask another person to do the same.
Concept used. This question uses long-term data collection. The key is to read the data first, then choose the right representative value or graph rule.
Source anchor
NCERT Class 7 Ganita Prakash Part 2, Chapter 5: Connecting the Dots, Page 133, Figure it Out 12.
Record one value per day for at least one month.
Make a dot plot of the daily counts.
Find the mean and median.
Look for clusters, unusually high days and unusually low days.
Compare your data with another person's data if available.
Data check
Before writing the answer, check whether a zero is a real value or a missing value. They are not the same.
The answer depends on collected data. Report variability, mean, median and any interesting pattern.
DS
Dhruv Sethi
B.Ed Mathematics, Jamia Millia Islamia
Verified Expert
Strategic angle. Treat the data set like a story: first list what is counted, then decide whether mean, median, range or a graph answers the question best.
Record one value per day for at least one month.
Make a dot plot of the daily counts.
Find the mean and median.
Look for clusters, unusually high days and unusually low days.
Compare your data with another person's data if available.
This second route prevents a common statistics error: using one large or small value to speak for the whole group without checking the spread.
The answer depends on collected data. Report variability, mean, median and any interesting pattern.
Q 5.29
Small-group project: analyse family heights or estimate one minute and three minutes, then combine group data.
Concept used. This question uses group data analysis. The key is to read the data first, then choose the right representative value or graph rule.
Source anchor
NCERT Class 7 Ganita Prakash Part 2, Chapter 5: Connecting the Dots, Pages 133-134, Figure it Out 13.
For heights, collect each student's height and family members' heights.
Make dot plots and compare each student's height with the family mean.
For time estimation, record one-minute and three-minute estimates without counting.
Make dot plots for both tasks.
Use a double-bar graph to compare family mean estimates for one minute and three minutes.
Data check
Before writing the answer, check whether a zero is a real value or a missing value. They are not the same.
This is a group project. The report should include dot plots, double-bar graphs, means, medians and observations.
ER
Esha Roy
M.Sc Mathematics, Tezpur University
Verified Expert
Strategic angle. Treat the data set like a story: first list what is counted, then decide whether mean, median, range or a graph answers the question best.
For heights, collect each student's height and family members' heights.
Make dot plots and compare each student's height with the family mean.
For time estimation, record one-minute and three-minute estimates without counting.
Make dot plots for both tasks.
Use a double-bar graph to compare family mean estimates for one minute and three minutes.
This second route prevents a common statistics error: using one large or small value to speak for the whole group without checking the spread.
This is a group project. The report should include dot plots, double-bar graphs, means, medians and observations.
Connecting the Dots Class 7 Maths NCERT Solutions FAQs
Ques. What does Connecting the Dots Class 7 Maths teach?
Ans. It teaches statistical questions, mean, median, outliers, dot plots, double-bar graphs and data interpretation.
Ques. How many questions are solved in the Class 7 Maths Chapter 5 PDF?
Ans. The PDF covers 29 textbook prompts, including numerical questions, graph questions and project-style activities.
Ques. What is the difference between mean and median?
Ans. Mean is the sum divided by the number of values. Median is the middle value after arranging the data.
Ques. Is the Class 7 Maths Chapter 5 PDF updated for 2026-27?
Ans. Yes. The solutions follow the 2026-27 Ganita Prakash Part 2 chapter Connecting the Dots.




Chapter5ConnectingtheDots...Solutions.pdf?page=1&dpi=150)
Chapter5ConnectingtheDots...Solutions.pdf?page=2&dpi=150)
Chapter5ConnectingtheDots...Solutions.pdf?page=3&dpi=150)
Chapter5ConnectingtheDots...Solutions.pdf?page=4&dpi=150)
Chapter5ConnectingtheDots...Solutions.pdf?page=5&dpi=150)
Chapter5ConnectingtheDots...Solutions.pdf?page=6&dpi=150)
Chapter5ConnectingtheDots...Solutions.pdf?page=7&dpi=150)
Chapter5ConnectingtheDots...Solutions.pdf?page=8&dpi=150)
Chapter5ConnectingtheDots...Solutions.pdf?page=9&dpi=150)
Chapter5ConnectingtheDots...Solutions.pdf?page=10&dpi=150)
Chapter5ConnectingtheDots...Solutions.pdf?page=11&dpi=150)
Chapter5ConnectingtheDots...Solutions.pdf?page=12&dpi=150)
Chapter5ConnectingtheDots...Solutions.pdf?page=13&dpi=150)
Chapter5ConnectingtheDots...Solutions.pdf?page=14&dpi=150)
Chapter5ConnectingtheDots...Solutions.pdf?page=15&dpi=150)
Chapter5ConnectingtheDots...Solutions.pdf?page=16&dpi=150)
Chapter5ConnectingtheDots...Solutions.pdf?page=17&dpi=150)
Chapter5ConnectingtheDots...Solutions.pdf?page=18&dpi=150)
Chapter5ConnectingtheDots...Solutions.pdf?page=19&dpi=150)
Chapter5ConnectingtheDots...Solutions.pdf?page=20&dpi=150)
Chapter5ConnectingtheDots...Solutions.pdf?page=21&dpi=150)
Chapter5ConnectingtheDots...Solutions.pdf?page=22&dpi=150)
Chapter5ConnectingtheDots...Solutions.pdf?page=23&dpi=150)
Chapter5ConnectingtheDots...Solutions.pdf?page=24&dpi=150)
Chapter5ConnectingtheDots...Solutions.pdf?page=25&dpi=150)
Chapter5ConnectingtheDots...Solutions.pdf?page=26&dpi=150)
Chapter5ConnectingtheDots...Solutions.pdf?page=27&dpi=150)
Chapter5ConnectingtheDots...Solutions.pdf?page=28&dpi=150)
Chapter5ConnectingtheDots...Solutions.pdf?page=29&dpi=150)
Chapter5ConnectingtheDots...Solutions.pdf?page=30&dpi=150)
Chapter5ConnectingtheDots...Solutions.pdf?page=31&dpi=150)
Chapter5ConnectingtheDots...Solutions.pdf?page=32&dpi=150)
Chapter5ConnectingtheDots...Solutions.pdf?page=33&dpi=150)
Chapter5ConnectingtheDots...Solutions.pdf?page=34&dpi=150)
Chapter5ConnectingtheDots...Solutions.pdf?page=35&dpi=150)
Chapter5ConnectingtheDots...Solutions.pdf?page=36&dpi=150)
Chapter5ConnectingtheDots...Solutions.pdf?page=37&dpi=150)
Chapter5ConnectingtheDots...Solutions.pdf?page=38&dpi=150)
Chapter5ConnectingtheDots...Solutions.pdf?page=39&dpi=150)
Chapter5ConnectingtheDots...Solutions.pdf?page=40&dpi=150)
Chapter5ConnectingtheDots...Solutions.pdf?page=41&dpi=150)
Chapter5ConnectingtheDots...Solutions.pdf?page=42&dpi=150)
Chapter5ConnectingtheDots...Solutions.pdf?page=43&dpi=150)
Chapter5ConnectingtheDots...Solutions.pdf?page=44&dpi=150)
Chapter5ConnectingtheDots...Solutions.pdf?page=45&dpi=150)
Chapter5ConnectingtheDots...Solutions.pdf?page=46&dpi=150)
Chapter5ConnectingtheDots...Solutions.pdf?page=47&dpi=150)
Chapter5ConnectingtheDots...Solutions.pdf?page=48&dpi=150)
Chapter5ConnectingtheDots...Solutions.pdf?page=49&dpi=150)
Chapter5ConnectingtheDots...Solutions.pdf?page=50&dpi=150)
Chapter5ConnectingtheDots...Solutions_flat_MobileCard.pdf?page=1&dpi=150)
Chapter5ConnectingtheDots...Solutions_flat_MobileCard.pdf?page=2&dpi=150)
Chapter5ConnectingtheDots...Solutions_flat_MobileCard.pdf?page=3&dpi=150)
Chapter5ConnectingtheDots...Solutions_flat_MobileCard.pdf?page=4&dpi=150)
Chapter5ConnectingtheDots...Solutions_flat_MobileCard.pdf?page=5&dpi=150)
Chapter5ConnectingtheDots...Solutions_flat_MobileCard.pdf?page=6&dpi=150)
Chapter5ConnectingtheDots...Solutions_flat_MobileCard.pdf?page=7&dpi=150)
Chapter5ConnectingtheDots...Solutions_flat_MobileCard.pdf?page=8&dpi=150)
Chapter5ConnectingtheDots...Solutions_flat_MobileCard.pdf?page=9&dpi=150)
Chapter5ConnectingtheDots...Solutions_flat_MobileCard.pdf?page=10&dpi=150)
Chapter5ConnectingtheDots...Solutions_flat_MobileCard.pdf?page=11&dpi=150)
Chapter5ConnectingtheDots...Solutions_flat_MobileCard.pdf?page=12&dpi=150)
Chapter5ConnectingtheDots...Solutions_flat_MobileCard.pdf?page=13&dpi=150)
Chapter5ConnectingtheDots...Solutions_flat_MobileCard.pdf?page=14&dpi=150)
Chapter5ConnectingtheDots...Solutions_flat_MobileCard.pdf?page=15&dpi=150)
Chapter5ConnectingtheDots...Solutions_flat_MobileCard.pdf?page=16&dpi=150)
Chapter5ConnectingtheDots...Solutions_flat_MobileCard.pdf?page=17&dpi=150)
Chapter5ConnectingtheDots...Solutions_flat_MobileCard.pdf?page=18&dpi=150)
Chapter5ConnectingtheDots...Solutions_flat_MobileCard.pdf?page=19&dpi=150)
Chapter5ConnectingtheDots...Solutions_flat_MobileCard.pdf?page=20&dpi=150)
Chapter5ConnectingtheDots...Solutions_flat_MobileCard.pdf?page=21&dpi=150)
Chapter5ConnectingtheDots...Solutions_flat_MobileCard.pdf?page=22&dpi=150)
Chapter5ConnectingtheDots...Solutions_flat_MobileCard.pdf?page=23&dpi=150)
Chapter5ConnectingtheDots...Solutions_flat_MobileCard.pdf?page=24&dpi=150)
Chapter5ConnectingtheDots...Solutions_flat_MobileCard.pdf?page=25&dpi=150)
Chapter5ConnectingtheDots...Solutions_flat_MobileCard.pdf?page=26&dpi=150)
Chapter5ConnectingtheDots...Solutions_flat_MobileCard.pdf?page=27&dpi=150)
Chapter5ConnectingtheDots...Solutions_flat_MobileCard.pdf?page=28&dpi=150)
Chapter5ConnectingtheDots...Solutions_flat_MobileCard.pdf?page=29&dpi=150)
Chapter5ConnectingtheDots...Solutions_flat_MobileCard.pdf?page=30&dpi=150)
Chapter5ConnectingtheDots...Solutions_flat_MobileCard.pdf?page=31&dpi=150)
Chapter5ConnectingtheDots...Solutions_flat_MobileCard.pdf?page=32&dpi=150)
Chapter5ConnectingtheDots...Solutions_flat_MobileCard.pdf?page=33&dpi=150)
Chapter5ConnectingtheDots...Solutions_flat_MobileCard.pdf?page=34&dpi=150)
Chapter5ConnectingtheDots...Solutions_flat_MobileCard.pdf?page=35&dpi=150)
Chapter5ConnectingtheDots...Solutions_flat_MobileCard.pdf?page=36&dpi=150)
Chapter5ConnectingtheDots...Solutions_flat_MobileCard.pdf?page=37&dpi=150)
Chapter5ConnectingtheDots...Solutions_flat_MobileCard.pdf?page=38&dpi=150)
Chapter5ConnectingtheDots...Solutions_flat_MobileCard.pdf?page=39&dpi=150)
Chapter5ConnectingtheDots...Solutions_flat_MobileCard.pdf?page=40&dpi=150)
Chapter5ConnectingtheDots...Solutions_flat_MobileCard.pdf?page=41&dpi=150)
Chapter5ConnectingtheDots...Solutions_flat_MobileCard.pdf?page=42&dpi=150)
Chapter5ConnectingtheDots...Solutions_flat_MobileCard.pdf?page=43&dpi=150)
Chapter5ConnectingtheDots...Solutions_flat_MobileCard.pdf?page=44&dpi=150)
Chapter5ConnectingtheDots...Solutions_flat_MobileCard.pdf?page=45&dpi=150)
Chapter5ConnectingtheDots...Solutions_flat_MobileCard.pdf?page=46&dpi=150)
Chapter5ConnectingtheDots...Solutions_flat_MobileCard.pdf?page=47&dpi=150)
Chapter5ConnectingtheDots...Solutions_flat_MobileCard.pdf?page=48&dpi=150)
Chapter5ConnectingtheDots...Solutions_flat_MobileCard.pdf?page=49&dpi=150)
Chapter5ConnectingtheDots...Solutions_flat_MobileCard.pdf?page=50&dpi=150)
Chapter5ConnectingtheDots...Solutions_flat_MobileCard.pdf?page=51&dpi=150)
Chapter5ConnectingtheDots...Solutions_flat_MobileCard.pdf?page=52&dpi=150)
Chapter5ConnectingtheDots...Solutions_flat_MobileCard.pdf?page=53&dpi=150)
Chapter5ConnectingtheDots...Solutions_flat_MobileCard.pdf?page=54&dpi=150)
Chapter5ConnectingtheDots...Solutions_flat_MobileCard.pdf?page=55&dpi=150)
Chapter5ConnectingtheDots...Solutions_flat_MobileCard.pdf?page=56&dpi=150)
Chapter5ConnectingtheDots...Solutions_flat_MobileCard.pdf?page=57&dpi=150)
Chapter5ConnectingtheDots...Solutions_flat_MobileCard.pdf?page=58&dpi=150)
Chapter5ConnectingtheDots...Solutions_flat_MobileCard.pdf?page=59&dpi=150)
Chapter5ConnectingtheDots...Solutions_flat_MobileCard.pdf?page=60&dpi=150)
Chapter5ConnectingtheDots...Solutions_flat_MobileCard.pdf?page=61&dpi=150)
Chapter5ConnectingtheDots...Solutions_flat_MobileCard.pdf?page=62&dpi=150)
Chapter5ConnectingtheDots...Solutions_flat_MobileCard.pdf?page=63&dpi=150)
Chapter5ConnectingtheDots...Solutions_flat_MobileCard.pdf?page=64&dpi=150)
Chapter5ConnectingtheDots...Solutions_flat_MobileCard.pdf?page=65&dpi=150)
Chapter5ConnectingtheDots...Solutions_flat_MobileCard.pdf?page=66&dpi=150)
Chapter5ConnectingtheDots...Solutions_flat_MobileCard.pdf?page=67&dpi=150)
Chapter5ConnectingtheDots...Solutions_flat_MobileCard.pdf?page=68&dpi=150)
Chapter5ConnectingtheDots...Solutions_flat_MobileCard.pdf?page=69&dpi=150)
Chapter5ConnectingtheDots...Solutions_flat_MobileCard.pdf?page=70&dpi=150)
Chapter5ConnectingtheDots...Solutions_flat_MobileCard.pdf?page=71&dpi=150)
Chapter5ConnectingtheDots...Solutions_flat_MobileCard.pdf?page=72&dpi=150)
Chapter5ConnectingtheDots...Solutions_flat_MobileCard.pdf?page=73&dpi=150)
Chapter5ConnectingtheDots...Solutions_flat_MobileCard.pdf?page=74&dpi=150)
Chapter5ConnectingtheDots...Solutions_flat_MobileCard.pdf?page=75&dpi=150)
Chapter5ConnectingtheDots...Solutions_flat_MobileCard.pdf?page=76&dpi=150)
Chapter5ConnectingtheDots...Solutions_flat_MobileCard.pdf?page=77&dpi=150)
Chapter5ConnectingtheDots...Solutions_flat_MobileCard.pdf?page=78&dpi=150)
Chapter5ConnectingtheDots...Solutions_flat_MobileCard.pdf?page=79&dpi=150)
Chapter5ConnectingtheDots...Solutions_flat_MobileCard.pdf?page=80&dpi=150)
Chapter5ConnectingtheDots...Solutions_flat_MobileCard.pdf?page=81&dpi=150)
Chapter5ConnectingtheDots...Solutions_flat_MobileCard.pdf?page=82&dpi=150)
Chapter5ConnectingtheDots...Solutions_flat_MobileCard.pdf?page=83&dpi=150)
Chapter5ConnectingtheDots...Solutions_flat_MobileCard.pdf?page=84&dpi=150)
Chapter5ConnectingtheDots...Solutions_flat_MobileCard.pdf?page=85&dpi=150)
Chapter5ConnectingtheDots...Solutions_flat_MobileCard.pdf?page=86&dpi=150)
Chapter5ConnectingtheDots...Solutions_flat_MobileCard.pdf?page=87&dpi=150)
Chapter5ConnectingtheDots...Solutions_flat_MobileCard.pdf?page=88&dpi=150)
Chapter5ConnectingtheDots...Solutions_flat_MobileCard.pdf?page=89&dpi=150)
Chapter5ConnectingtheDots...Solutions_flat_MobileCard.pdf?page=90&dpi=150)
Chapter5ConnectingtheDots...Solutions_flat_MobileCard.pdf?page=91&dpi=150)




Comments