



NCERT Solutions Class 8 Maths Chapter 5 Tales by Dots and Lines cover mean, median, dot plots, line graphs, spreadsheets and data interpretation according to the 2026-27 NCERT book.
- Best for practice: all three Figure it Out sets are solved with clear steps.
- PDF ready: students can revise mean, median and graph-reading questions before tests.
- Question cards: each answer has Check Solution and Expert Solution tabs.
Chapter5TalesbyDotsandLinesSolutions.pdf?page=1&dpi=150)
Chapter5TalesbyDotsandLinesSolutions.pdf?page=2&dpi=150)
Chapter5TalesbyDotsandLinesSolutions.pdf?page=3&dpi=150)
Chapter5TalesbyDotsandLinesSolutions.pdf?page=4&dpi=150)
Chapter5TalesbyDotsandLinesSolutions.pdf?page=5&dpi=150)
Chapter5TalesbyDotsandLinesSolutions.pdf?page=6&dpi=150)
Chapter5TalesbyDotsandLinesSolutions.pdf?page=7&dpi=150)
Chapter5TalesbyDotsandLinesSolutions.pdf?page=8&dpi=150)
Chapter5TalesbyDotsandLinesSolutions.pdf?page=9&dpi=150)
Chapter5TalesbyDotsandLinesSolutions.pdf?page=10&dpi=150)
Chapter5TalesbyDotsandLinesSolutions.pdf?page=11&dpi=150)
Chapter5TalesbyDotsandLinesSolutions.pdf?page=12&dpi=150)
Chapter5TalesbyDotsandLinesSolutions.pdf?page=13&dpi=150)
Chapter5TalesbyDotsandLinesSolutions.pdf?page=14&dpi=150)
Chapter5TalesbyDotsandLinesSolutions.pdf?page=15&dpi=150)
Chapter5TalesbyDotsandLinesSolutions.pdf?page=16&dpi=150)
Chapter5TalesbyDotsandLinesSolutions.pdf?page=17&dpi=150)
Chapter5TalesbyDotsandLinesSolutions.pdf?page=18&dpi=150)
Chapter5TalesbyDotsandLinesSolutions.pdf?page=19&dpi=150)
Chapter5TalesbyDotsandLinesSolutions.pdf?page=20&dpi=150)
Chapter5TalesbyDotsandLinesSolutions.pdf?page=21&dpi=150)
Chapter5TalesbyDotsandLinesSolutions.pdf?page=22&dpi=150)
Chapter5TalesbyDotsandLinesSolutions.pdf?page=23&dpi=150)
Chapter5TalesbyDotsandLinesSolutions.pdf?page=24&dpi=150)
Chapter5TalesbyDotsandLinesSolutions.pdf?page=25&dpi=150)
Chapter5TalesbyDotsandLinesSolutions.pdf?page=26&dpi=150)
Chapter5TalesbyDotsandLinesSolutions.pdf?page=27&dpi=150)
Chapter5TalesbyDotsandLinesSolutions.pdf?page=28&dpi=150)
Chapter5TalesbyDotsandLinesSolutions.pdf?page=29&dpi=150)
Chapter5TalesbyDotsandLinesSolutions.pdf?page=30&dpi=150)
Chapter5TalesbyDotsandLinesSolutions.pdf?page=31&dpi=150)
Chapter5TalesbyDotsandLinesSolutions.pdf?page=32&dpi=150)
Chapter5TalesbyDotsandLinesSolutions.pdf?page=33&dpi=150)
Chapter5TalesbyDotsandLinesSolutions.pdf?page=34&dpi=150)
Chapter5TalesbyDotsandLinesSolutions.pdf?page=35&dpi=150)
Chapter5TalesbyDotsandLinesSolutions.pdf?page=36&dpi=150)
Chapter5TalesbyDotsandLinesSolutions.pdf?page=37&dpi=150)
Chapter5TalesbyDotsandLinesSolutions.pdf?page=38&dpi=150)
Chapter5TalesbyDotsandLinesSolutions.pdf?page=39&dpi=150)
Chapter5TalesbyDotsandLinesSolutions_flat_MobileCard.pdf?page=1&dpi=150)
Chapter5TalesbyDotsandLinesSolutions_flat_MobileCard.pdf?page=2&dpi=150)
Chapter5TalesbyDotsandLinesSolutions_flat_MobileCard.pdf?page=3&dpi=150)
Chapter5TalesbyDotsandLinesSolutions_flat_MobileCard.pdf?page=4&dpi=150)
Chapter5TalesbyDotsandLinesSolutions_flat_MobileCard.pdf?page=5&dpi=150)
Chapter5TalesbyDotsandLinesSolutions_flat_MobileCard.pdf?page=6&dpi=150)
Chapter5TalesbyDotsandLinesSolutions_flat_MobileCard.pdf?page=7&dpi=150)
Chapter5TalesbyDotsandLinesSolutions_flat_MobileCard.pdf?page=8&dpi=150)
Chapter5TalesbyDotsandLinesSolutions_flat_MobileCard.pdf?page=9&dpi=150)
Chapter5TalesbyDotsandLinesSolutions_flat_MobileCard.pdf?page=10&dpi=150)
Chapter5TalesbyDotsandLinesSolutions_flat_MobileCard.pdf?page=11&dpi=150)
Chapter5TalesbyDotsandLinesSolutions_flat_MobileCard.pdf?page=12&dpi=150)
Chapter5TalesbyDotsandLinesSolutions_flat_MobileCard.pdf?page=13&dpi=150)
Chapter5TalesbyDotsandLinesSolutions_flat_MobileCard.pdf?page=14&dpi=150)
Chapter5TalesbyDotsandLinesSolutions_flat_MobileCard.pdf?page=15&dpi=150)
Chapter5TalesbyDotsandLinesSolutions_flat_MobileCard.pdf?page=16&dpi=150)
Chapter5TalesbyDotsandLinesSolutions_flat_MobileCard.pdf?page=17&dpi=150)
Chapter5TalesbyDotsandLinesSolutions_flat_MobileCard.pdf?page=18&dpi=150)
Chapter5TalesbyDotsandLinesSolutions_flat_MobileCard.pdf?page=19&dpi=150)
Chapter5TalesbyDotsandLinesSolutions_flat_MobileCard.pdf?page=20&dpi=150)
Chapter5TalesbyDotsandLinesSolutions_flat_MobileCard.pdf?page=21&dpi=150)
Chapter5TalesbyDotsandLinesSolutions_flat_MobileCard.pdf?page=22&dpi=150)
Chapter5TalesbyDotsandLinesSolutions_flat_MobileCard.pdf?page=23&dpi=150)
Chapter5TalesbyDotsandLinesSolutions_flat_MobileCard.pdf?page=24&dpi=150)
Chapter5TalesbyDotsandLinesSolutions_flat_MobileCard.pdf?page=25&dpi=150)
Chapter5TalesbyDotsandLinesSolutions_flat_MobileCard.pdf?page=26&dpi=150)
Chapter5TalesbyDotsandLinesSolutions_flat_MobileCard.pdf?page=27&dpi=150)
Chapter5TalesbyDotsandLinesSolutions_flat_MobileCard.pdf?page=28&dpi=150)
Chapter5TalesbyDotsandLinesSolutions_flat_MobileCard.pdf?page=29&dpi=150)
Chapter5TalesbyDotsandLinesSolutions_flat_MobileCard.pdf?page=30&dpi=150)
Chapter5TalesbyDotsandLinesSolutions_flat_MobileCard.pdf?page=31&dpi=150)
Chapter5TalesbyDotsandLinesSolutions_flat_MobileCard.pdf?page=32&dpi=150)
Chapter5TalesbyDotsandLinesSolutions_flat_MobileCard.pdf?page=33&dpi=150)
Chapter5TalesbyDotsandLinesSolutions_flat_MobileCard.pdf?page=34&dpi=150)
Chapter5TalesbyDotsandLinesSolutions_flat_MobileCard.pdf?page=35&dpi=150)
Chapter5TalesbyDotsandLinesSolutions_flat_MobileCard.pdf?page=36&dpi=150)
Chapter5TalesbyDotsandLinesSolutions_flat_MobileCard.pdf?page=37&dpi=150)
Chapter5TalesbyDotsandLinesSolutions_flat_MobileCard.pdf?page=38&dpi=150)
Chapter5TalesbyDotsandLinesSolutions_flat_MobileCard.pdf?page=39&dpi=150)
Chapter5TalesbyDotsandLinesSolutions_flat_MobileCard.pdf?page=40&dpi=150)
Chapter5TalesbyDotsandLinesSolutions_flat_MobileCard.pdf?page=41&dpi=150)
Chapter5TalesbyDotsandLinesSolutions_flat_MobileCard.pdf?page=42&dpi=150)
Chapter5TalesbyDotsandLinesSolutions_flat_MobileCard.pdf?page=43&dpi=150)
Chapter5TalesbyDotsandLinesSolutions_flat_MobileCard.pdf?page=44&dpi=150)
Chapter5TalesbyDotsandLinesSolutions_flat_MobileCard.pdf?page=45&dpi=150)
Chapter5TalesbyDotsandLinesSolutions_flat_MobileCard.pdf?page=46&dpi=150)
Chapter5TalesbyDotsandLinesSolutions_flat_MobileCard.pdf?page=47&dpi=150)
Chapter5TalesbyDotsandLinesSolutions_flat_MobileCard.pdf?page=48&dpi=150)
Chapter5TalesbyDotsandLinesSolutions_flat_MobileCard.pdf?page=49&dpi=150)
Chapter5TalesbyDotsandLinesSolutions_flat_MobileCard.pdf?page=50&dpi=150)
Chapter5TalesbyDotsandLinesSolutions_flat_MobileCard.pdf?page=51&dpi=150)
Chapter5TalesbyDotsandLinesSolutions_flat_MobileCard.pdf?page=52&dpi=150)
Chapter5TalesbyDotsandLinesSolutions_flat_MobileCard.pdf?page=53&dpi=150)
Chapter5TalesbyDotsandLinesSolutions_flat_MobileCard.pdf?page=54&dpi=150)
Chapter5TalesbyDotsandLinesSolutions_flat_MobileCard.pdf?page=55&dpi=150)
Chapter5TalesbyDotsandLinesSolutions_flat_MobileCard.pdf?page=56&dpi=150)
Chapter5TalesbyDotsandLinesSolutions_flat_MobileCard.pdf?page=57&dpi=150)
Chapter5TalesbyDotsandLinesSolutions_flat_MobileCard.pdf?page=58&dpi=150)
Chapter5TalesbyDotsandLinesSolutions_flat_MobileCard.pdf?page=59&dpi=150)
Chapter5TalesbyDotsandLinesSolutions_flat_MobileCard.pdf?page=60&dpi=150)
Chapter5TalesbyDotsandLinesSolutions_flat_MobileCard.pdf?page=61&dpi=150)
Chapter5TalesbyDotsandLinesSolutions_flat_MobileCard.pdf?page=62&dpi=150)
Chapter5TalesbyDotsandLinesSolutions_flat_MobileCard.pdf?page=63&dpi=150)
Chapter5TalesbyDotsandLinesSolutions_flat_MobileCard.pdf?page=64&dpi=150)
Chapter5TalesbyDotsandLinesSolutions_flat_MobileCard.pdf?page=65&dpi=150)
Chapter5TalesbyDotsandLinesSolutions_flat_MobileCard.pdf?page=66&dpi=150)
Chapter5TalesbyDotsandLinesSolutions_flat_MobileCard.pdf?page=67&dpi=150)
Chapter5TalesbyDotsandLinesSolutions_flat_MobileCard.pdf?page=68&dpi=150)
Chapter5TalesbyDotsandLinesSolutions_flat_MobileCard.pdf?page=69&dpi=150)
Chapter5TalesbyDotsandLinesSolutions_flat_MobileCard.pdf?page=70&dpi=150)
Chapter5TalesbyDotsandLinesSolutions_flat_MobileCard.pdf?page=71&dpi=150)
Chapter5TalesbyDotsandLinesSolutions_flat_MobileCard.pdf?page=72&dpi=150)
Chapter5TalesbyDotsandLinesSolutions_flat_MobileCard.pdf?page=73&dpi=150)
Chapter5TalesbyDotsandLinesSolutions_flat_MobileCard.pdf?page=74&dpi=150)
Chapter5TalesbyDotsandLinesSolutions_flat_MobileCard.pdf?page=75&dpi=150)
Chapter5TalesbyDotsandLinesSolutions_flat_MobileCard.pdf?page=76&dpi=150)
Chapter5TalesbyDotsandLinesSolutions_flat_MobileCard.pdf?page=77&dpi=150)
What Class 8 Maths Chapter 5 Solutions Include
The chapter teaches students how a set of numbers can be described with a single value. Mean works like a fair share and a balance point. Median depends on the middle value after sorting. The solutions below use both ideas with totals, frequencies and graph readings.
The PDF has answers for 29 NCERT questions. It covers the first Figure it Out set from pages 113 to 116, the line-graph set from pages 122 to 123, and the mixed practice set from pages 127 to 132.
Tales by Dots and Lines Video Solutions
Source: MOS Classes Maths (Shine Luthra) on YouTube
Mean and Median Formulae Used in the Solutions
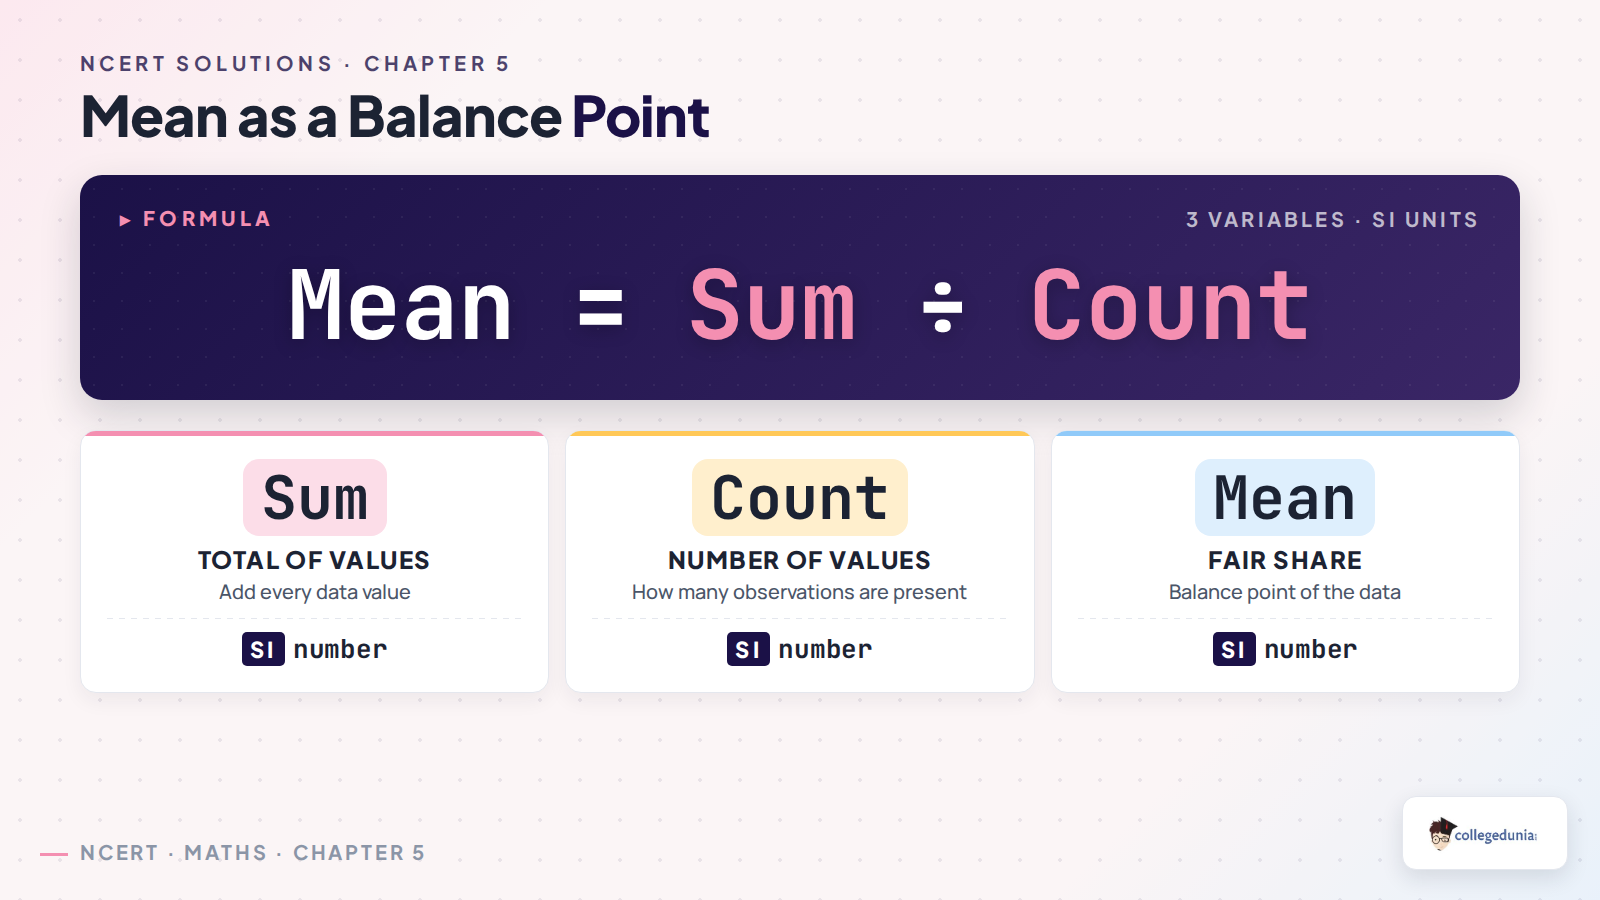
Mean questions use the formula mean = sum of all values divided by number of values. If a value is missing, first find the required total and then subtract the known total. Median questions begin by sorting the data.
- For an odd number of values, the median is the single middle value.
- For an even number of values, the median is the average of the two middle values.
- For frequency data, multiply each value by its frequency before finding the mean.
How to Read Line Graph Questions in Tales by Dots and Lines
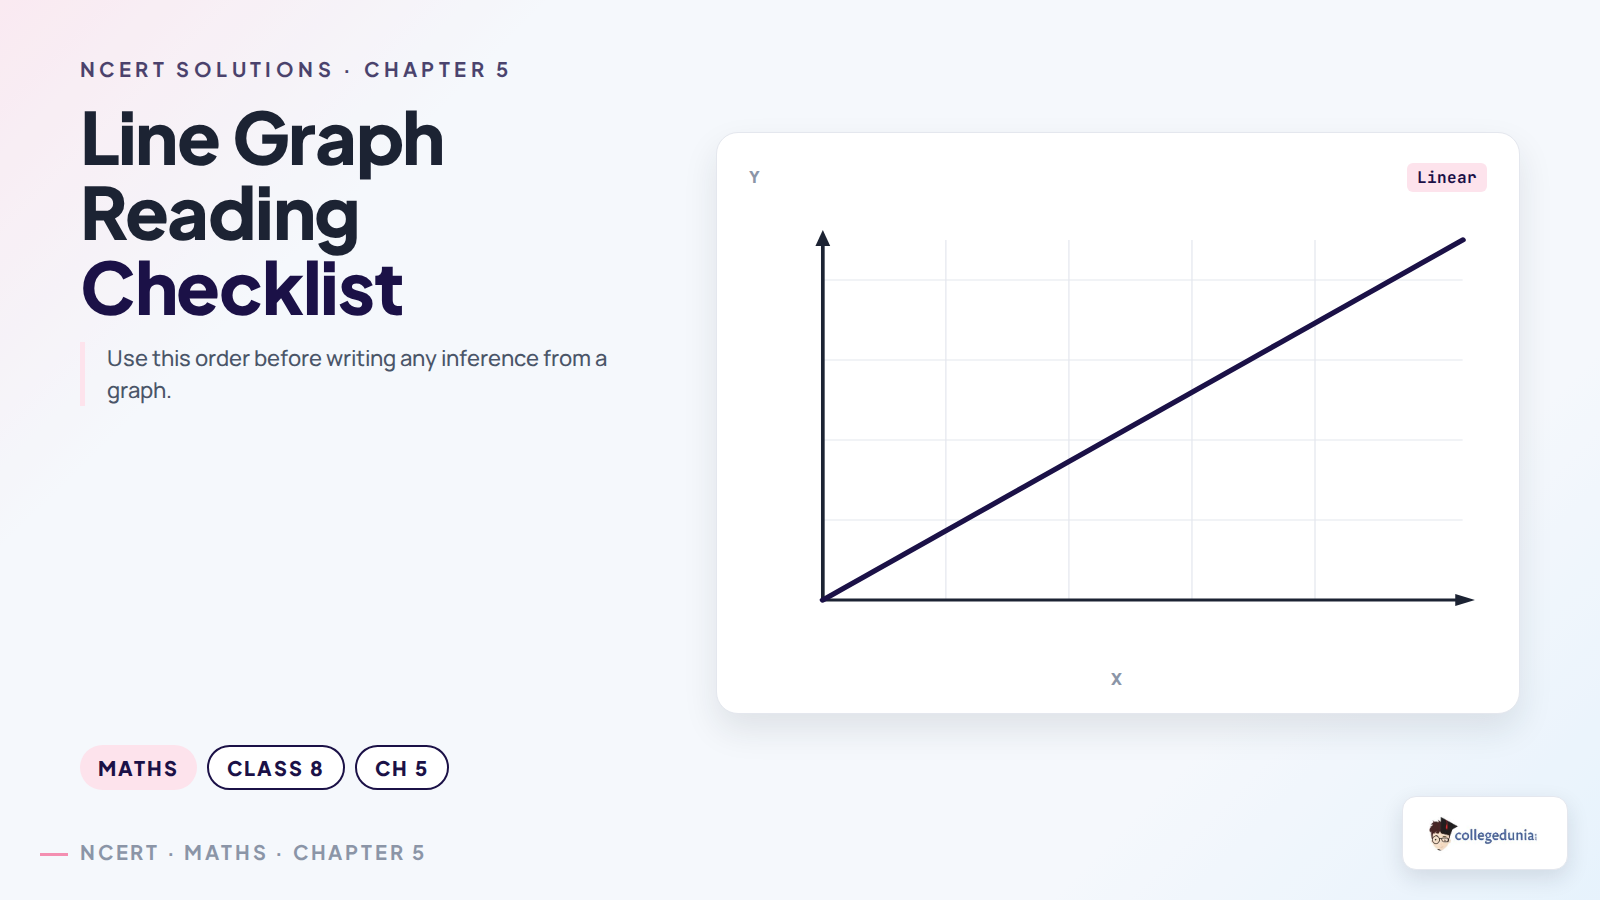
Line graphs in this chapter show change over time. Students must read the axes first, then compare peaks, low points and steady stretches. Do not claim more than the graph shows. A graph of average time does not prove what every individual student does.
The solutions use approximate values where the textbook asks for estimates. For example, the births graph and sunrise-sunset graph require readings from plotted points, so the answer states values as approximate.
Important Answer Checks for Chapter 5
| Question Type | Key Check |
|---|---|
| Missing mean value | Required total minus visible total gives the missing value. |
| Median after adding or removing values | Sort again and locate the new middle position. |
| Dot plot mean | Use each dot position as a data value. |
| Line graph inference | Read the axes and support every statement with visible data. |
Open the Interactive Question Cards
Use the separate question-card page when you want to practise one question at a time. It keeps the Check Solution and Expert Solution panels collapsed by default.
Related Class 8 Mathematics Chapter 5 Resources
Also Check: Use these resources with the solutions PDF while revising the same chapter.
| Resource | Use |
|---|---|
| Class 8 Maths Chapter 5 Notes | Quick revision of mean, median and graphs. |
| Class 8 Maths Chapter 5 Handwritten Notes | Fast recap for formulas and examples. |
| Class 8 Maths Chapter 5 NCERT Book PDF | Official textbook reading and graphs. |
All Chapters Class 8 Mathematics Part 2 NCERT Solutions
| Chapter | Solutions Link |
|---|---|
| Chapter 1 | Fractions in Disguise Solutions |
| Chapter 2 | The Baudhayana Pythagoras Theorem Solutions |
| Chapter 3 | Proportional Reasoning 2 Solutions |
| Chapter 4 | Exploring Some Geometric Themes Solutions |
| Chapter 5 | Tales by Dots and Lines Solutions |
| Chapter 6 | Algebra Play Solutions |
| Chapter 7 | Area Solutions |
Tales by Dots and Lines Class 8 NCERT Solutions FAQs
Ques. What is covered in NCERT Solutions Class 8 Maths Chapter 5?
Ans. The solutions cover mean, median, frequency tables, spreadsheets, line graphs, infographics and activity strips from the 2026-27 NCERT chapter.
Ques. Are the Class 8 Maths Chapter 5 solutions available as a PDF?
Ans. Yes. The page includes a downloadable PDF with step-by-step answers and a separate question-card page for practice.
Ques. What is the quickest way to solve mean questions?
Ans. Find the total first. Then divide by the number of values, or use mean multiplied by count when the total is missing.
Ques. How should students answer line graph questions?
Ans. Read the axes, note the scale, compare high and low points, and write only those inferences that the graph supports.



Comments