



Exams Prep Master
A chi-squared test, symbolically represented as x2, is a data analysis based on the observations of a random set of variables. In other words, it is a comparison of two statistical data sets. This test was introduced by Karl Pearson in 1900 for categorical data analysis and distribution. So it was previously known as Pearson’s chi-squared test. Various measurement methods are used often for statistical purposes in mathematics. The Chi-square test is one of those measurement methods most useful in non-parametric statistics. Experimental studies use the chi-square test to get conclusions. It is also useful in data collection, especially if your sample has a variety. Let us learn about the chi-square test along with its formula and solved examples.
| Table of Content |
Key takeaways: Data collection, Data values, expected data value, real data value, Chi-square, Chi-square test, Chi-square test formula.
Also read: Differential Equation
What is the Chi-Square Test?
[Click Here for Sample Questions]
The Chi-square test calculates the difference that is there between the actual data and expected data values. One can find out how much difference the observed data values keep from the expected data. There is a huge table of chi-square values to perform the chi-square test smoothly.
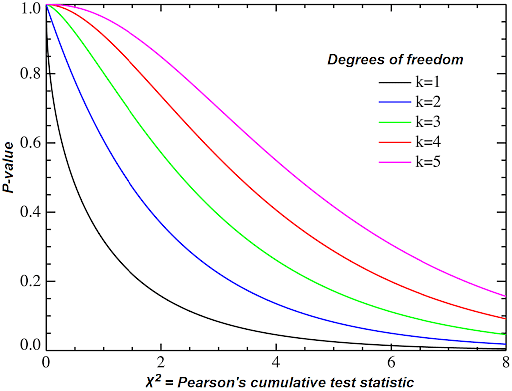
Whereas a small chi-square value indicates a short difference between real and expected data with not having much distance. Meanwhile, a huge difference between both the data values i.e., the expected and the real one, indicates that there is some factor that is causing this difference in the data. Likewise, a short difference means there a zero or a few factors to influence the data. Hence, the data isn't having a big difference. Statisticians can further explore the factors and the way these factors influence the data values. This is how the chi-square test is used.
Read more:
Symbol of Chi-Square
[Click Here for Sample Questions]
In reality, Chi is a Greek language symbol. The symbol of Chi looks like the English letter x in the Chi-square formula.
How to Calculate the Chi-square?
[Click Here for Sample Questions]
One first calculates the difference between the observed value (denoted by O) and the expected value (denoted by E). Then, the square of this difference is taken and divided by the expected value (E) in order to calculate the Chi-square.
The number of values depends on the number of categories of the data. Chi-square is indeed a sum of all these values. Nevertheless, the square root is not needed here. So, don't confuse chi-square with square root.
As mentioned above, if the chi-square test is small that means there is a sort of similarity in both observed as well as expected data. On the other hand, a large chi-square test statistically indicates a huge difference between both values. The null hypothesis is rejected then and there.
Read more:
Chi-Square Formula
[Click Here for Sample Questions]
As told above, the symbol of Chi looks like the letter X. Accordingly, χ2 is used to denote Chi-square. The formula for Chi-square is:
χ2 = ∑(O−E)2 E
Symbols and their meanings:
O denotes Observed frequency
E denotes the expected frequency
∑ denotes summation
Chi 2 denotes Chi-Square Value
Things to Remember
- The Chi-square test is used to calculate the difference present between expected and collected data.
- The square root is not required in the Chi-square test.
- A small difference between the values indicates that it is not significant. Therefore, the null hypothesis wouldn't be rejected.
- The large difference between the values indicates that it is significant. Therefore, the null hypothesis would be rejected.
- The formula for the Chi-square test is: χ2 = ∑ (O−E)2 E
Also read: Isosceles Triangle Theorems
Sample Questions
Ques: A random sample of 395 people was taken and each person was asked to report the highest education level they obtained. The data that resulted from the survey is represented in the following table: (4 marks)
| High School | Bachelors | Masters | Ph.d. | Total | |
|---|---|---|---|---|---|
| Female | 60 | 54 | 46 | 41 | 201 |
| Male | 40 | 44 | 53 | 57 | 194 |
| Total | 100 | 98 | 99 | 98 | 395 |
Find out are gender and education level-dependent at a 5% level of significance? In other words, given the data collected above, is there a relationship between the gender of an individual and the level of education that they have obtained?
Ans: We will first create the table of expected data values.
| High School | Bachelors | Masters | Ph.d. | Total | |
|---|---|---|---|---|---|
| Female | 50.886 | 49.868 | 50.377 | 49.868 | 201 |
| Male | 49.114 | 48.132 | 48.623 | 48.132 | 194 |
| Total | 100 | 98 | 99 | 98 | 395 |
Working with these values, when we put these values in the formula of chi-square test…
χ2 = ∑ (O−E)2 E
The critical value of Chi-square with 3 degrees of freedom is equal to 7.815. As 8.006 > 7.815, it's a significant difference. Therefore, we will reject the null hypothesis. Then, a conclusion would be provided that yes, the education level depends on or is influenced by gender at a 5% level of significance.
Value: 7.815
Ques: A poker-dealing machine is supposed to deal cards at random, as if from an infinite deck. In a test, you counted 1600 cards, and observed the following: (4 marks)
Spades 404
Hearts 420
Diamonds 400
Clubs 376
Could it be that the suits are equally likely? Or are these discrepancies too much to be
random?
Ans:
| Observed | Expected (percent) | Expected (counts) | Z |
| 404 | 0.25 | 400 | 0.200 |
| 420 | 0.25 | 400 | 1.000 |
| 400 | 0.25 | 400 | 0.000 |
| 376 | 0.25 | 400 | -1.200 |
Therefore, chi-square-> 2.480
critical value-> 7.815
We will have to calculate each z from its own row as (observed-expected)/sqrt(expected).
Ensure that you are using the counts and not the percentages in the Chi-square formula. Hence, the number of degrees of freedom is 3 (number of categories minus 1).
Ques: What conclusion should be made with respect to an experiment when the significance level is 0.05 (p = 0.05)? (2 marks)
Ans: because the p-value of 0.068 is greater than 0.05, it will not be able to reject the null hypothesis.
The value of p < 0.05.
Ques: A genetics engineer was attempting to cross a tiger and a cheetah. She predicted a phenotypic outcome of the traits she was observed to be in the following ratio 4 stripes only: 3 spots only: 9 both stripes and spots. When the cross was performed and she counted the individuals she found 50 with stripes only, 41 with spots only, and 85 with both. According to the Chi-square test, did she get the predicted outcome? (3 marks)
Ans: D.F. Value
- 3.841
- 5.991
- 7.815
We will first create a table with observed and expected data values.
Then,
4/16 * 176 is equal to the expected # of stripes which is 44
3/16 * 176 is equal to the expected # of spots which is 33
9/16 * 176 is equal to the expected # stripes/spots which is 99.
Hence, Degrees of Freedom 3 - 1 = 2 (3 different characteristics - stripes, spots, or both)
As 4.74 is less than 5.991, we can accept the null hypothesis presented by the genetic engineer in the beginning.
Ques: A dice is tossed 120 times with the following results. (3 marks)
| No. Turned up | 1 | 2 | 3 | 4 | 5 | 6 |
| Frequency | 30 | 25 | 18 | 10 | 22 | 15 |
Test the hypothesis that the dice is unbiased (X2 = 11.7). Calculate the frequency observed for the Chi-Square distribution.
a) Dice is unbiased, 11.3
b) Dice is biased, 12.9
c) Dice is unbiased, 10.9
d) Dice is biased, 12.3
Ans: b) dice is biased, 12.9
Explanation: Step 1: Null Hypothesis would be dice is unbiased.
Step 2: we would calculate the Expected frequency:
If the dice is unbiased P(r) = 1/6.
r = 1, 2, 3, 4, 5, 6
The expected frequency f(r) should be N*r = 120* 1/6 = 20
Step3: Calculation of chi-square
χ2 = ∑ (O−E)2 E
Therefore,
χ2= 12.90 > 11.90.
Thus dice is biased.
Ques: Consider a set of 18 samples from a standard normal distribution. We square each sample and sum all the squares. The number of degrees of freedom for a Chi-Square distribution will be? (2 marks)
a) 17
b) 18
c) 19
d) 20
Ans: b) 18
Explanation: The number of standard normal derivatives or samples is equal to the number of degrees of freedom in Chi-square.
Here the total number of standard normal derivatives = 18.
Thus, the number of degrees of freedom for a Chi-Square distribution is also 18.
Ques: Which Chi-Square distribution looks the most like a normal distribution? (2 marks)
a) A Chi-Square distribution with 4 degrees of freedom
b) A Chi-Square distribution with 5 degrees of freedom
c) A Chi-Square distribution with 6 degrees of freedom
d) A Chi-Square distribution with 16 degrees of freedom
Ans: d) A Chi-Square distribution with 16 degrees of freedom is the answer.
Explanation: As soon as the number of degrees of freedom increases in the Chi-square test. The normal distribution also corresponds. The option there with a maximum number of degrees of freedom is 16. Hence, it is the answer.
Ques: What is the mean of a Chi-Square distribution with 6 degrees of freedom? (2 marks)
a) 4
b) 12
c) 6
d) 8
Ans: C) 6
Explanation: the number of degrees of freedom increases in the Chi-square test. The normal distribution also corresponds. The option there with a maximum number of degrees of freedom is 6 Hence, it is the answer.
Mathematics Related Links:



Comments