



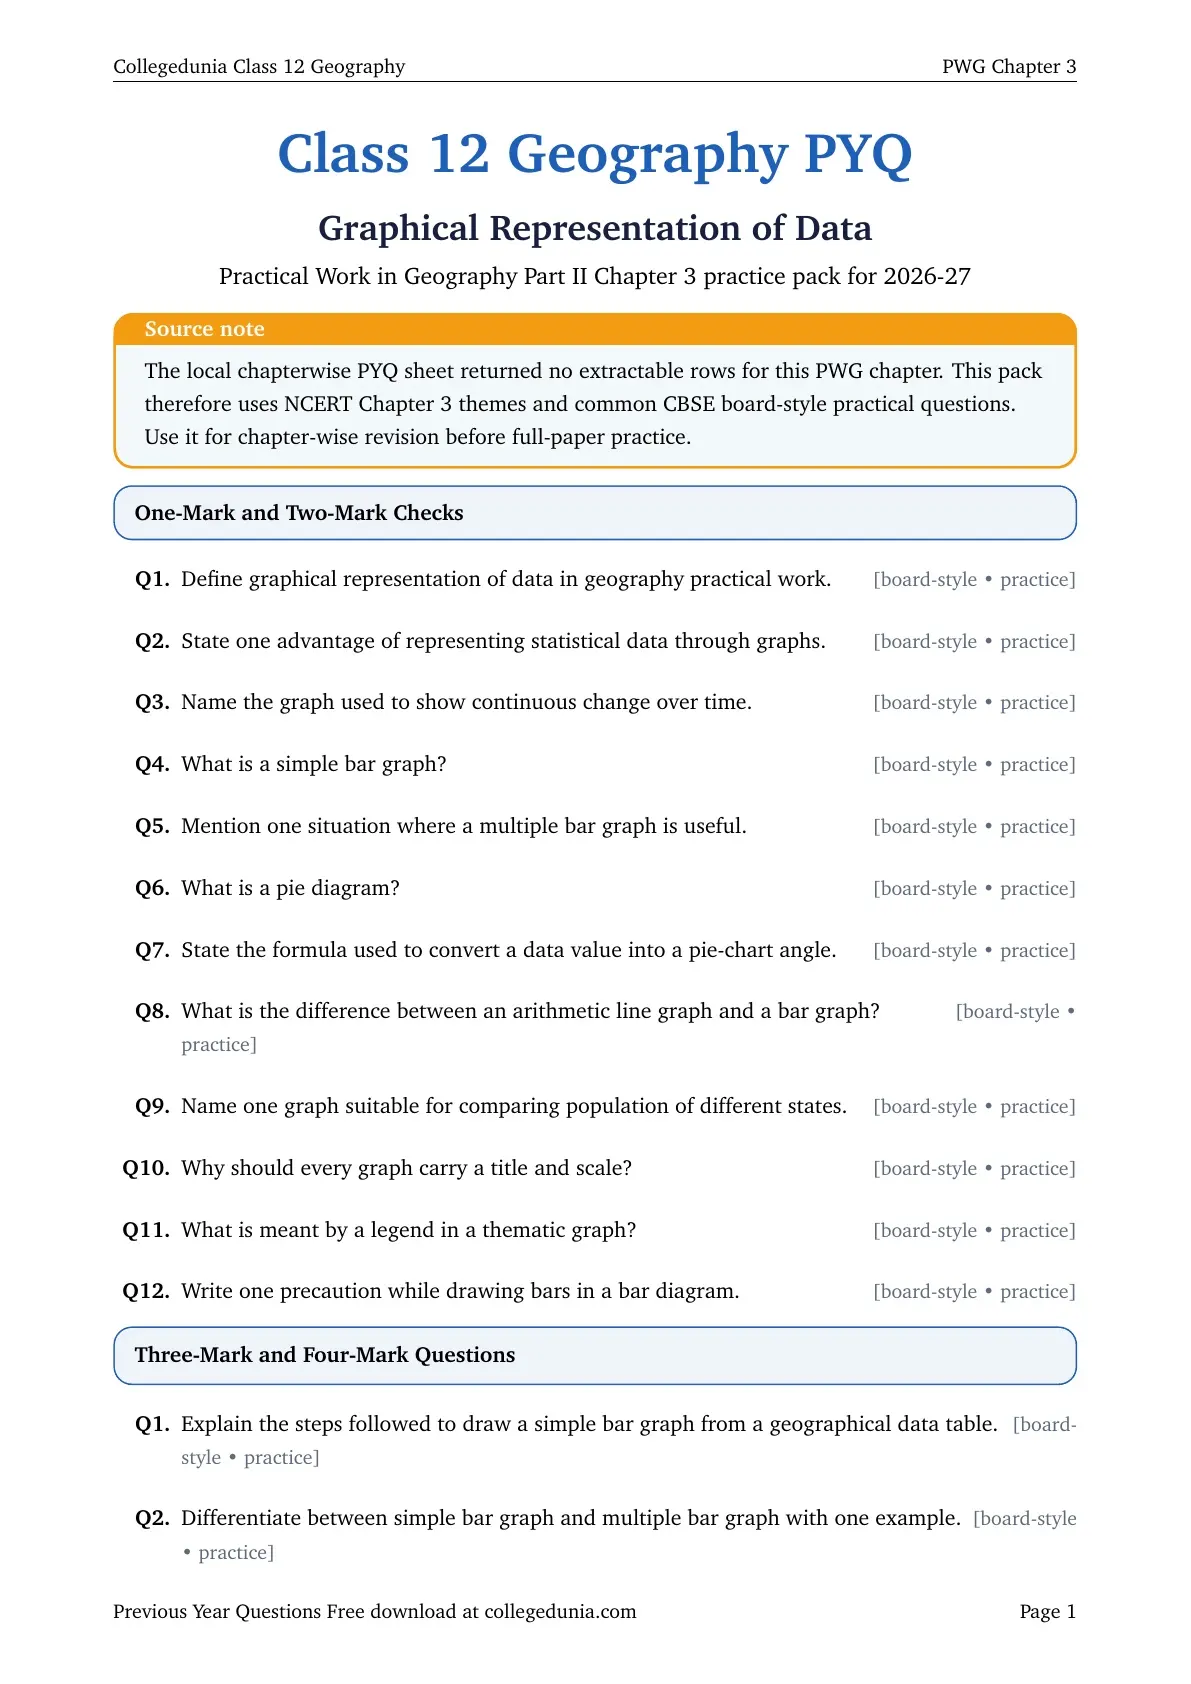
The Class 12 Geography Graphical Representation of Data PYQ PDF is available for free download. This chapter-wise PDF helps students revise board-style question patterns from Practical Work in Geography Part II Chapter 3 for the 2026-27 board exam.
- Covers line graphs, bar graphs, multiple bar diagrams, compound bars, pie charts, scale, legend and interpretation.
- Includes 27 board-style questions because the local PYQ source sheet has no extractable rows for this PWG chapter.
- Useful for quick practical-file revision before solving full CBSE Geography board papers.
Student Feedback: Students can use this PYQ PDF to practise graph-choice and graph-drawing questions without confusing trend graphs, comparison diagrams and composition charts.
In This Article
- Class 12 Geography Graphical Representation of Data PYQ PDF
- Questions Covered in Graphical Representation of Data PYQ PDF
- Graphical Representation of Data Video Revision
- Revision Focus for Graphical Representation of Data PYQs
- Answer Writing Map for Graphical Representation of Data PYQs
- All Class 12 Geography PYQ Chapters
Class 12 Geography Graphical Representation of Data PYQ PDF
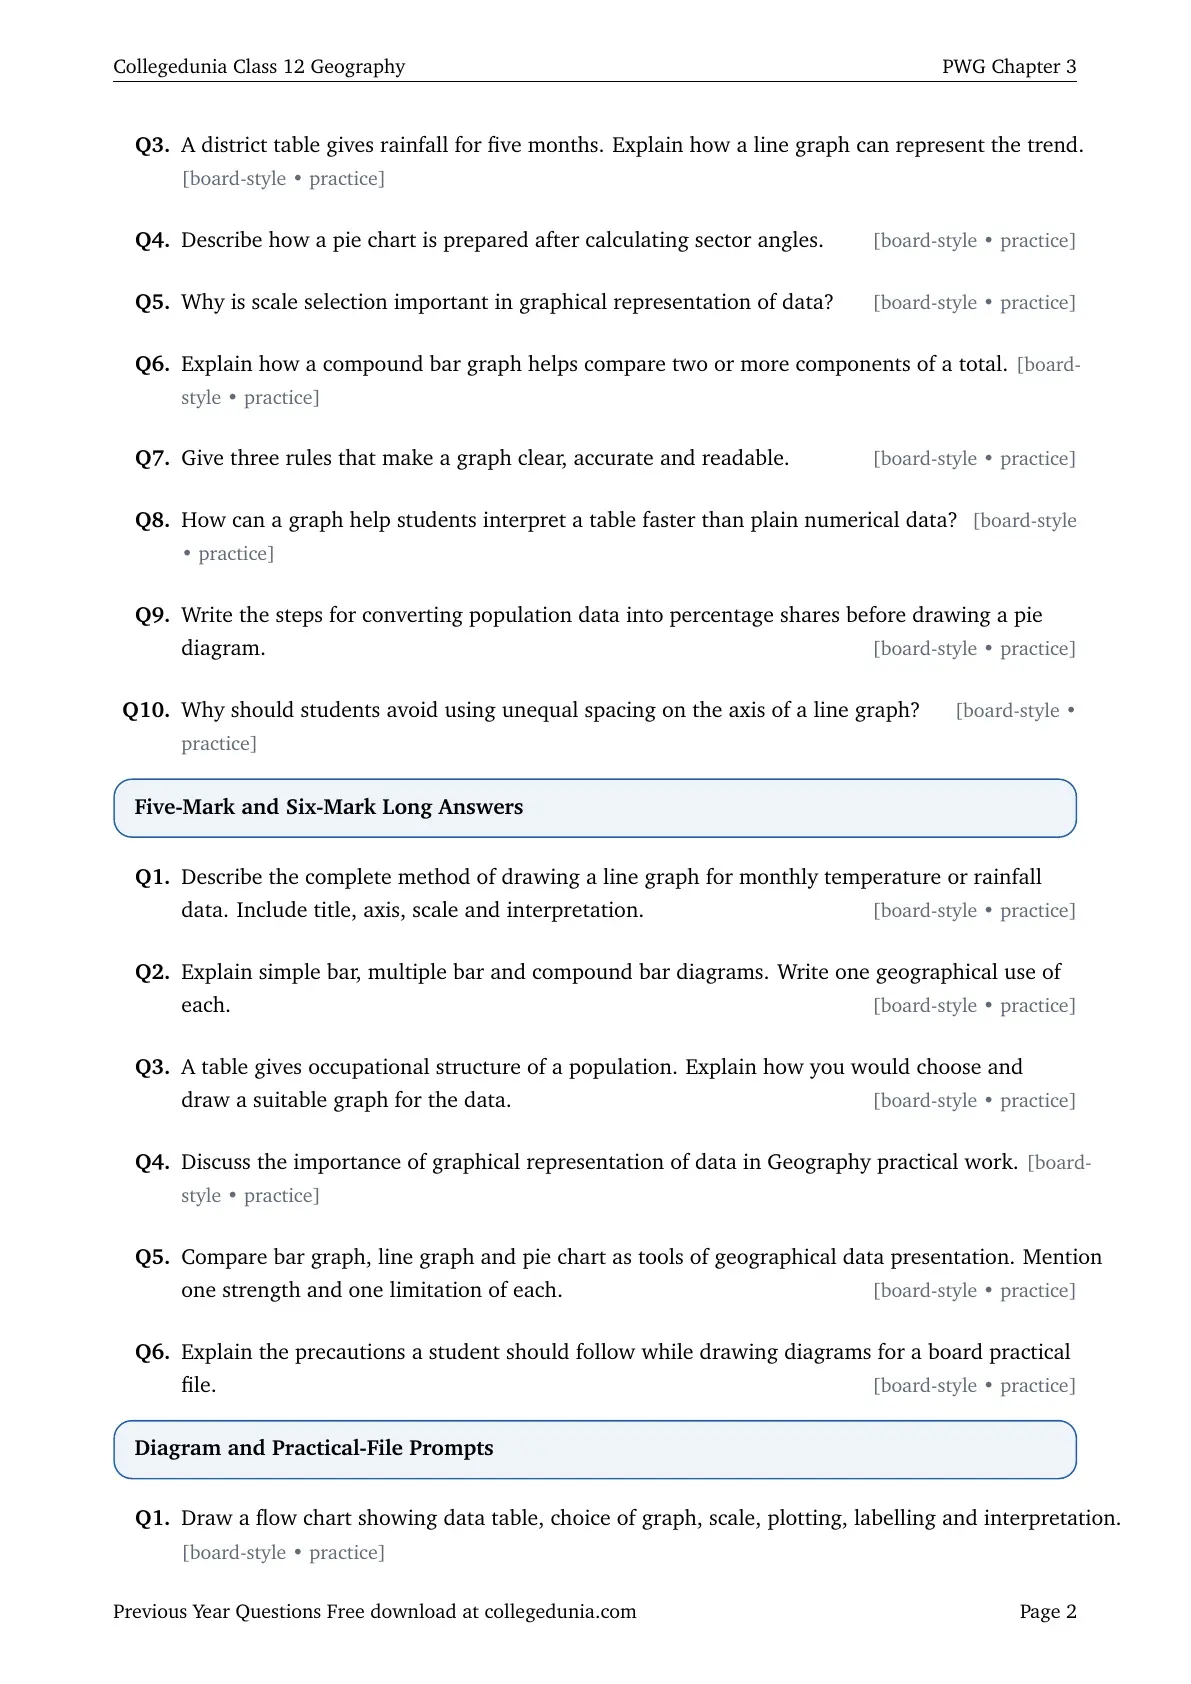
The PDF focuses on Chapter 3 of Practical Work in Geography Part II. The questions are arranged by marks so students can practise graph selection, scale writing, plotting rules and short interpretation from the Graphical Representation of Data chapter.
- Chapter: Chapter 3 PWG: Graphical Representation of Data
- Main theme: representing geographical data through clear graphs and diagrams
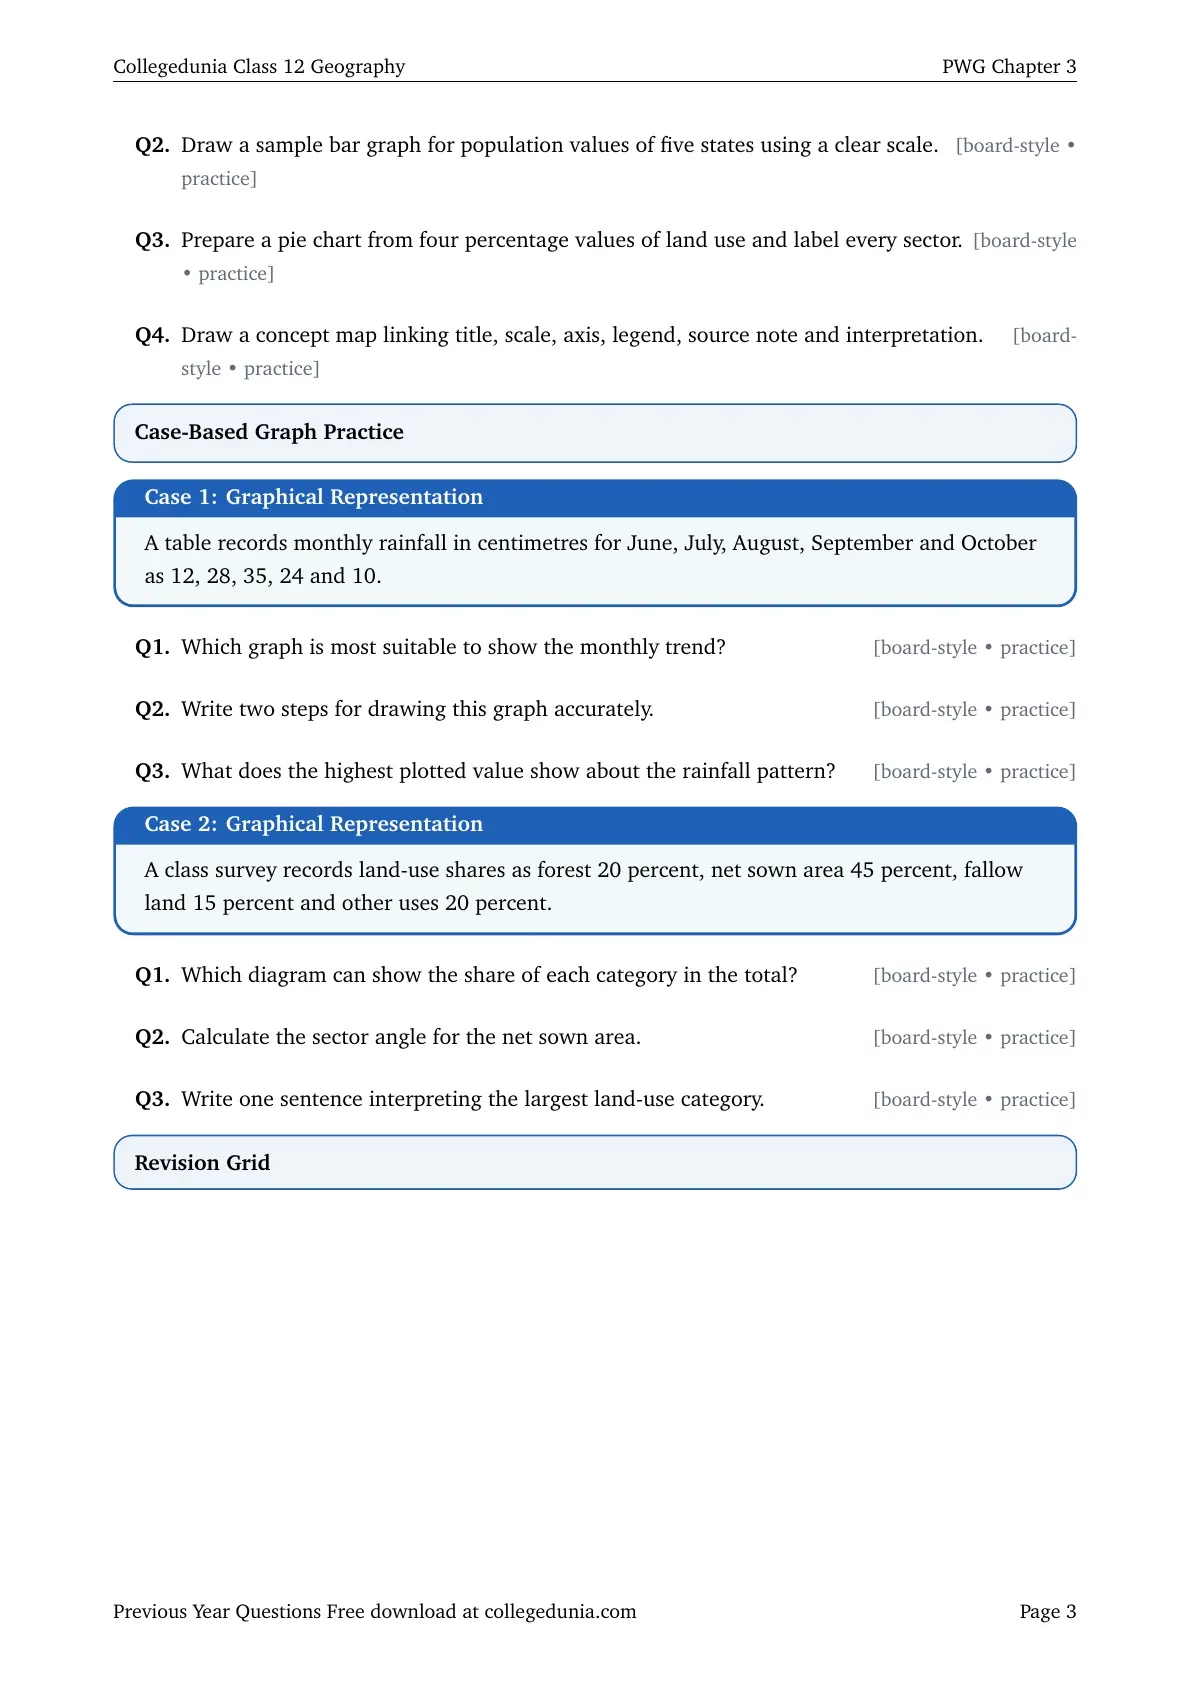
- Practice type: definition, graph-choice, calculation, diagram and case-based questions
- Best use: revise diagram rules and interpretation steps before full-paper practice
Questions Covered in Graphical Representation of Data PYQ PDF
The repeated practical-question pattern tests whether students can select the right graph and draw it with title, scale, labels and legend. A strong answer also interprets what the graph shows.
| PYQ Cluster | Question Focus | Answer Skill |
|---|---|---|
| Graph basics | Purpose, title, scale, axis, legend and source note | Write why each part makes the graph readable |
| Line and bar graphs | Trends over time and comparison across categories | Choose the graph type from the data pattern |
| Pie charts | Percentage share and sector-angle calculation | Convert values into angles and label every sector |
| Interpretation | Highest value, lowest value, main trend and exception | End the answer with a clear geography sentence |
Graphical Representation of Data Video Revision
Source: Magnet Brains on YouTube
Revision Focus for Graphical Representation of Data PYQs
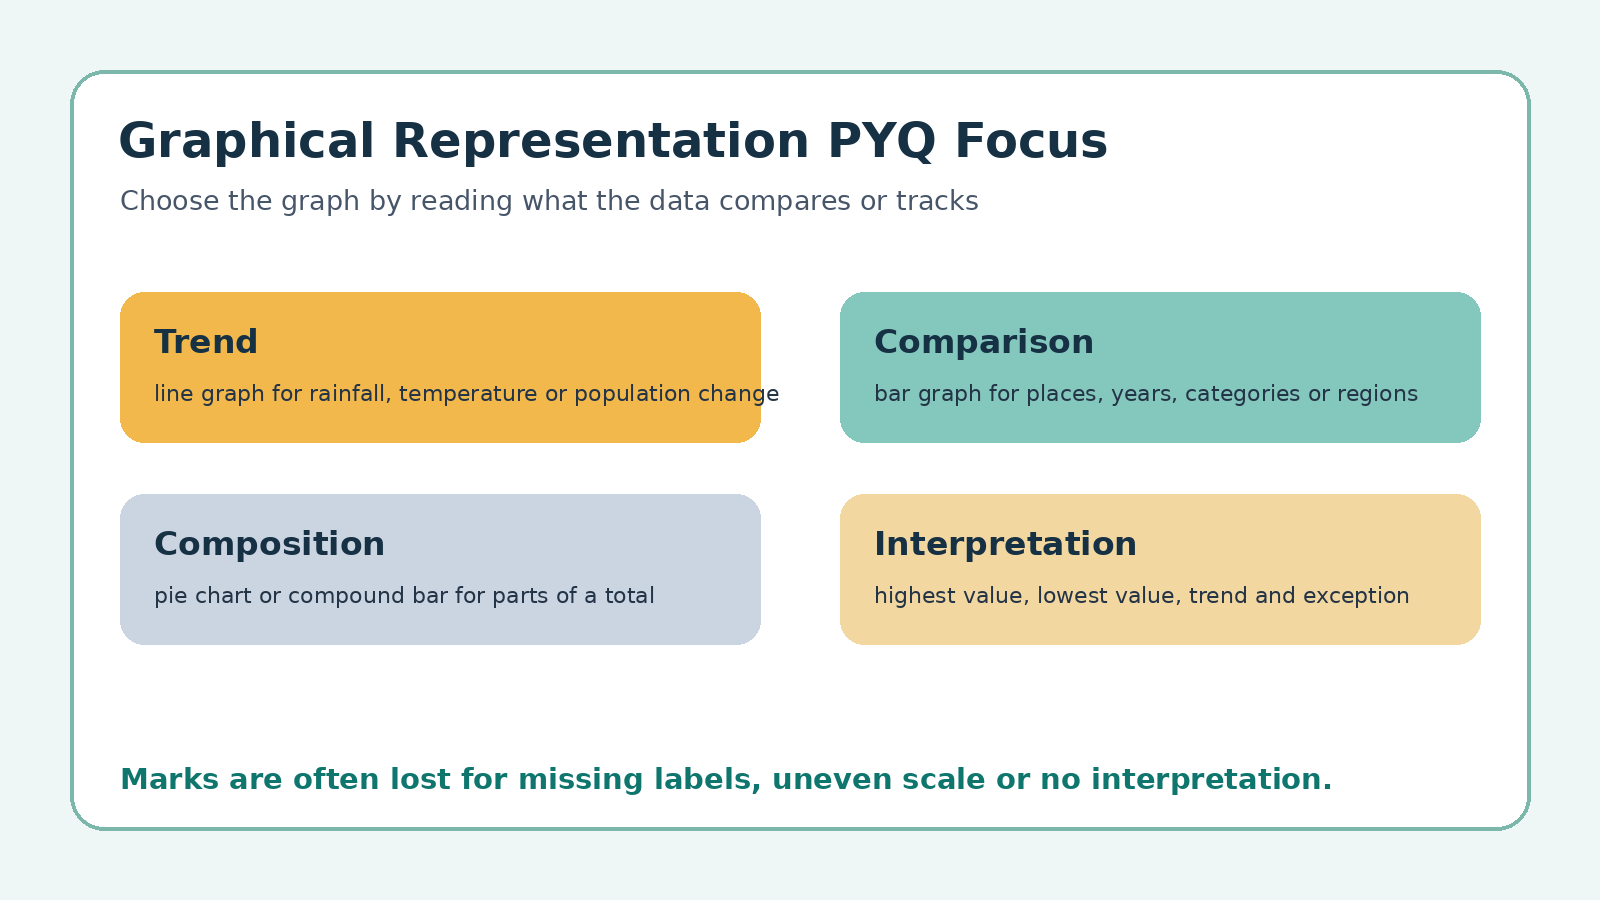
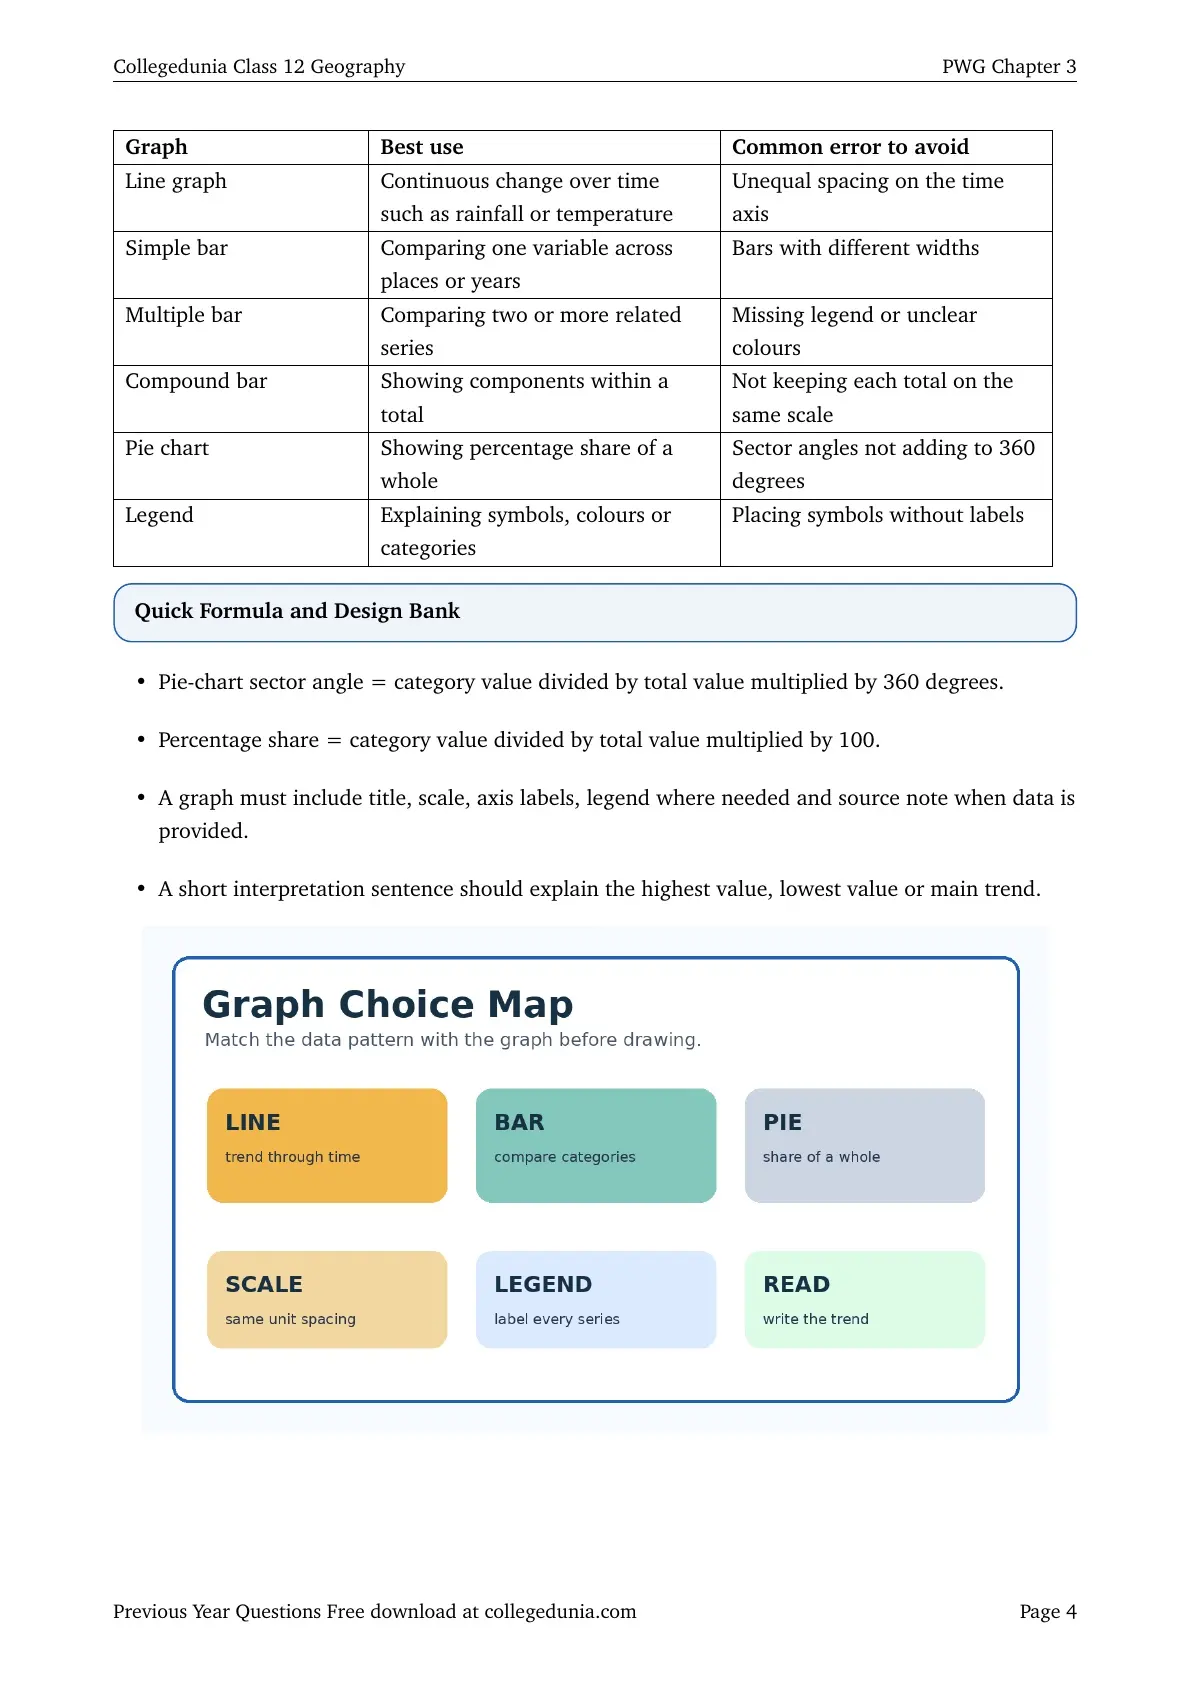
Begin with the type of data, then choose the graph. Most marks come from neat construction, correct scale and a short interpretation rather than decoration.
- Trend: line graph for monthly, yearly or time-series values
- Comparison: bar graph for places, regions, states or categories
- Composition: pie chart or compound bar for parts of a whole
- Presentation: title, scale, axes, units, legend and source note
Answer Writing Map for Graphical Representation of Data PYQs
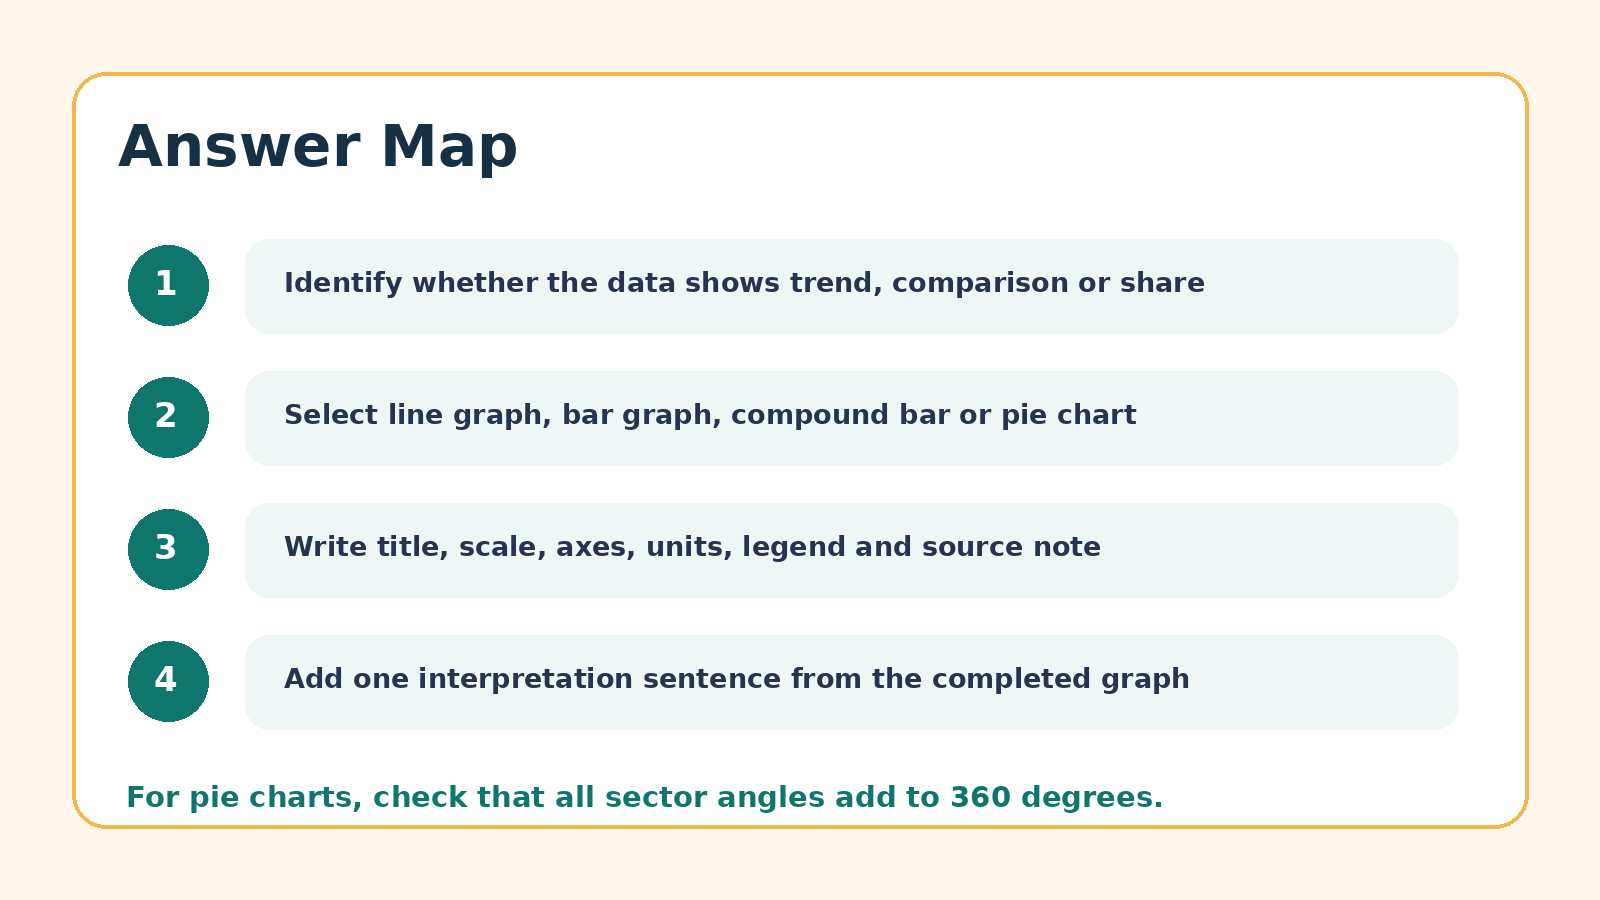
For diagram questions, write the steps in the same order you would draw them. For interpretation questions, identify the highest value, lowest value and overall pattern from the completed graph.
Class 12 Geography Graphical Representation of Data Related Resources
| Resource | Link |
|---|---|
| Graphical Representation of Data NCERT Book PDF | Chapter 3 Book PDF |
| Graphical Representation of Data Notes | Chapter 3 Notes |
| Graphical Representation of Data NCERT Solutions | Chapter 3 Solutions |
All Class 12 Geography PYQ Chapters
| Resource | Link |
|---|---|
| Human Geography Nature and Scope PYQ | FHG Chapter 1 PYQ PDF |
| Population Distribution Density Growth and Composition PYQ | IPE Chapter 1 PYQ PDF |
| Data Its Source and Compilation PYQ | PWG Chapter 1 PYQ PDF |
| Data Processing PYQ | PWG Chapter 2 PYQ PDF |
| Graphical Representation of Data PYQ | PWG Chapter 3 PYQ PDF |
| Human Development PYQ | FHG Chapter 3 PYQ PDF |
| Land Resources and Agriculture PYQ | IPE Chapter 3 PYQ PDF |
Class 12 Geography Graphical Representation of Data PYQ FAQs
Ques. Where can I download Class 12 Geography Graphical Representation of Data PYQ PDF?
Ans. You can download the chapter-wise PYQ PDF from the PDF viewer and download link above.
Ques. Which topics are important for Graphical Representation of Data PYQs?
Ans. Focus on line graphs, simple and multiple bar graphs, compound bars, pie charts, scale, legend, axis labels and interpretation.
Ques. Does this PDF include actual extracted previous-year rows?
Ans. No. The local source sheet has no extractable rows for this PWG chapter, so this PDF uses NCERT-based board-style practice questions.
Ques. How should students choose the correct graph?
Ans. Use a line graph for trends, a bar graph for comparison and a pie chart or compound bar when the question asks for parts of a total.



Comments