




Class 11 Economics Chapter 3 Organisation of Data notes help students revise classification, variables, class intervals and frequency tables for the 2026-27 syllabus. The page follows NCERT Statistics for Economics and keeps the main definitions ready for quick school-test revision.
- Download the Organisation of Data notes PDF for offline revision.
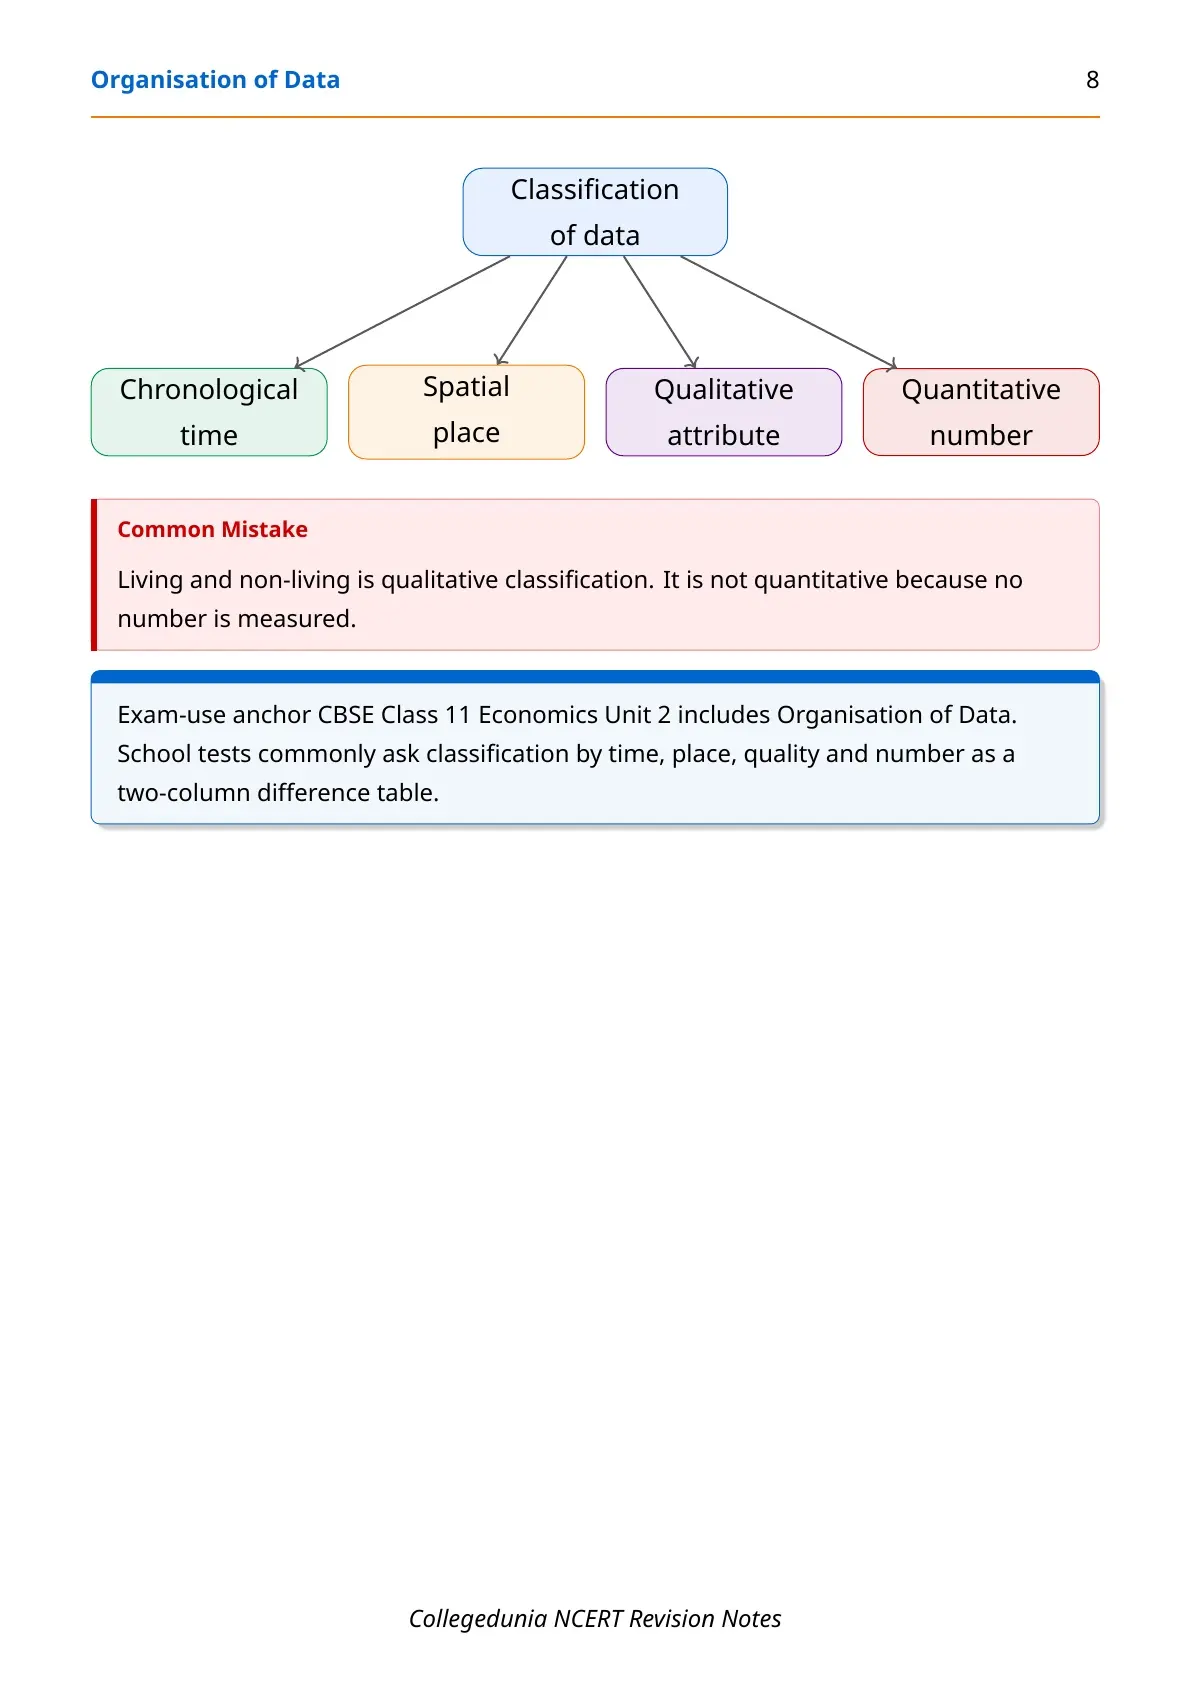
- Revise chronological, spatial, qualitative and quantitative classification.
- Use the tables to compare discrete data, continuous data and class intervals.






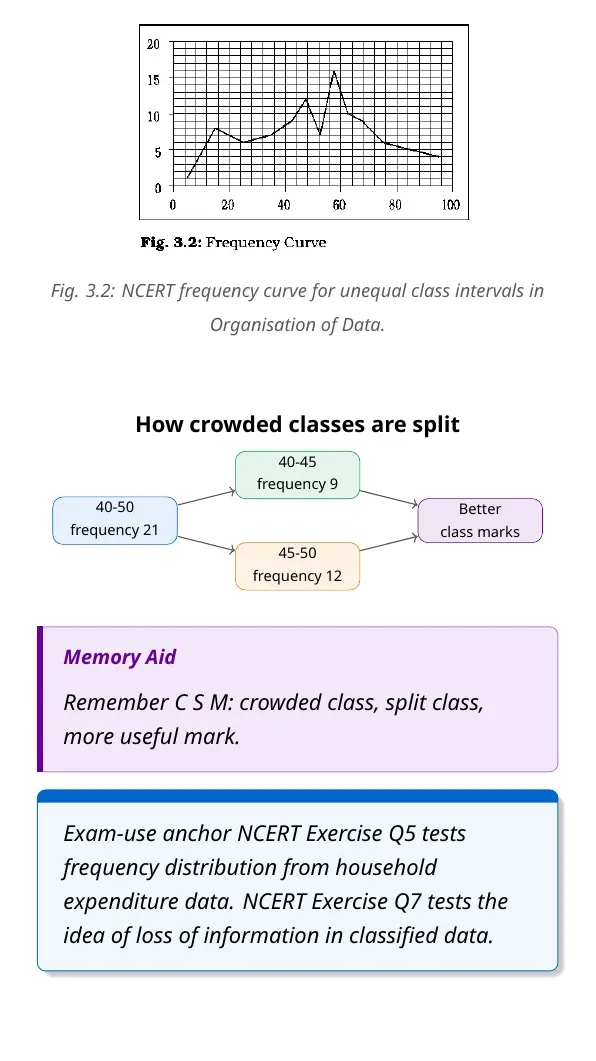


Student Feedback: In a Collegedunia poll of 11,980 Class 11 Economics students conducted before the 2026 boards, 72% of students said inclusive and exclusive class intervals were the easiest part of Organisation of Data to confuse. These notes place both methods side by side for revision.
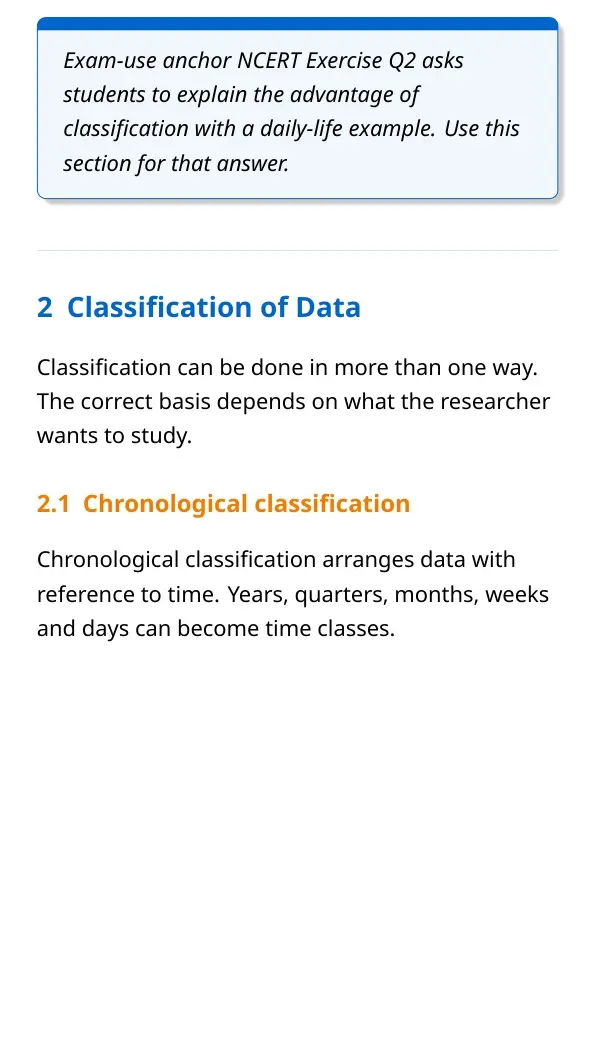
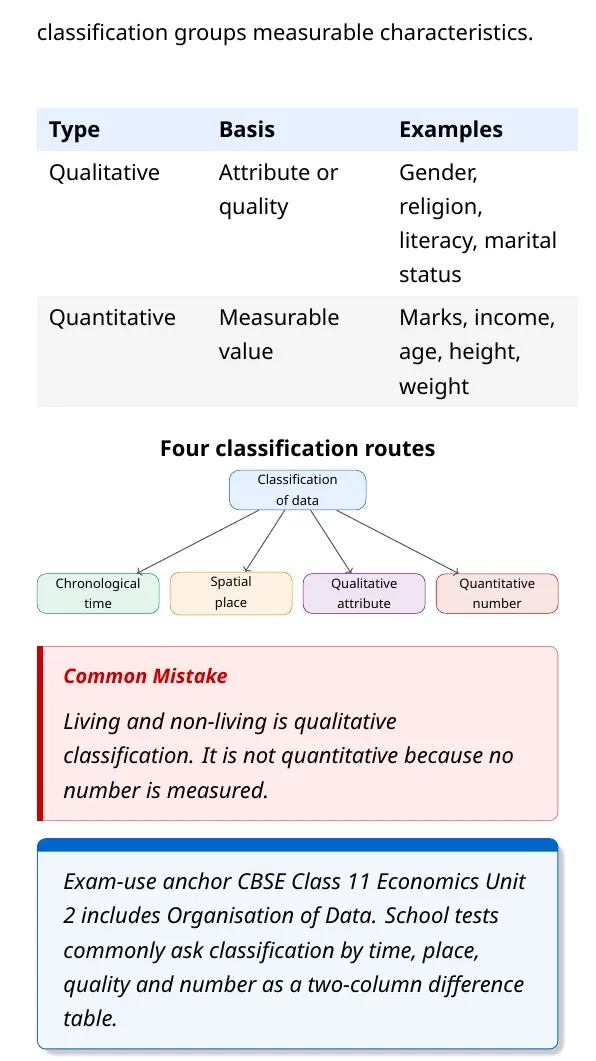
Organisation of Data Notes: Classification Basics
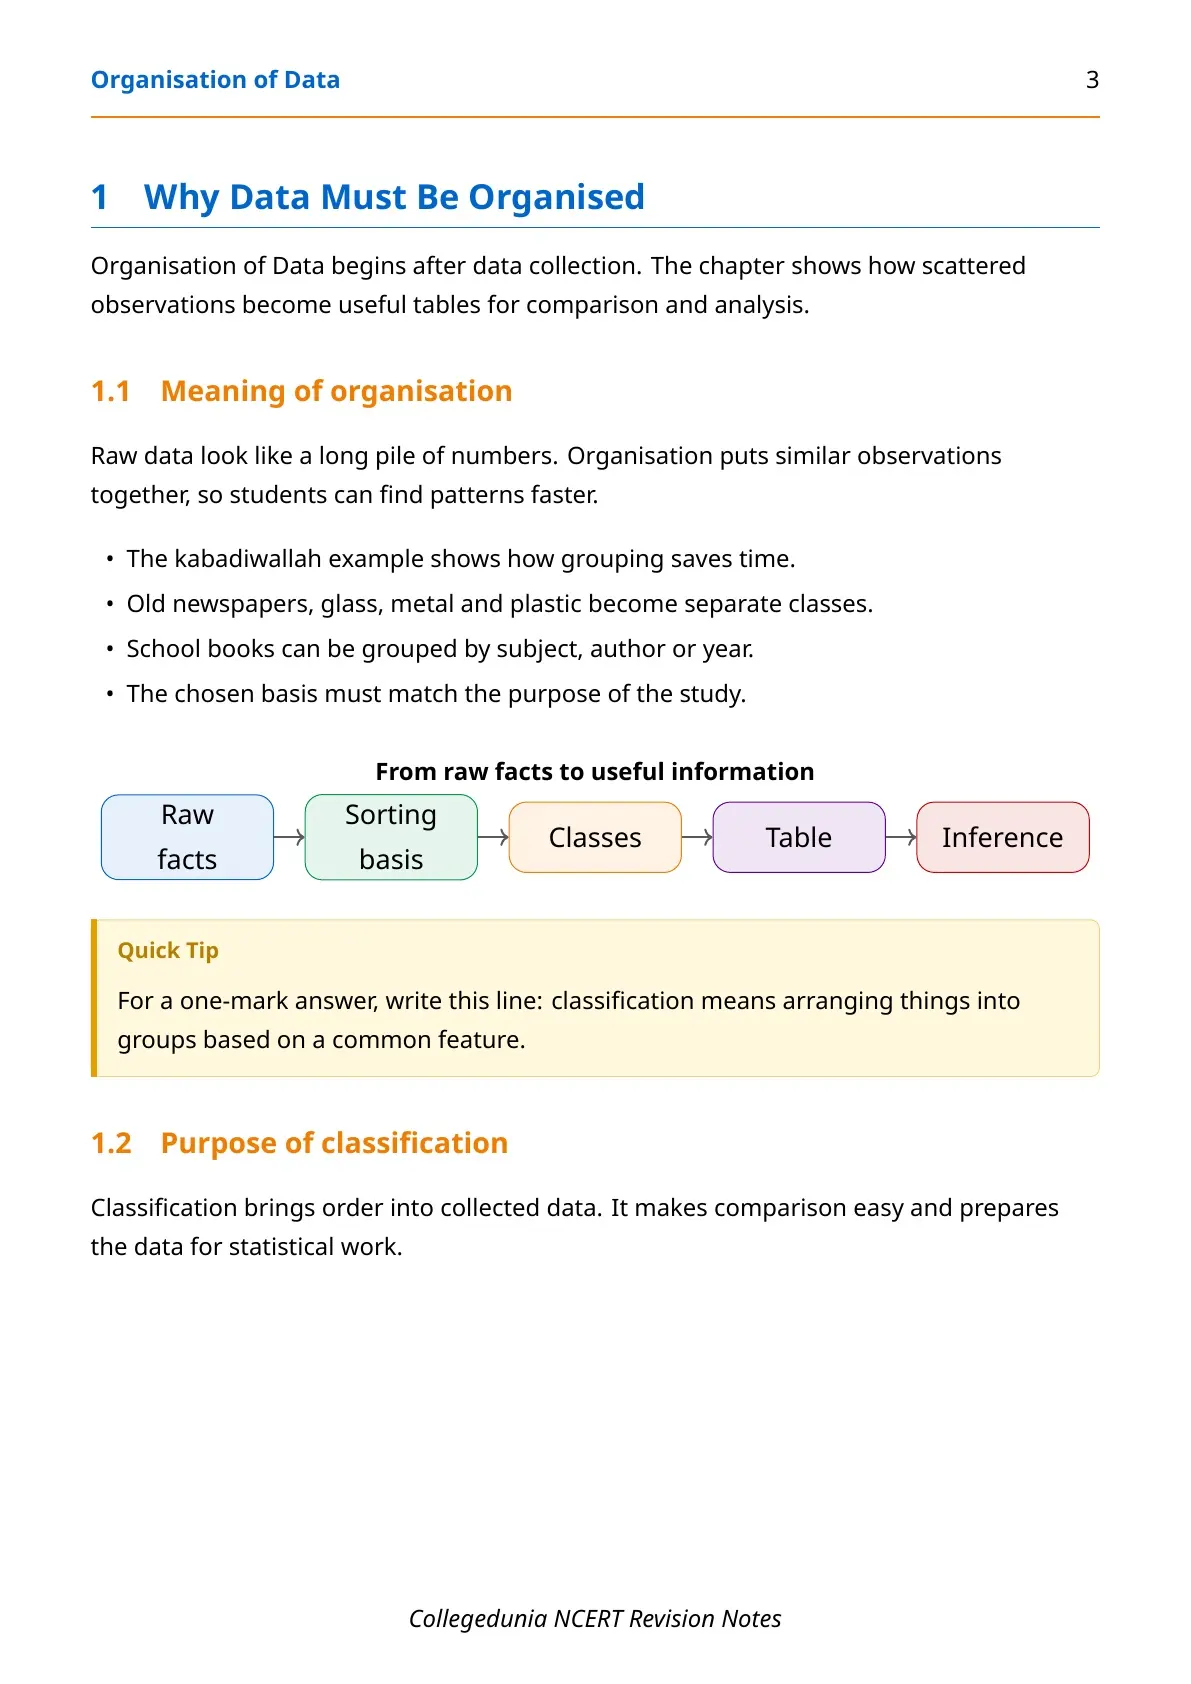
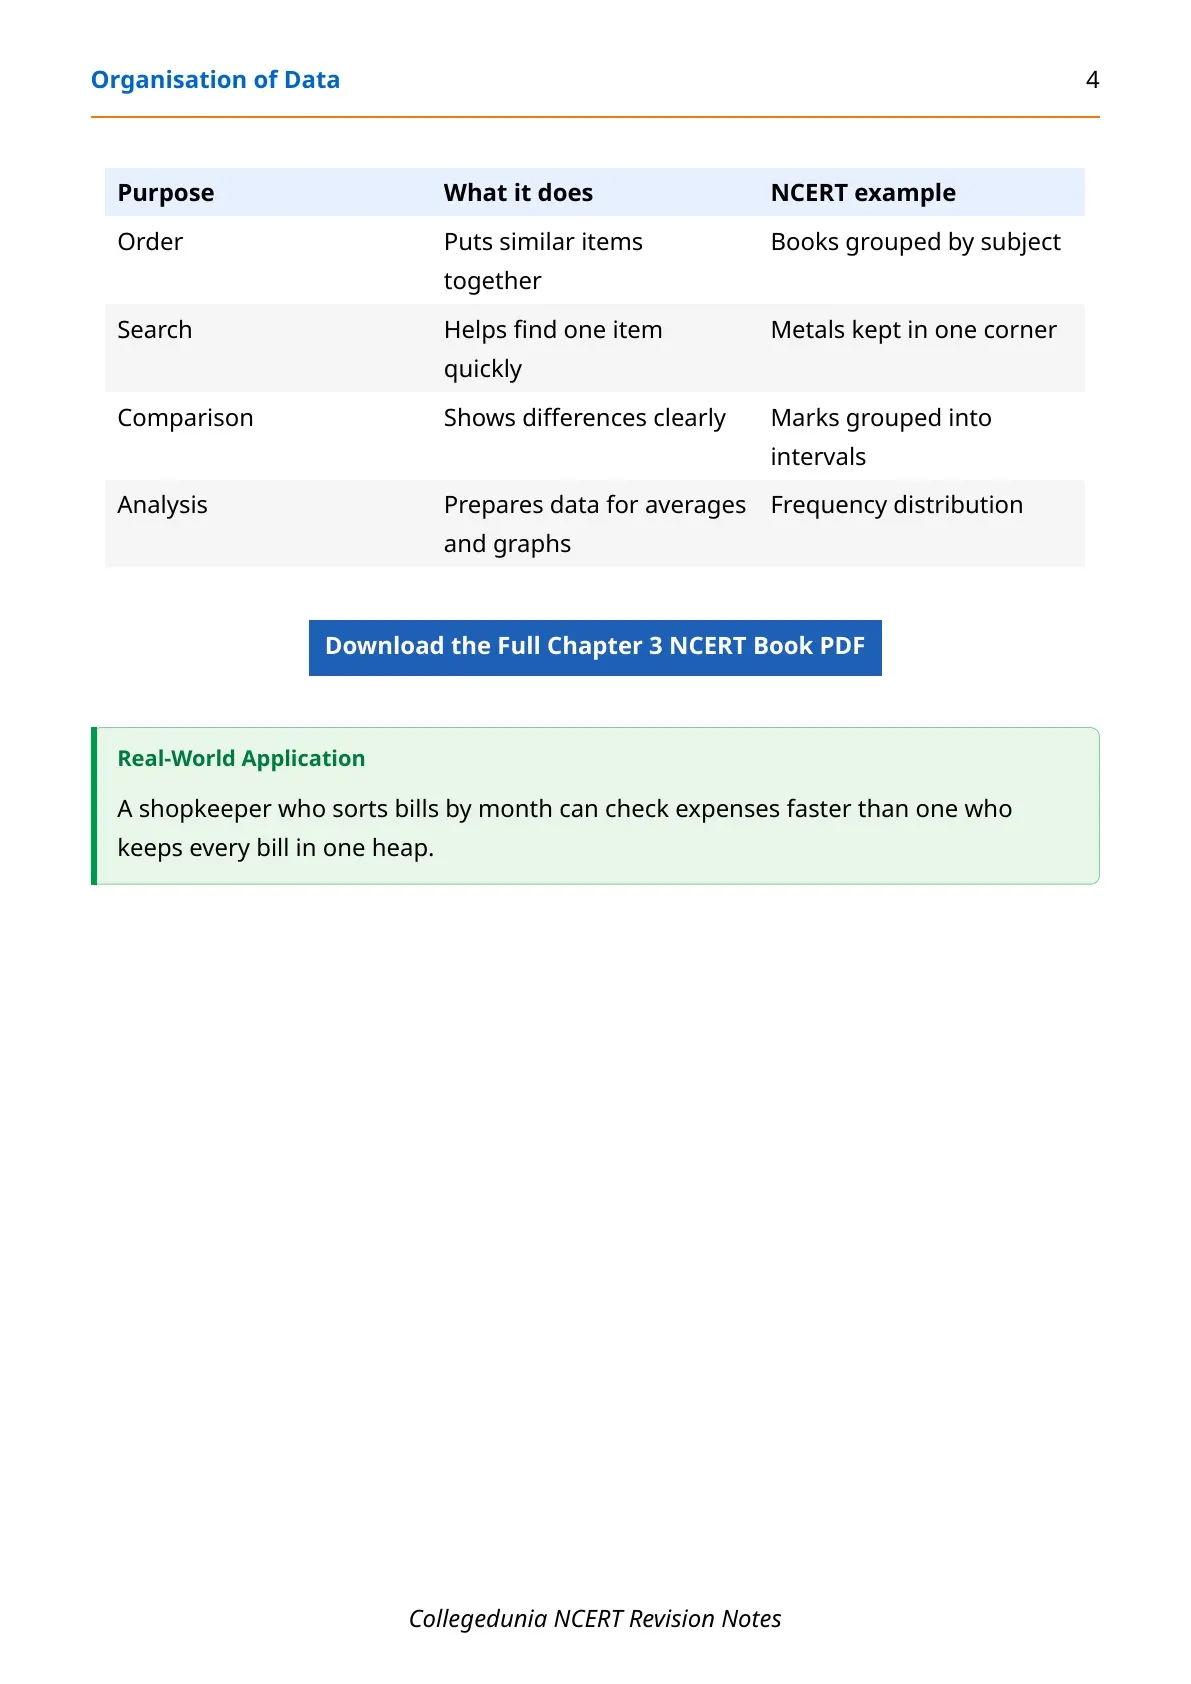
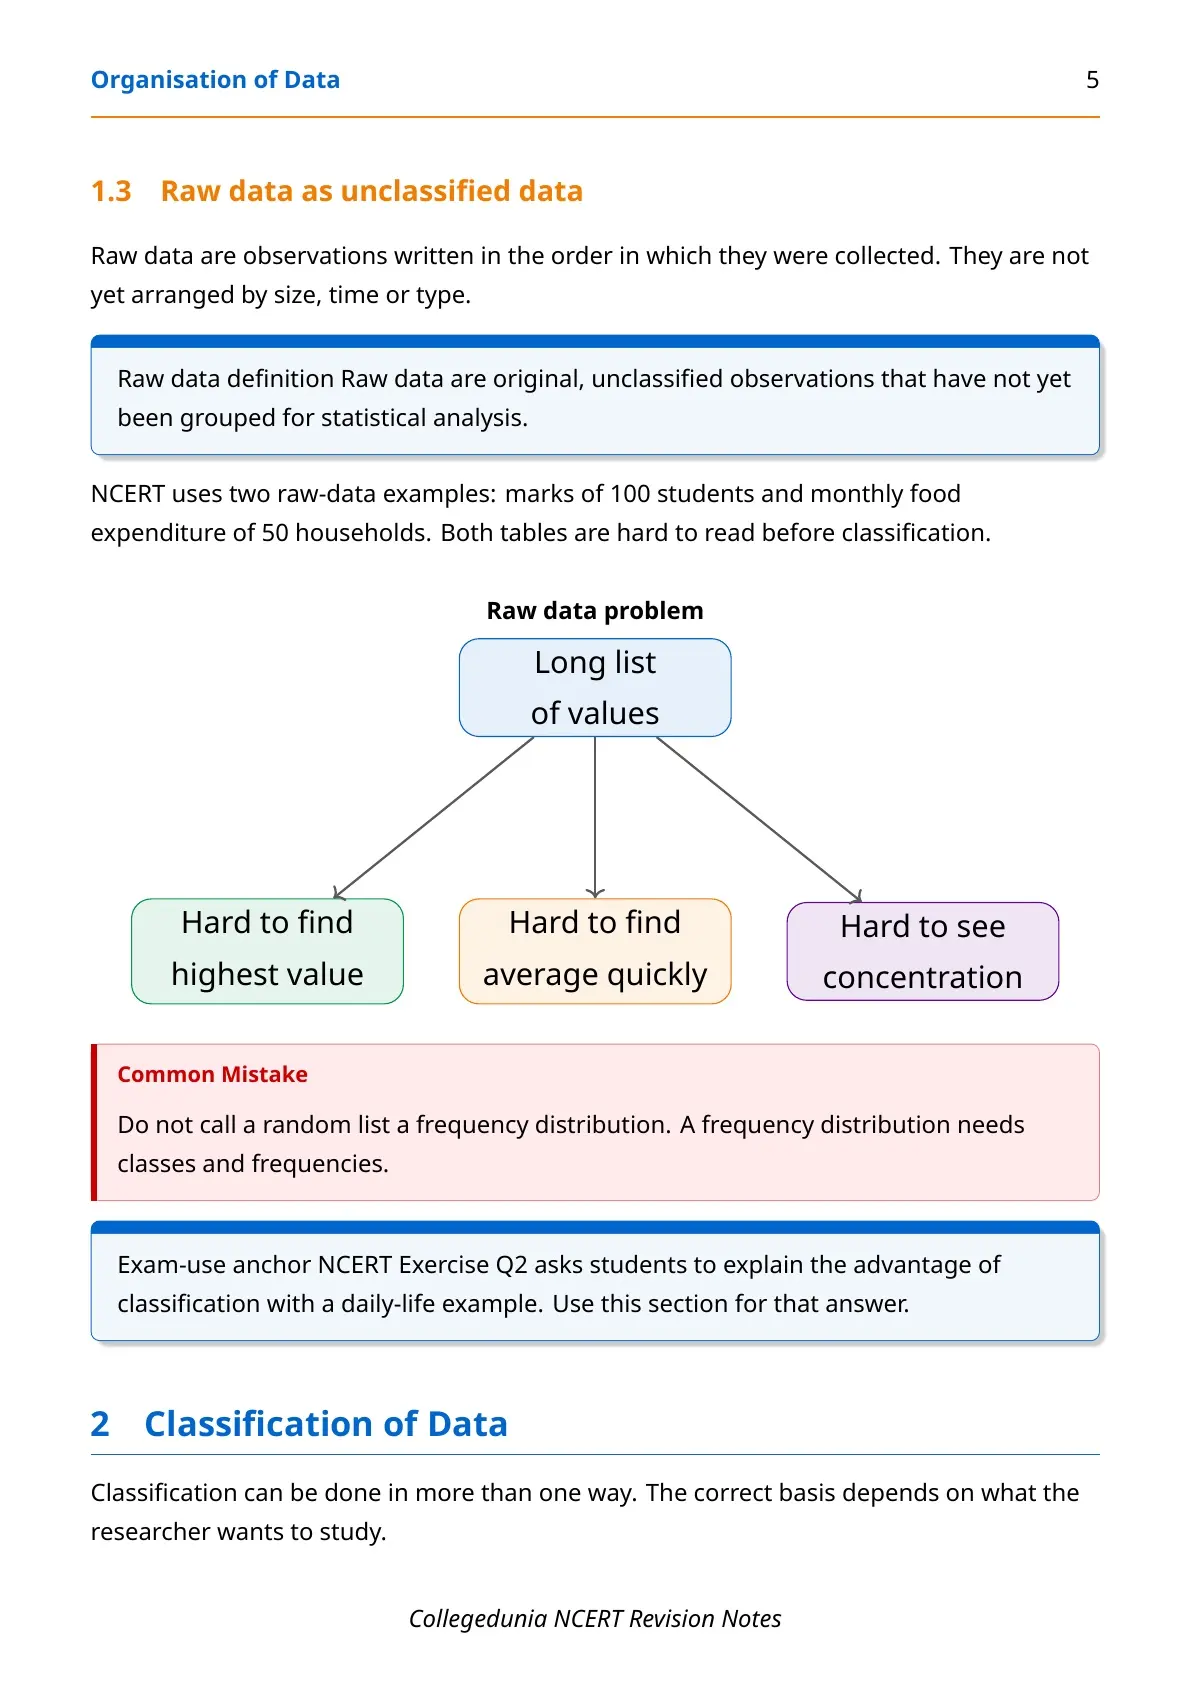
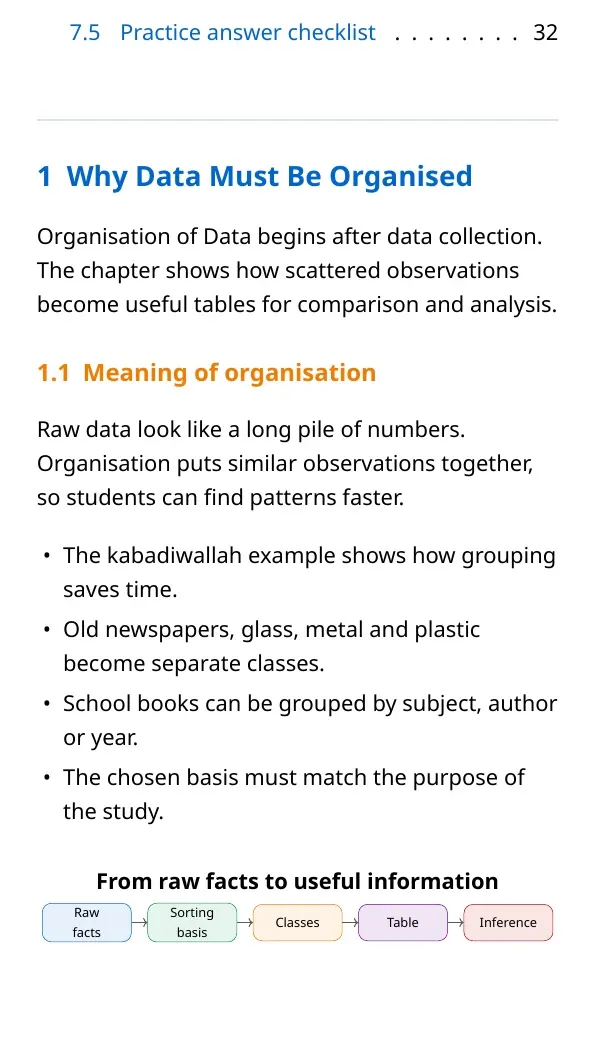
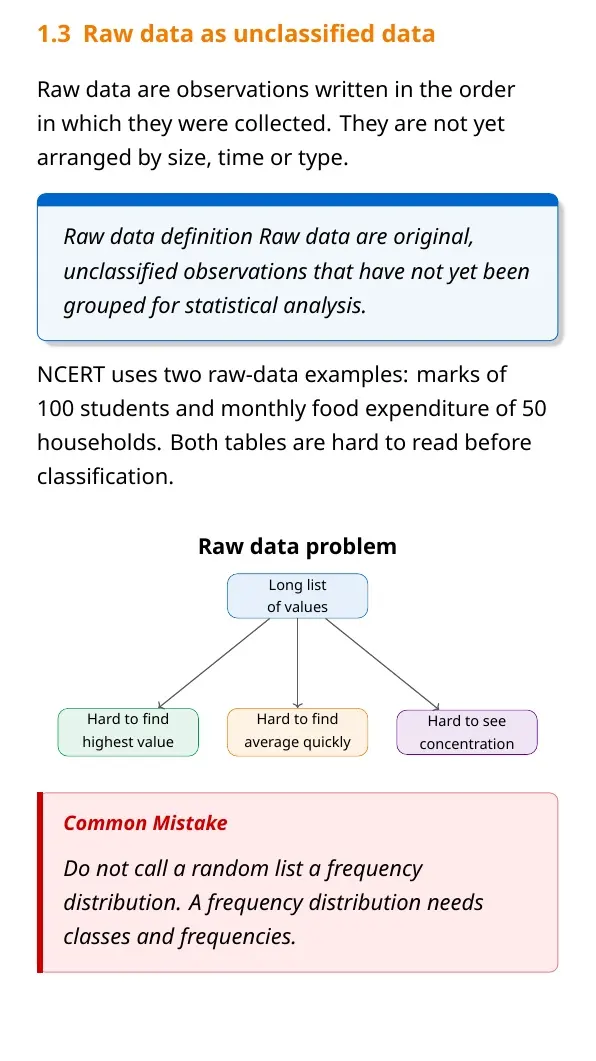
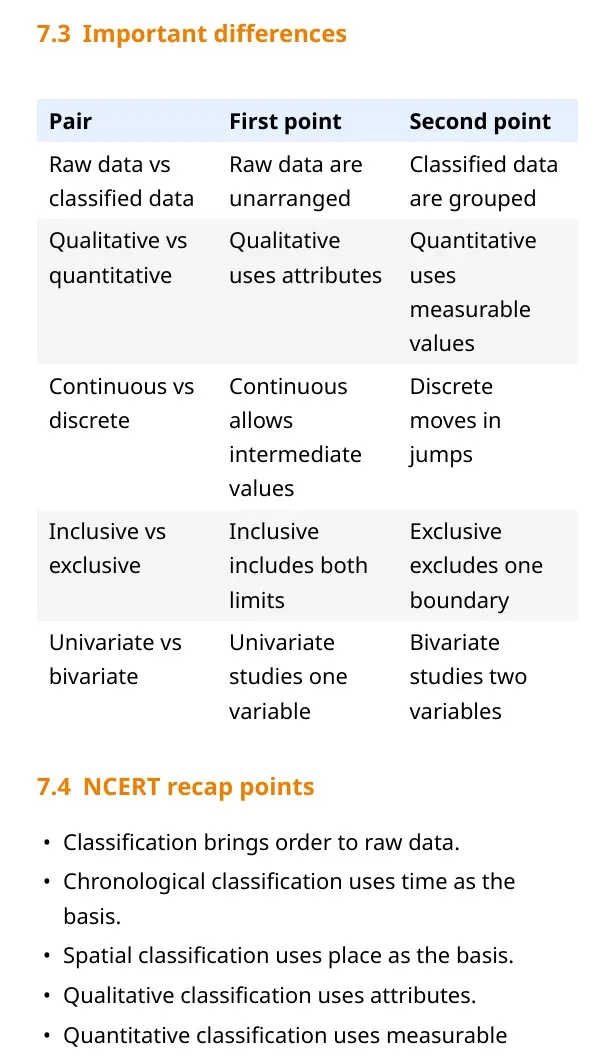
Organisation of data means arranging raw data in a systematic form. NCERT explains that raw data become useful only when the observations are classified, grouped and counted according to a clear purpose.

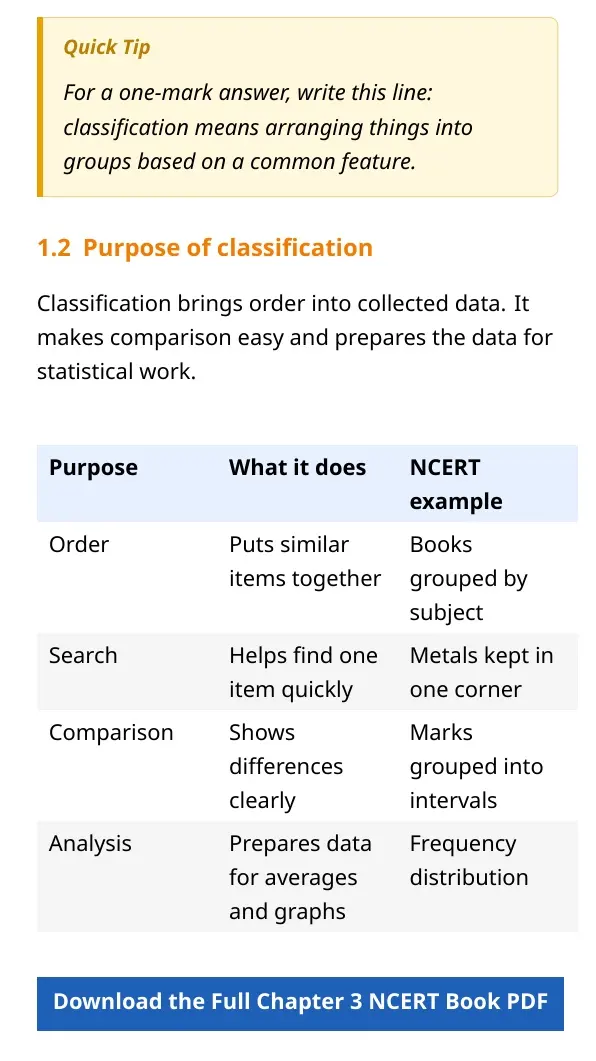
| Basis of classification | Meaning | NCERT-style example |
|---|---|---|
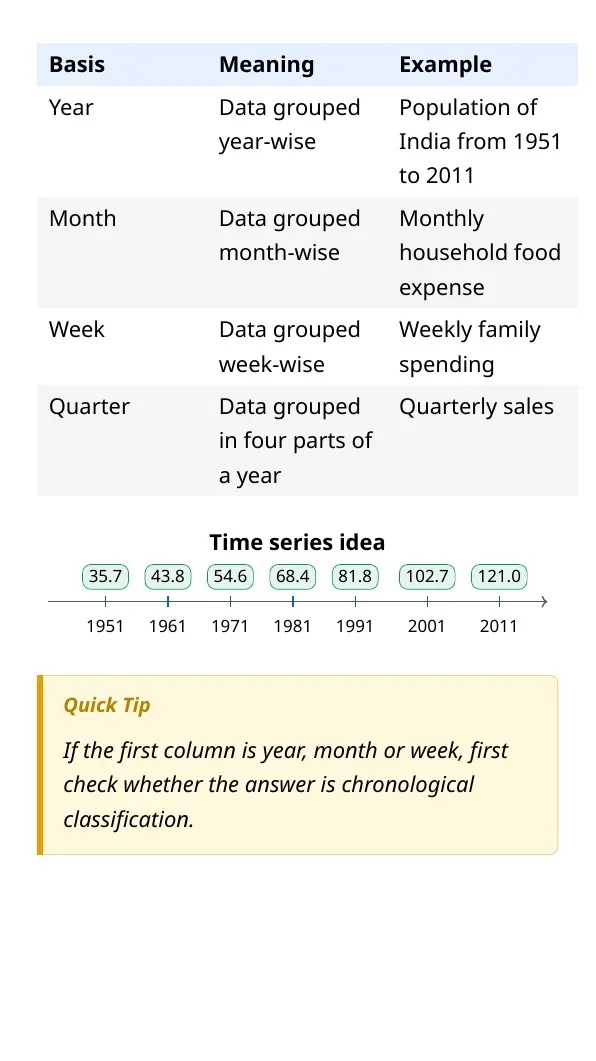
| Chronological | Data arranged by time | Foodgrain output across years |
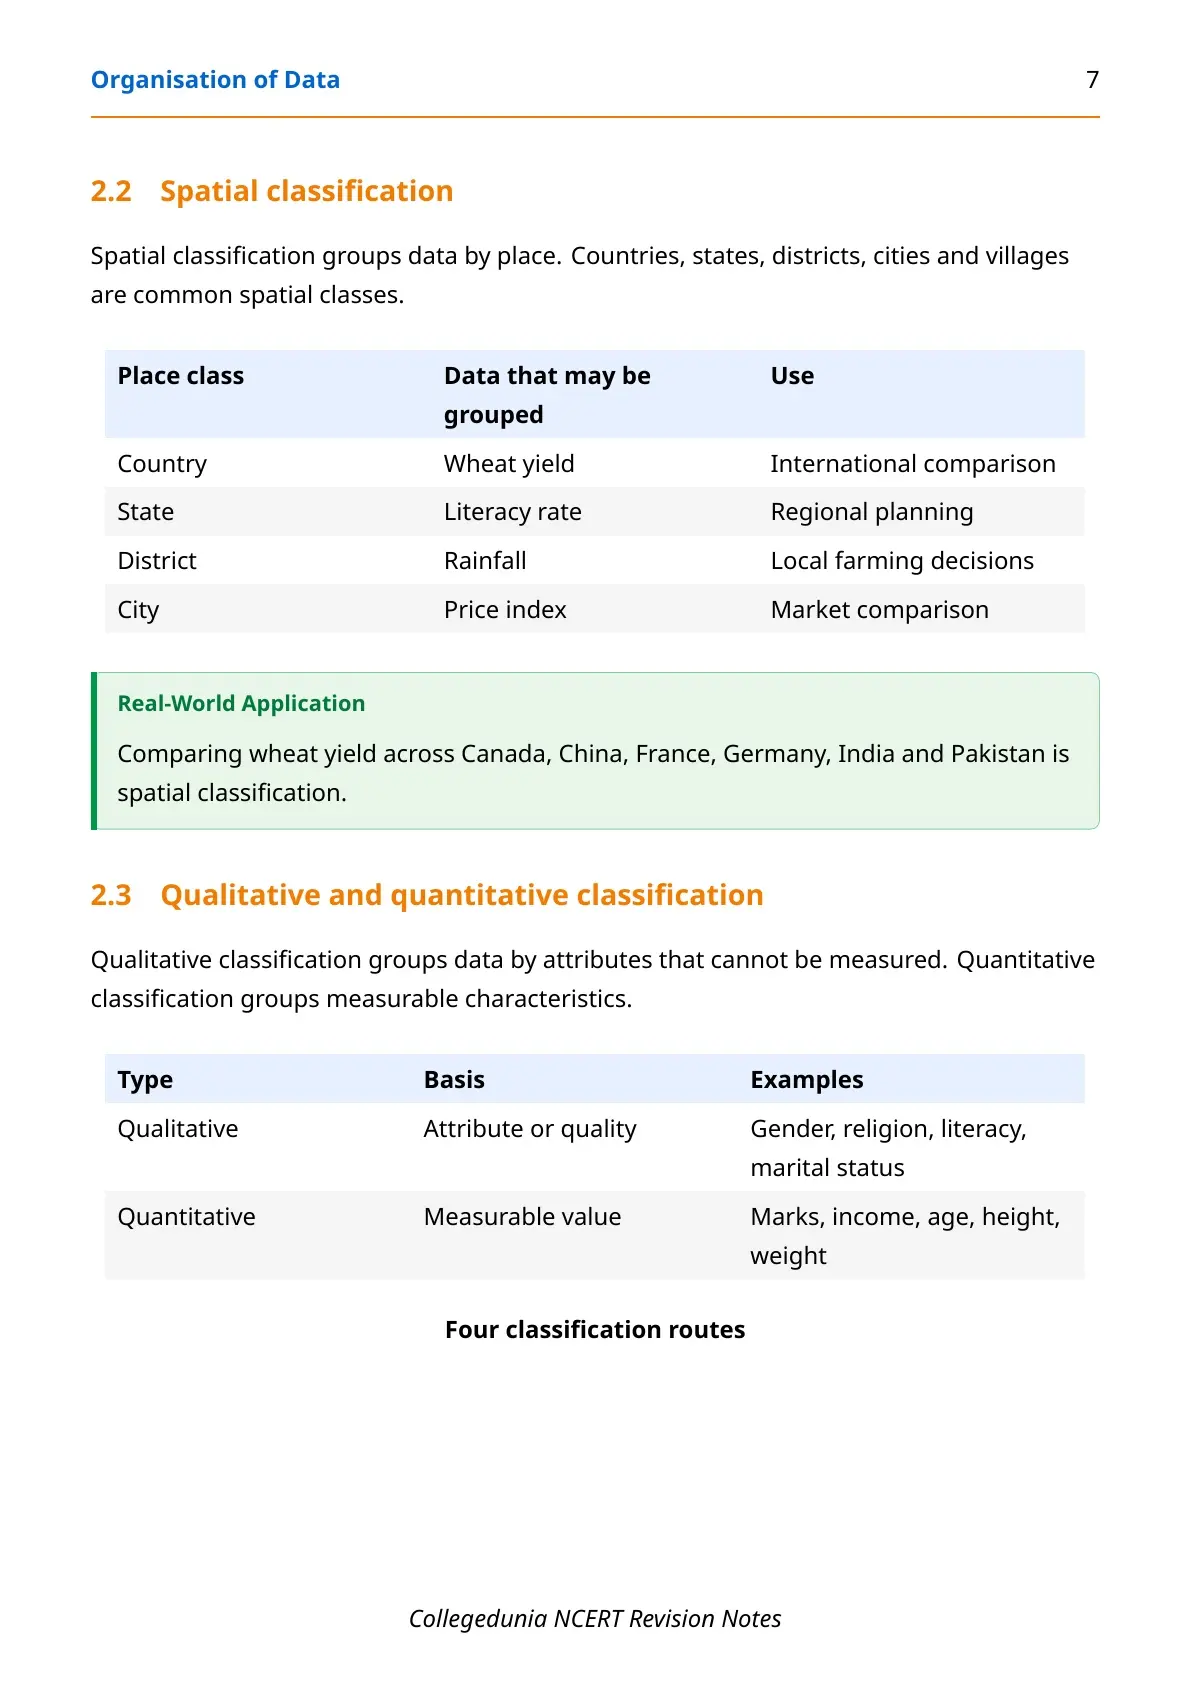
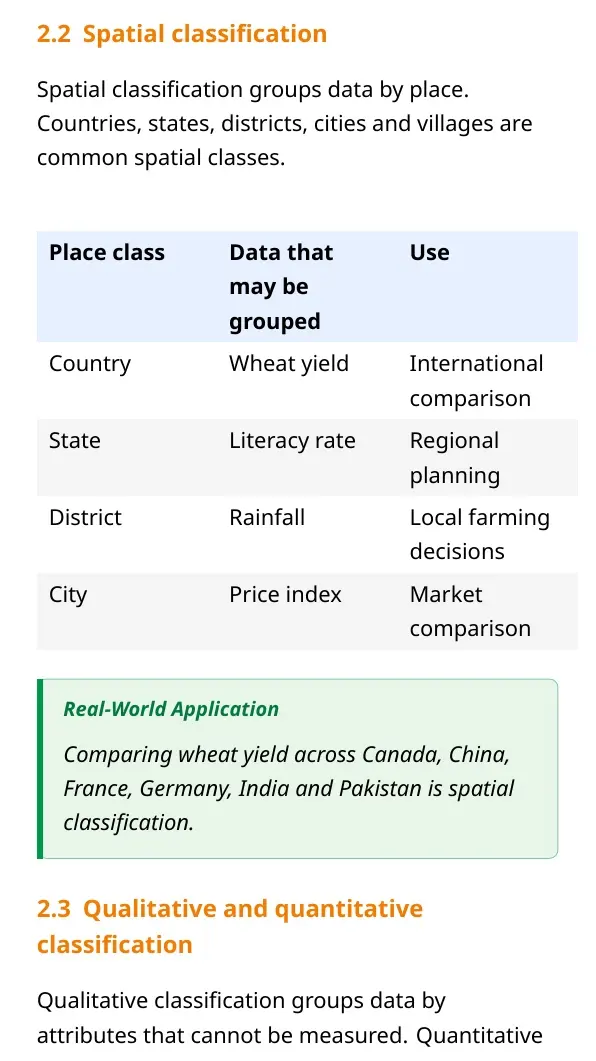
| Spatial | Data arranged by place | Population by state |
| Qualitative | Data arranged by attribute | Occupation, sex or literacy |
| Quantitative | Data arranged by numerical value | Marks, income or age groups |
Organisation of Data Quick Revision Video
Source: Magnet Brains on YouTube
Variables in Organisation of Data Class 11 Economics
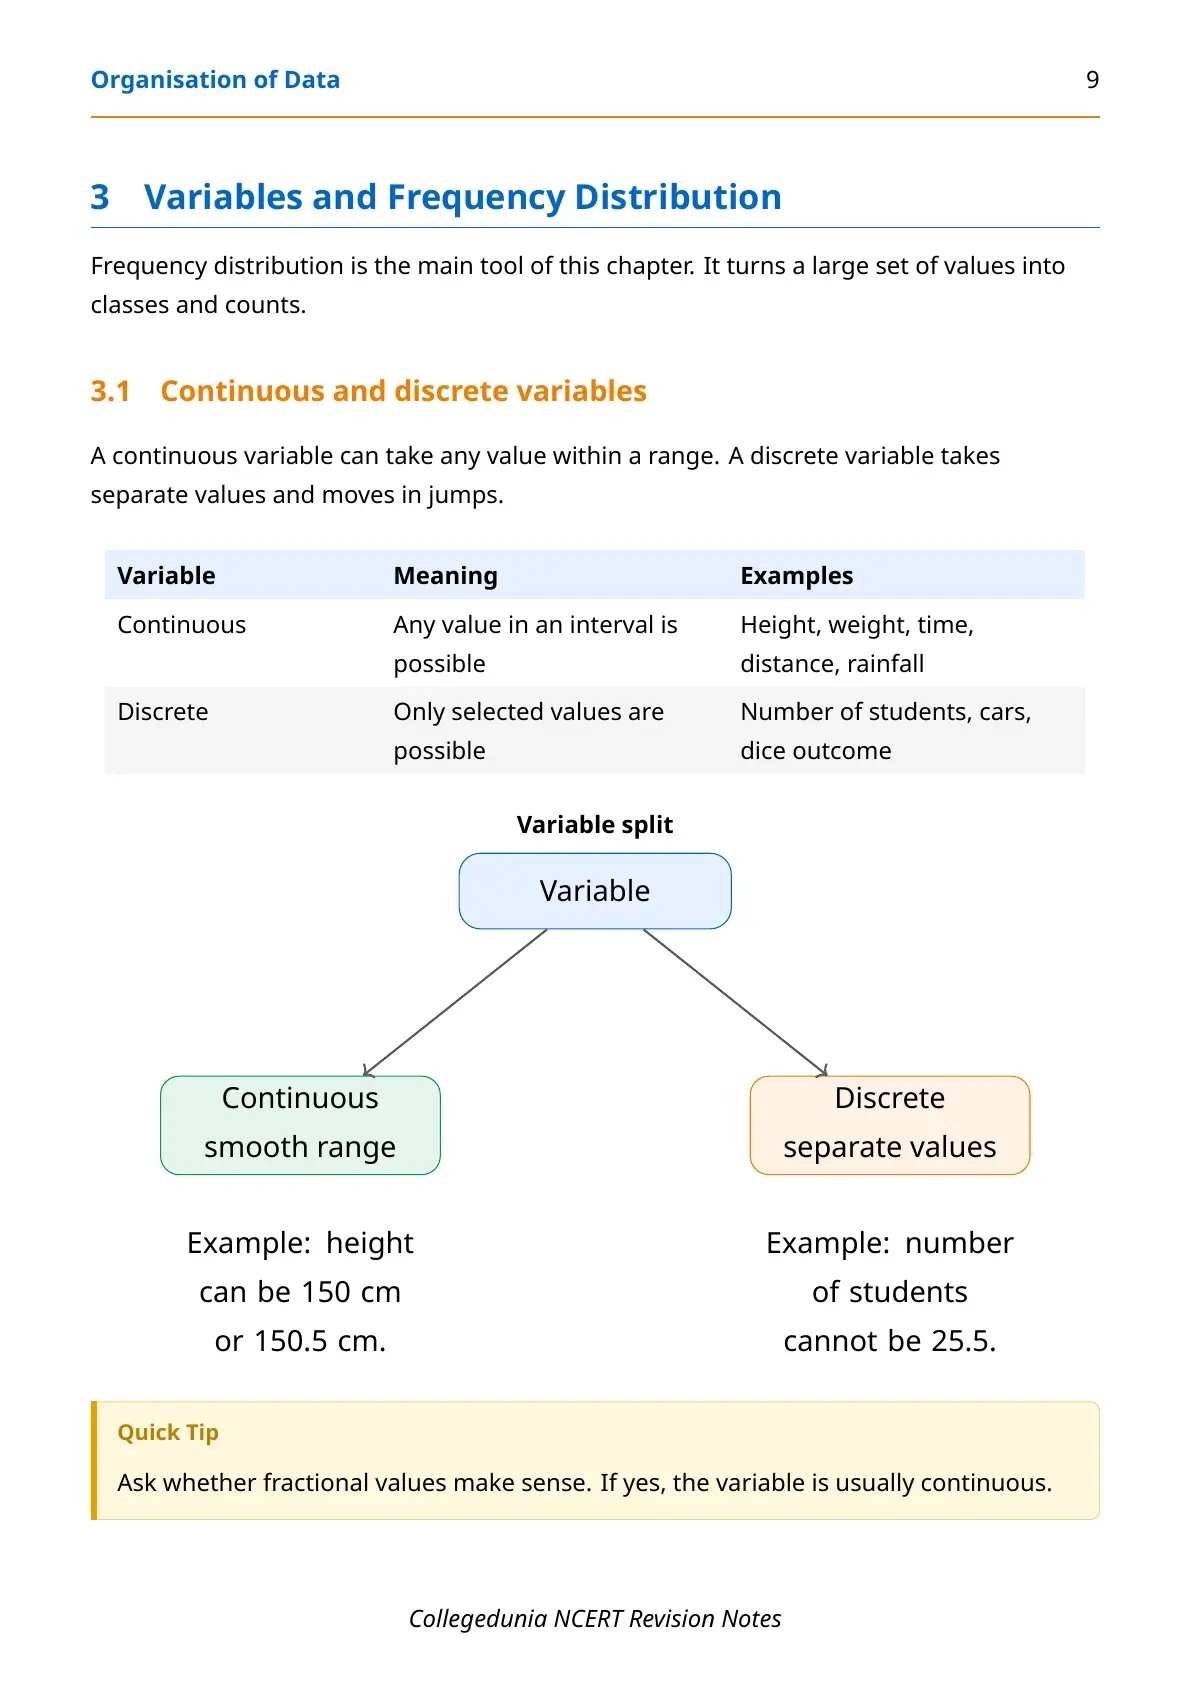
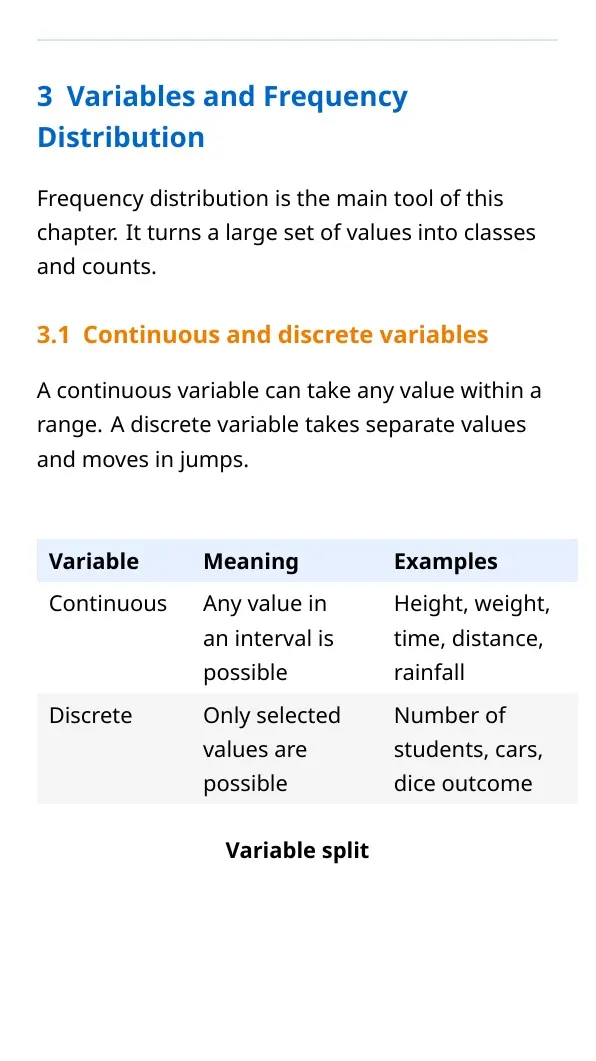
A variable is a measurable value that can change from one unit to another. Organisation of Data uses variables to convert scattered observations into meaningful groups.
- Continuous variable: can take any value within a range, such as height or weight.
- Discrete variable: takes countable values, such as number of children in a household.
- Frequency: shows how many times a value or class interval appears.
Continuous data are usually grouped into class intervals, while discrete data can often be shown as a frequency array.
Frequency Distribution in Organisation of Data Notes
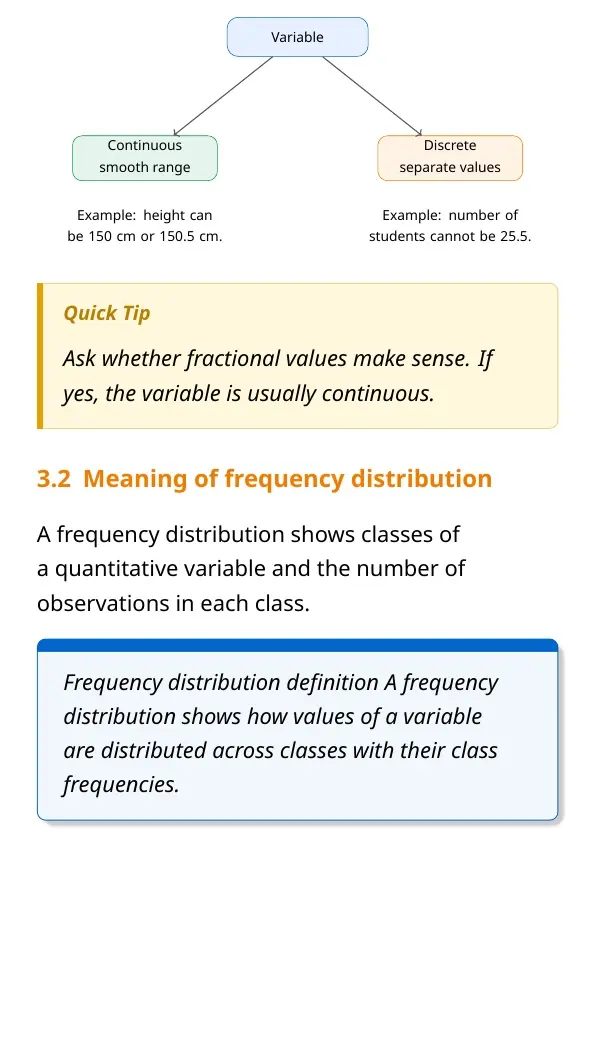
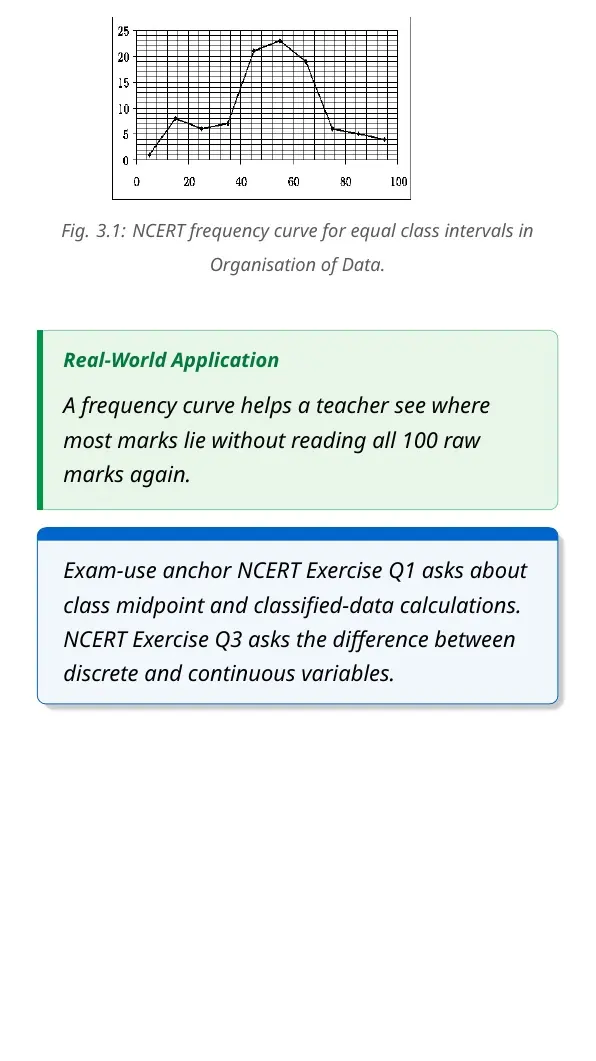
A frequency distribution arranges observations into values or class intervals and records the number of observations in each group. It is the central table form used in Chapter 3.

| Step | What students do | Check before final answer |
|---|---|---|
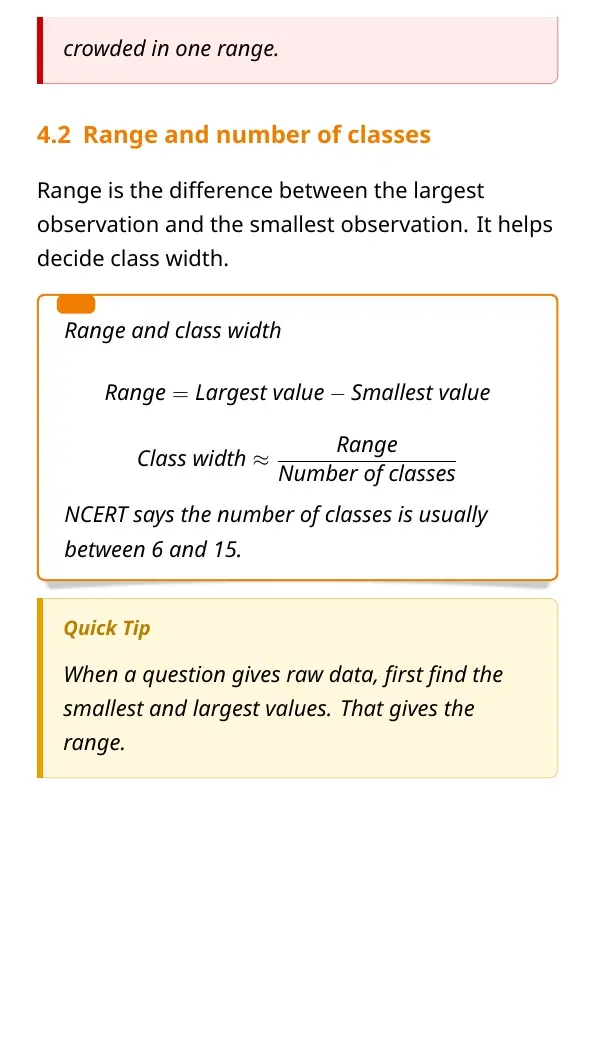
| Find range | Largest value minus smallest value | All observations are covered |
| Choose classes | Use suitable class limits | Classes do not overlap |
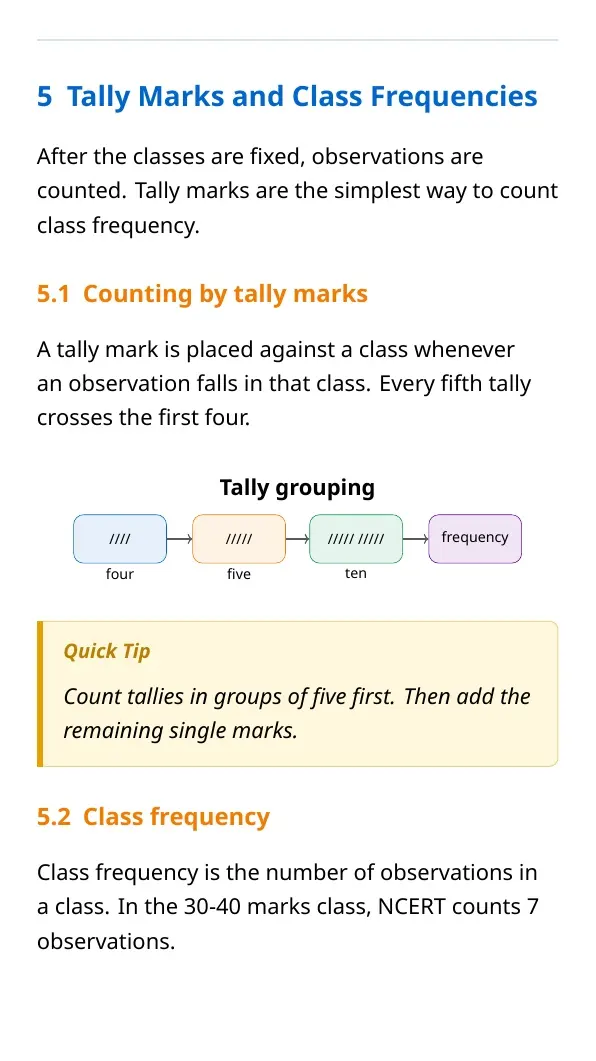
| Tally marks | Mark each observation in one class | No value is counted twice |
| Count frequency | Total tally marks for every class | Total frequency equals total observations |
Class Limits, Class Width and Class Mark
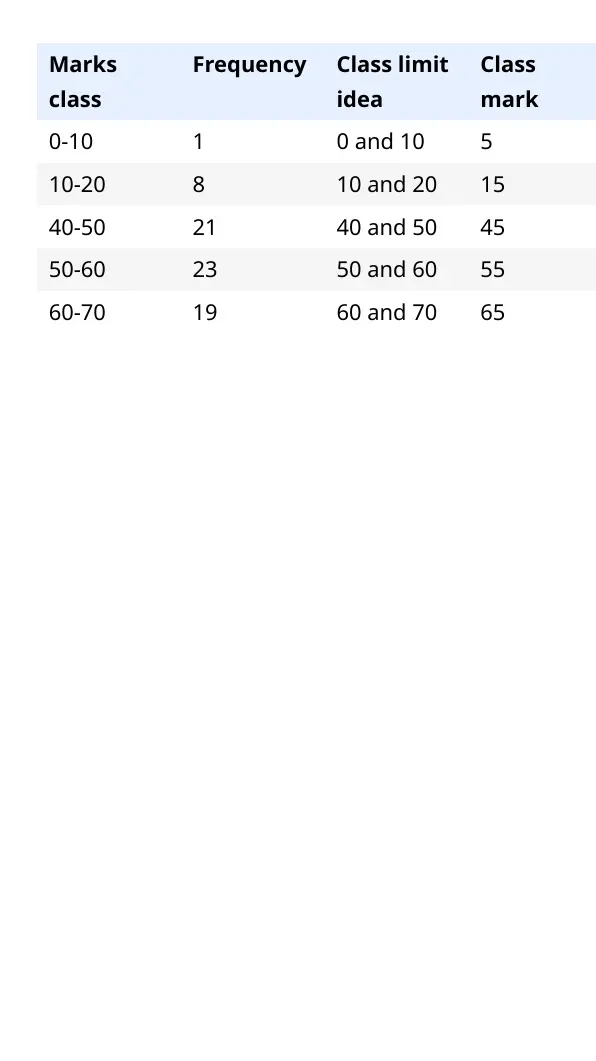
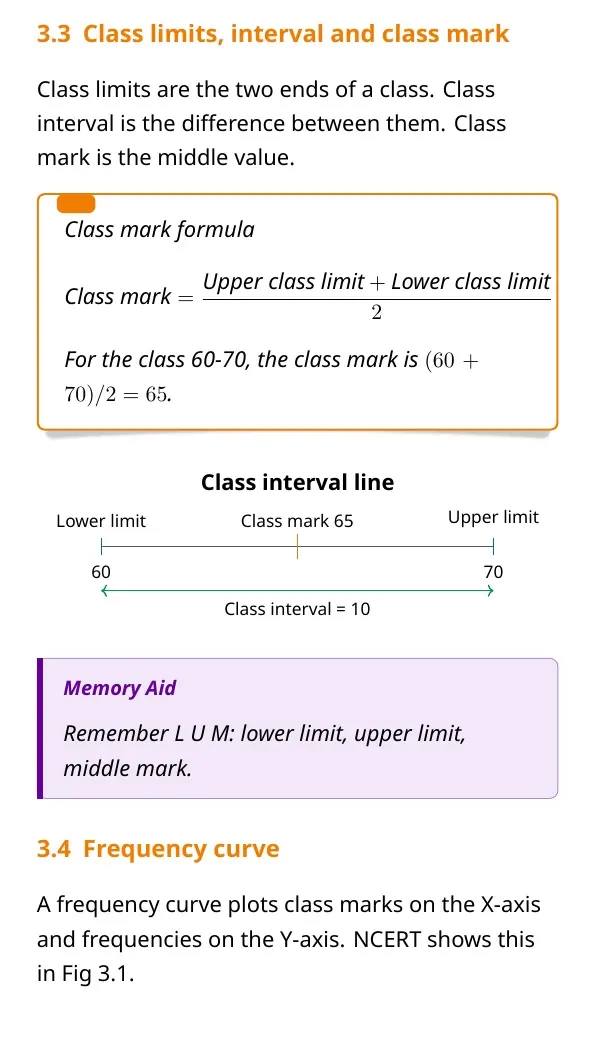
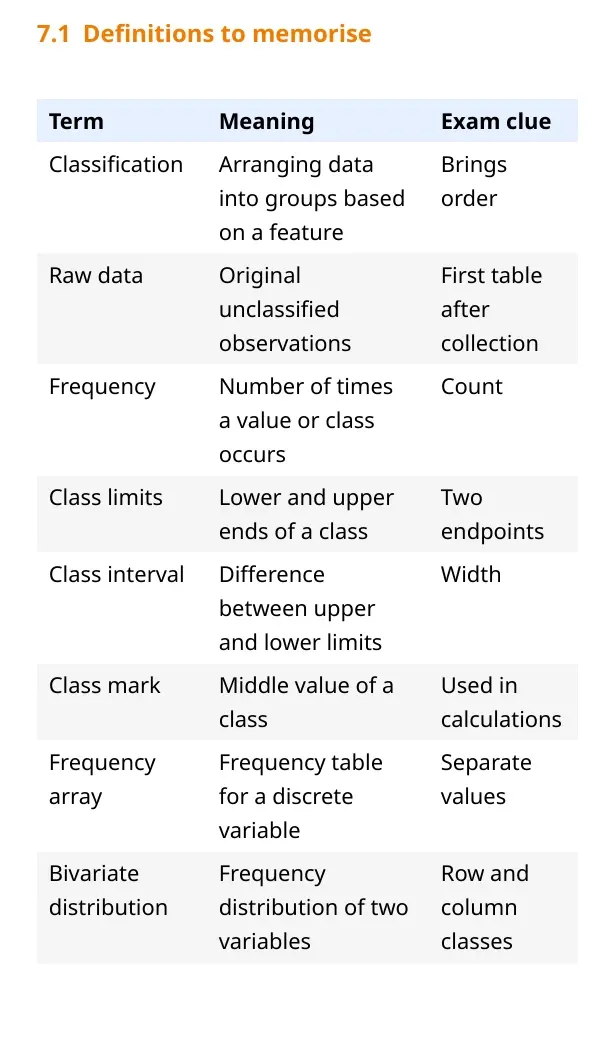
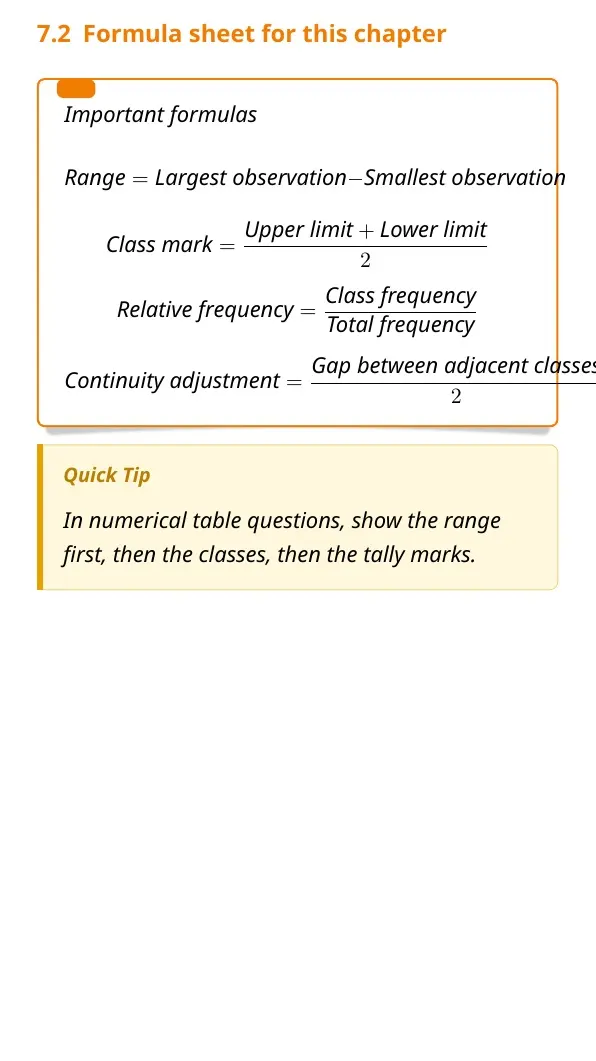
Class limits are the lowest and highest values of a class interval. Class width is the difference between the upper limit and lower limit. Class mark is the midpoint of a class interval.
| Term | Formula or rule | Example |
|---|---|---|
| Lower limit | Starting value of the class | 10 in 10-20 |
| Upper limit | Ending value of the class | 20 in 10-20 |
| Class width | Upper limit minus lower limit | 20 - 10 = 10 |
| Class mark | (Upper limit + lower limit) / 2 | (10 + 20) / 2 = 15 |
Inclusive and Exclusive Class Intervals
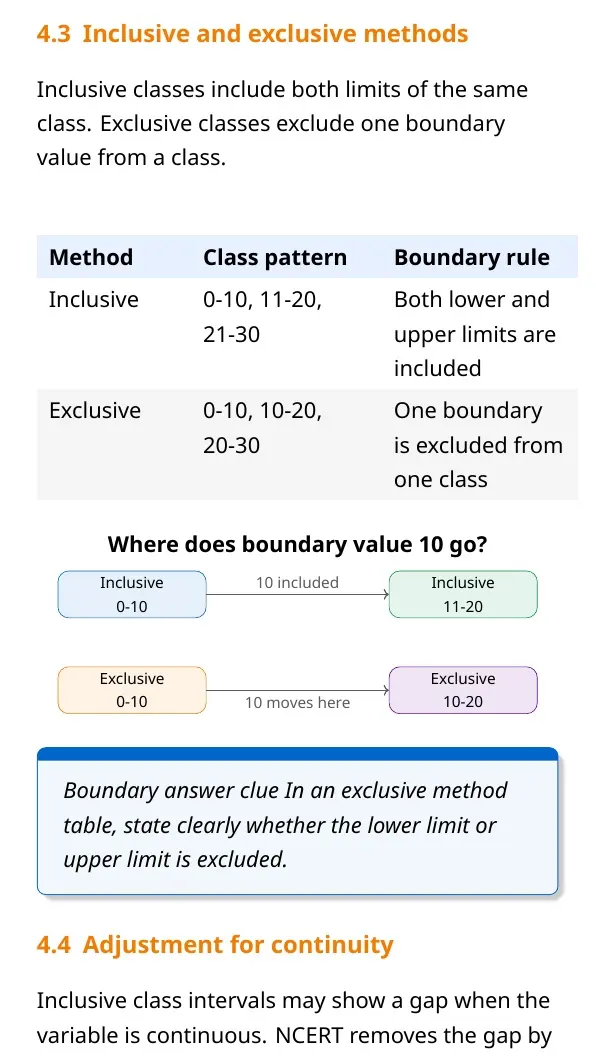
Inclusive and exclusive methods decide how class boundaries treat the upper limit. This is a common test area because the same data can be grouped differently depending on the method.
- Inclusive method: both lower and upper limits are included in a class, such as 10-19.
- Exclusive method: the upper limit is excluded and counted in the next class, such as 10-20.
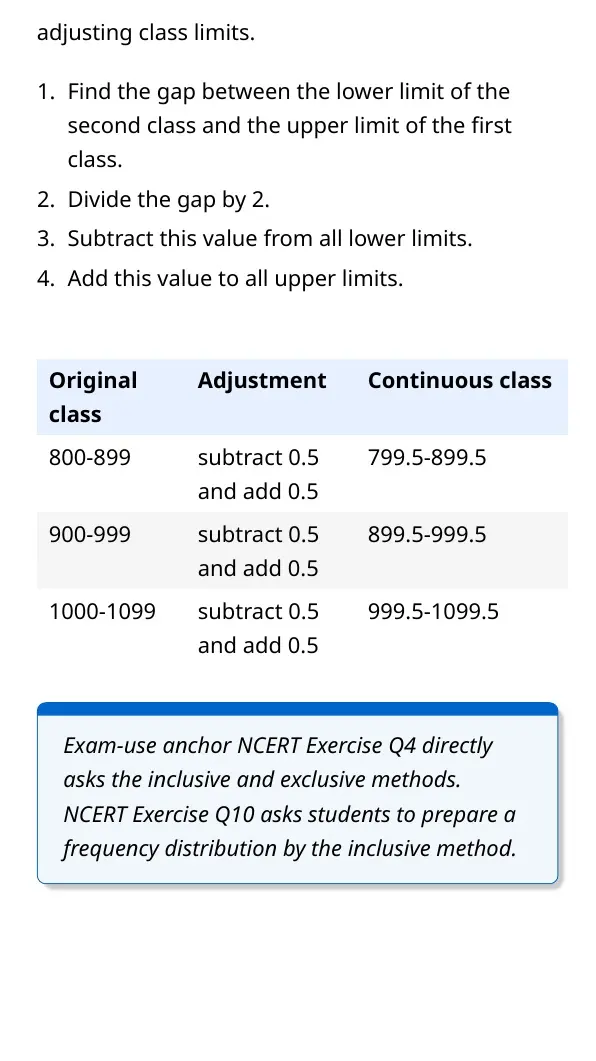
- Continuity adjustment: inclusive classes can be converted into continuous classes by adjusting boundaries.
Discrete and Bivariate Frequency Tables
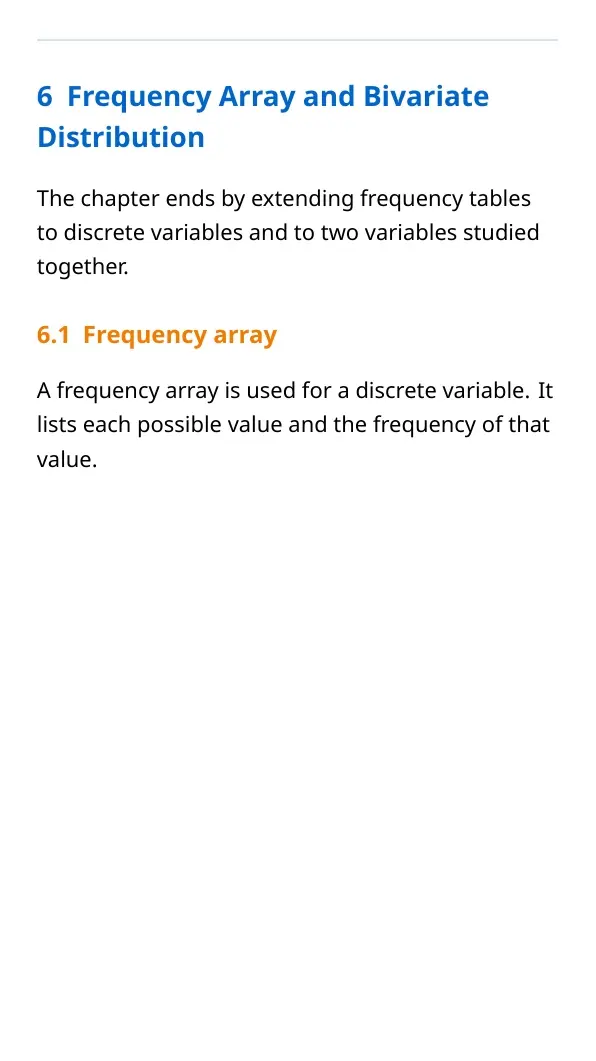
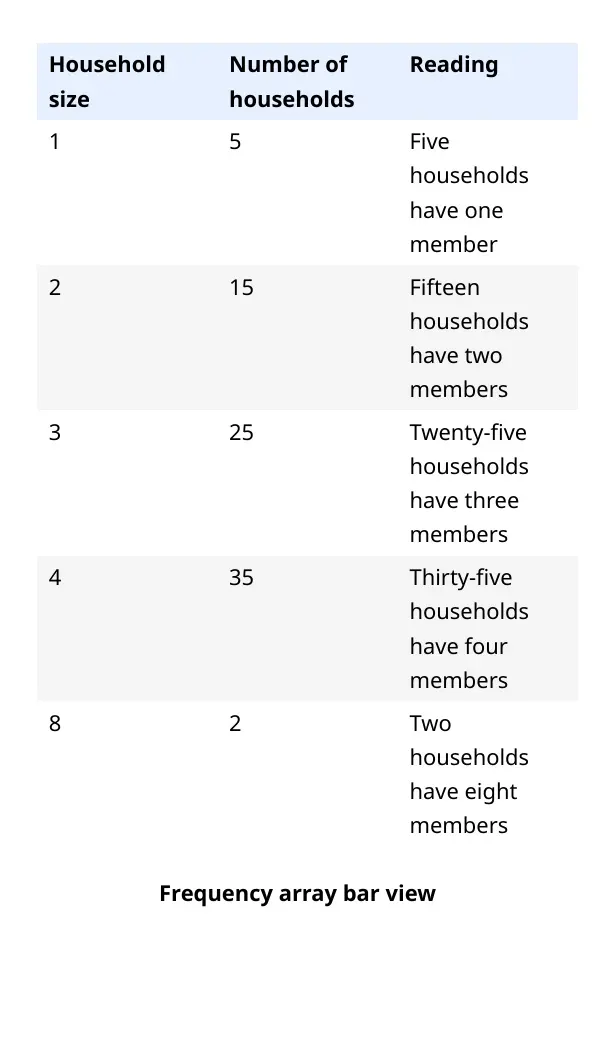
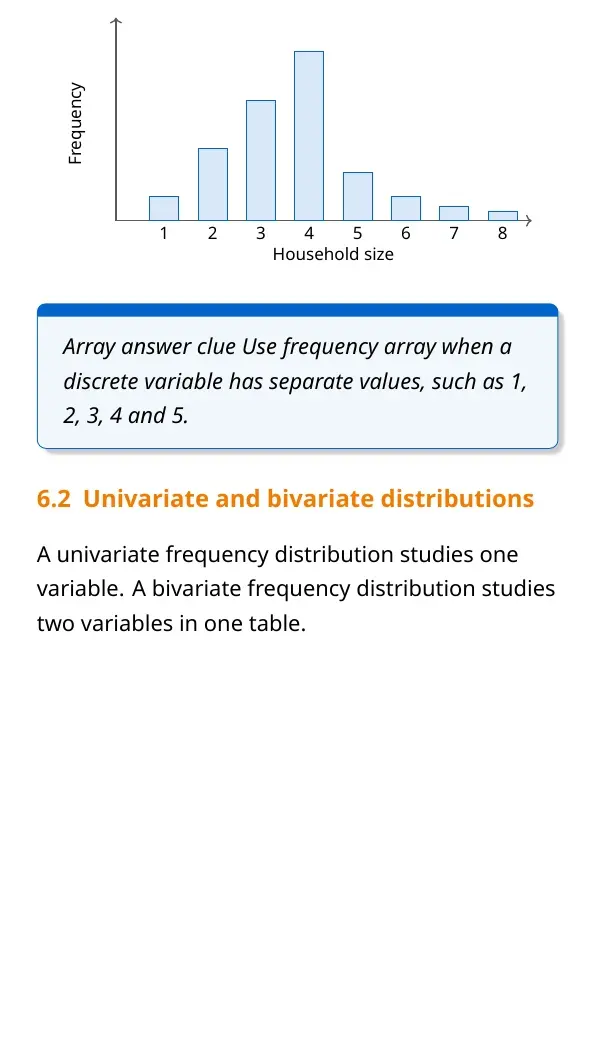
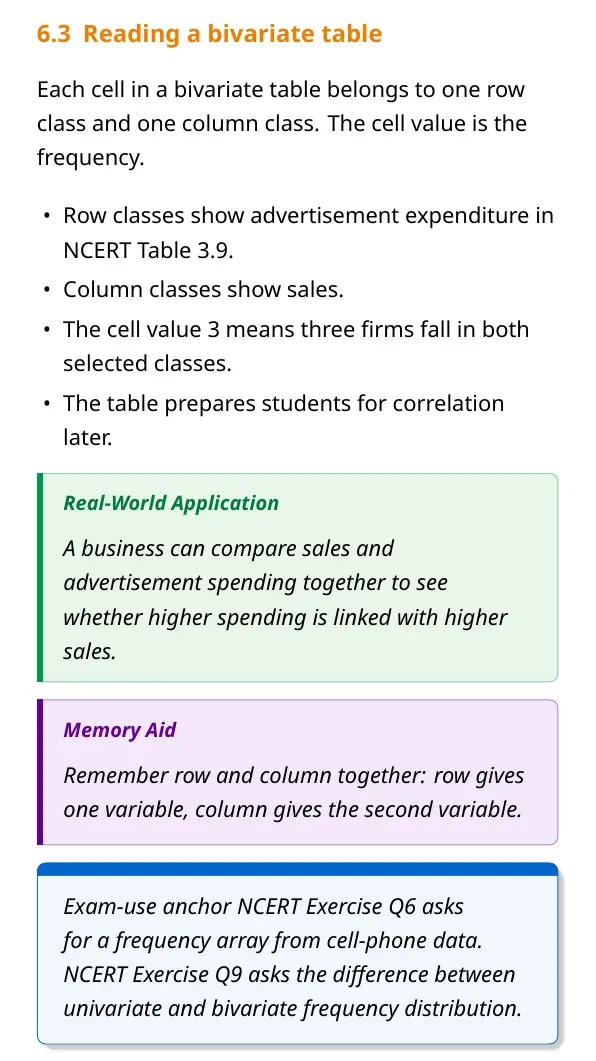
Discrete data can be arranged as a frequency array when values are countable. Bivariate frequency tables show the frequency of two variables together, such as sales and advertising expenditure.
| Table type | Used when | Revision clue |
|---|---|---|
| Univariate table | One variable is studied | Marks of students |
| Frequency array | Discrete values are counted | Household size |
| Bivariate table | Two variables are studied together | Sales and advertising |
Download Organisation of Data Class 11 Economics Notes PDF
The PDF above gives a full revision set for Organisation of Data. It covers raw data, classification, variables, frequency distributions, class intervals, class marks and bivariate tables.
| Study pass | What to revise | Target |
|---|---|---|
| Pass 1 | Classification and variables | Definition-based answers |
| Pass 2 | Frequency distribution steps | Table construction questions |
| Pass 3 | Inclusive and exclusive classes | Difference-based answers |
Related Class 11 Economics Resources for Organisation of Data
Also Check: use these links when you need the same chapter in another format.
| Resource | Best used for | Link |
|---|---|---|
| NCERT Book PDF | Official chapter wording and examples | Organisation of Data NCERT Book PDF |
| NCERT Solutions | Answers to textbook exercises | Organisation of Data NCERT Solutions |
| Handwritten Notes | Fast visual revision before tests | Organisation of Data Handwritten Notes |
Class 11 Economics Notes for All Chapters
| Chapter | Notes Link |
|---|---|
| Chapter 1 | Introduction Notes |
| Chapter 2 | Collection of Data Notes |
| Chapter 3 | You are here |
| Chapter 4 | Presentation of Data Notes |
| Chapter 5 | Measures of Central Tendency Notes |
| Chapter 6 | Correlation Notes |
Organisation of Data Class 11 Economics Notes FAQs
Ques. What is covered in Class 11 Economics Chapter 3 Organisation of Data notes?
Ans. The notes cover raw data, classification, variables, frequency distribution, class intervals, class marks and bivariate frequency tables.
Ques. What is classification of data in Organisation of Data?
Ans. Classification of data means arranging raw observations into groups according to time, place, quality or numerical value.
Ques. What is the difference between inclusive and exclusive class intervals?
Ans. In inclusive intervals, the upper limit belongs to the same class. In exclusive intervals, the upper limit belongs to the next class.
Ques. What is class mark in Organisation of Data?
Ans. Class mark is the midpoint of a class interval. It is calculated as the lower limit plus upper limit divided by two.



Comments