




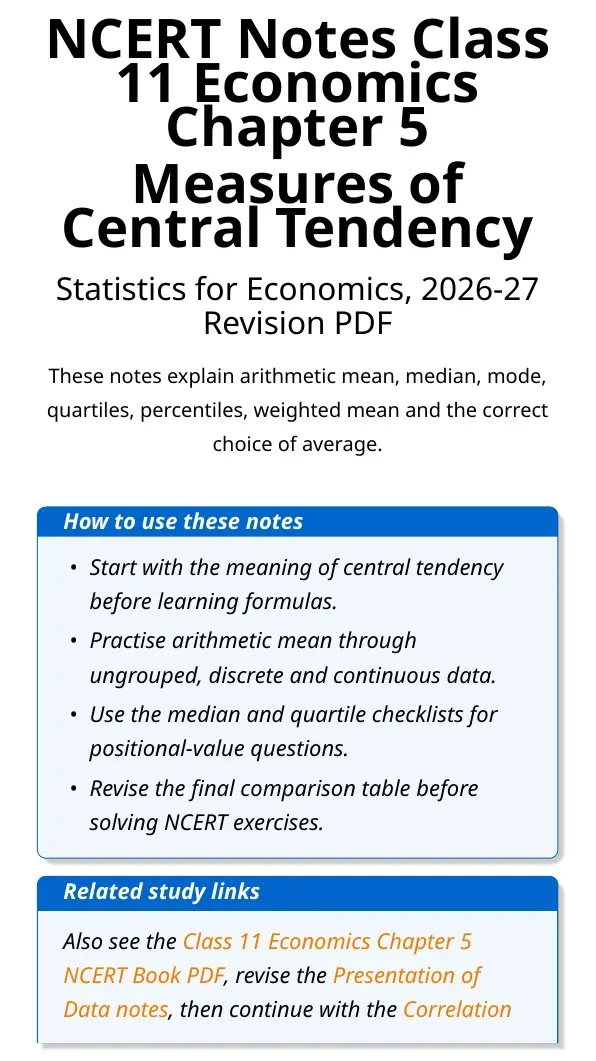
Class 11 Economics Chapter 5 Measures of Central Tendency notes help students revise arithmetic mean, weighted mean, median, quartiles and mode for the 2026-27 syllabus. The chapter shows how one representative value can summarise a large set of observations.
- Download the Measures of Central Tendency notes PDF for offline revision.
- Revise direct, assumed mean and step-deviation methods with formulas.
- Use the mean, median and mode comparison tables for quick answers.









Student Feedback: In a Collegedunia poll of 13,280 Class 11 Economics students conducted before the 2026 boards, 72% of students said choosing between mean, median and mode was harder than applying a single formula. These notes place the choice rules beside the formulas for faster revision.
Measures of Central Tendency Notes: Why Averages Are Needed
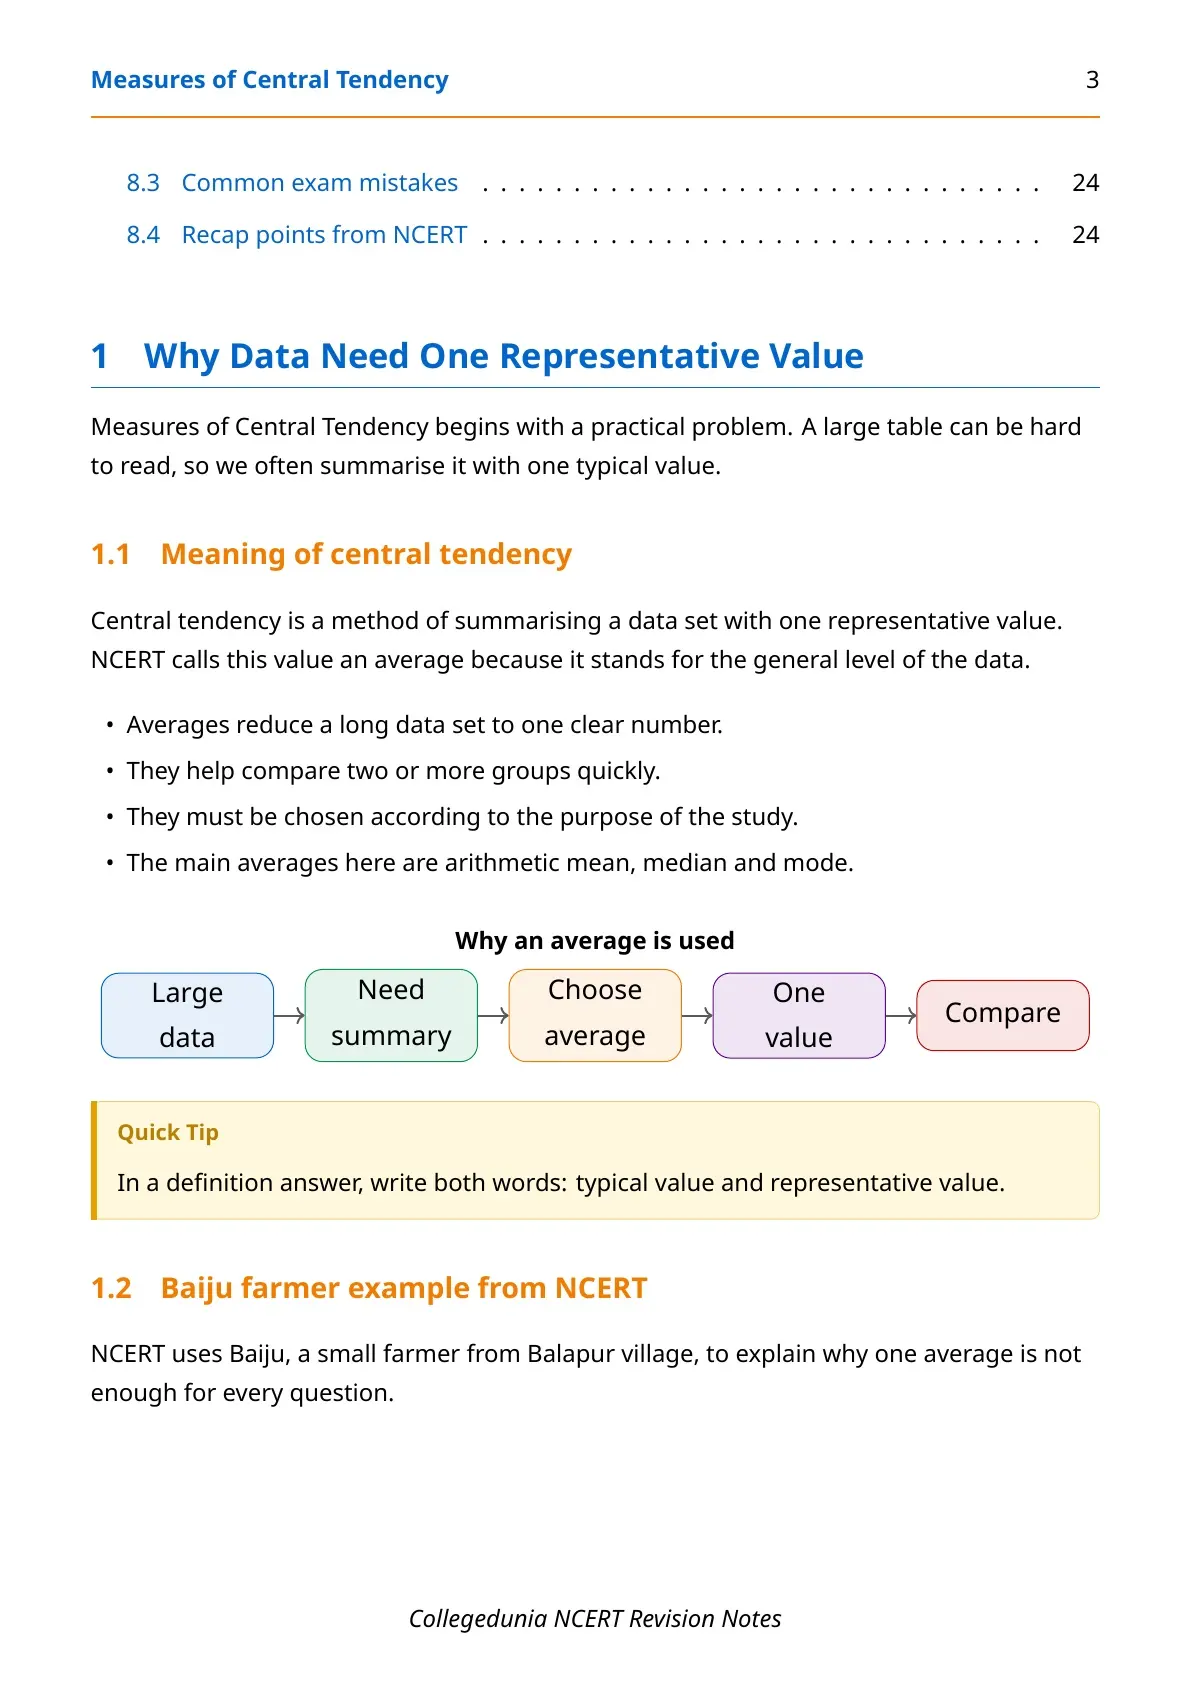
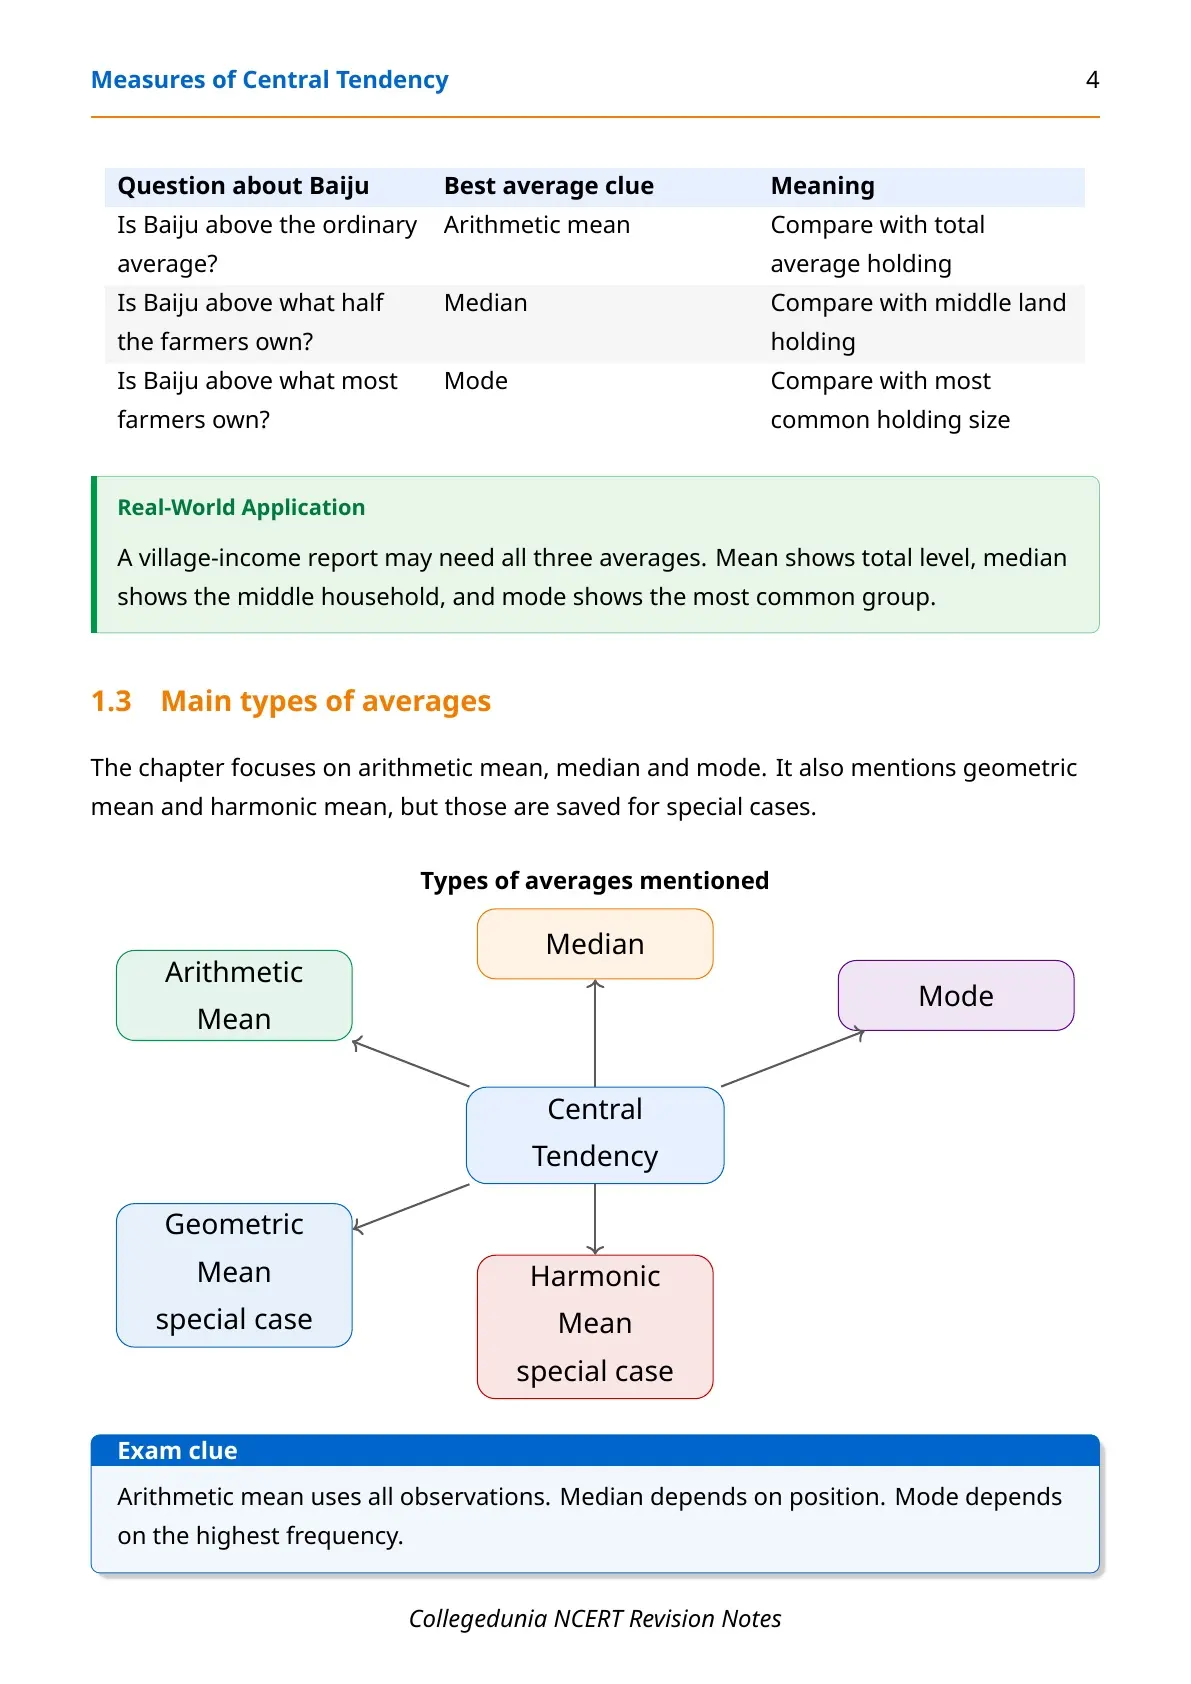
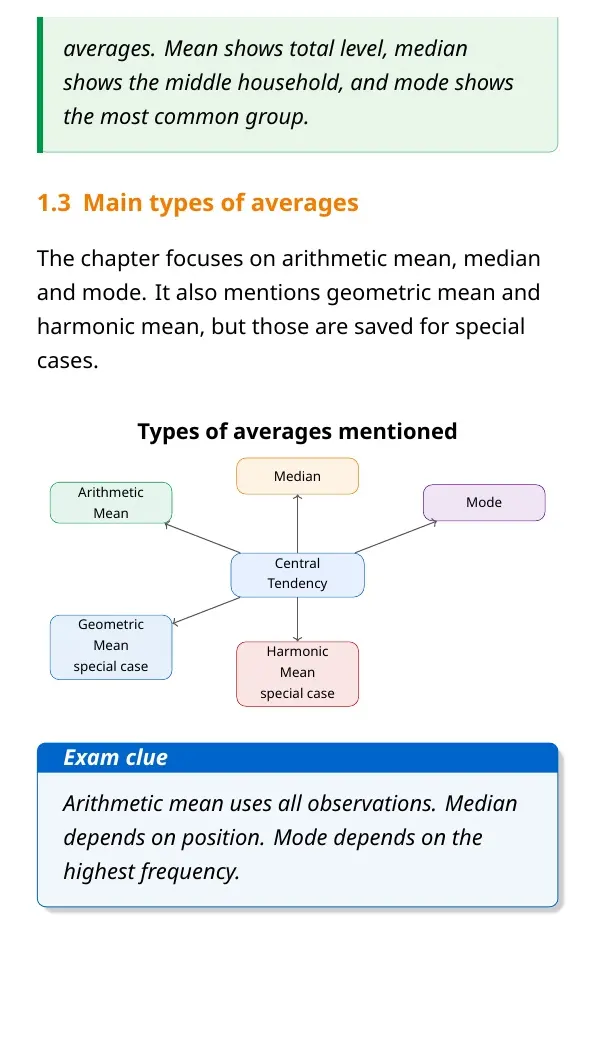
A measure of central tendency is a single value that stands for the centre of a distribution. NCERT introduces averages because raw data are often too scattered to compare directly.
| Average | Main idea | Best classroom clue |
|---|---|---|
| Arithmetic mean | Total value divided by number of observations | Use all observations |
| Median | Middle value after arranging data | Find position first |
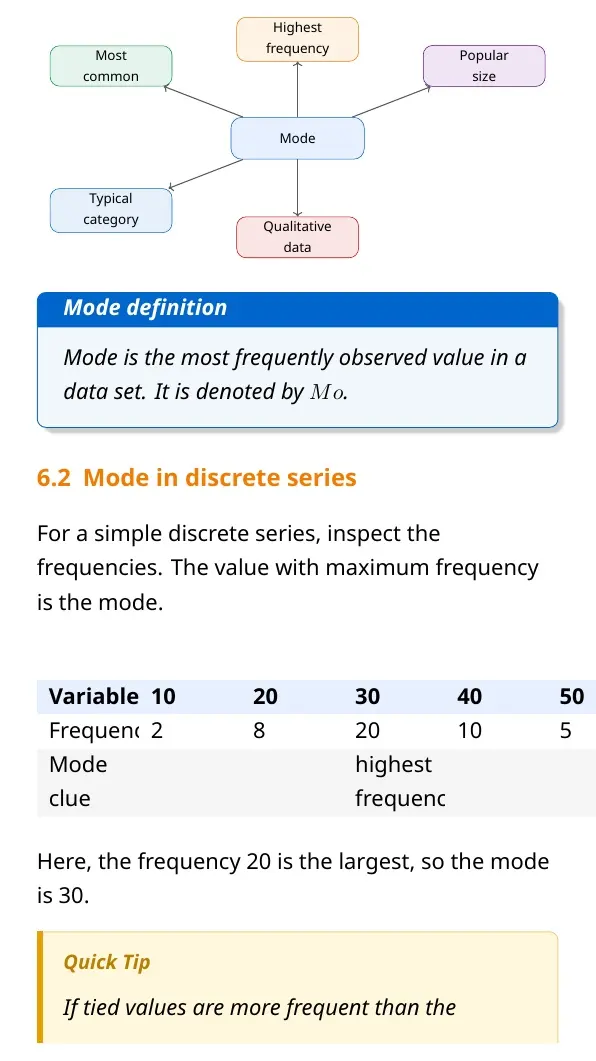
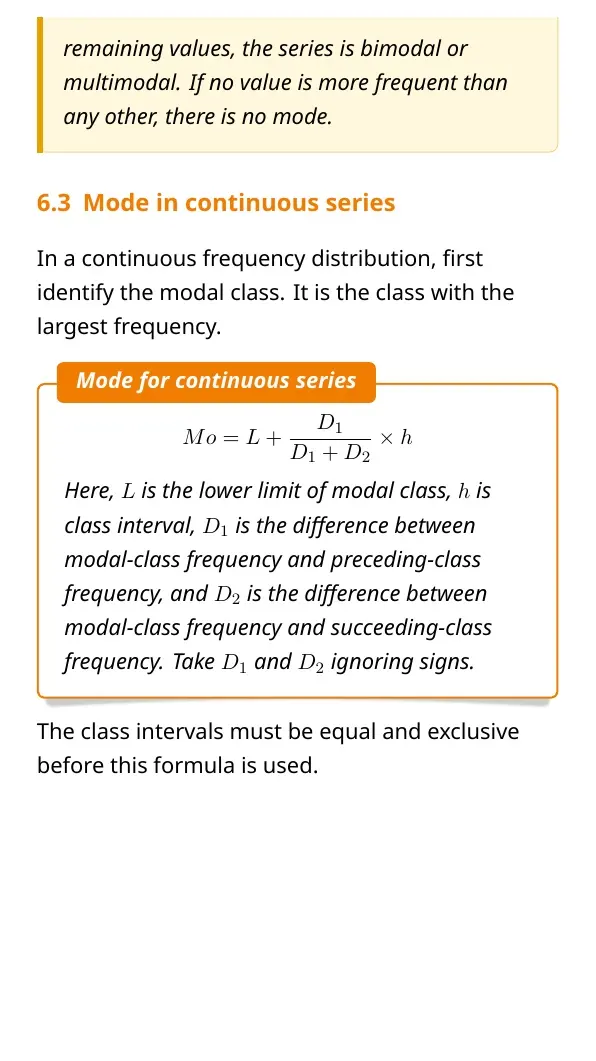
| Mode | Most frequent value | Look for highest frequency |
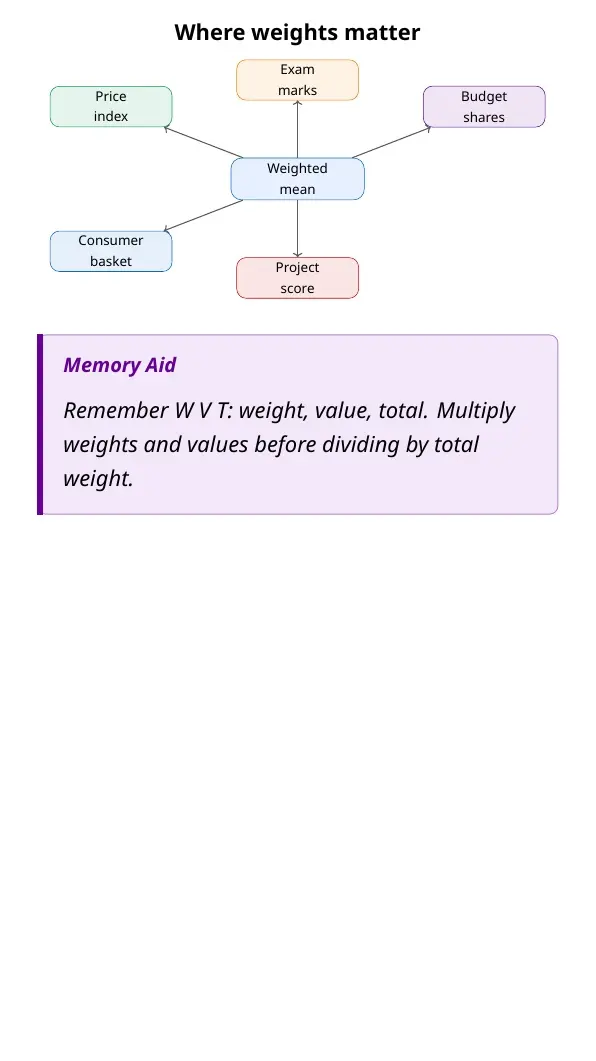
| Weighted mean | Mean after giving importance to each value | Use weights or marks |
Arithmetic Mean Formula in Class 11 Economics
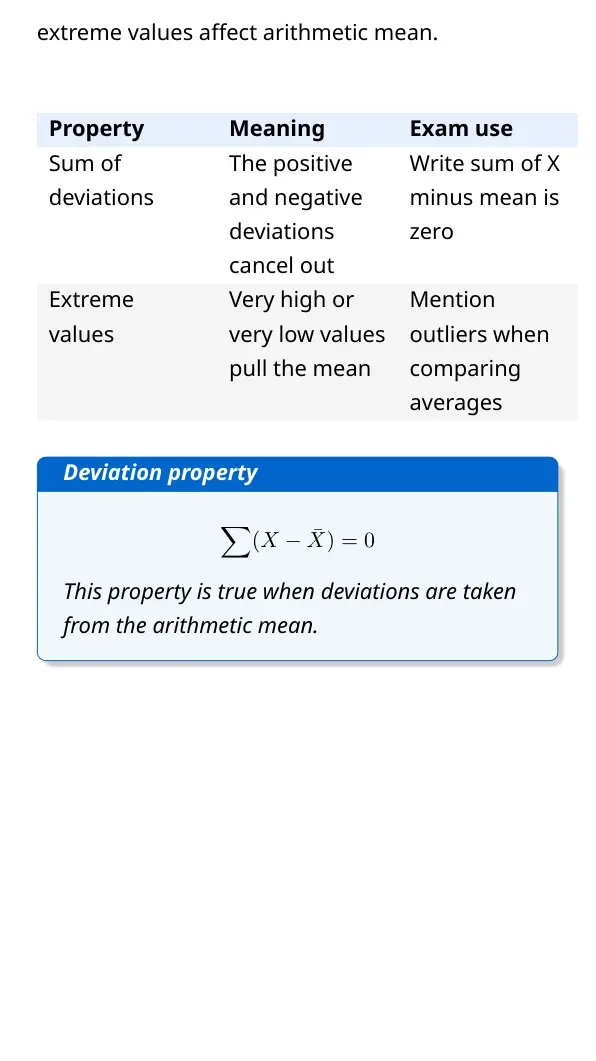
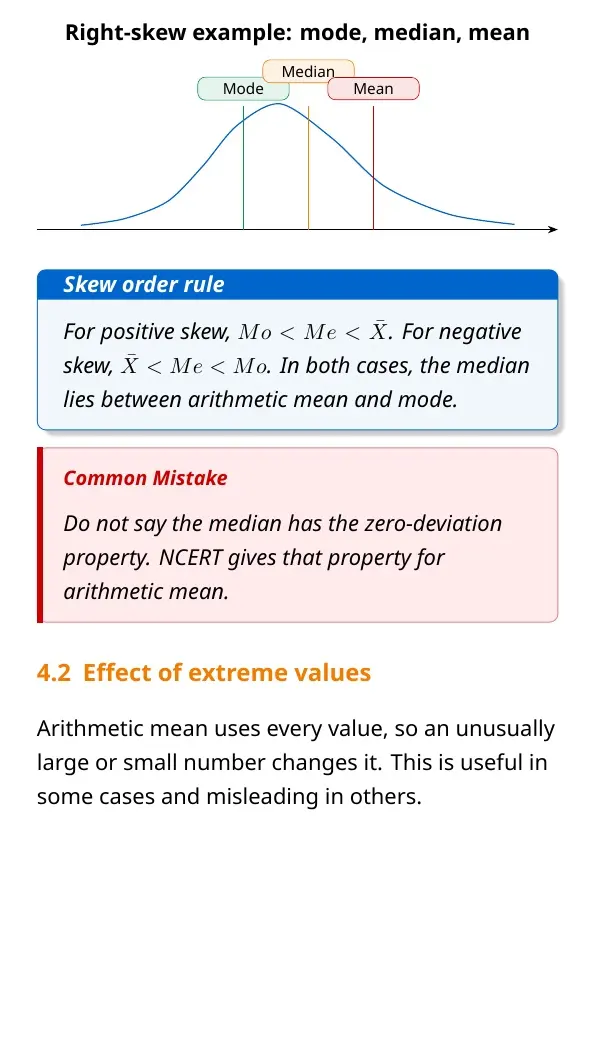
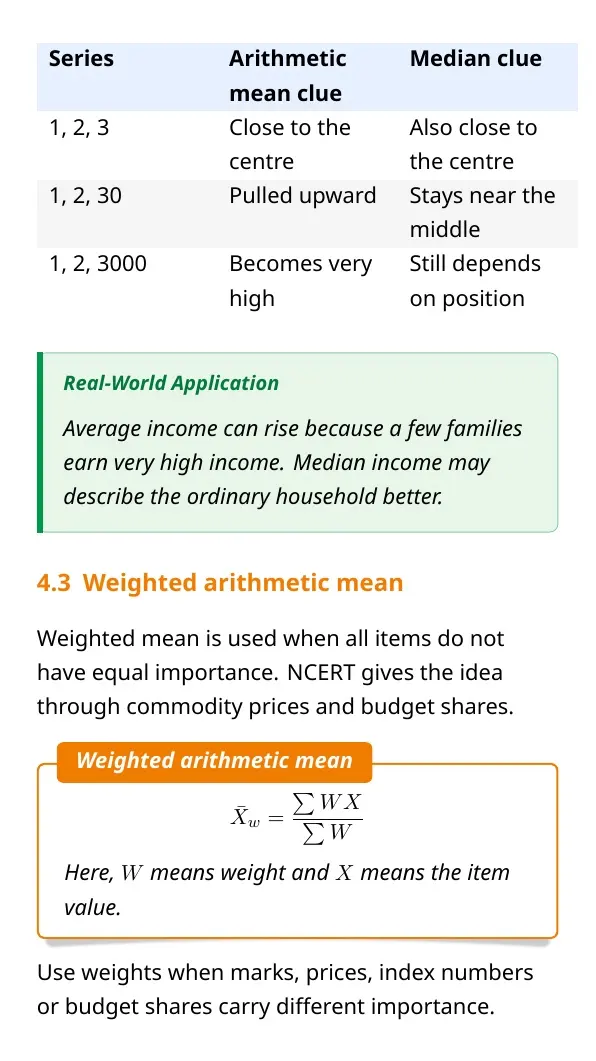
Arithmetic mean is the most familiar average. It uses every observation, so it is simple and precise, but it can be affected by extreme values.

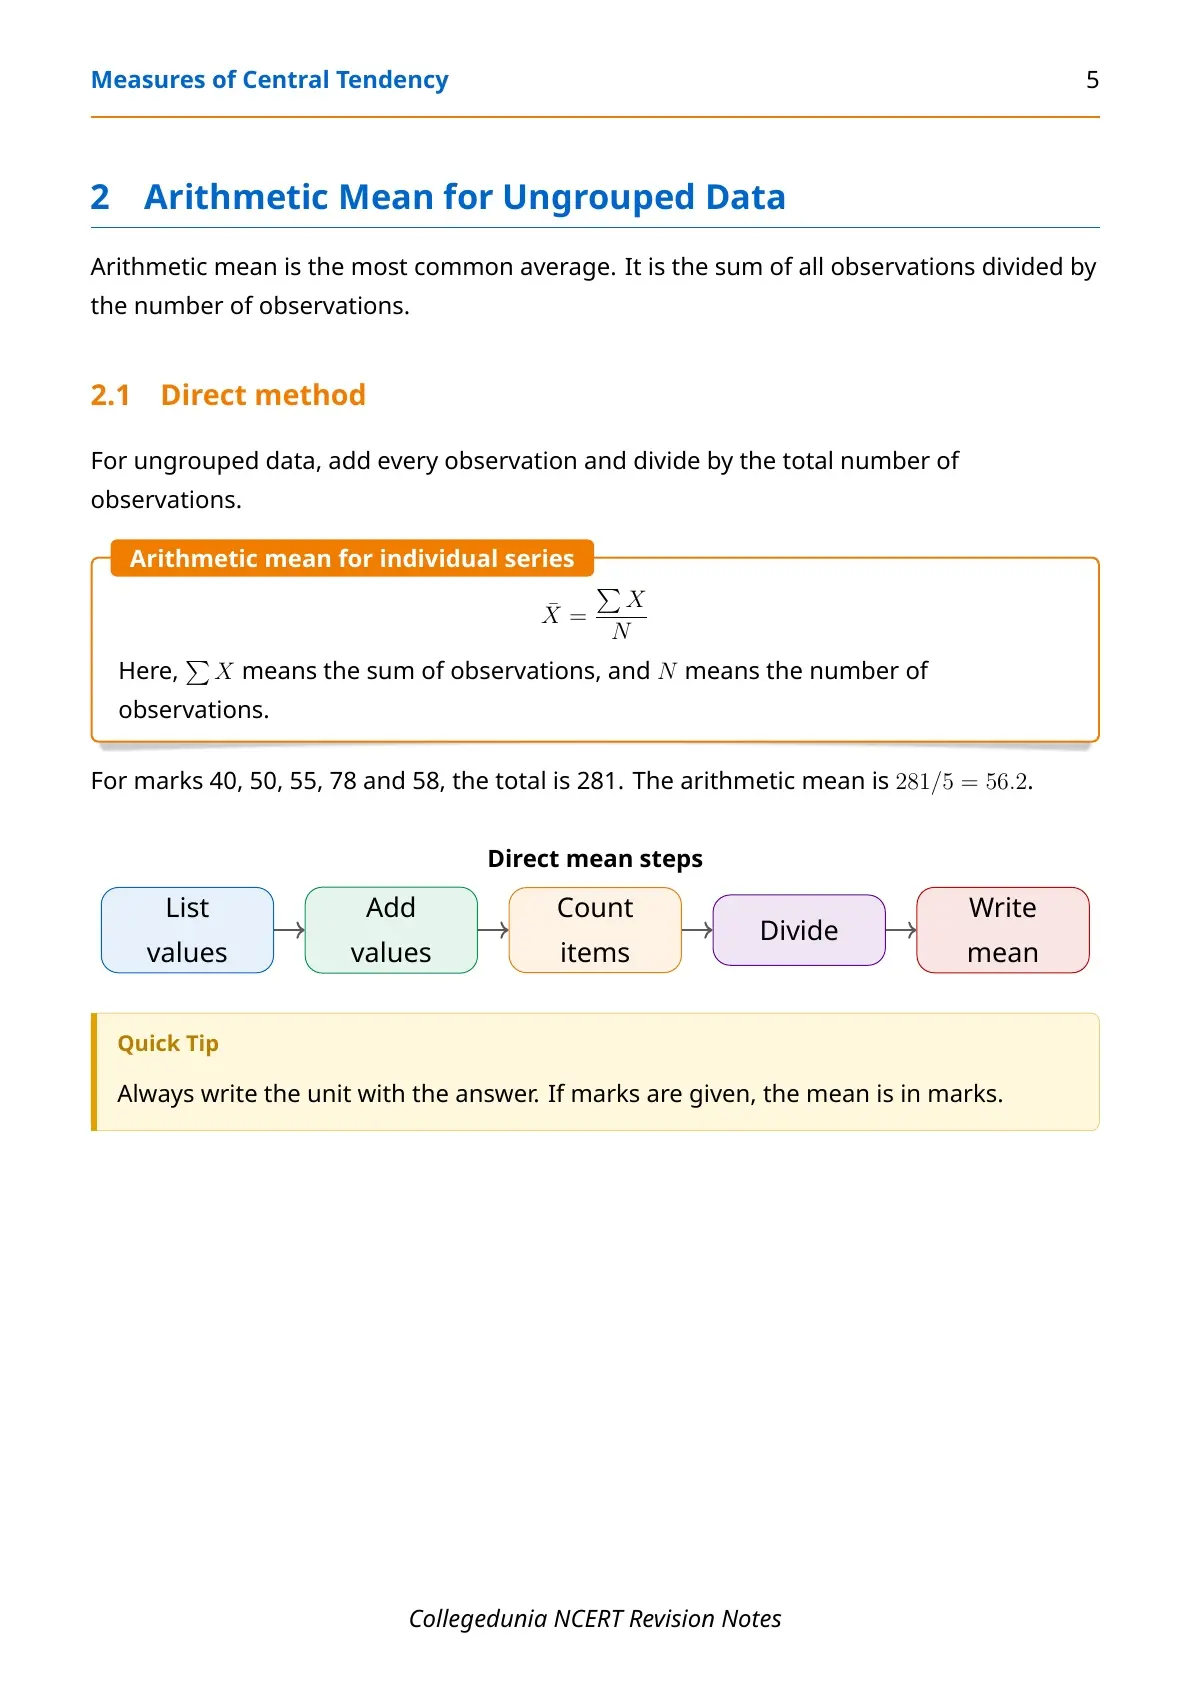
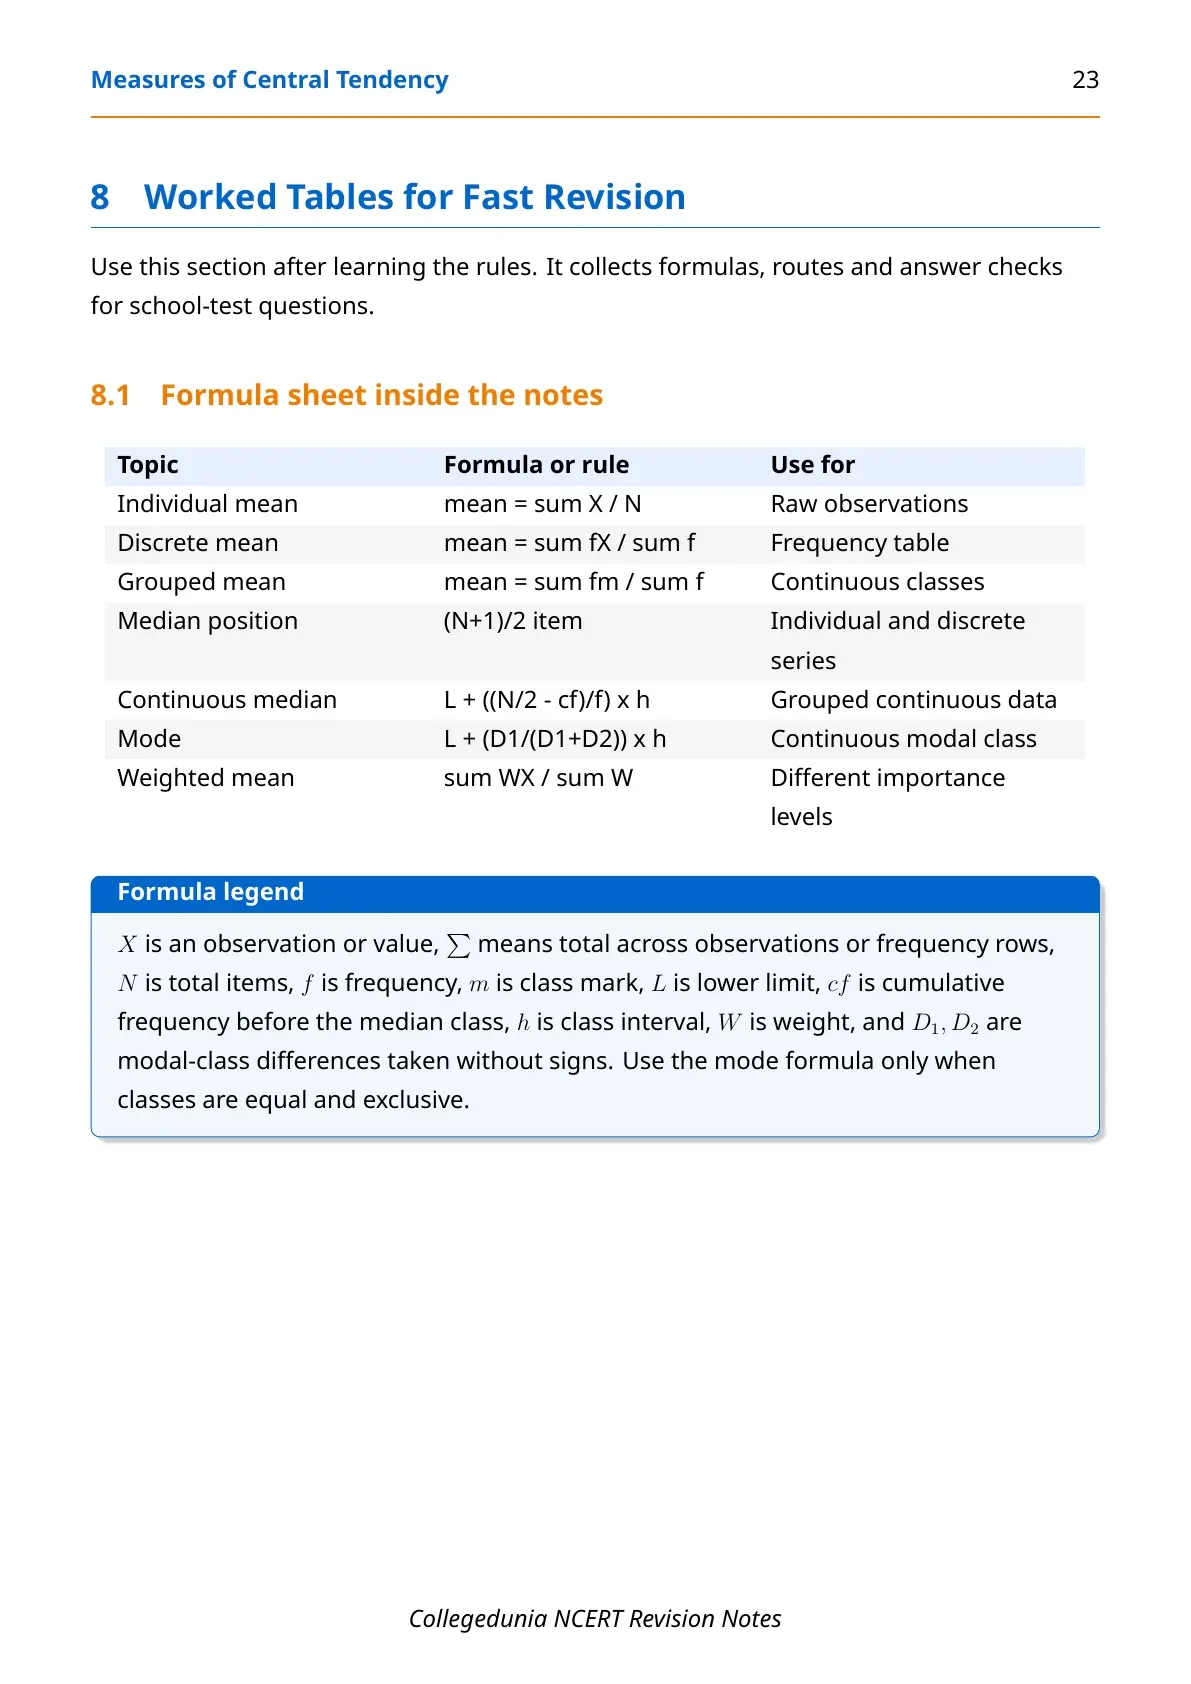
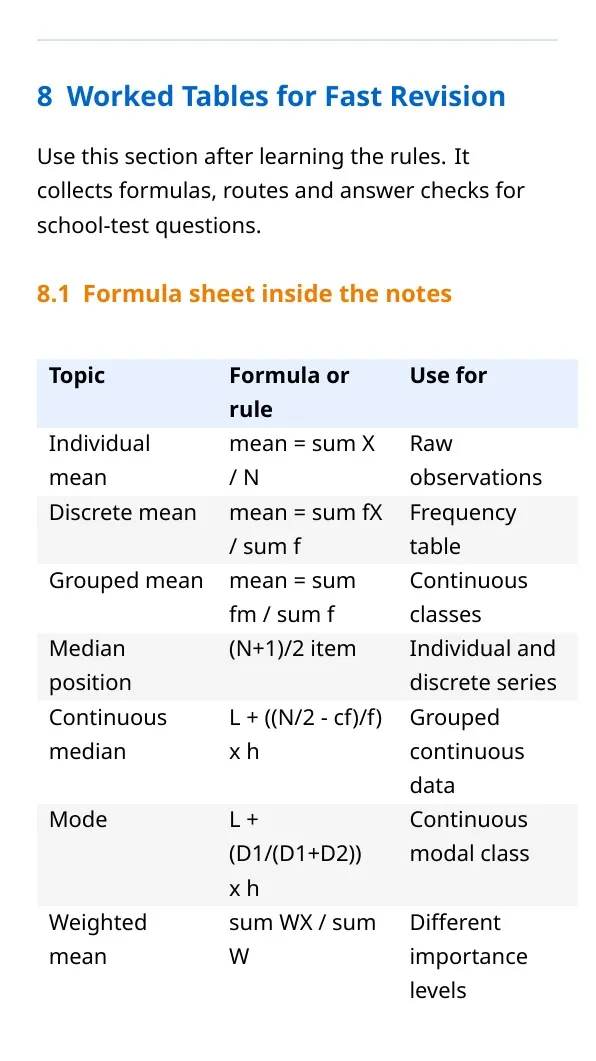
- Individual series: Mean = sum of all values / number of values.
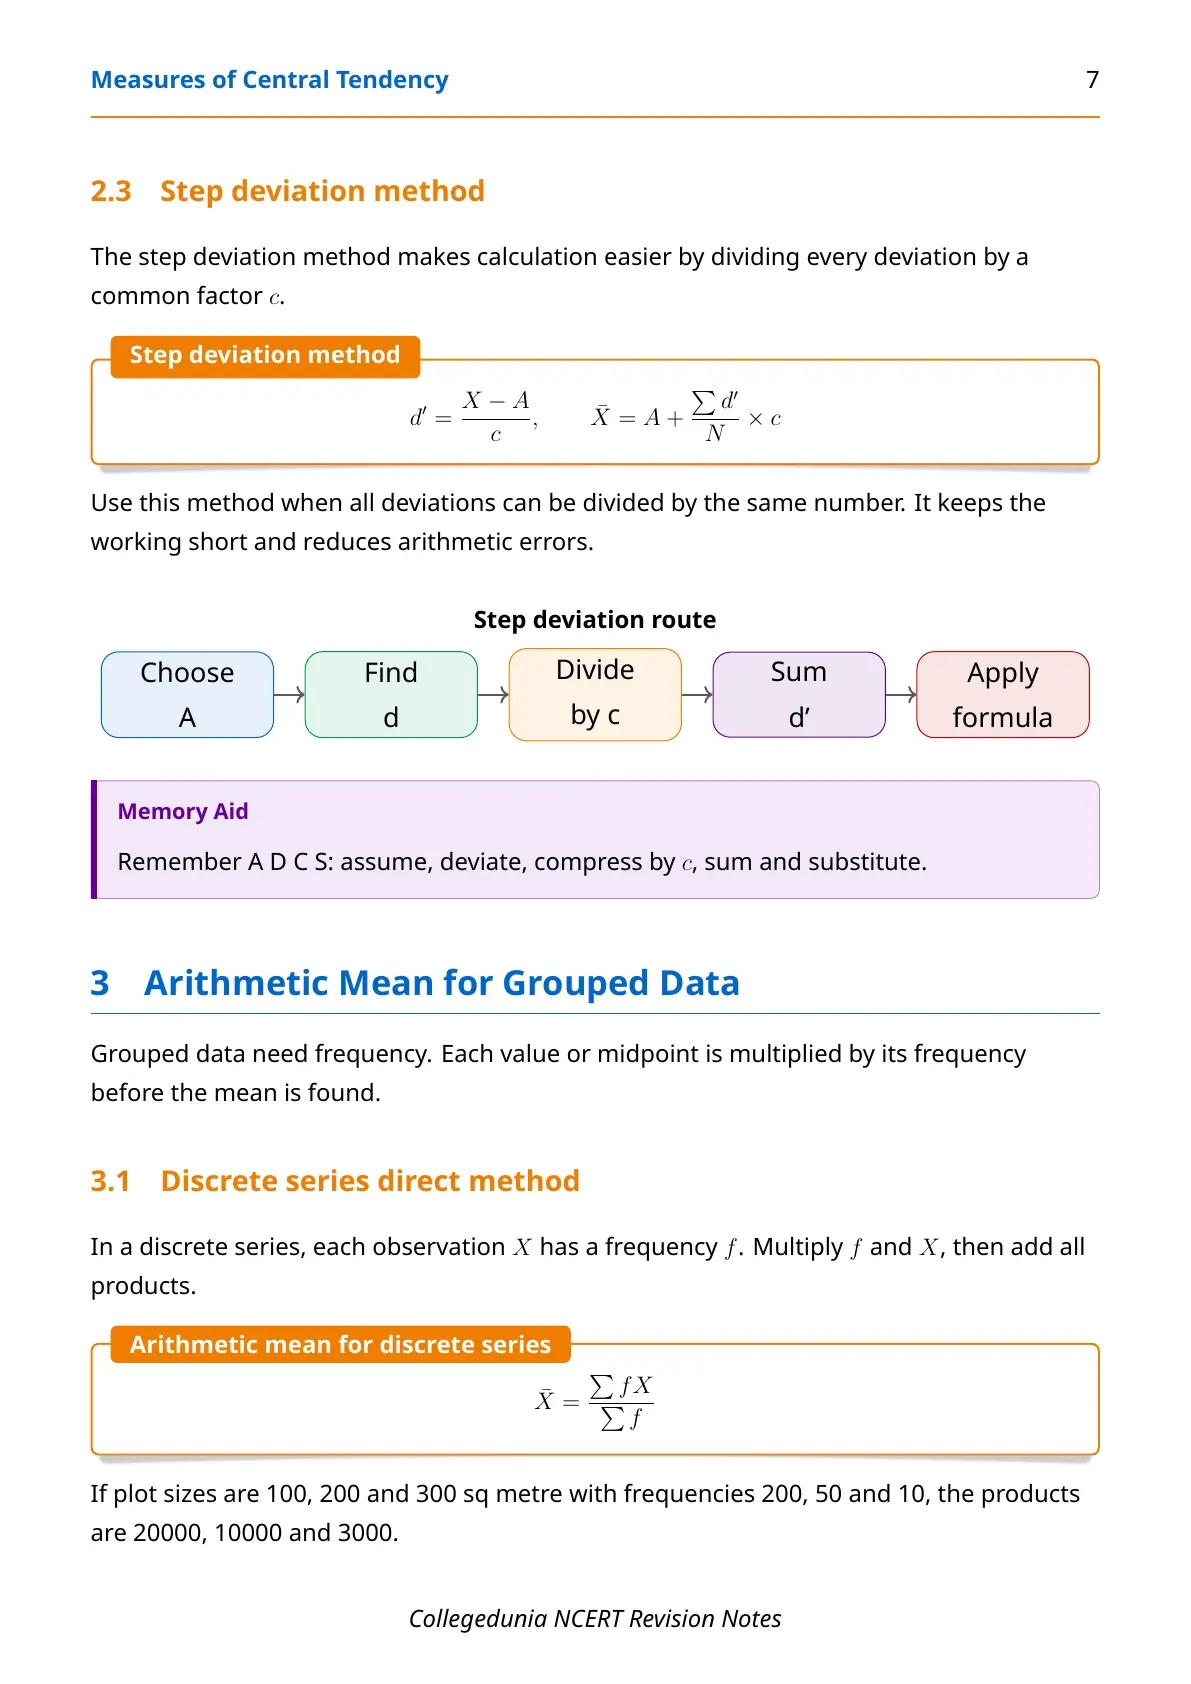
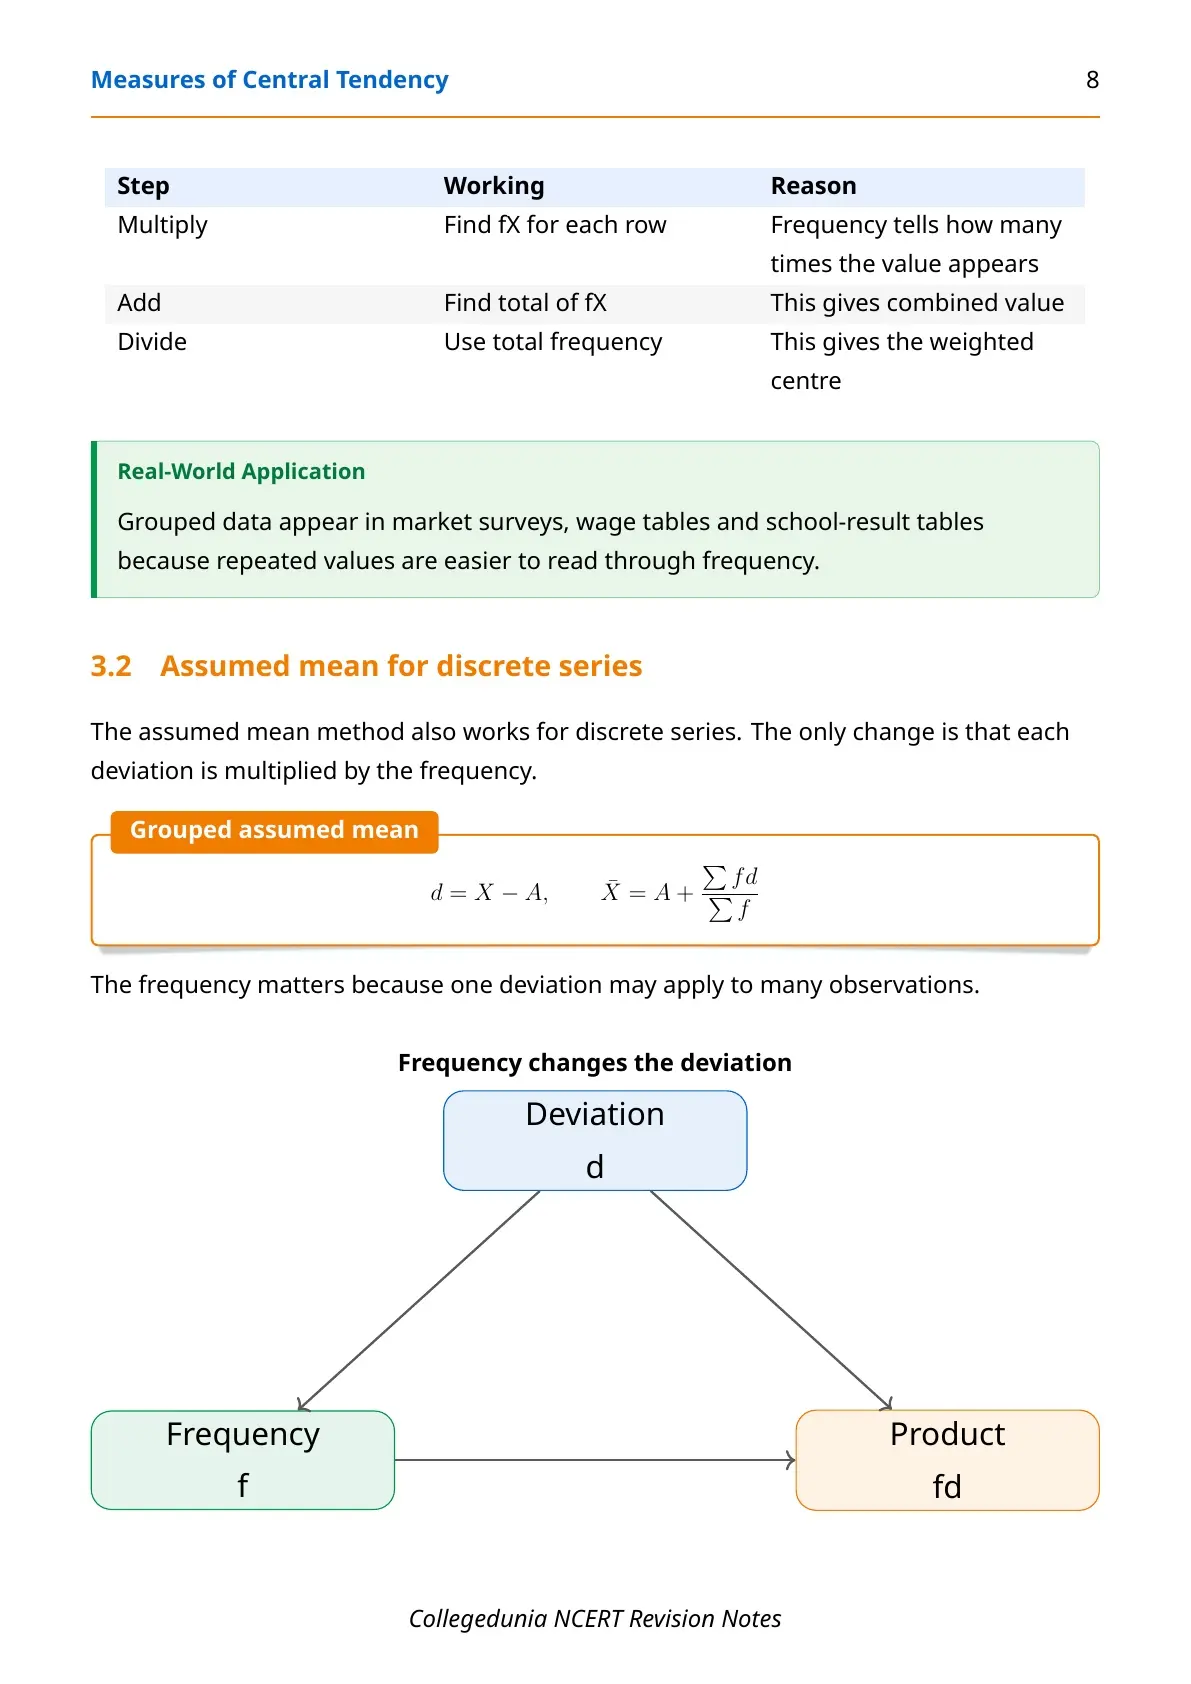
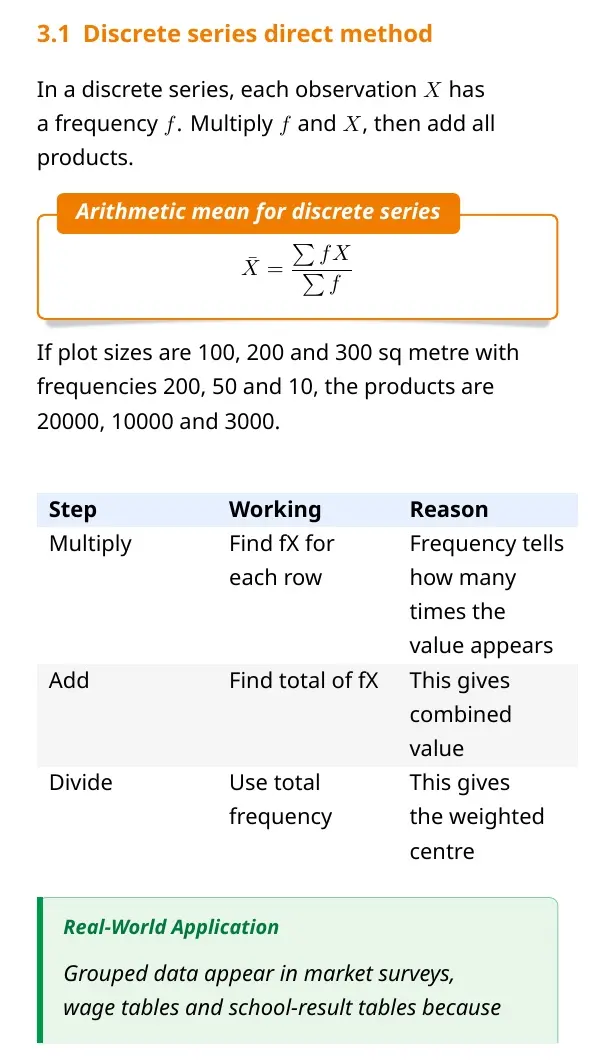
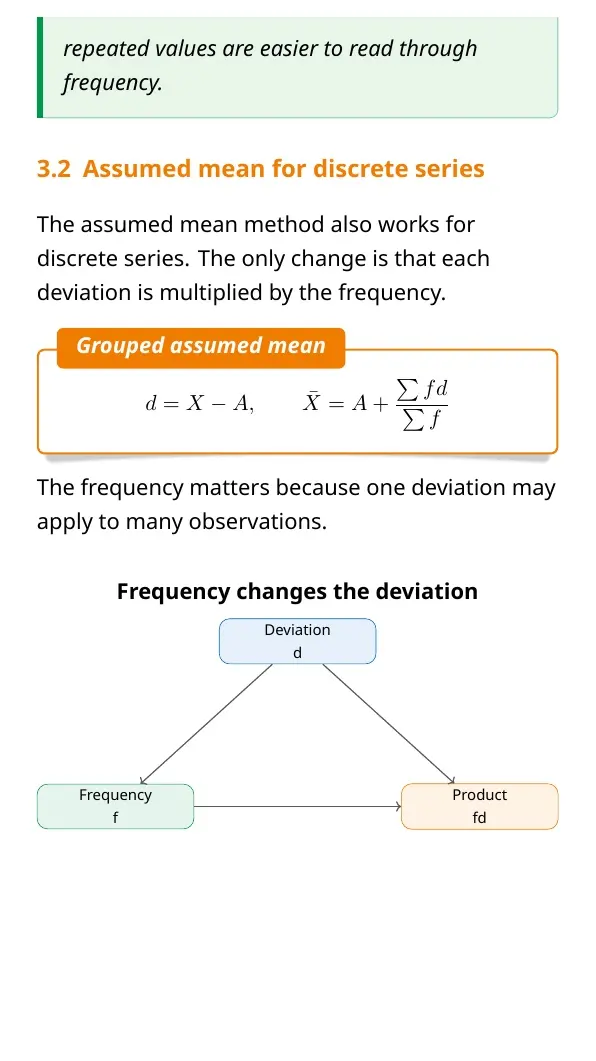
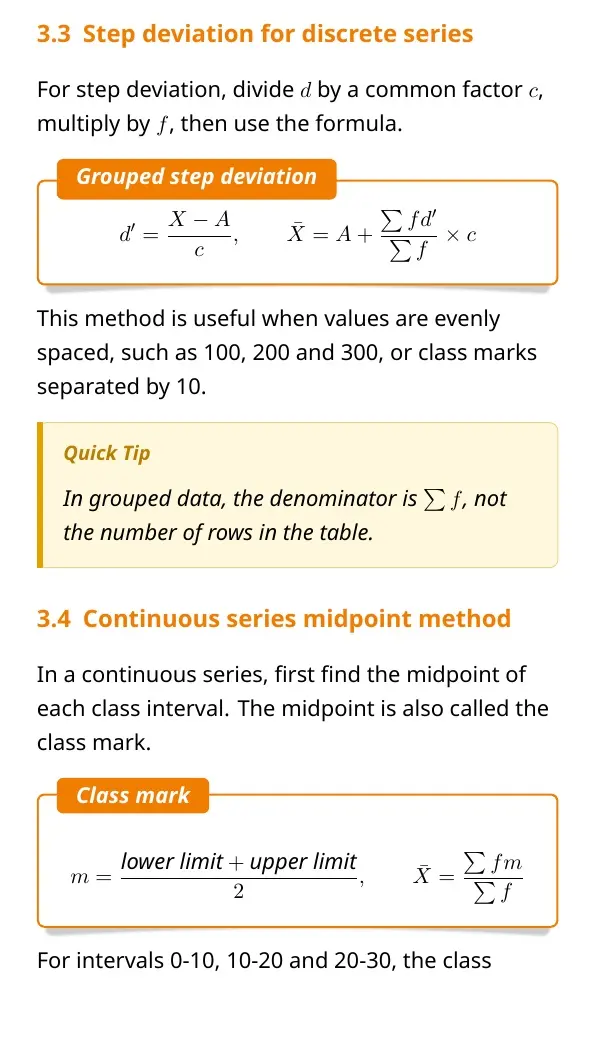
- Discrete series: multiply every value by its frequency, then divide by total frequency.
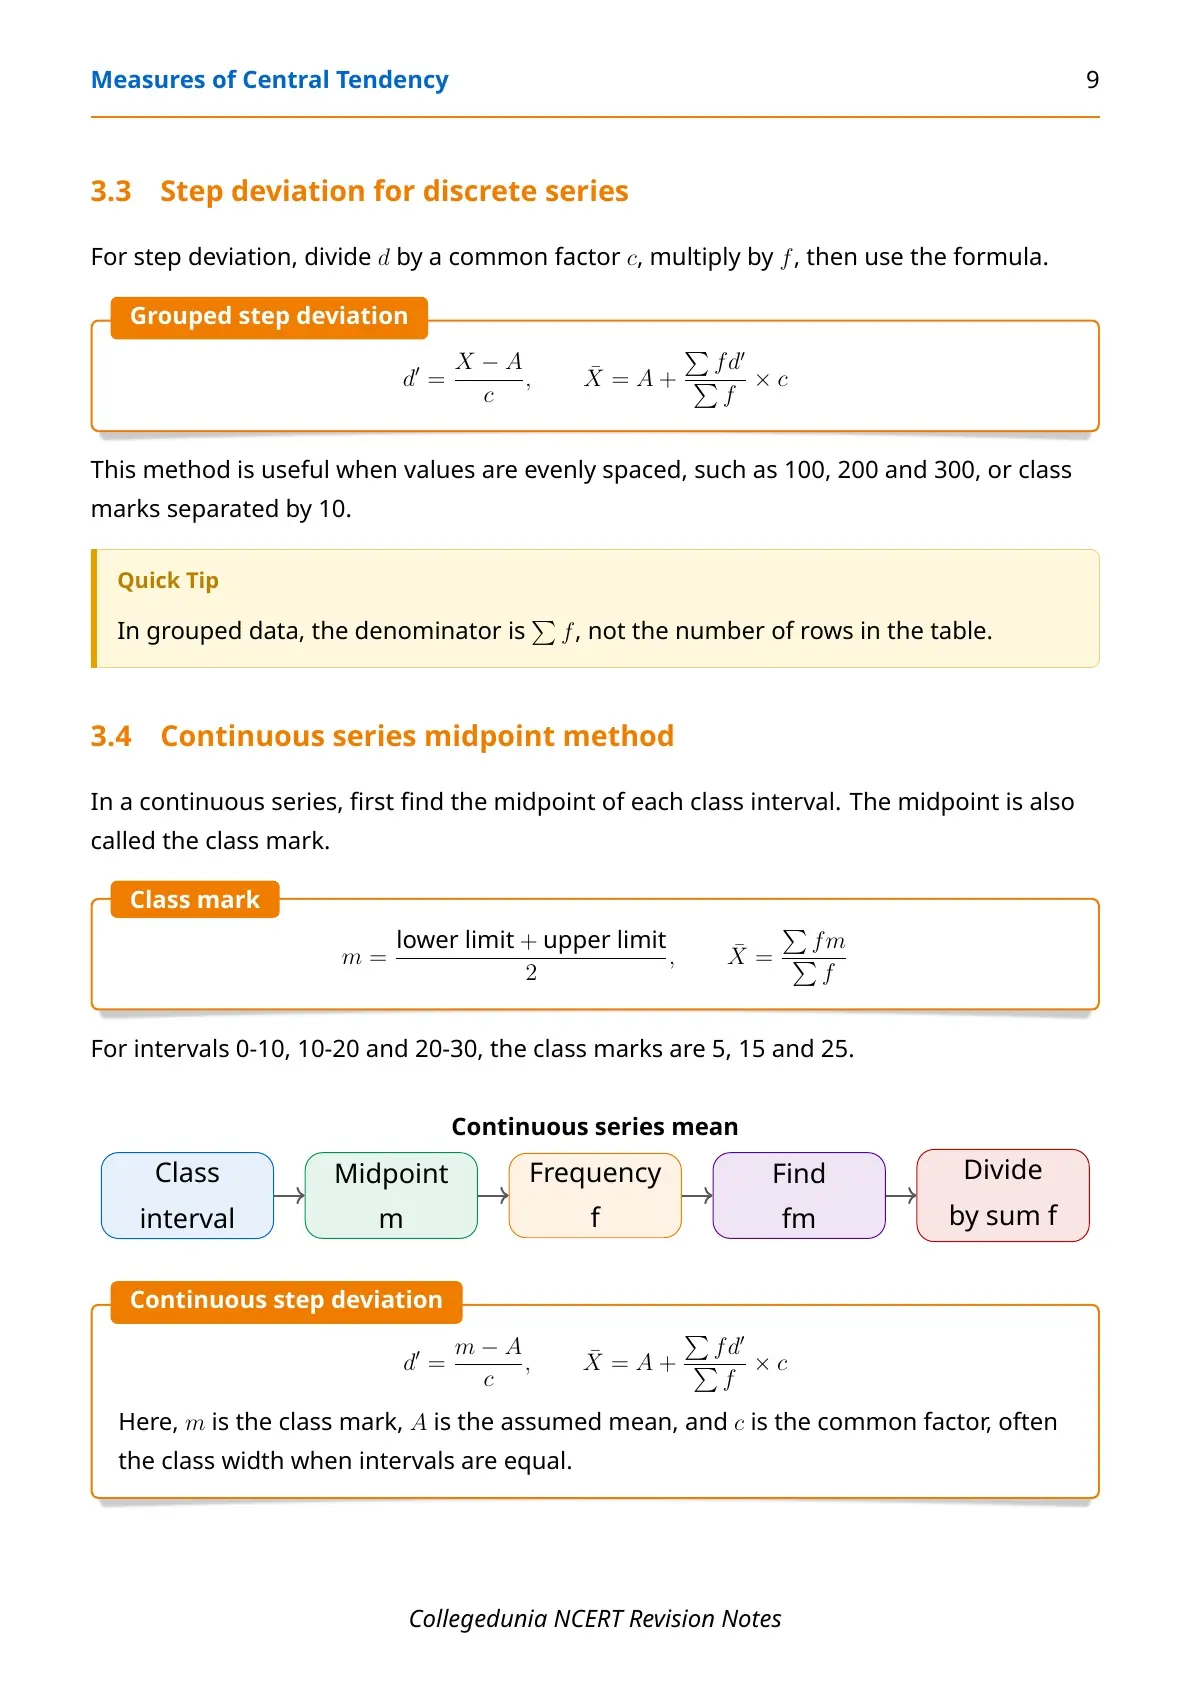
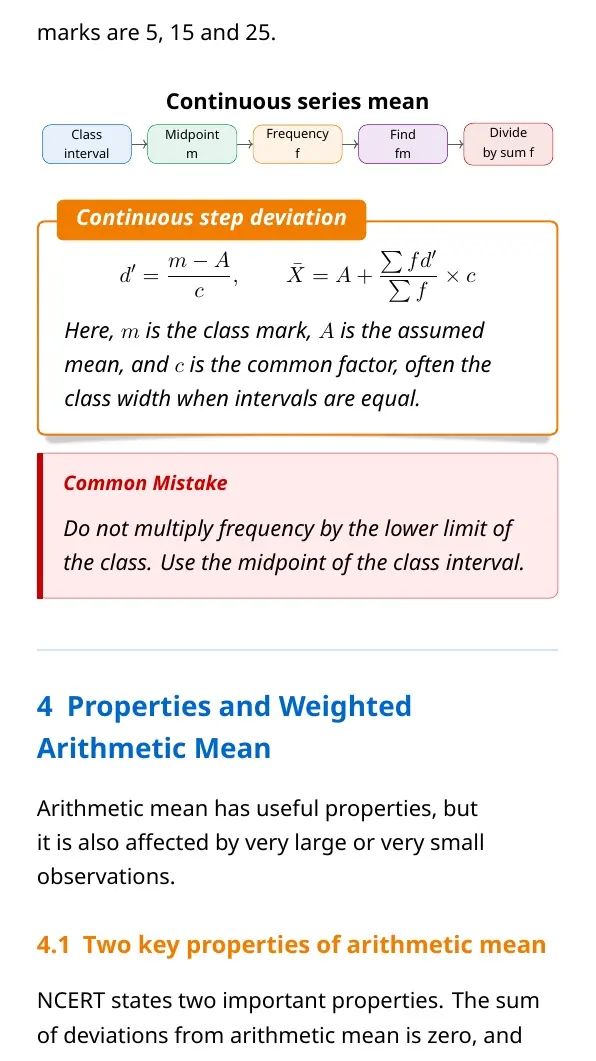
- Continuous series: use the class midpoint as the representative value.
Direct Method, Assumed Mean Method and Step Deviation
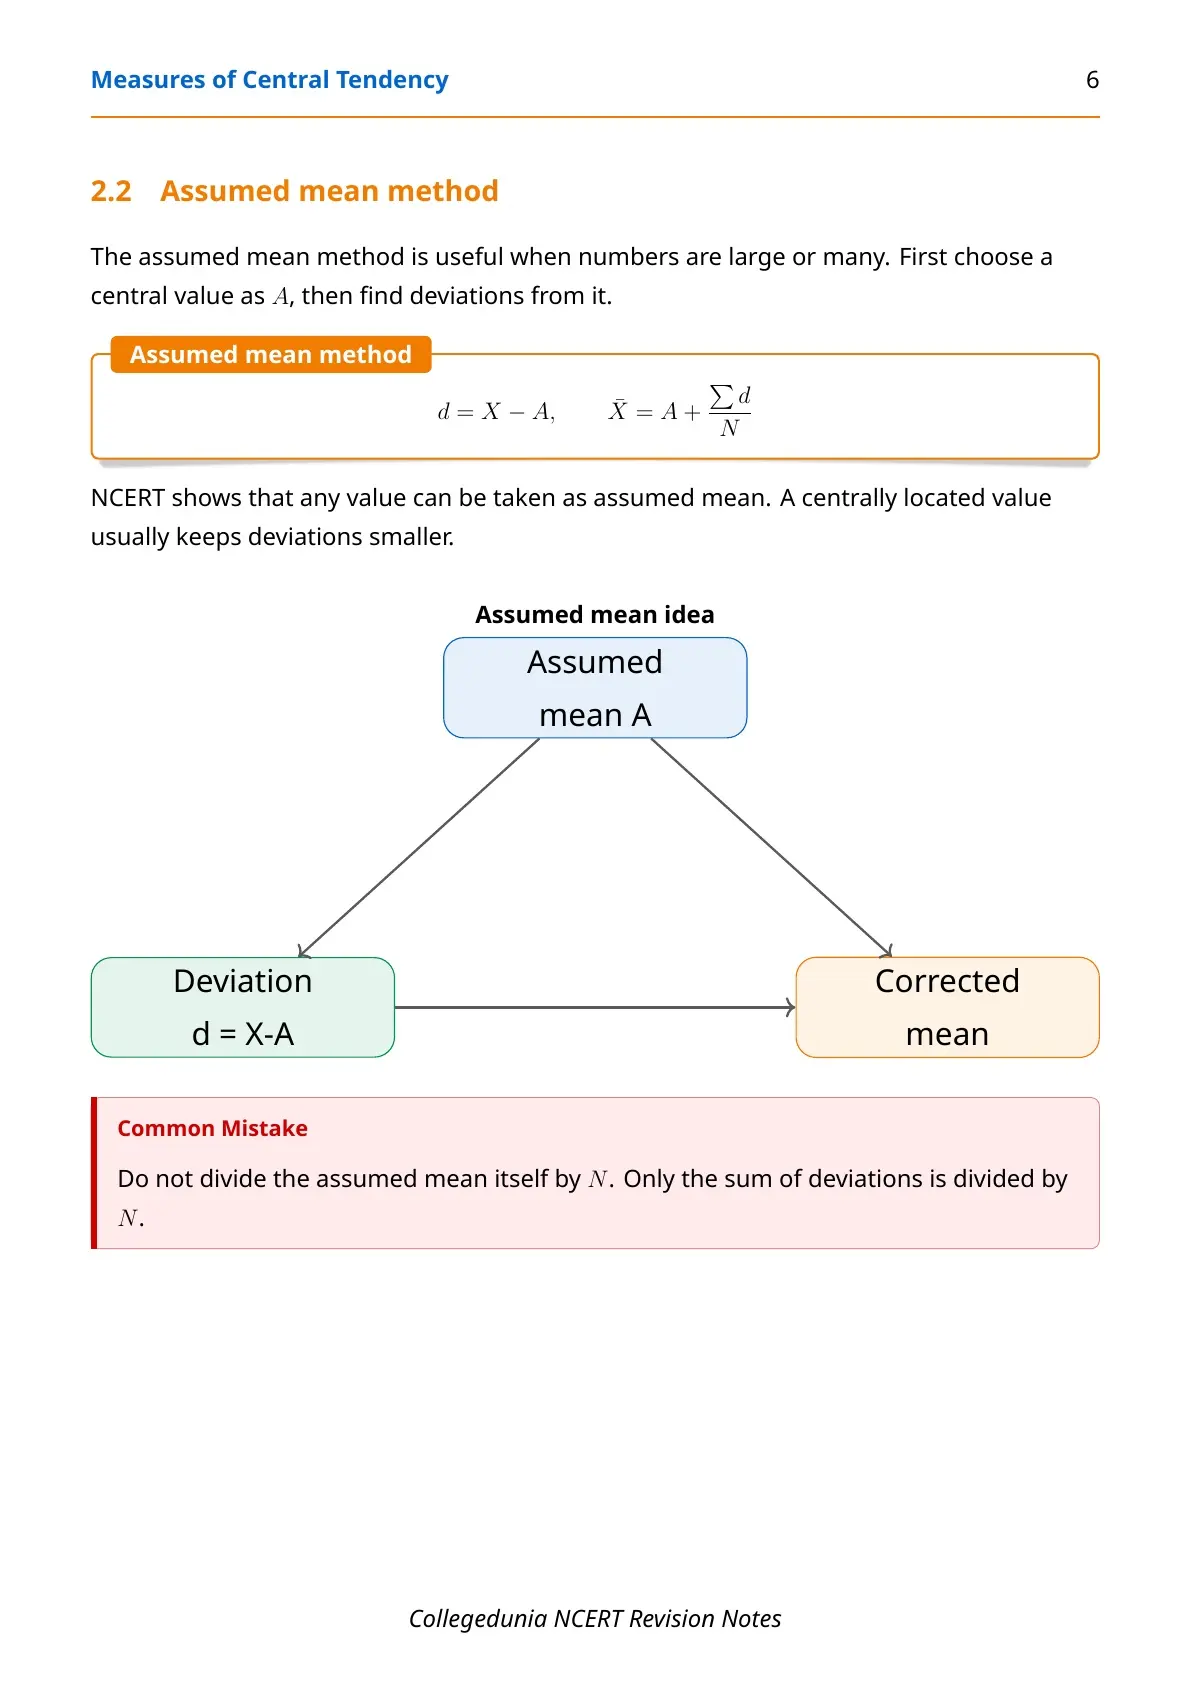
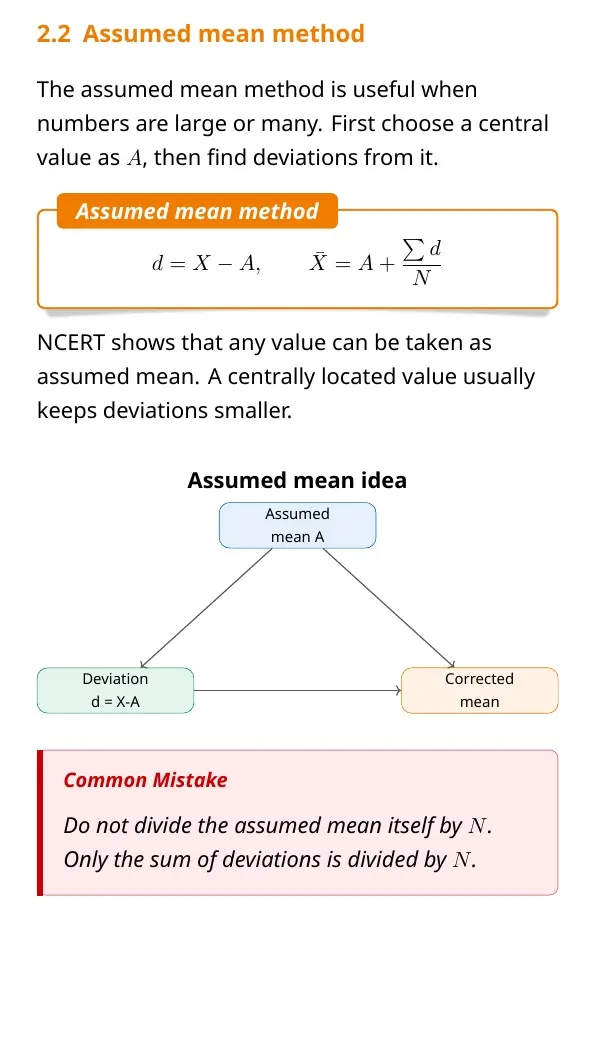
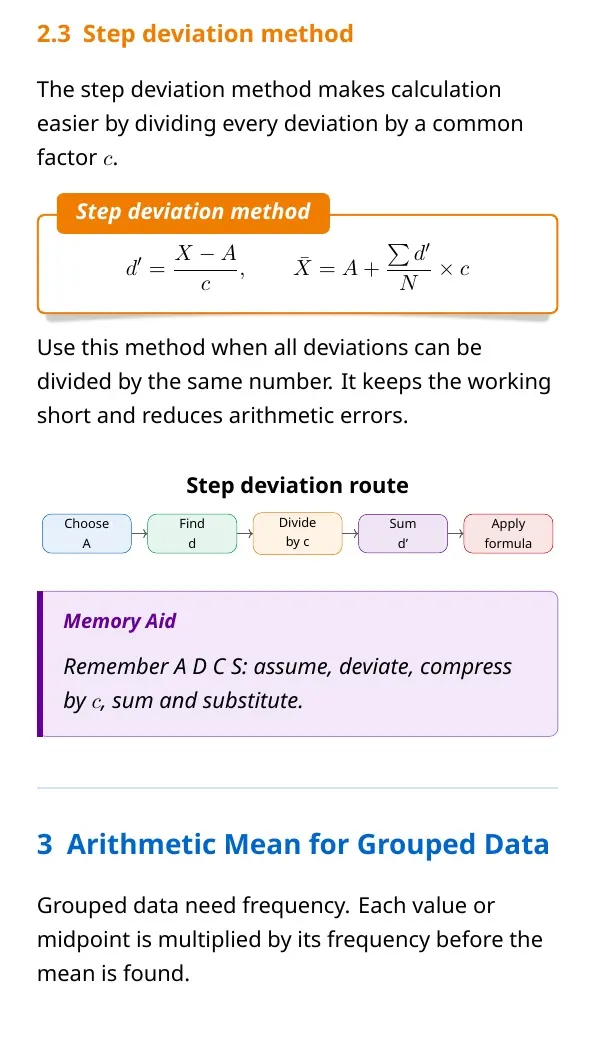
The same mean can be calculated by different methods. The direct method is easiest for small numbers, while assumed mean and step deviation reduce lengthy arithmetic in grouped data.
| Method | When to use | Key action |
|---|---|---|
| Direct method | Values are small and manageable | Find fx and divide by N |
| Assumed mean | Values are large | Take deviations from a convenient A |
| Step deviation | Class intervals are equal | Divide deviations by common interval |
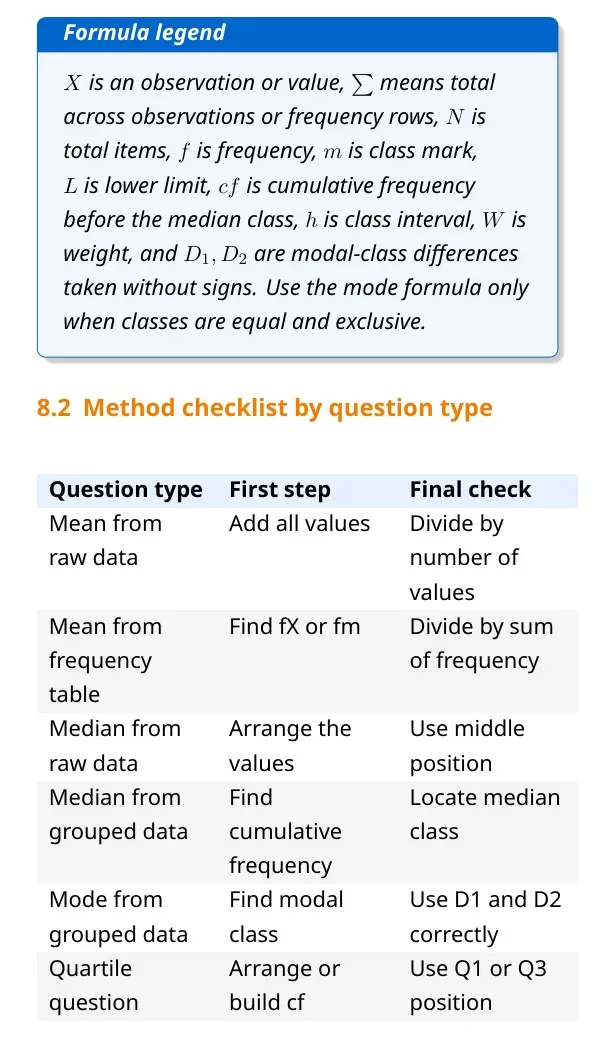
NCERT uses the same representative midpoint for each class interval before applying any grouped mean method.
Measures of Central Tendency Explained for Class 11
Source: Magnet Brains on YouTube
Median and Positional Averages
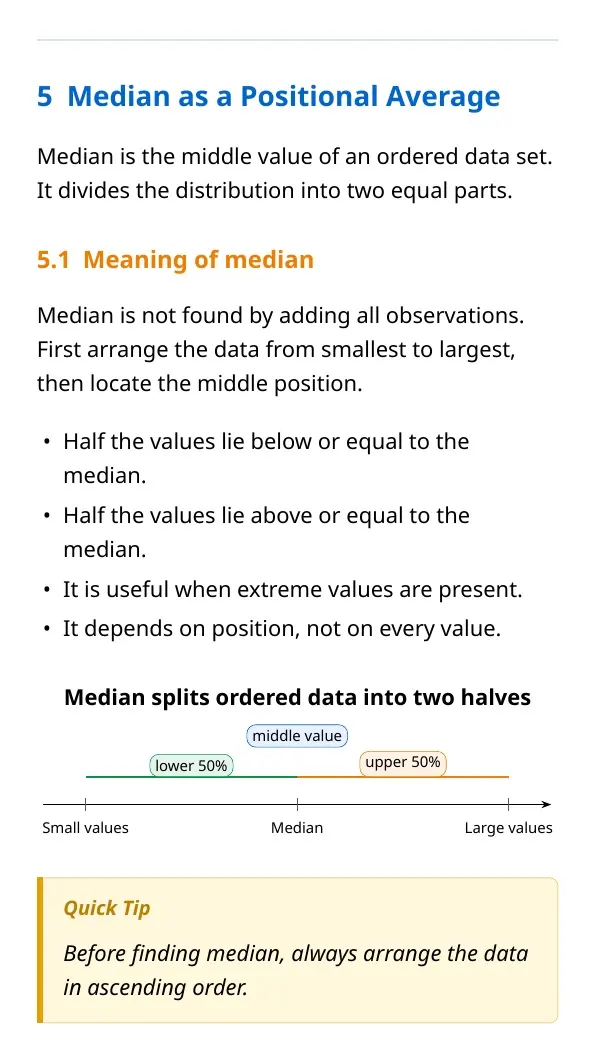
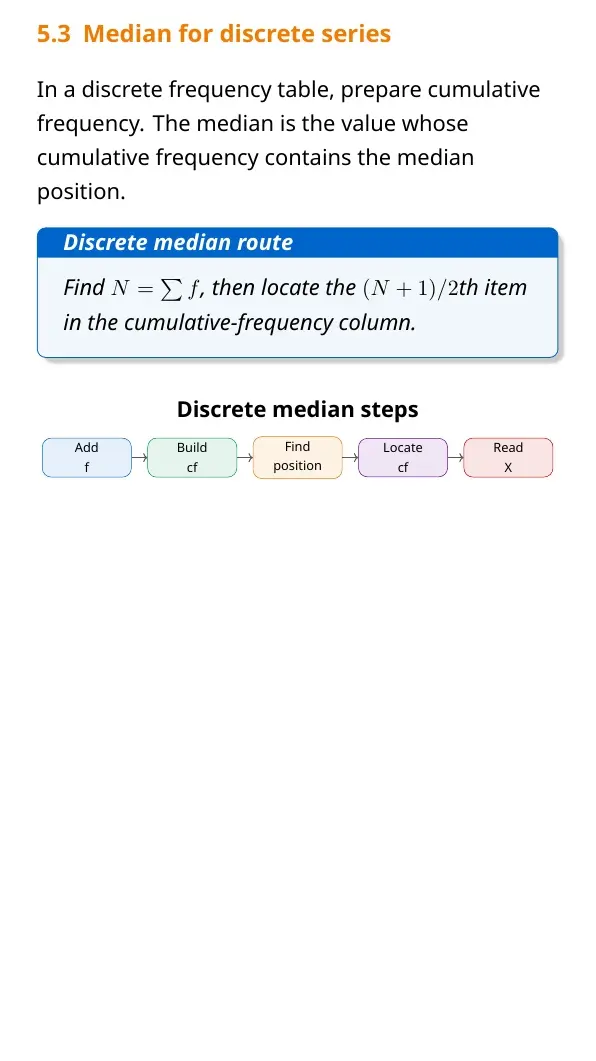
Median is a positional average. It is found after arranging observations in ascending or descending order, so it is less affected by unusually high or low values.
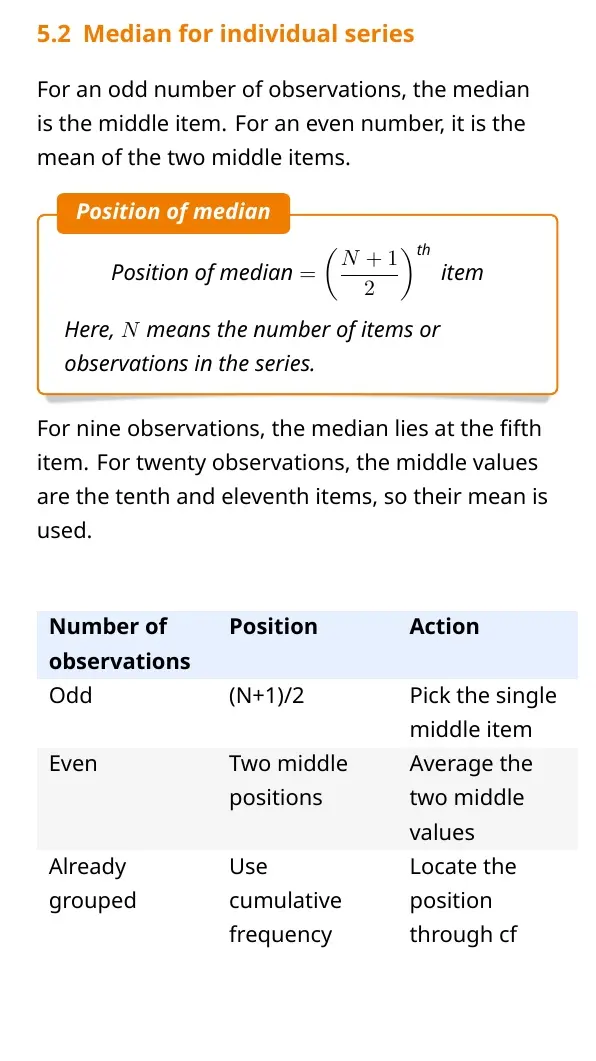
- For odd number of observations, median is the middle item.
- For even number of observations, median is the average of the two middle items.
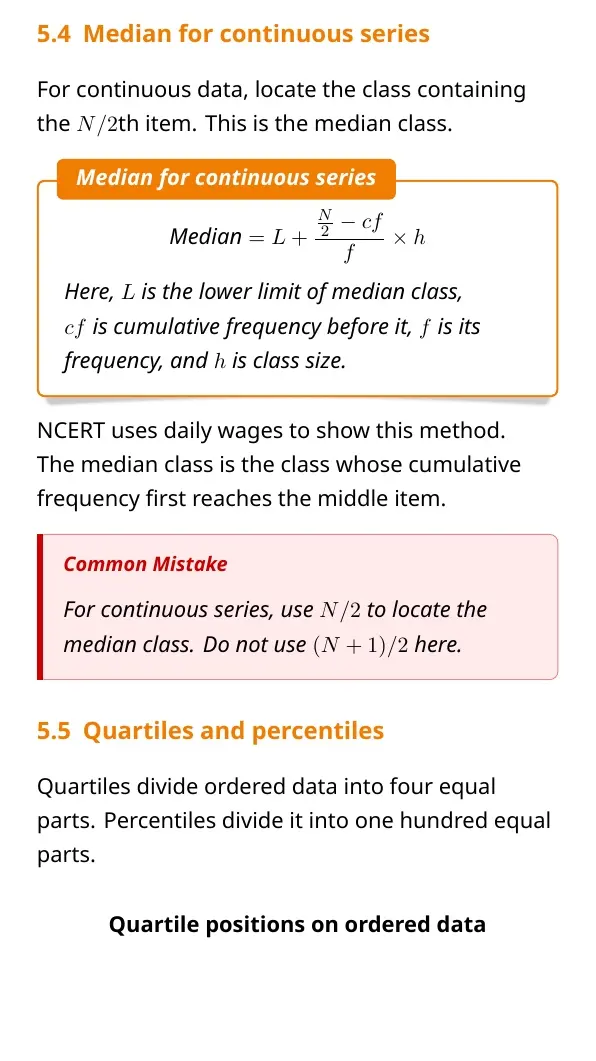
- For continuous series, first find N/2, then identify the median class using cumulative frequency.
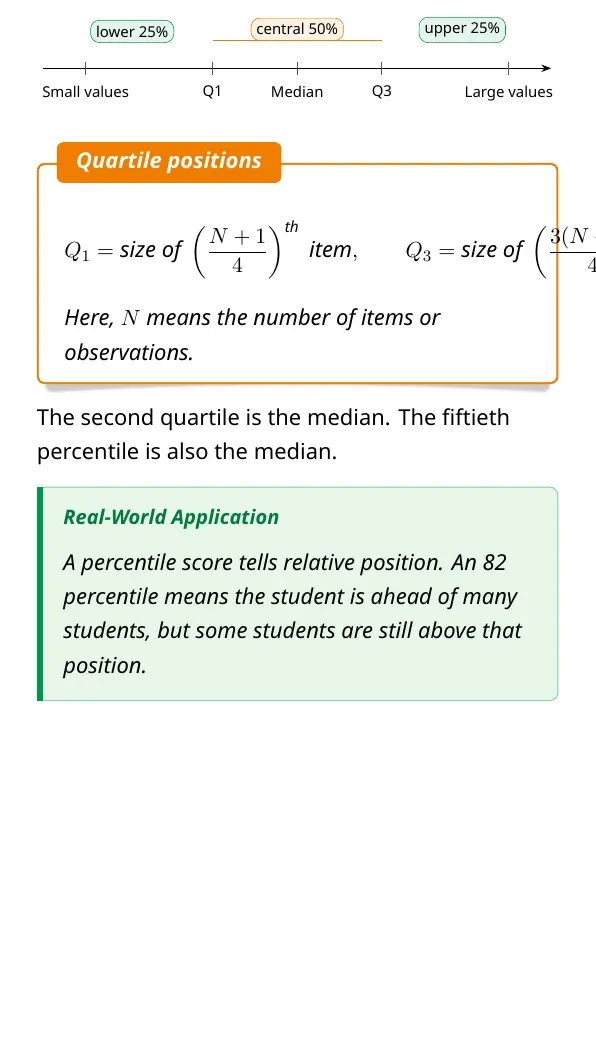
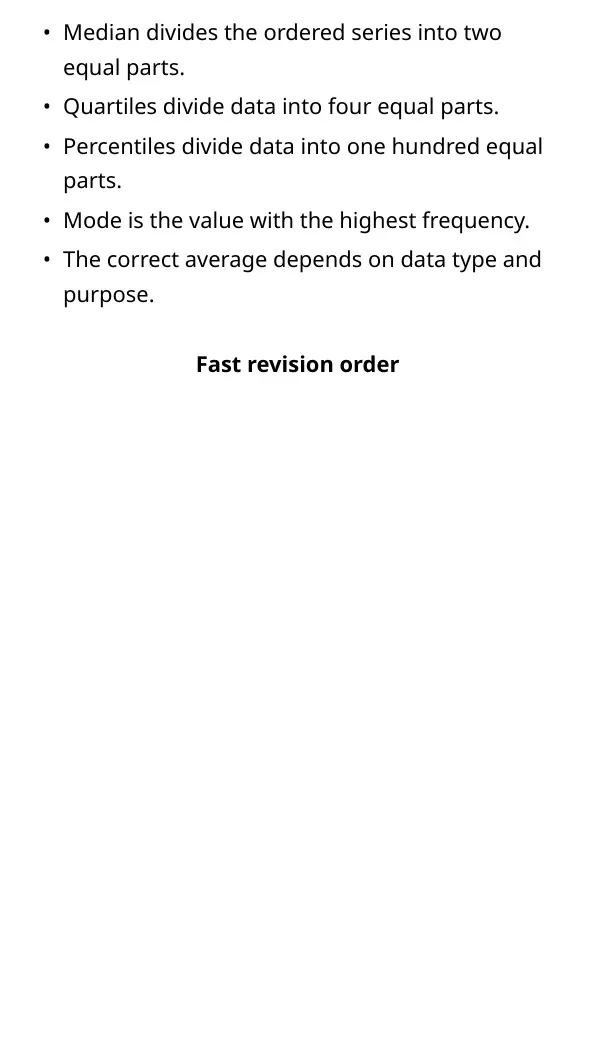
Quartiles and percentiles extend the same idea. Quartiles divide data into four equal parts, while percentiles divide data into hundred equal parts.
Mode and the Most Frequent Value
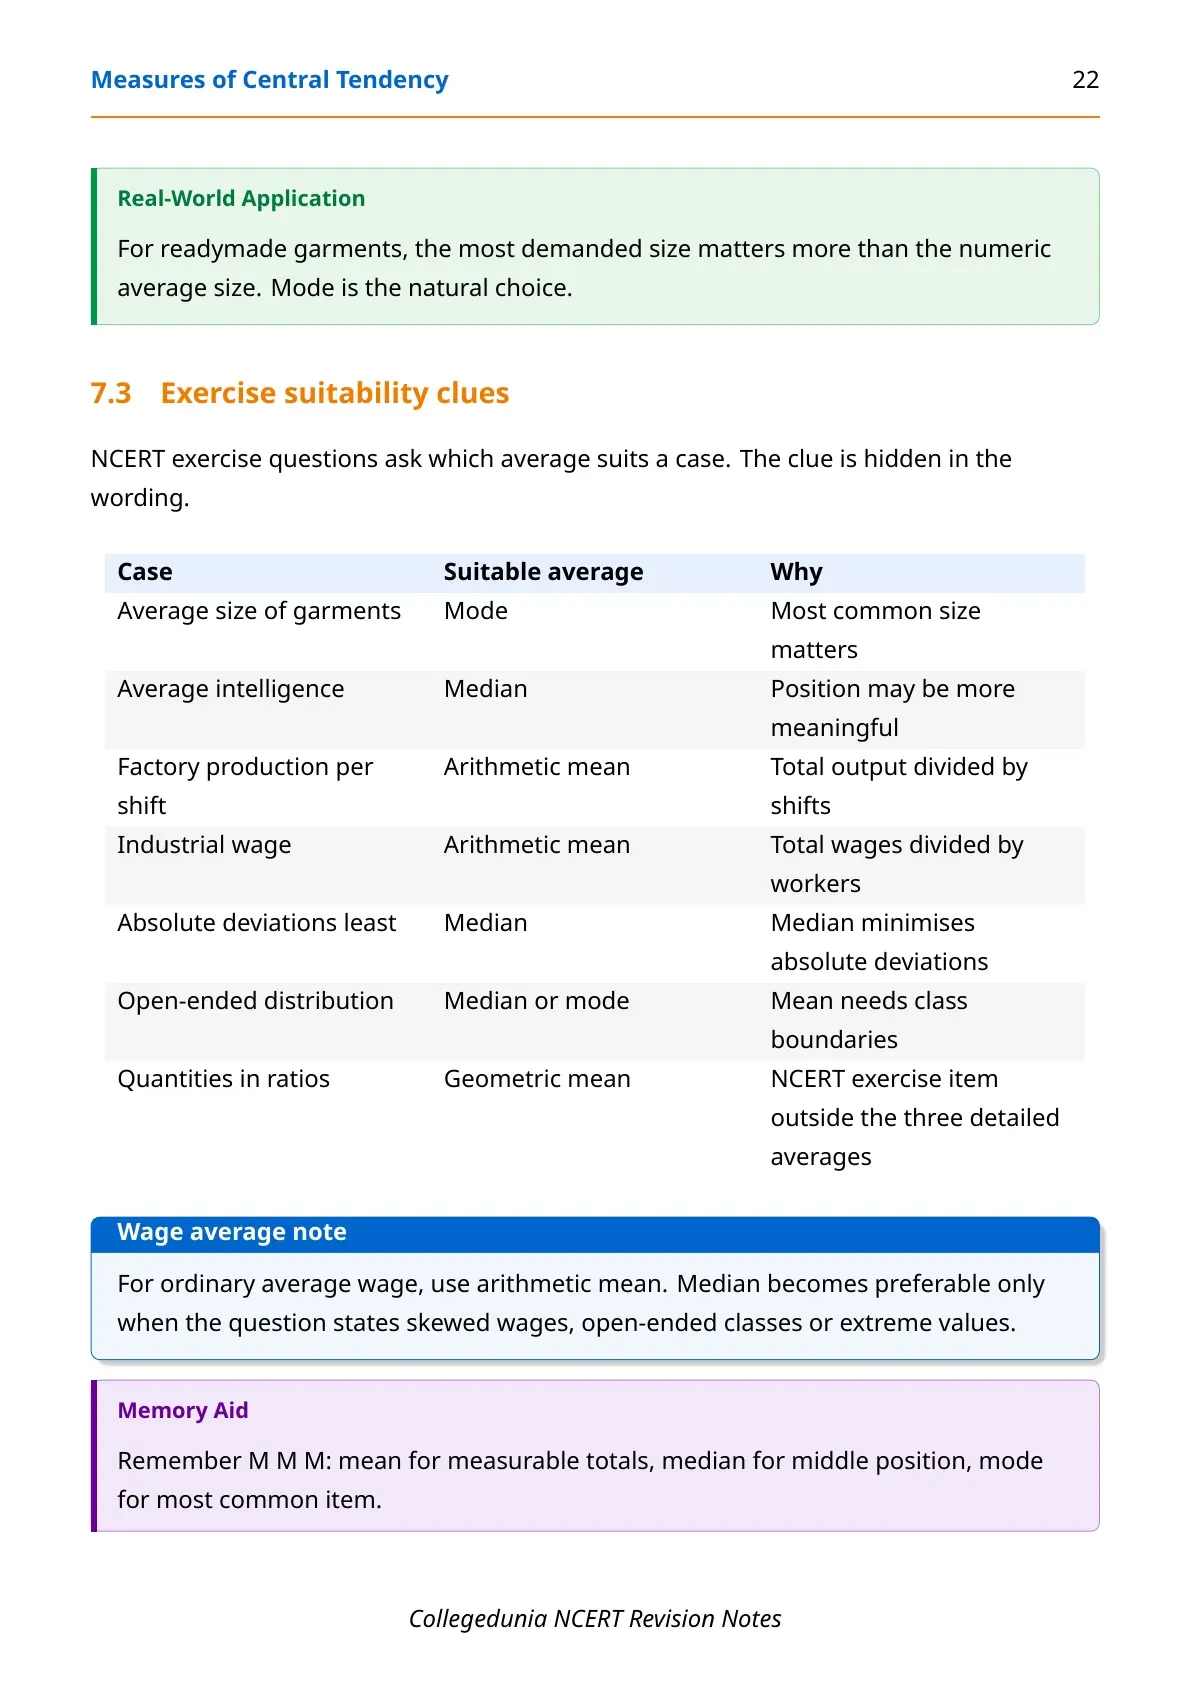
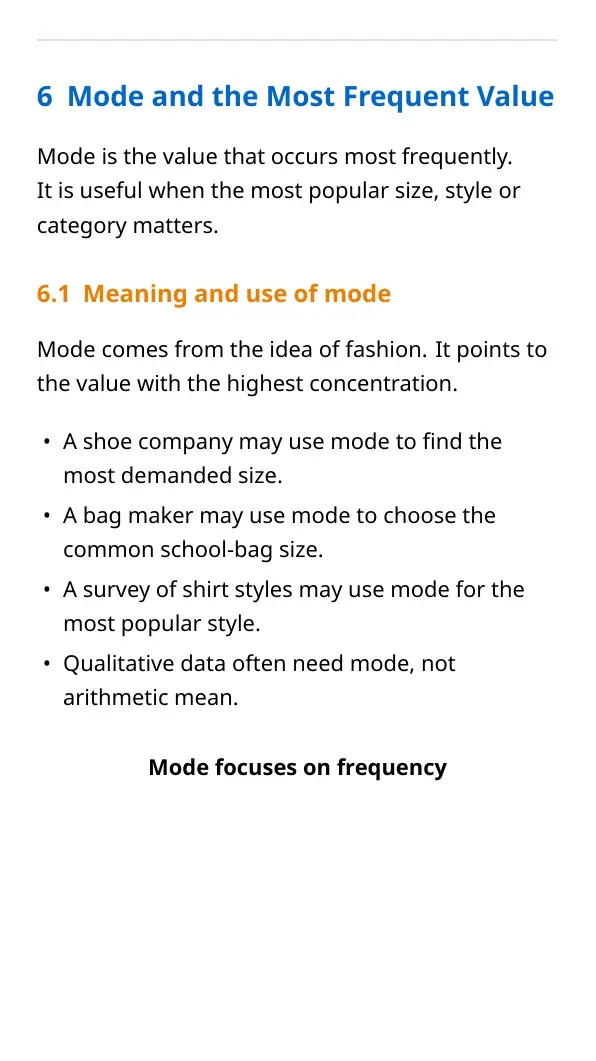
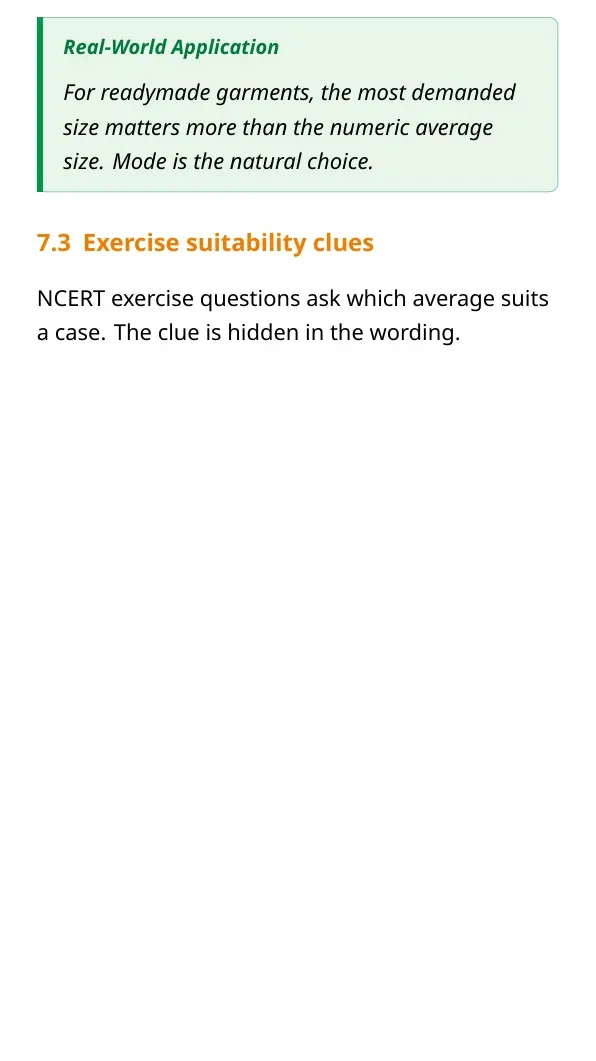
Mode is the value that occurs most often. It is useful when students need the most popular size, most common choice or highest-frequency class.

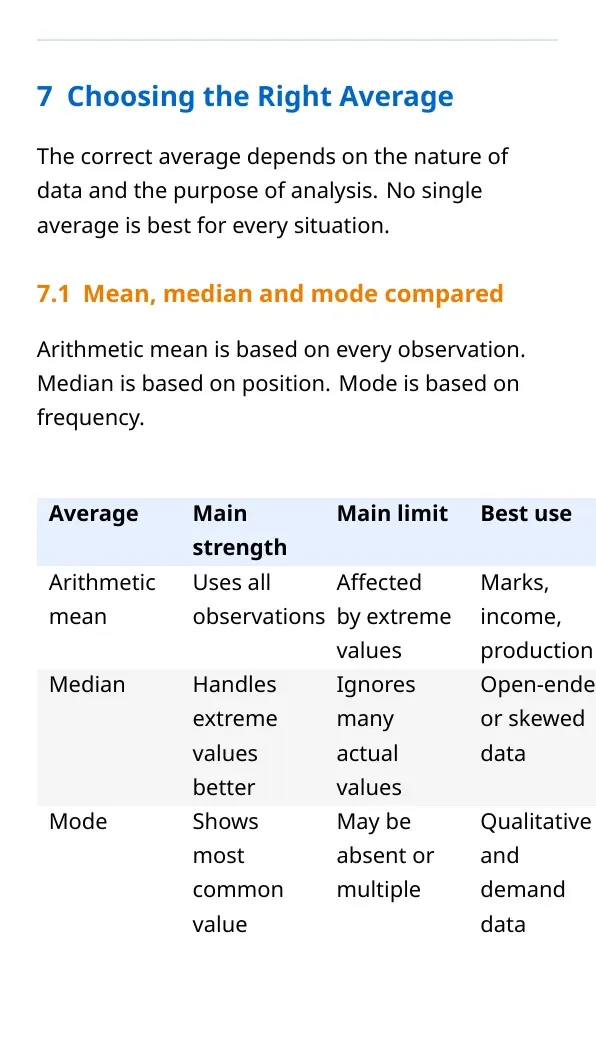
| Point | Median | Mode |
|---|---|---|
| Basis | Middle position | Highest frequency |
| Data arrangement | Must be arranged | Frequency is checked |
| Extreme values | Less affected | Usually less affected |
| Best use | Income, wages, open-ended data | Common size, demand, preference |
How to Choose Mean, Median or Mode
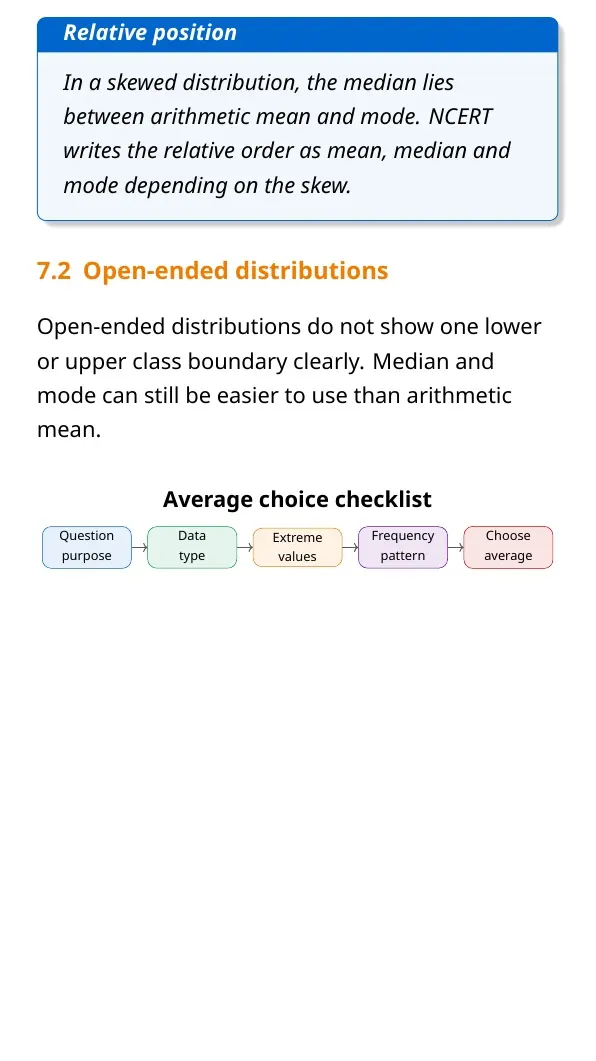
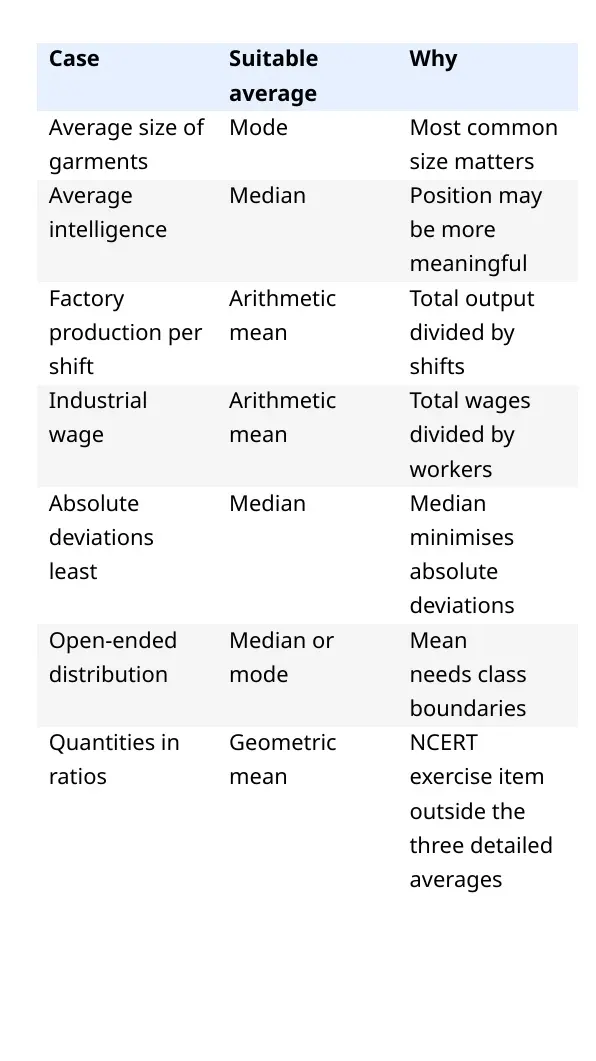
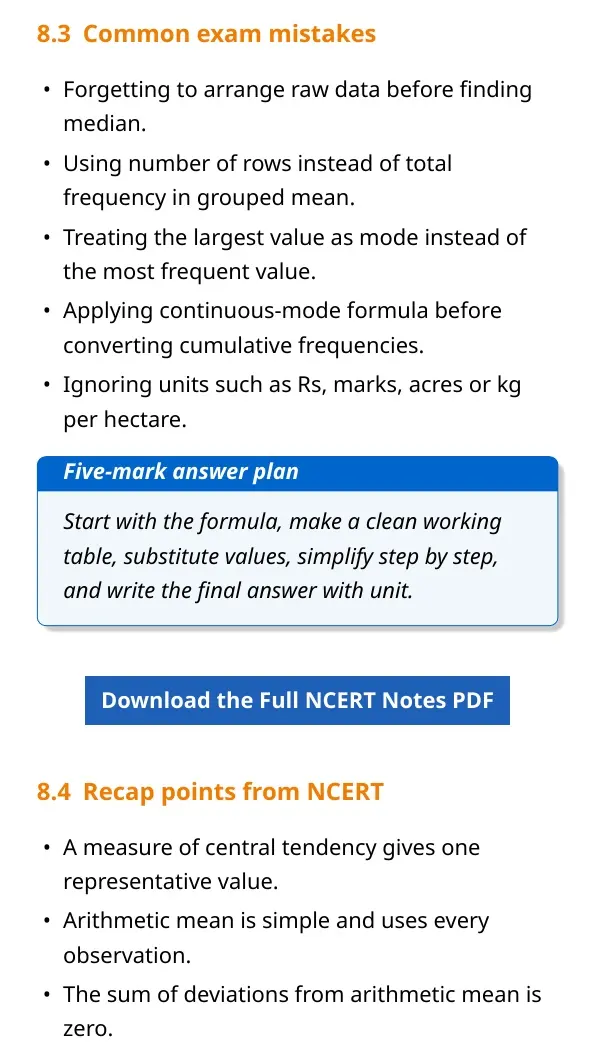
The best average depends on the purpose of the study and the nature of the data. Students should not pick a formula mechanically.
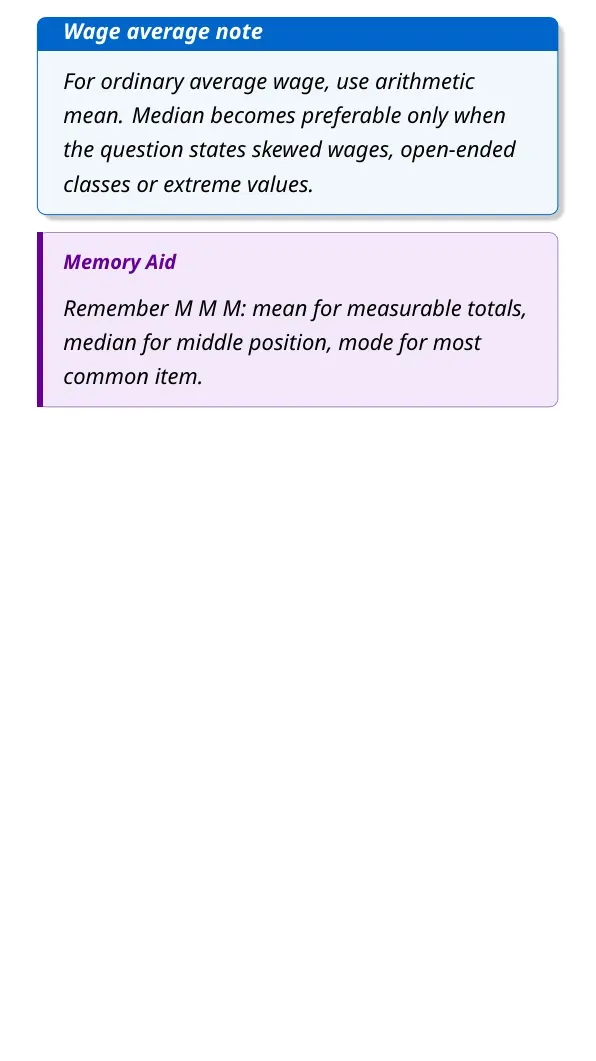
- Use mean when all observations are important and no extreme value dominates.
- Use median when the distribution has extreme values or open-ended classes.
- Use mode when the most common item is the answer needed.
- Use weighted mean when observations have unequal importance.
Download Measures of Central Tendency Class 11 Economics Notes PDF
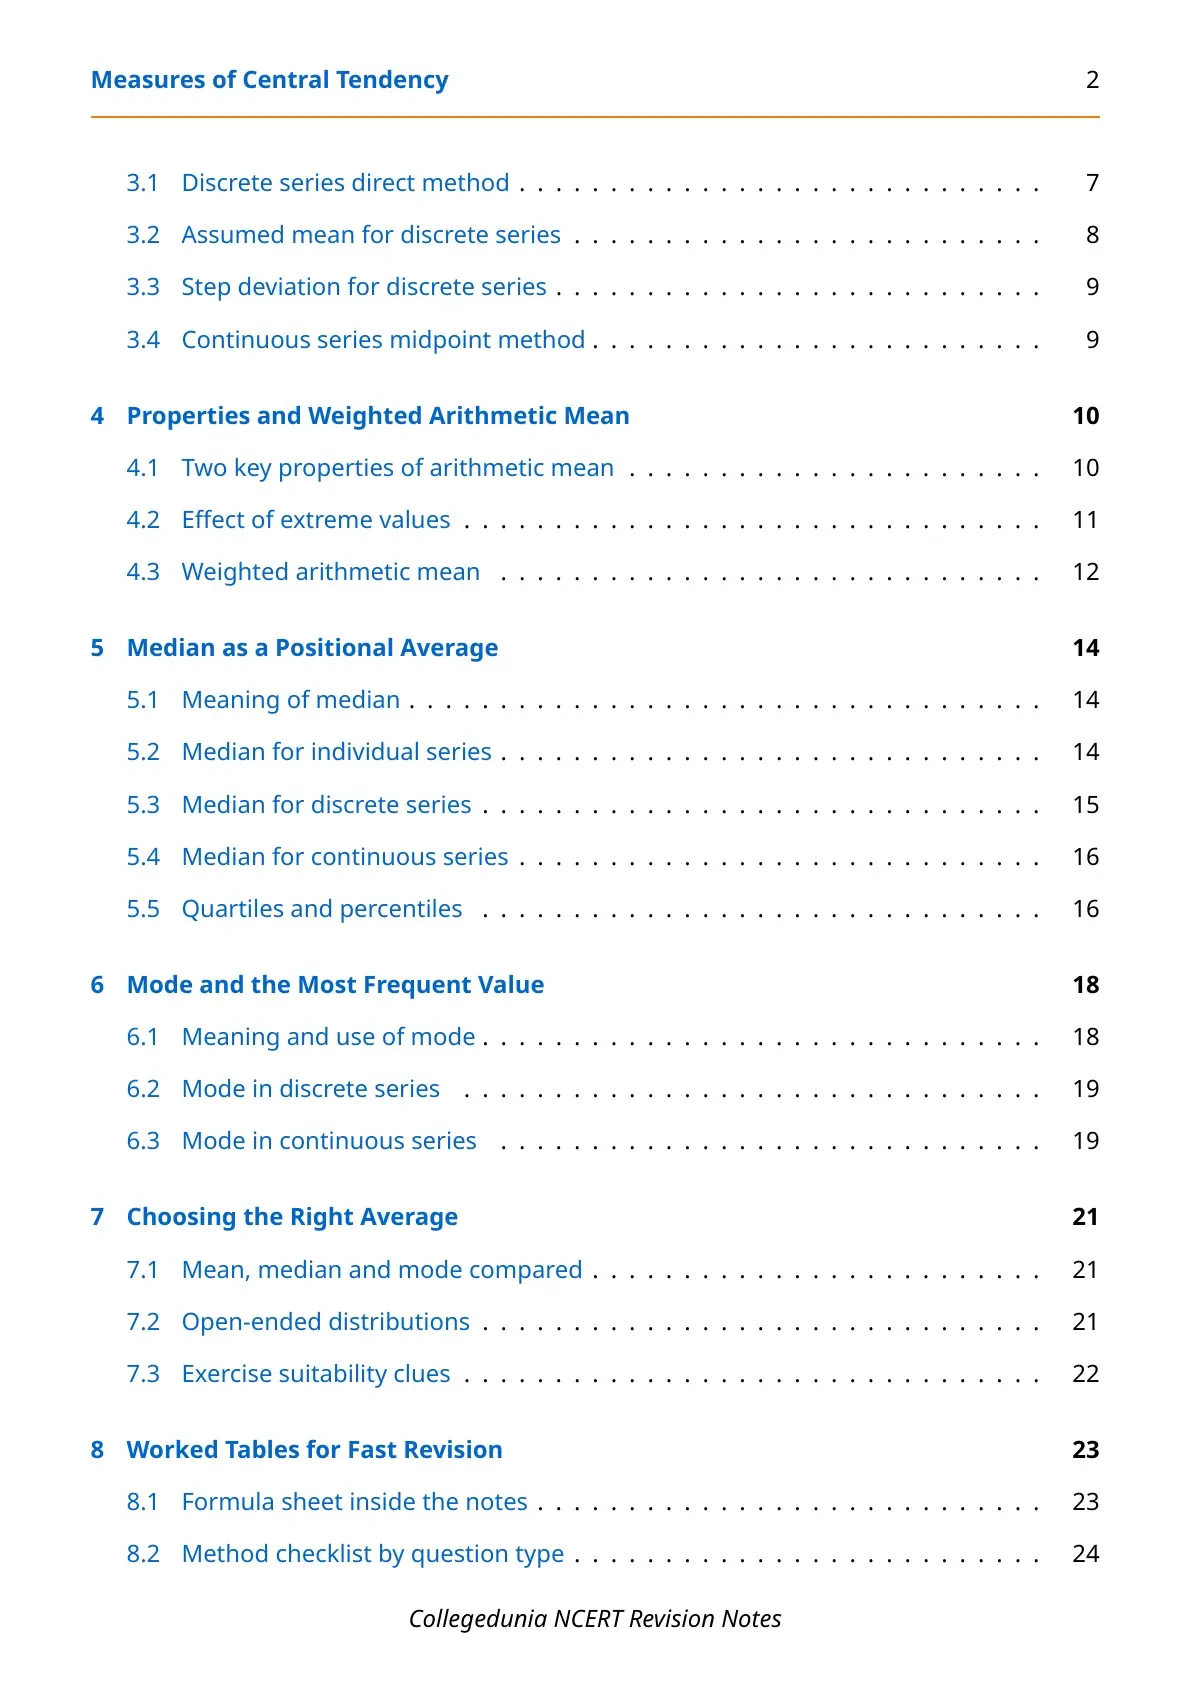
The PDF above gives a full revision set for Measures of Central Tendency. It covers average choice, mean methods, weighted mean, median, quartiles, percentiles and mode with worked tables.
| Revision pass | What to revise | Target |
|---|---|---|
| Pass 1 | Definitions and formula list | Basic recall |
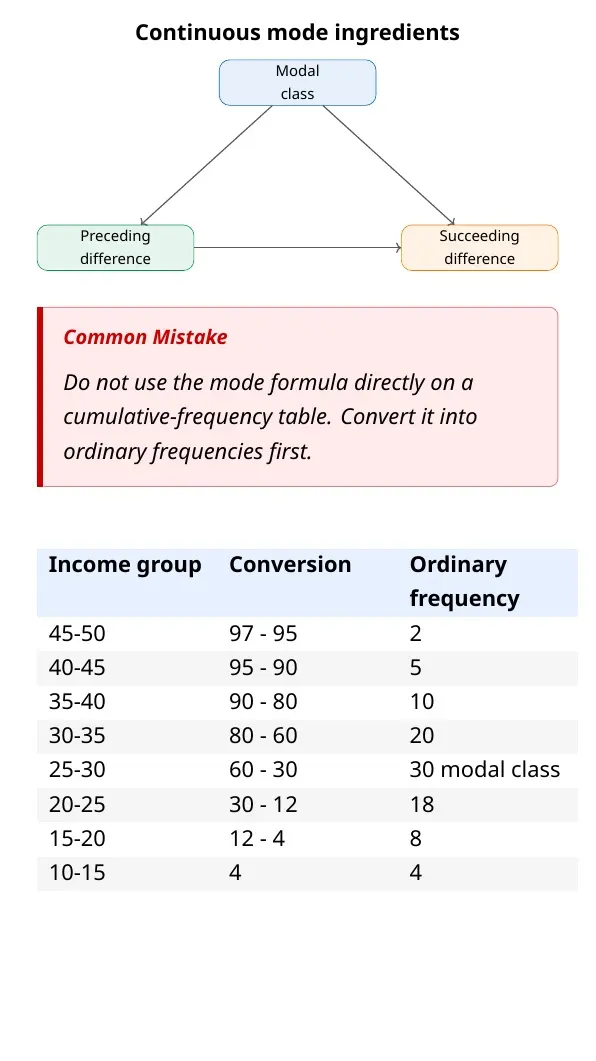
| Pass 2 | Grouped mean, median and mode tables | Numerical accuracy |
| Pass 3 | Choice of suitable average | Reason-based answers |
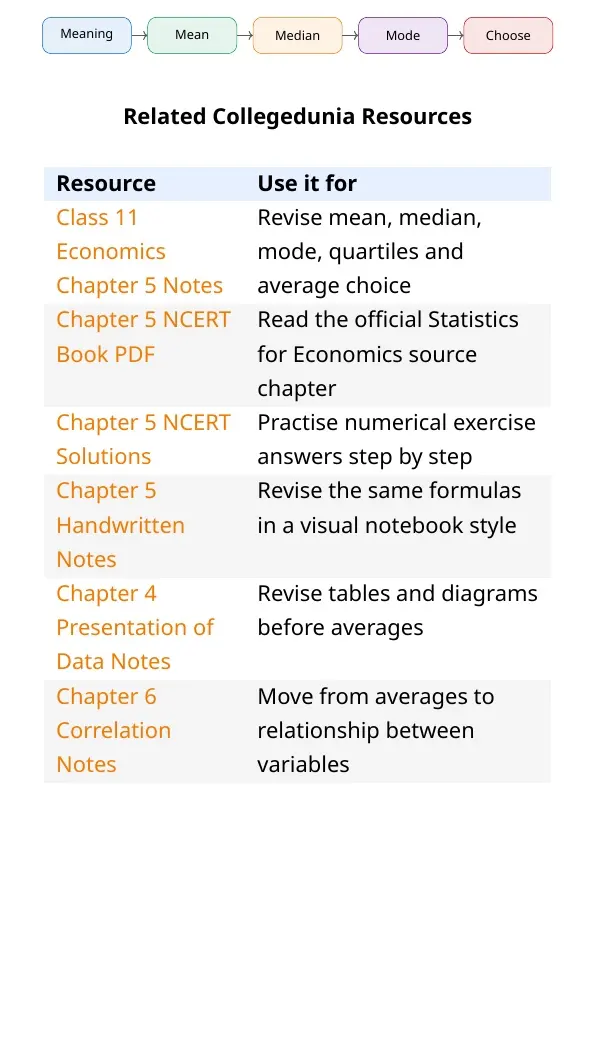
Related Class 11 Economics Resources for Measures of Central Tendency
Also Check: use these links when you need the same chapter in another format.
| Resource | Best used for | Link |
|---|---|---|
| NCERT Book PDF | Official chapter wording and examples | Measures of Central Tendency NCERT Book PDF |
| NCERT Solutions | Answers to textbook exercises | Measures of Central Tendency NCERT Solutions |
| Handwritten Notes | Fast visual revision before tests | Measures of Central Tendency Handwritten Notes |
Class 11 Economics Notes for All Chapters
| Chapter | Notes Link |
|---|---|
| Chapter 1 | Introduction Notes |
| Chapter 2 | Collection of Data Notes |
| Chapter 3 | Organisation of Data Notes |
| Chapter 4 | Presentation of Data Notes |
| Chapter 5 | You are here |
| Chapter 6 | Correlation Notes |
Measures of Central Tendency Class 11 Economics Notes FAQs
Ques. What is covered in Class 11 Economics Chapter 5 Measures of Central Tendency notes?
Ans. The notes cover arithmetic mean, assumed mean, step deviation, weighted mean, median, quartiles, percentiles, mode and rules for choosing a suitable average.
Ques. What is arithmetic mean in Measures of Central Tendency?
Ans. Arithmetic mean is the sum of all observations divided by the number of observations. In grouped data, each value or midpoint is multiplied by its frequency first.
Ques. When should median be used instead of mean?
Ans. Median is preferred when the data have extreme values, unequal spread or open-ended classes because it depends on position rather than every value.
Ques. What is mode in Class 11 Economics?
Ans. Mode is the value or class that occurs most frequently. It is useful for finding the most common size, demand level or preference in a data set.



Comments