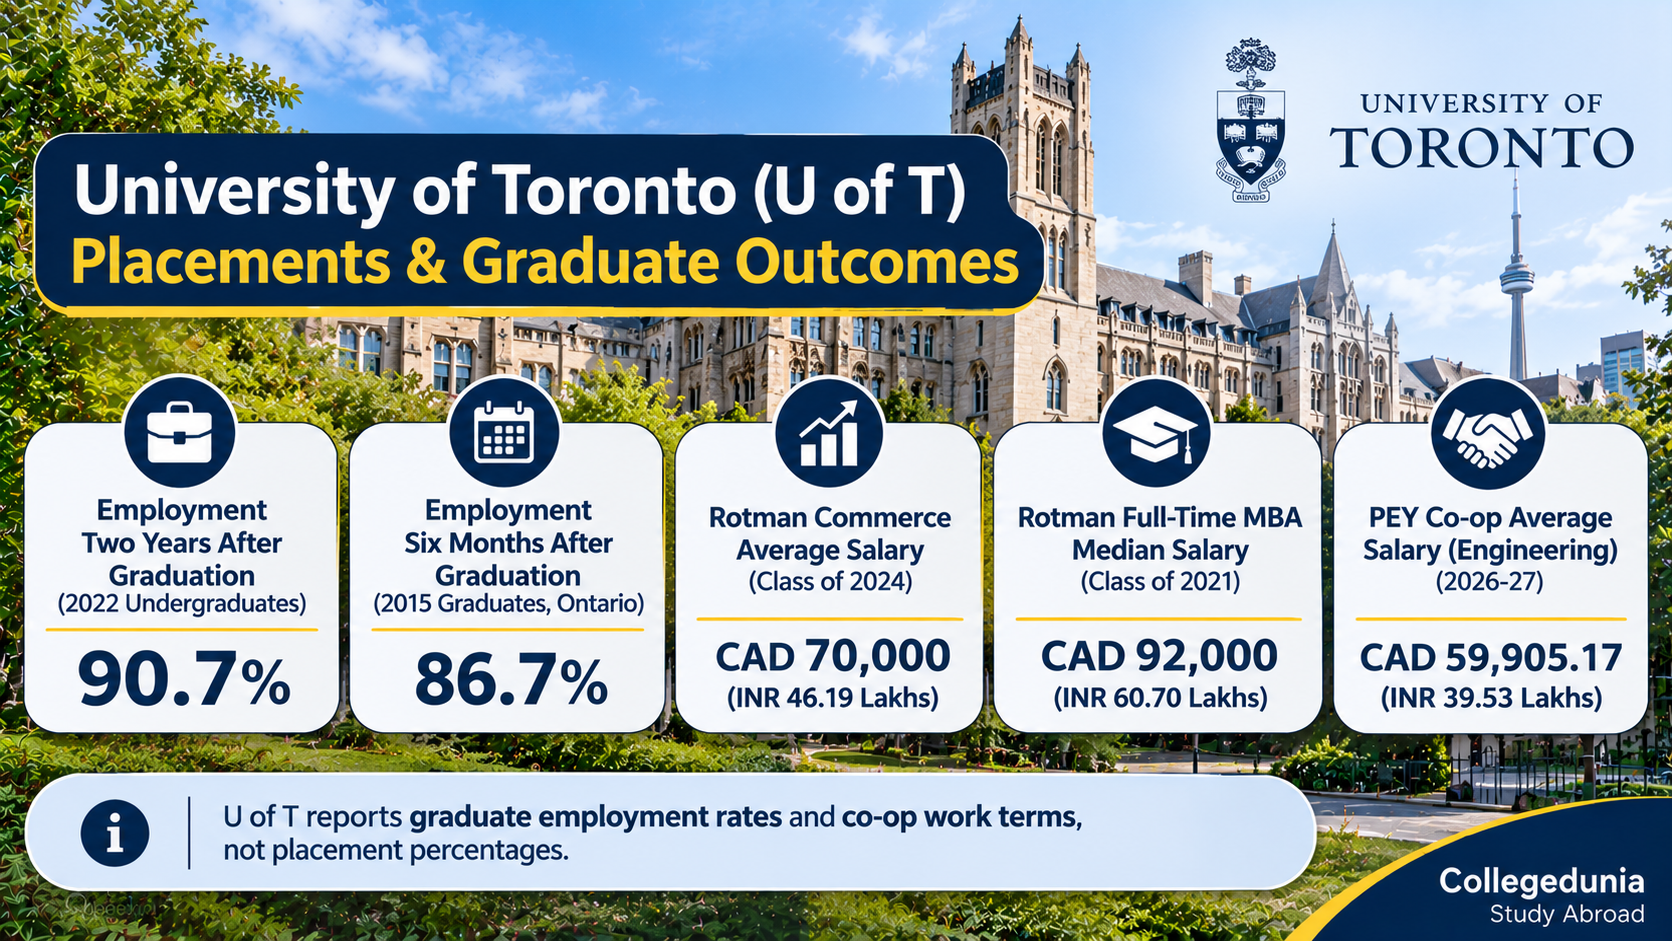
University of Toronto (U of T) placements data comes from graduate surveys, not from a campus recruitment drive. 90.7 per cent of U of T undergraduates who graduated in 2022 were employed two years after graduation, according to the university's Performance Indicators Report 2025. U of T is a public university in Toronto, Ontario, Canada, with campuses in downtown Toronto, Mississauga and Scarborough.
- Employment two years after graduation (2022 undergraduate graduates): 90.7 per cent
- Employment six months after graduation (2015 graduates, Ontario KPI survey): 86.7 per cent
- Rotman Commerce average base salary (class of 2024): CAD 70,000 (INR 46.19 Lakhs)
- Rotman Full-Time MBA median base salary (class of 2021): CAD 92,000 (INR 60.70 Lakhs)
- PEY Co-op average annual salary, all engineering (2026-27 work terms): CAD 59,905.17 (INR 39.53 Lakhs)
The university reports graduate employment rates and co-op work terms, not placement percentages. The figures below come from U of T's own performance reports and from the Ontario Key Performance Indicator survey as U of T publishes it. The Rotman Commerce and Rotman Full-Time MBA employment reports and the engineering PEY Co-op pages supply the rest.
Currency Note: All INR figures used in the article use CAD 1 = INR 65.98 on 13 November 2026. Rates move daily, so treat INR values as indicative.
![]()
Also Check: University of Toronto Admission 2027 for Indian Students
U of T Placements and Employment Rate 2022 Graduates
U of T's employment rate for undergraduates two years after graduation was 90.7 per cent for the 2022 graduating class, down from 92.2 per cent the year before. The university reports the figure in its Performance Indicators Report 2025 for its undergraduate graduates as a whole. It counts graduates who were employed among those in the labour force.
In Canada, a placement usually means a co-op or internship work term inside the degree, not a campus hiring round. U of T does not run recruitment drives or publish a placement percentage. Indian students comparing it with an Indian college should read every rate here as a survey-based employment rate.
| Measure |
Who it covers |
Graduating cohort |
Window after graduation |
Rate |
| Employment rate (U of T Performance Indicators) |
U of T undergraduates |
2022 |
Two years |
90.7% |
| Employment rate (U of T Performance Indicators) |
U of T undergraduates |
2021 |
Two years |
92.2% |
| Employment rate (Ontario KPI survey) |
U of T undergraduates |
2015 |
Six months |
86.7% |
| Employment rate (Ontario KPI survey) |
All Ontario university undergraduates |
2015 |
Six months |
89.1% |
| Employment rate (Ontario KPI survey) |
U of T undergraduates |
2015 |
Two years |
94.1% |
| Employment rate (Ontario KPI survey) |
All Ontario university undergraduates |
2015 |
Two years |
95.2% |
| Graduates seeking work who were employed |
Rotman Commerce class of 2024 |
2024 |
Nine months |
93% |
- The 2022 and 2021 figures come from U of T's own report, which says the fall is being felt across Ontario in a harder labour market for new graduates.
- The 2015 KPI figures are the newest by-program survey U of T publishes, with 3,922 of 11,881 graduates responding, a 35.49 per cent response rate.
- None of these rates separates international graduates from Canadian ones, so none is an Indian-student figure.
- The Rotman Commerce rate covers only graduates who were seeking work, with an 81 per cent response rate.
Source: University of Toronto, Performance Indicators Report 2025; University of Toronto, Ministry Key Performance Indicators page for the 2015 graduating cohort; Rotman Commerce Employment Report 2024-25.
Note: Employment rate here means the share of graduates in the labour force who were working, as the Ontario survey defines it. Graduates in further study are not in the base. U of T publishes no response rate for its 2022 figure and no six-month rate newer than the 2015 cohort.
Also Check: University of Toronto Rankings 2026
U of T Average Salary After Graduation
U of T publishes no university-wide graduate salary. The two official salary reports are for business graduates. Rotman Commerce undergraduates of the class of 2024 reported an average base salary of CAD 70,000 (INR 46.19 Lakhs). Rotman Full-Time MBA graduates of the class of 2021 reported a median base salary of CAD 92,000 (INR 60.70 Lakhs). Both figures cover graduates who reported a salary, not the whole class.
The Rotman Commerce report gives the 25th percentile, the average and the 75th percentile by job function instead of a median. An average is pulled up by a few high earners, so the median would usually sit a little lower.
| Job function (Rotman Commerce, class of 2024) |
25th percentile (CAD) |
Average base salary (CAD) |
INR (average) |
75th percentile (CAD) |
| Finance |
CAD 70,000 |
CAD 81,000 |
INR 53.44 Lakhs |
CAD 95,000 |
| Project management |
CAD 67,500 |
CAD 80,000 |
INR 52.78 Lakhs |
CAD 91,200 |
| Data science |
CAD 70,000 |
CAD 73,000 |
INR 48.17 Lakhs |
CAD 80,000 |
| Consulting |
CAD 62,000 |
CAD 72,900 |
INR 48.10 Lakhs |
CAD 80,000 |
| Operations |
CAD 65,000 |
CAD 72,000 |
INR 47.51 Lakhs |
CAD 79,900 |
| Sales |
CAD 50,000 |
CAD 67,400 |
INR 44.47 Lakhs |
CAD 80,000 |
| Marketing |
CAD 54,000 |
CAD 66,200 |
INR 43.68 Lakhs |
CAD 70,000 |
| Accounting |
CAD 60,000 |
CAD 61,500 |
INR 40.58 Lakhs |
CAD 60,000 |
| Communications |
CAD 40,000 |
CAD 50,000 |
INR 32.99 Lakhs |
CAD 55,000 |
| All functions |
CAD 60,000 |
CAD 70,000 |
INR 46.19 Lakhs |
CAD 80,000 |
- Finance pays the most at CAD 81,000 (INR 53.44 Lakhs), with project management close behind at CAD 80,000 (INR 52.78 Lakhs).
- Accounting pays the least among the large functions.
- The accounting row prints a 75th percentile below its average in the source, so treat that row with care.
- These are undergraduate business salaries; U of T publishes no salary for its engineering, computer science or arts and science graduates.
- The report covers 768 graduates of June 2024 with an 81 per cent response rate, and it does not split international students.
Source: Rotman Commerce, University of Toronto, Employment Report 2024-25, graduating class of June 2024.
Note: The MBA median of CAD 92,000 (INR 60.70 Lakhs) comes from the Rotman Full-Time MBA Employment and Salary Report 2021-22. That is the newest edition that could be opened for this article. Rotman's later reports sit on pages that could not be read, so the MBA figures are five years old and carry their class year everywhere.
U of T Placements by Course: Employment Rate by Program
Nursing and Law graduates had the highest employment rates among U of T's 2015 undergraduates. Nursing reached 94.3 per cent at six months and 100 per cent at two years, and Law 91.1 per cent and 99.0 per cent. These are the Ontario Key Performance Indicator survey results that U of T publishes by program, and no newer by-program set appears on its site.
For the programs Indian students most often ask about, computer science graduates had a lower six-month rate than business or engineering graduates but the highest two-year rate. U of T publishes no salary by program, so the table shows employment rates only.
| Program (2015 graduates) |
U of T, six months |
U of T, two years |
Ontario, six months |
Ontario, two years |
| Nursing |
94.3% |
100.0% |
91.3% |
98.2% |
| Law |
91.1% |
99.0% |
95.2% |
95.3% |
| Computer science |
83.8% |
98.2% |
85.2% |
97.0% |
| Business and commerce |
85.1% |
96.8% |
91.0% |
96.6% |
| Mathematics |
80.6% |
94.1% |
85.5% |
94.5% |
| Engineering |
88.7% |
93.7% |
87.3% |
94.9% |
| Social sciences |
86.8% |
92.9% |
88.8% |
94.5% |
| Humanities |
86.9% |
91.1% |
89.1% |
93.7% |
| All U of T undergraduate programs |
86.7% |
94.1% |
89.1% |
95.2% |
- U of T beat the Ontario average at two years in computer science, business and commerce, law and nursing, and trailed it in engineering and the arts.
- At six months U of T sat below the Ontario average in every row except engineering and nursing, so the first job often took longer than elsewhere in the province.
- The computer science cohort size is suppressed in the source for confidentiality, so its rates rest on an unknown number of replies.
- The 2015 cohort graduated before the visa rule changes of 1 November 2024, so use the rows for relative strength, not as a forecast.
Source: University of Toronto, Ministry of Colleges and Universities Key Performance Indicators by program area, 2015 graduating cohort.
Key Insight: The gap between six months and two years is the number to watch. U of T computer science graduates moved from 83.8 per cent to 98.2 per cent employment, a 14.4 point rise, calculated. An Indian graduate on a three-year work permit has time for that climb, but the first six months may need savings.
Also Check: University of Toronto Courses and Fees 2027
Rotman U of T MBA Placements and Salary 2021
96 per cent of Rotman Full-Time MBA graduates seeking work were employed three months after graduation, and 97 per cent at six months, for the class of 2021. The class had 295 students. The median base salary was CAD 92,000 (INR 60.70 Lakhs) and the mean was CAD 104,622 (INR 69.03 Lakhs). The mean total package including bonuses was CAD 123,438 (INR 81.44 Lakhs).
Rotman defines the employment rate as the share of students with accepted offers among those reporting back and actively looking. A signing bonus went to 26 per cent of employed graduates who reported pay, with a median of CAD 12,500 (INR 8.25 Lakhs).
| Industry (class of 2021) |
Share of employed graduates |
Average base salary (CAD) |
INR |
| Financial services |
31.7% |
CAD 97,236 |
INR 64.16 Lakhs |
| Consulting |
24.4% |
CAD 113,694 |
INR 75.02 Lakhs |
| Technology |
11.2% |
CAD 102,803 |
INR 67.83 Lakhs |
| Other |
10.2% |
CAD 101,067 |
INR 66.68 Lakhs |
| Legal services |
9.8% |
CAD 131,816 |
INR 86.97 Lakhs |
| Consumer goods and retail |
5.9% |
CAD 95,733 |
INR 63.16 Lakhs |
| Healthcare |
4.9% |
CAD 86,538 |
INR 57.10 Lakhs |
| Real estate |
2.0% |
CAD 76,250 |
INR 50.31 Lakhs |
- Financial services and consulting took 56.1 per cent of the class between them, calculated from the two shares.
- Consulting paid an average of CAD 113,694 (INR 75.02 Lakhs), about 17 per cent above the financial services average, calculated.
- The report lists employers alphabetically, including Accenture, Bain and Company and McKinsey and Company Canada, without hire counts.
- The report gives no location split and no international-student split, so none of these rows is an Indian-graduate figure.
Source: Rotman School of Management, University of Toronto, Full-Time MBA Employment and Salary Report 2021-22, class of 2021.
Note: Rotman's website blocked the fetch for this article, so the class of 2021 report is the newest official edition read here. Salaries and offer rates may have moved since 2021, so check the Rotman careers page for a newer class before relying on these figures.
Top Recruiters Hiring U of T Graduates and Co-op Students
U of T names AMD, Ontario Power Generation, Tenstorrent, Qualcomm and AlphaWave Semi as examples of major global brands in its PEY Co-op programme. The Engineering Career Centre site says over 700 companies post at least 1,500 paid positions each year. In 2024-25, 362 employers hired engineering co-op students.
The university does not publish a ranked list of employers by number of graduate hires. The table groups the employers its official pages and reports name, with the page that names each one.
| Where U of T names the employer |
Employers named |
| PEY Co-op overview page, major global brands (2026-27) |
AMD, Ontario Power Generation, Tenstorrent, Qualcomm, AlphaWave Semi |
| PEY Co-op student testimonials |
Thermo Fisher, Meta, Litens, Accedo |
| PEY Co-op Activity Report, September 2024 |
MDA Space (an employer since 2013), RBC |
| Rotman Commerce Employment Report 2024-25 |
BMO, Bain and Company, Apple (internship); 560+ partner companies |
| Rotman Full-Time MBA report, class of 2021 employer list |
Accenture, Bain and Company, McKinsey and Company Canada |
- Every employer here is named by U of T as having hired its students or graduates; none is ranked and no hire counts are published except for the programme totals.
- The engineering list is a co-op list, so a student may meet these companies on a 12 to 16 month work term rather than at graduation.
- Rotman Commerce says it works with 560 or more companies in a year, which is a partner count, not a hiring count.
Career Exploration and Education hosts over 100 on-campus recruitment information sessions a year across the university. Those sessions are open to students on every campus, but the university does not publish which employers attend or how many students they hire.
Source: University of Toronto Engineering Career Centre, PEY Co-op pages, 2024 to 2026; Rotman Commerce Employment Report 2024-25; Rotman Full-Time MBA Employment and Salary Report 2021-22.
U of T Placements by Sector and Job Role
Financial services took 37 per cent of Rotman Commerce graduates in the class of 2024, followed by accounting services at 18 per cent and consulting at 14 per cent. By job function, finance roles took 28 per cent, accounting 21 per cent and consulting 16 per cent. U of T publishes sector data only for its business graduates.
| Industry (Rotman Commerce, class of 2024) |
Share of employed graduates |
| Financial services (corporate finance 22%, investment 9%, real estate 3%, insurance 3%) |
37% |
| Accounting services |
18% |
| Consulting |
14% |
| Consumer goods and retail |
9% |
| Technology |
5% |
| Advertising, marketing and PR |
3% |
| Government and public sector |
3% |
| Construction, manufacturing and industrial |
2% |
| Education |
2% |
| Sports, media and entertainment |
2% |
| Other |
7% |
- Technology took only 5 per cent of business graduates, so Indian students aiming at tech from a commerce degree are in a small group.
- Data science was 4 per cent of roles and project management 3 per cent, with the rest in finance, accounting, consulting, operations, sales and marketing.
- The shares describe Canadian and international graduates together, with no domicile split.
For MBA graduates of the class of 2021, the split was financial services 31.7 per cent, consulting 24.4 per cent and technology 11.2 per cent. Engineering publishes co-op postings by discipline rather than by sector. Computer engineering students saw 2,154 postings and electrical engineering students 1,894 in the 2023-24 cycle.
Source: Rotman Commerce, University of Toronto, Employment Report 2024-25, graduating class of June 2024.
Where U of T Graduates Work: Canada and Abroad
84 per cent of employed Rotman Commerce graduates in the class of 2024 worked in the Greater Toronto Area. Another 6 per cent worked elsewhere in Canada, 2 per cent in the United States and 8 per cent in other countries. U of T publishes no location data for the university as a whole.
- Nine in ten business graduates stayed in Canada, calculated from the two Canadian shares, so Toronto is where most first jobs were found.
- PEY Co-op work terms show the same pattern: 887 of 991 engineering positions in 2024-25 were in Canada, 29 in the United States and 36 in other countries.
- Just under 10 per cent of engineering co-op students worked outside Canada, a share the Engineering Career Centre gives as about 1 in 12.
- The Rotman Commerce report does not say which countries make up the 8 per cent international share.
The PEY Co-op location figures come from the Faculty of Applied Science and Engineering's By the Numbers 2025 report. The 2024-25 count of 991 was the second highest on record after 1,022 in 2023-24.
PEY Co-op and Internships at U of T
81.1 per cent of eligible engineering students took a PEY Co-op work term in 2024-25, the highest share in ten years. In that cycle 991 students were placed and 362 employers hired. PEY Co-op is the Professional Experience Year, a paid 12 to 16 month work term after third year. An optional 3 to 4 month summer term follows second year. Across all three campuses, U of T's unified co-op partnership enabled 7,441 work terms in 2025.
Students must find their own position through the Engineering Career Centre's postings or externally. In the 2023-24 cycle, 1,022 of 1,076 registered engineering students secured a work term, a 94.98 per cent success rate as the centre reports it.
| Engineering discipline (PEY Co-op 2026-27, as of 30 September 2026) |
Average annual salary (CAD) |
INR |
Highest (CAD) |
| Computer engineering |
CAD 65,180.61 |
INR 43.01 Lakhs |
CAD 96,732.00 |
| Electrical engineering |
CAD 63,720.74 |
INR 42.04 Lakhs |
CAD 95,000.00 |
| Engineering science |
CAD 62,984.26 |
INR 41.56 Lakhs |
CAD 110,000.00 |
| Mineral engineering |
CAD 62,284.17 |
INR 41.10 Lakhs |
CAD 82,320.00 |
| Industrial engineering |
CAD 59,937.88 |
INR 39.55 Lakhs |
CAD 95,000.00 |
| Mechanical engineering |
CAD 56,060.94 |
INR 36.99 Lakhs |
CAD 95,000.00 |
| Chemical engineering |
CAD 54,010.51 |
INR 35.64 Lakhs |
CAD 80,810.08 |
| Civil engineering |
CAD 52,930.69 |
INR 34.92 Lakhs |
CAD 105,300.00 |
| Materials engineering |
CAD 50,520.31 |
INR 33.33 Lakhs |
CAD 76,960.00 |
| All engineering |
CAD 59,905.17 |
INR 39.53 Lakhs |
CAD 110,000.00 |
- Computer engineering students earned the most at CAD 65,180.61 (INR 43.01 Lakhs) a year on a work term.
- Electrical engineering followed at CAD 63,720.74 (INR 42.04 Lakhs) a year.
- The figures are annual work-term salaries in Canadian dollars, exclude stipends and cover only positions paid in CAD.
- Summer co-op after second year averaged CAD 23.75 (INR 1,567) per hour across engineering in the same cycle.
- A work-term salary is paid while you are still a student; it is not a graduate starting salary.
Source: University of Toronto Engineering Career Centre, Salary Guides 2026-2027, data as of 30 September 2026; Faculty of Applied Science and Engineering, By the Numbers 2025.
Tip for Indian Students: Register for PEY Co-op in first year, when 98 per cent of engineering students enrol. Recruitment for the 12 to 16 month term runs from September of third year to June. U of T states that graduates with this experience may negotiate a starting salary about 15 per cent higher than peers without it.
Also Check: University of Toronto Scholarships 2026 for Indian Students
U of T Career Services for International Students
Career Exploration and Education serves undergraduate and graduate students, recent graduates for two years after convocation and postdocs. Its pages set no separate rules for international students and name services, not outcomes.
- CLNx, the Career and Co-curricular Learning Network, is the online job and events board, reached with a UTORid.
- Career advising appointments, career fairs, employer information sessions and Industry Spotlights run through the year.
- Career Navigator and the U of T Hub on Ten Thousand Coffees connect students with alumni for advice.
- Work Study offers paid on-campus positions twice a year.
The Engineering Career Centre runs PEY Co-op separately and held 1,378 one-on-one meetings and over 100 events in the 2023-24 cycle.
Post-Study Work After U of T for Indian Students
Indian graduates apply for the Post-Graduation Work Permit, or PGWP. For a programme of two years or more, the permit can be valid for 3 years. For a programme of 8 months to under two years, it can match the programme length. A master's shorter than two years can also qualify for a 3-year permit, subject to the conditions on the government page.
- University graduates with a bachelor's, master's or doctoral degree have no field-of-study requirement, as Immigration, Refugees and Citizenship Canada states.
- They must show Canadian Language Benchmark 7 in English, or NCLC 7 in French, in all four skills.
- The application must be filed within 180 days of confirmation that the programme is complete.
- During the degree, students may work up to 24 hours per week off campus in regular terms and unlimited hours in scheduled breaks.
The government page sets no salary threshold for the permit. The field-of-study rule changed for applications from 1 November 2024, so check canada.ca on the day you apply.
Also Check: PGWP Canada: Duration, Eligibility and Application Process
The University of Waterloo reported an employment rate of 91.5% six months after graduation and 93.5% two years after graduation for undergraduate students who completed their degrees in 2022. These figures come from the Ontario University Graduate Survey, which is part of the Key Performance Indicators (KPIs) that the Ministry of Colleges and Universities requires universities in Ontario to report. Waterloo published the 2025 survey results in May 2026 on its Institutional Analysis and Planning page.
In Canada, a placement generally refers to a co-op or work term completed during a degree, rather than campus recruitment after graduation. The University of Waterloo does not conduct campus recruitment drives for graduating students or publish an official placement percentage. Therefore, the figures mentioned above represent graduate employment rates, not campus placement rates.
FAQs
Ques. What is the University of Toronto graduate employment rate?
Ans. 90.7 per cent of U of T undergraduates who graduated in 2022 were employed two years after graduation, according to the university's Performance Indicators Report 2025. The Ontario KPI survey of 2015 graduates showed 86.7 per cent employed at six months and 94.1 per cent at two years.
Ques. What is the average salary after graduating from the University of Toronto?
Ans. U of T publishes no university-wide salary. Rotman Commerce graduates of the class of 2024 reported an average base salary of CAD 70,000 (INR 46.19 Lakhs). Rotman Full-Time MBA graduates of the class of 2021 reported a median of CAD 92,000 (INR 60.70 Lakhs).
Ques. Does the University of Toronto have placements for Indian students?
Ans. U of T runs no campus placement drive. Its main work-term route is PEY Co-op, a paid 12 to 16 month engineering work term that 81.1 per cent of eligible students took in 2024-25. Across all campuses the university enabled 7,441 co-op work terms in 2025.
Ques. What is the Rotman MBA average salary and placement rate?
Ans. For the class of 2021, 96 per cent of Rotman Full-Time MBA graduates seeking work were employed within three months and 97 per cent within six. The median base salary was CAD 92,000 (INR 60.70 Lakhs) and the mean CAD 104,622 (INR 69.03 Lakhs). Consulting roles averaged CAD 113,694 (INR 75.02 Lakhs).
Ques. Which companies hire University of Toronto graduates?
Ans. U of T's PEY Co-op page names AMD, Ontario Power Generation, Tenstorrent, Qualcomm and AlphaWave Semi as examples. Its reports also name MDA Space, RBC, BMO, Bain and Company, Apple, Accenture and McKinsey and Company Canada. The university publishes no ranked list of employers by hires.
































Comments