



Content Curator
A type of relative measure of dispersion is the coefficient of variation. It is expressed as the standard deviation to mean ratio. The coefficient of variation is a dimensionless number that is typically expressed as a percentage. It is useful to compare two data sets based on the degree of variation. The coefficient of variation is used in industries such as finance to assist investors in determining the risk-to-reward ratio. We will learn more about the coefficient of variation, its formula, and various examples in this article.
Also Read: Difference Between Variance and Standard Deviation
| Table of Content |
Key terms: Coefficient of Variation, Formula, Standard Deviation, Dispersion measure, Probability, Statistics
Coefficient of Variation: Definition
[Click Here for Sample Questions]
The coefficient of variation is a type of dispersion measure. A measure of dispersion is a quantity used to assess the degree of variability in data. As a result, the coefficient of variation is used to quantify data dispersion from the average or mean value. CV is an abbreviation for coefficient of variation.
The coefficient of variation is a dimensionless relative measure of dispersion defined as the standard deviation to mean ratio. If two data sets have different units, the coefficient of variation is the best way to compare them.
Coefficient of Variation Detailed Explanation
Also check Statistics
Example: Assume you have a data set [80, 90, 100]. The population standard deviation is 8.165, and the mean is 90. The variation coefficient is 0.09. The coefficient of variation is 9% as a percentage.
Coefficient of Variation Formula
[Click Here for Sample Questions]
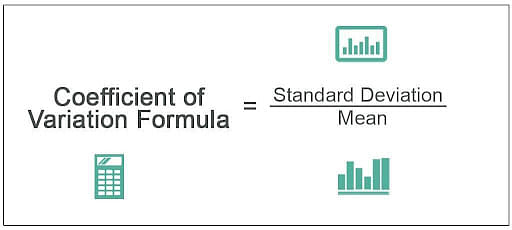
Formula
According to statistics, the coefficient of variation calculator is used to calculate the standard deviation to mean ratio. The relative standard deviation formula is another name for the coefficient of variation formula. This is a standardised formula for determining the dispersion of a probability or frequency distribution. If the coefficient of variation obtained from the calculator is lower, it indicates that the data has less variability and is more stable.
Read More: Relation and Function
The variation coefficient formula is as follows:
Coefficient of Variation = (Standard Deviation / Mean)*100
The formula for standard deviation may differ depending on the type of sample and population data.
Sample Standard Deviation = √∑ni=1(Xi−X¯)2 /n−1
Population Standard Deviation = √∑ni=1(Xi−X¯)2 / n
Here,
Xi denotes the terms found in the data.
The mean value is represented by X.
The total number of terms is represented by n.
Also Check Bayes Theorem
Calculating the Coefficient of Variation
[Click Here for Sample Questions]
The coefficient of variation formula is especially useful when comparing results from two different surveys with different values. The Coefficient of variation formula (CV), also known as relative standard deviation (RSD) in statistics, is a standardised measure of the dispersion of a probability or frequency distribution. If the coefficient of variation is lower, it indicates that the data has less variability and is more stable. The following are the general steps for calculating the coefficient of variation:
Step 1: Locate the sample set.
Step 2: Determine the standard deviation and mean.
Step 3: Enter the values into the coefficient of variation formula, CV = 100.
Check out: Remainder Theorem
Difference between Standard Deviation and Coefficient of Variation
[Click Here for Sample Questions]
When measuring the spread of values in a dataset, the coefficient of variation and the standard deviation are both used. The table below summarises the key differences between the two measures.
| Coefficient of Variation | Standard deviation |
|---|---|
| It is a relative measure of dispersion | It is an absolute measure of dispersion |
| It measures the ratio of the standard deviation to the mean | It measures how far a data point lies from the mean |
| Coefficient of variation is usually used to compare the variation of different data sets | Standard deviation is used to measure the dispersion of data in a single data set |
Check: Sum of Squares
Uses
[Click Here for Sample Questions]
When comparing two data sets with similar values, the standard deviation can be used. If two data sets with different units must be compared, the coefficient of variation must be used. The coefficient of variation can be used in the following ways:
In the financial industry, if an investor wants to invest in a specific ETF, he uses the coefficient of variation to select the one with the best risk-return trade-off.
The coefficient of variation is also used to assess data consistency. A smaller coefficient of variation (CV) distribution is more consistent than a larger CV distribution.
Things to Remember
- The coefficient of variation (CV) is a statistical measure of how far apart data points in a series are from the mean.
- The coefficient of variation is the ratio of the standard deviation to the mean, and it is a useful statistic for comparing the degree of variation between data series, even if the means are vastly different.
- The coefficient of variation (CV) is a statistical measure of how far apart data points in a series is from the mean.
- The coefficient of variation in finance allows investors to determine how much volatility, or risk, is assumed in comparison to the expected return on investment.
- The lower the standard deviation to mean return ratio, the better the risk-return trade-off.
Sample Questions
Ques: A test was given that included two multiple-choice questions with varying conditions. A typical multiple-choice test is determined in the first test. Alternative choices (i.e. incorrect answers) are generally assigned to test takers in the second test. Determine the Coefficient of Variance. (3 Marks)
Refer the table
| Regular Test | Random Answers | |
| Mean | 78.4 | 63.7 |
| Standard Deviation | 10.3 | 7.1 |
Ans: Equation for the coefficient of variation (CV) = Standard Deviation/Mean * 100
We can calculate the coefficient of variation in Statistics by plugging the above values into the cv formula.
| Regular Test | Random Answers | |
| Mean | 78.4 | 63.7 |
| Standard Deviation | 10.3 | 7.1 |
| Coefficient of Variation | 13.13 | 11.14 |
The regular test has a coefficient of variation of 13.13.
The random answer has a coefficient of variation of 11.14.
Ques: Determine the coefficient of variation of the numbers in the following sample set. {1, 4, 9, 11, 15, 30, 55, and 98} (3 Marks)
Ans: The given sample set is {1, 4, 9, 11, 15, 30, 55, 98}
The formula for Sample standard deviation σ =
√∑ni=1(Xi−X¯)2/n−1
Mean value of the sample set = (1+4+9+11+15+30+55+98) / 8 = 223/8 = 27.87
The mean value of the sample set = 27.87
(1 - 27.87)2+ (4 - 27.87)2 (9 - 27.87)2+ ( 11 - 27.87)2+ (15 - 27.87)2+ (30 - 27.87)2+ (55 - 27.87)2+ (98 - 27.87)2
= 721.99 + 569.77 + 333.79 + 284.59 + 165.63 + 4.53 + 736.03 + 4918.21
= 7734.51
σ = √7734.517/7
√1104.93
σ = 33.2404
CV = 33.2404 / 27.87 * 100
CV = 119.26
Ques: In statistics, what is the coefficient of variation? (2 Marks)
Ans: In statistics, the coefficient of variation is the ratio of the standard deviation to the mean. The mean value is inversely proportional to the standard deviation coefficient formula. This means that the higher the value obtained from the coefficient of variation calculator, the greater the level of dispersion around the mean. The lower the coefficient of variation value from the calculator, the more precise the estimate.
Ques: Why Do We Determine the Coefficient of Variation?(2 Marks)
Ans: The value obtained from a coefficient of standard deviation formula shows the variability of data in a sample in relation to the population mean. The coefficient of variance calculator in finance assists the investor in determining how much risk or volatility is assumed in comparison to the amount of profit or returns expected from investments.
Ques: Find the probability of getting an even number greater than or equal to 3 in a roll of a dice.(2 Marks)
Ans. The sample space for rolling of dice is S = {1,2,3,4,5,6} and the probability of the event of greater than or equal to 3 in a roll of a dice is given by P(E)
So E = {3,4,5,6} and S = {1,2,3,4,5,6}
P(E) = n(E)/n(S)
= 4/6
P(E) = 2/3
Ques: Calculate the population coefficient of variation for the given data set (320, 540, 480, 540, 420, 240) Calculate the population coefficient of variation for the given data set (320, 540, 480, 540, 420, 240) (2 Marks)
Ans: Mean = (320 + 540 + 480 + 540 + 420 + 240) / 6 = 423.33
StandardDeviation=√(320−423.33)2+(540−423.33)2+(480−423.33)2+(540−423.33)2+(420−423.3)/6
StandardDeviation=111.6
CV = (Standard Deviation / mean) * 100 = (111.6 / 423.33) * 100 = 26.36%
Ques: Find the standard deviation if the coefficient of variation is 20.75 and the mean is 22.6. (2 Marks)
Ans: Coefficient of Variation = (Standard Deviation / mean) * 100
20.75 = (SD / 22.6) * 100
SD = 4.69
Ques: Find the sample coefficient of variance of the given data set (31.9, 42.5, 55.2, 67.8) (3 Marks)
Ans: Mean = (31.9 + 42.5 + 55.2 + 67.8) / 4 = 49.35
StandardDeviation = √(31.9−49.35)2+(42.5−49.35)2+(55.2−49.35)2+(67.8−49.35)2/3
Coefficient of Variation = (Standard Deviation / mean) * 100 = (15.55 / 49.35) * 100 = 31.5%
Ques: What is Variance? (3 Marks)
Ans: The difference between two or more values is defined as variance. In statistics, variance is the measure of variability that represents how far apart members of a group are. It computes the average deviation from the mean of each observation.
A low variance in a data set indicates that the observations are close to the mean, whereas a high variance indicates that the observations are widely dispersed around the arithmetic mean and from one another.
Ques: What are the applications of Variance and Standard deviation? (3 Marks)
Ans: The variance combines all of the values during a set of knowledge to quantify the measure of spread.
The greater the range, the more variation there is when the values in the data set are separated by a larger gap.
Variance is the statistical probability distribution of living volatility from the mean, and it is one of the risk analysis measures that can help investors assess the risk in their investment portfolios. It is also a critical component of asset allocation.
The variance, on the other hand, is widely used as a measure of market and security volatility in a variety of fields, including finance. Dog routes, class strength, weather forecasting, class-by-class student appearance in exams, department-by-department salary checks, and market research all requires these values.
Ques: In a school, there are 1000 students, out of which 430 are girls. It is known that out of 430, 10% of the girls study in class XII. What is the probability that a student is chosen randomly studies in class XII given that the chosen student is a girl? (3 Marks)
Ans. Let E denote that the student is chosen randomly studies in class XII, and F denote that the randomly chosen student is a girl.
P (E|F) = ?
P(F) = 430/1000= 0.43
P(E∩ F) = 43/1000 = 0.043
P(E/F) = P(E∩F)/P(F)
0.043/0.43 = 0.1
Also Check :



Comments