



Exams Prep Master
Population in statistics refers to a collection of a group of things or people. Thus, the population mean is nothing but the average value of this group of items. Population mean is basically the arithmetic mean of the group. Population mean is the most common method to measure the center of a data set. It is difficult to find the exact population mean because the population is a big data set and it is very time-consuming and costly to find the population mean. For instance, the age of people living in New York City is the population set; it is very difficult to count each person and then take an average. Thus, we usually extract a sample out of the population which is a representation of the population set. Then we take an average of a sample of seeing what is the average of the population. Let’s discuss more about the population mean along with some important questions.
| Table of Content |
Key Takeaways: Arithmetic mean, data points, mean value, extreme value, statistical analysis, the array of data.
Explanation of Formula
[Click Here for Sample Questions]
In general, the mean is a simple average of the data points present in a data set. However, there are certain constraints and limitations of using mean, these limitations are valid for both Population and Sample Mean. Mean values can be easily distorted by extreme values present in an array of data.
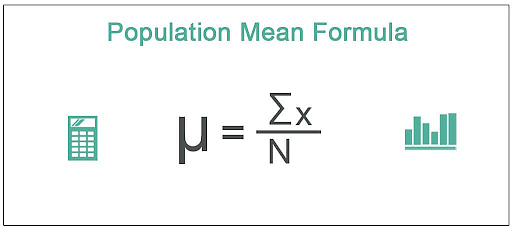
We can find the population mean using the below-given formula:
μ = ∑Xi/N
Where,
∑ Xi = Sum of the values
N = Number of the value
Read more:
Solved Examples
[Click Here for Sample Questions]
Ques: Let us assume that we have the annual returns of a particular stock for the last 5 years given as 5%, 2%, 1%, 5%, -30%.
Solution: The mean for these values is ((5 + 2 + 1 + 5 - 30) / 5) = -3.4%. So, even after the stock has given a positive return for the first 4 years and negative for just one year, on average we have a negative mean of 3.4%.
Ques: Find the population mean of the following numbers 1, 2, 3, 4, 5.
Solution: Given,
Xi = 1, 2, 3, 4, 5
∑ Xi = 1 + 2 + 3 + 4 + 5 = 15
Population Mean = μ = ∑Xi/N
μ = 15/3
μ = 3
Therefore, the population mean = 3.
Points to Remember
- Population mean is very simple but a very important element of statistics. Population mean is the basic foundation of statistical analysis of data. It is very easy to understand and easy to calculate also.
- It is not practical to spend enormous efforts to find a mean of population set. Thus, sample mean is a much more realistic and practical concept.
- Additionally, the mean value has relatively less significance due to the flaws discussed above and it is more of a theoretical number. Therefore, the mean value should be used very carefully and we should not study the data only based on the mean.
- If we are studying the cash flow of a firm for the next 5 years. Let us assume the cash flows are: -100, -100, -100, -100 and +1000 respectively for each year. So, the mean comes out to be 600 / 5 = 120.
- Although we have a positive mean, we are only having a positive flow of cash in the last year of the. It is possible that if we study this data through time value of money, this project will not look as lucrative as it is now.
Also read: Isosceles Triangle Theorems
Sample Questions
Ques. Let us assume that you want to invest in IBM and are very keen to look at its past performance and returns. Thus, you wish to go back 20 years and calculate monthly return but that will be very time consuming and hectic. So, you take a sample of the last 10 months and calculate return and the mean return. You are sure that the taken sample is a correct representation of the entire population of 20 years. (4 marks)
Ans. Give below is the sample 10 month return for IBM:
July 2018 – 3.74%
Aug 2018 – 1.07%
Sept 2018 – 4.34%
Oct 2018 – -23.66%
Nov 2018 – 7.66%
Dec 2018 – -7.36%
Jan 2019 – 18.25%
Feb 2019 – 2.76%
Mar 2019 – 1.48%
Apr 2019 – 0.00%
Therefore, mean return for IBM = Sum of returns of all 10 months / 10
= [3.74 + 1.07 + 4.34 + (-23.66) + 7.66 + (-7.36) + 18.25 + 2.76 + 1.48 + 0.00] / 10
= 9.2% / 10
= 0.92%
Ques. Given here is a data set with 10 data points and we want to calculate Population Mean for the same. Data set: {14,61,83,92,2,8,48,25,71,12}. (2 marks)
Ans. Population Mean = Sum of all values / frequency of values
= (14 + 61 + 83 + 92 + 2 + 8 + 48 + 25 + 71 + 12) / 10
= 416 / 10
= 41.6
Ques. From the following numbers find the Population Mean. (1, 2, 3, 4, 5). (2 marks)
Ans. Given,
X = 1, 2, 3, 4, 5
∑Xi = (1 + 2 + 3 + 4 + 5) = 15
Population Mean = ∑Xi / N
μ = 15 / 5
μ = 3
Thus, Population Mean = 3
Ques. There are 15 classes in a school. Find the population mean of the classes if the respective strength of each class (Xi)is 20, 24, 16, 22, 17, 21, 22, 26, 22, 22, 20, 15, 15, 20, 18. (2 marks)
Ans. We need to find the total strength of all the classes: ∑Xi = 20 + 24 + 16 + 22 + 17 + 21 + 22 + 26 + 22 + 22 + 20 + 15 + 15 + 20 + 18 = 300
Now, to get the population mean, we need to divide the total number of students by the number of classes. Thus, Population mean= ∑Xi / N = 300 / 15 = 20
Thus, the population mean for the class is 20 students.
Ques. Find the mean population of the sum of an arithmetic progression which is from 20 to 140. With common difference of 15. (2 marks)
Ans. The progression starts from 20 with common difference of 15. Thus, the series is 20, 35, 50, 65, 80, 95, 110, 125, 140.
(∑Xi) = 20 + 35 + 50 + 65 + 80 + 95 + 110 + 125 + 140 = 720
Thus, Population mean = ∑Xi / N
= 720 / 9
= 80
Related links:



Comments