



Content Curator
Population in statistics is the entire set of items from which data can be drawn for a statistical study. It can be a group of individuals, a set of items etc. that makes up the data pool for a study. Generally, population is considered as a group of people who live in a particular area at a specific time. But in statistics, population refers to the data on the study of interest. It can be referred to as a group of individuals, objects, events, organizations etc. An example of population can be an entire student body at a school. It will contain all the students who study in that school at the time of data collection. Data from each of the students is collected depending upon the problem statement.
| Table of Content |
Key Takeaways: Population, Statistics, Sampling, Mean Absolute Deviation, Standard Deviation, Variance
Read Also: Statistics
What is Sample?
[Click Here for Sample Questions]
Sample represents the group of interest from the population, which will be used to represent the data. It is an unbiased subset of the population that best represents the whole data. To overcome the restraints of a population, data is collected from a subset of the population and then considered as the general norm.
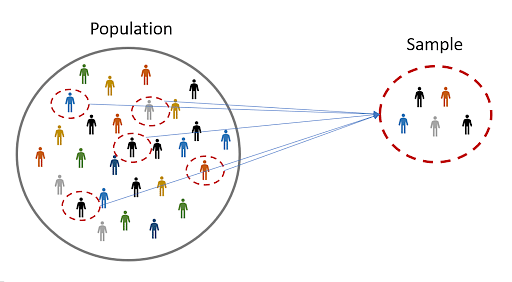
Population and Sample
We can collect the subset information from the groups who have taken part in study, making the data reliable. The results obtained for particular groups who took part in the study can be concluded to generalize for the specific population. The process of collecting the data from a small subsection of the population and then using it to generalize over the entire set is called Sampling.
Read Also:
Population & Sample Formula
[Click Here for Sample Questions]
There are some formulas for mean absolute deviation, variance and standard deviation based on the population and given sample. Let ‘n’ be the population size and ‘n-1’ be the sample size then the formula for mean absolute deviation, variance and standard deviation is given by:
- Population mean absolute deviation = 1/n ∑|xi - \(\overline{x}\)|
- Sample mean absolute deviation = 1/n-1 ∑|xi - \(\overline{x}\)|
- Population variance = 1/n (xi - \(\overline{x}\))2
- Sample variance = 1/n (xi - \(\overline{x}\))2
- Population standard deviation = √1/n ∑(x - \(\overline{x}\))2
- Sample standard deviation = √1/n-1 ∑(x - \(\overline{x}\))2
Read More:
Things to Remember
- Sample size is denoted by “n” or “N” or “SS”.
- Study design, outcome measures and method of sampling affects the sample size.
- ‘Z’ score depends upon the value of confidence level.
- Sample size formula differs for different population types, as the sample size increases, the sampling distribution approaches the normal distribution.
- Population mean can be considered as the basic foundation of statistical analysis of data.
- Sample mean is considered as the average value found in a sample. It is simply a portion of the entire population.
Read More:
Sample Questions
Ques. Explain different types of Population in the Statistics. (3 Marks)
Ans. Different types of population in statistics are:
- Finite population - It is the population which can be counted. It is also known as countable population. It is the population of all the individuals or elements that are finite in number.
- Infinite population - Sometimes there exists a possibility that we cannot count the units contained in the population. Such a population is known as an infinite or uncountable population.
- Existent population - It is the population which exists physically. For example, the number of students in a class or a gender survey.
- Hypothetical population - It is a statistical population which has no real existence but it is imagined to be generated by repetitions of events of a certain type.
Ques. Explain different types of Sampling in Statistics. (3 Marks)
Ans. Different types of Sampling in Statistics are:
- Simple random sampling - In this, sample units are selected at random. The selection of each unit is independent of selection of every other unit.
- Stratified random sampling - It divides the population into non-overlapping groups or sub-population called strata, each of which is homogeneous within itself.
- Multi-stage sampling - In this, the population is divided into clusters and selection of clusters at the first stage. At each stage, the clusters are then divided into smaller clusters and the process is repeated until the last step.
- Cluster sampling - In this, the population is divided into multiple groups for research. Researchers then select random groups with a simple random or systematic random sampling technique for data collection & analysis.
- Proportionate sampling - It is a sampling method used when the population is composed of various subgroups that are vastly different in number.
Ques. What are the factors involved in an effective sampling? (3 Marks)
Ans. The factors involved in an effective sampling are:
- Necessity - Sometimes, there can be a possibility to study the whole population due to its size or inaccessibility.
- Practicality - Sometimes, it is easier and more efficient in number to collect data from a sample.
- Manageability - Storing and running statistical analysis on small datasets is reliable and easier.
- Cost-effectiveness - There are fewer participants, laboratory, equipment and researcher costs involved.
Ques. Describe Sampling Error and Sampling Size in brief. (2 Marks)
Ans. A sampling error is the difference between a population parameter and sample statistics. They happen even when you use a randomly selected sample. This is because random samples are not identical to the population in terms of numerical measures like mean and standard deviation.
A sample size is the number of people observed from the whole population from a survey. These people will be the representative for the whole. For example, consider a new setup mobile company wants to take feedback from users. So, they take a small proportion and survey them.
Ques. Write some examples to demonstrate Population & Sampling. (3 Marks)
Ans. Some examples of population & sampling are:
- Patients in a hospital are a population but the old age patients are a sample.
- All the students of a class are a population but the top 3 students of that class are a sample.
- The people having ID proofs is a population but the people having only pan cards with them is a sample.
- All the members of parliament are the population but the female candidates present in the population are a sample.
Ques. How to calculate data from Population and Sample? (3 Marks)
Ans. Data is collected from a population when the research questions need an extensive amount of data or information about every member of the population available. We can use the population data when the data pool is small and cooperative to give all the required information. For large populations, we can use sampling to represent parts of the population from which it will be difficult to collect data.
In data collection from samples, the samples should be randomly selected and will represent the entire population and every class within it. To ensure this, statistical methods like probability sampling are used to collect random samples from every class within the population. This will reduce sampling bias and increase the validity.
Ques. What are the differences between Population and Sample? (3 Marks)
Ans. The differences between Population & Sample are:
| Basis for Comparison | Population | Sample |
|---|---|---|
| Definition | Population is considered as the collection of all elements possessing common characteristics, that comprises a universe. | Sample is referred to as a subgroup of the members of population chosen for participation in the study. |
| Includes | Population includes each and every unit of the group. | Sample includes only a handful of units of population. |
| Focus on | Population focuses on identifying the characteristics. | Sample focuses on making inferences about the population. |
| Measurable Quantity | Population is called a parameter. | Sample is called a statistic. |
| Advantages | When the whole population is used to carry out a study result can be more accurate. | If the sample is representative of the population, reliable estimates can be made with less time and efforts used. |
| Disadvantages | In most cases, it can be impossible to test an entire population. | If the sample chosen is not representative of the population, the results are not satisfactory. |
| Nature | Population parameters are numerical measures that describe an aspect of a population. | Sample statistics are numerical measures that describe an aspect of a sample. |
| Collection of data | The collection of data takes place through complete enumeration or census. | The collection of data takes place through sample survey or sampling. |
Ques. How is the sample size calculated? (2 Marks)
Ans. It is very difficult to calculate sample size of a population because of the confidence level and margin of error in the survey. After observation, there are four commonly used formula to calculate sample size which are sample size formula, Cochran’s formula, Yamane’s formula and
Slovin’s formula.
Ques. Define the following terms Marginal error and Confidence level. (2 Marks)
Ans. Margin of error is a quantity that gives width to the estimated percentage to get accuracy. It provides the range where the value may occur.
Confidence level is the probability that the proportion which is true is contained by the margin of error. The higher the confidence level, the more certain the person can be that the interval includes the true ratio.
Read More:



Comments