



Education Journalist | Study Abroad Lead
Weighted mean is the average of a data set. It's a weighted average derived by having some of the individual numbers of various weights. The weighted mean is the same as the arithmetic mean if all the values are the same. When data is presented in different ways than the arithmetic mean or sample mean, it is computed. Although the weighted mean acts similarly to the average mean in most cases, it does have certain inconsistencies. High-weighted data values contribute more to the weighted mean than low-weighted data values. Negative weights aren't feasible; some may be zero, but not all, because division by zero isn't permitted. In this article, we will look at the weighted mean formula and some solved examples.
| Table of Contents |
Key takeaways: Arithmetic mean, Weighted mean, data set, sum, average, numerator, denominator, deviance, median
What is Weighted Mean?
[Click Here for Sample Questions]
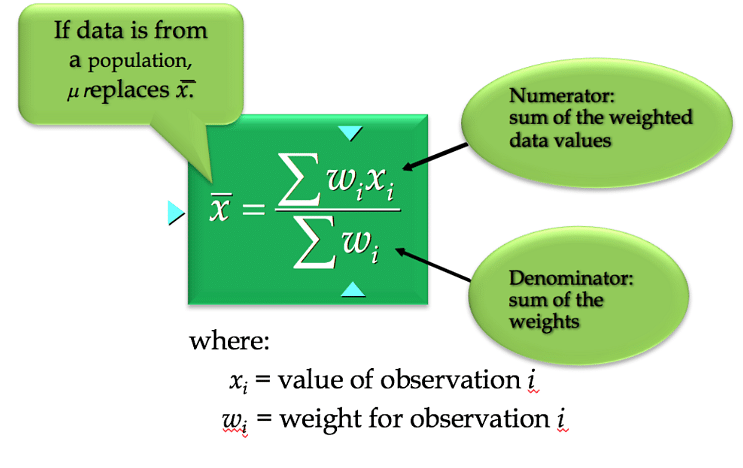
A weighted average is the sum of all values that are ranked in order of importance. The sum of the weight times values divided by the sum of the weights is the weighted average of values.
Weghted mean
The ordinary arithmetic mean, which is the most often used average, is the same as the weighted arithmetic mean, except that instead of each data point contributing equally to the final average, certain data points represent more than others. The weighted mean concept is important in descriptive statistics and various other fields of mathematics. If all of the supplied weights are equal, the weighted arithmetic mean equals the conventional arithmetic mean. While weighted means function similarly to arithmetic means in most cases, they do have some contradictary features.
Weighted Mean Formula
[Click Here for Sample Questions]
The weighted mean formula below can be used to calculate the weighted mean for a non-negative set of data with non-negative weights:
\(\bar{x} =\frac{ w1x1 + w2x2 + .... + wnxn}{w1 + w2 + .... + wn}\)
Here,
x stands for the repeating value
w denotes the number of y weight occurrences
and x stands for the weighted mean
Solved Examples
[Click Here for Sample Questions]
Ques. Assume a marketing firm performs a study of 1,000 households in order to ascertain the average number of televisions owned by each family. According to the data, a high percentage of households have two or three televisions, while a lesser number have one or four. There is at least one television in every family in the sample, and no household has more than four. Calculate the average number of televisions per home.
| Number of TVs per House | Number of Houses |
|---|---|
| 1 | 73 |
| 2 | 378 |
| 3 | 459 |
| 4 | 90 |
Solution: As there are many repeated values in the dataset, we can calculate the sample mean by computing it as a weighted mean. To calculate the weighted arithmetic mean, follow these steps:
Each value in the dataset should be given a weight:
w1 = 73, w2 = 378, w3 = 459, w4 = 90
Calculate the weighted mean formula's numerator.
Add the items together after multiplying each sample by its weight:
=w1x1 × w2x2 × w3x3 × x w4x4
=173+2378+3459+490
= 2566
Add the weights together to get the denominator of the weighted mean calculation.
=73+378+459+90
=1000
Divide the numerator by the denominator
=2566/1000
=2.566
In this survey, the average number of TVs per household is 2.566.
Ques. The commerce class at a school is separated into two sections: A and B. Section A has 25 students, with an average grade of 75, and section B has 30 students, with an average grade of 60. Calculate the class's overall average grade.
Solution: To answer this question, we must first determine x1w1 and x2w2.
Here, w1 = 25 and w2 = 30
So, w1x1= 25 x 75 = 1875
w2x2 = 30 x 60 = 1800
Weighted mean = (1875 + 1800)/ 55
= 66.81
Simpson’s Paradox
[Click Here for Sample Questions]
Simpson's paradox is a probability and statistics phenomenon in which a trend appears in several different sets of data but vanishes or reverses when the data sets are combined. This is a common occurrence in social-science and medical-science statistics, and it's especially problematic when frequency data is assigned causal interpretations that aren't warranted. When confounding variables and causal relationships are properly addressed in statistical modeling, the dilemma can be resolved. Simpson's paradox has been used to demonstrate the type of erroneous conclusions that can be produced when statistics are misused.
In a technical study published in 1951, Edward H. Simpson originally identified this phenomenon, however statisticians Karl Pearson et al. in 1899 and Udny Yule in 1903 had previously mentioned comparable effects. Colin R. Blyth coined the term "Simpson's paradox" in 1972. Simpson's reversal, the Yule–Simpson effect, the amalgamation paradox, and the reverse paradox are all terms used to describe this phenomenon.

Simpson’s Paradox
Uses of Weighted Mean
[Click Here for Sample Questions]
Weighted means come in handy in a variety of situations. A student might use a weighted mean to calculate his or her % grade in a course.
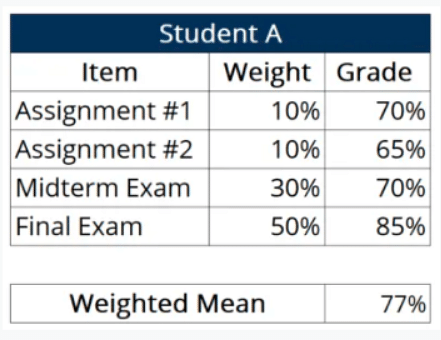
For example, a student would multiply the weighted average of all assessment items in the course (e.g., assignments, examinations, projects, etc.) by the grade earned in each of the categories. Consider the following grades for a student:
Uses of Weighted Mean
We can get the weighted mean in the example above by multiplying the weights associated with each assessment item by the student's grade on each of the items. After that, we may add up the items to get the student's final grade.
We can see that the student is able to achieve a higher grade than expected by performing well on the course's most heavily weighted component: the final. Students can better plan their study time if they understand how each assessment aspect in the course is weighted.
Students will be better able to weigh a particular assessment item against other time-consuming activities (e.g., social life, personal interests, other courses, etc.) and make judgments that fit their personal utility function if they take a step back.
Arithmetic Mean
[Click Here for Sample Questions]
The arithmetic meanor simply the mean or the average is the sum of a set of numbers divided by the number of numbers in the set in mathematics and statistics. A set of results from an experiment or observational study, or a set of survey results, is typically included in the collection. In some cases in mathematics and statistics, the name "arithmetic mean" is favored since it distinguishes it from other means like geometric and harmonic means.
The arithmetic mean is utilized in practically every academic subject to some level, and it is widely employed in many distinct fields such as economics, anthropology, and history. The arithmetic average income of a country's population, for example, is called per capita income.
Things to Remember
- Weighted mean is the average of a data set. It's a weighted average derived by giving some of the individual numbers of various weights.
- The weighted mean is the same as the arithmetic mean if all the values are the same.
- A weighted average is the sum of all values that are ranked in order of importance. The sum of the weight times values divided by the sum of the weights is the weighted average of values.
- The ordinary arithmetic mean, which is the most often used average, is the same as the weighted arithmetic mean, except that instead of each data point contributing equally to the final average, certain data points represent more than others.
- Simpson's paradox is a probability and statistics phenomenon in which a trend shows in many sets of data but disappears or reverses when the groups are combined.
- This is a common occurrence in social-science and medical-science statistics, and it's especially problematic when frequency data is assigned causal interpretations that aren't warranted.
Sample Questions
Ques. Find the price's weighted A.M. given the following data. (3 marks)

Ans. The x-values represent the price of the provided food item, while the weights represent the quantity (in Kg)
Weighted arithmetic mean is given as:
\(\frac{ w1x1 + w2x2 + .... + wnxn}{w1 + w2 + .... + wn}\)
=25x30+8x40+12x32/ 25+8+12
(750+320+384) / 45
= 1454 / 45
= 32.31 Rupees
Ques. A family requires the commodities listed in the table below for a month. Each commodity is assigned a weight. Look for the Weighted A.M. (4 marks)

Ans. The x-values represent the price of the provided food item, while the weights represent the quantity (in Kg)
Weighted arithmetic mean is given as:
\(\frac{ w1x1 + w2x2 + .... + wnxn}{w1 + w2 + .... + wn}\)
=25x30+5x30+4x60+8x25+3x65/25+5+4+8+3
=750+100+240+200+195/45
= 1485/45
= 33 Rupees
Ques. For the following data, find the Weighted A.M. (3 marks)

Ans. The x-values represent the price of the provided food item, while the weights represent the quantity (in Kg)
Weighted arithmetic mean is given as:
\(\frac{ w1x1 + w2x2 + .... + wnxn}{w1 + w2 + .... + wn}\)
= (2x45) +(4x12) +(5x15)+(4x50)/ (2 + 4 + 5 + 4)
= (90 + 48 + 75 + 200) / 15
= 413/15
= 27.53 Rupees
Ques. The weights of the integers 40, 45, 80, 75, and 10 are 1, 2, 3, 4, and 5 accordingly. For the given data set, find the weighted mean. (3 marks)
Ans. Weighted arithmetic mean is given as:
=\(\frac{ w1x1 + w2x2 + .... + wnxn}{w1 + w2 + .... + wn}\)
= \(\frac{40×1+45×2+80×3+75×4+10×5}{1+2+3+4+5}\)
= 720/15
= 48
Ques. When should a Weighted Average be used? (2 marks)
Ans. When some data values are judged to be more essential than others and we want them to contribute more to the final 'average,' we employ a weighted average or weighted mean. This works in the same way that certain professors or teachers assign grades to their students.
Ques. What are descriptive statistics, and how do you use them? (2 marks)
Ans. A descriptive statistic is a summary statistic that quantifies or summarises aspects from a set of data, whereas descriptive statistics is the process of applying and analyzing those statistics (in the mass noun sense). In contrast to inferential (or inductive) statistics, descriptive statistics try to summarise a sample rather than learning about the population that the sample of data is supposed to represent.
Ques. What is Standard Deviation? (3 marks)
Ans. The standard deviation is a statistical measure of how much a set of values varies or disperses. A low standard deviation implies that the values are close to the set's mean (also known as the anticipated value), whereas a large standard deviation shows that the values are spread out over a wider range.
The lower-case Greek symbol sigma, for the population standard deviation, or the Latin letter s, for the sample standard deviation, is the most often used abbreviation for standard deviation in mathematical books and formulae.
Ques. What is a data set? (2 marks)
Ans. A data set (also known as a dataset) is a group of information. In the case of tabular data, a data set corresponds to one or more database tables, with each column of a table representing a single variable and each row representing a specific record of the data set. The data set lists values for each of the variables, such as object height and weight, for each member of the data set. A data set can also be a collection of papers or files.
Ques. What is the meaning of weighted median? (2 marks)
Ans. In statistics, the 50 percent weighted percentile is the weighted median of a sample. F. Y. Edgeworth was the first to propose it in 1888. It's similar to the median in that it's a good estimate of central tendency that's resistant to outliers. It allows for non-uniform statistical weights due to, for example, the sample's varied precision measurements.
Ques. What is a central tendency? (3 marks)
Ans. In statistics, a central tendency (or central tendency measure) is a typical or central value for a probability distribution. It's also called a distribution center or a hub. The most common measures of central tendency are the arithmetic mean, median, and mode. A median tendency can be calculated for a finite set of values or a theoretical distribution like the normal distribution. Central tendency is described as "the tendency of quantitative data to cluster around some central value," as defined by some writers.
Also Read:



Comments