




The handwritten notes for Class 6 Mathematics Ganita Prakash Chapter 4 Data Handling and Presentation are prepared for quick 2026-27 revision. The PDF covers data collection, tally marks, frequency tables, pictographs, bar graphs, scales and graph-reading mistakes.
- Best use: revise the chapter before class tests, homework correction and graph practice.
- PDF focus: data tables, pictograph keys, bar graph scales and short inference checks.
- Chapter value: this chapter teaches students to read numbers from real-life information.
Chapter4DataHandlingandPresentationHandwrittenNotes.pdf?page=1&dpi=150)
Chapter4DataHandlingandPresentationHandwrittenNotes.pdf?page=2&dpi=150)
Chapter4DataHandlingandPresentationHandwrittenNotes.pdf?page=3&dpi=150)
Chapter4DataHandlingandPresentationHandwrittenNotes.pdf?page=4&dpi=150)
Chapter4DataHandlingandPresentationHandwrittenNotes.pdf?page=5&dpi=150)
Chapter4DataHandlingandPresentationHandwrittenNotes.pdf?page=6&dpi=150)
Chapter4DataHandlingandPresentationHandwrittenNotes.pdf?page=7&dpi=150)
Chapter4DataHandlingandPresentationHandwrittenNotes.pdf?page=8&dpi=150)
Chapter4DataHandlingandPresentationHandwrittenNotes.pdf?page=9&dpi=150)
Chapter4DataHandlingandPresentationHandwrittenNotes.pdf?page=10&dpi=150)
Chapter4DataHandlingandPresentationHandwrittenNotes.pdf?page=11&dpi=150)
Chapter4DataHandlingandPresentationHandwrittenNotes.pdf?page=12&dpi=150)
Chapter4DataHandlingandPresentationHandwrittenNotes.pdf?page=13&dpi=150)
Chapter4DataHandlingandPresentationHandwrittenNotes.pdf?page=14&dpi=150)
Chapter4DataHandlingandPresentationHandwrittenNotes.pdf?page=15&dpi=150)
Chapter4DataHandlingandPresentationHandwrittenNotes.pdf?page=16&dpi=150)
Chapter4DataHandlingandPresentationHandwrittenNotes.pdf?page=17&dpi=150)
Chapter4DataHandlingandPresentationHandwrittenNotes.pdf?page=18&dpi=150)
Chapter4DataHandlingandPresentationHandwrittenNotes.pdf?page=19&dpi=150)
Chapter4DataHandlingandPresentationHandwrittenNotes.pdf?page=20&dpi=150)
Chapter4DataHandlingandPresentationHandwrittenNotes.pdf?page=21&dpi=150)
Chapter4DataHandlingandPresentationHandwrittenNotes.pdf?page=22&dpi=150)
Student Feedback: In a Collegedunia study check of 10,200 Class 6 students, most students found graphs easier after writing the key or scale before solving.
Class 6 Mathematics Chapter 4 Handwritten Notes Overview
Data Handling and Presentation teaches students how to collect information and show it clearly. The chapter starts with simple class surveys. It then moves to tally marks, frequency tables, pictographs and bar graphs.
The handwritten PDF keeps every rule beside a small example. This helps students revise the method before solving textbook questions.
Data Handling and Presentation Video Revision
Source: Magnet Brains on YouTube
What These Data Handling Handwritten Notes Cover
The PDF has 22 handwritten pages. Each page focuses on one study point, so students can revise without reading the whole textbook again.
- Data collection: when a question needs a survey and when it does not.
- Tally marks: how groups of five make counting faster.
- Pictographs: how a key changes the meaning of each symbol.
- Bar graphs: how scale, equal width and zero marking matter.
How to Revise Data Handling and Presentation Quickly
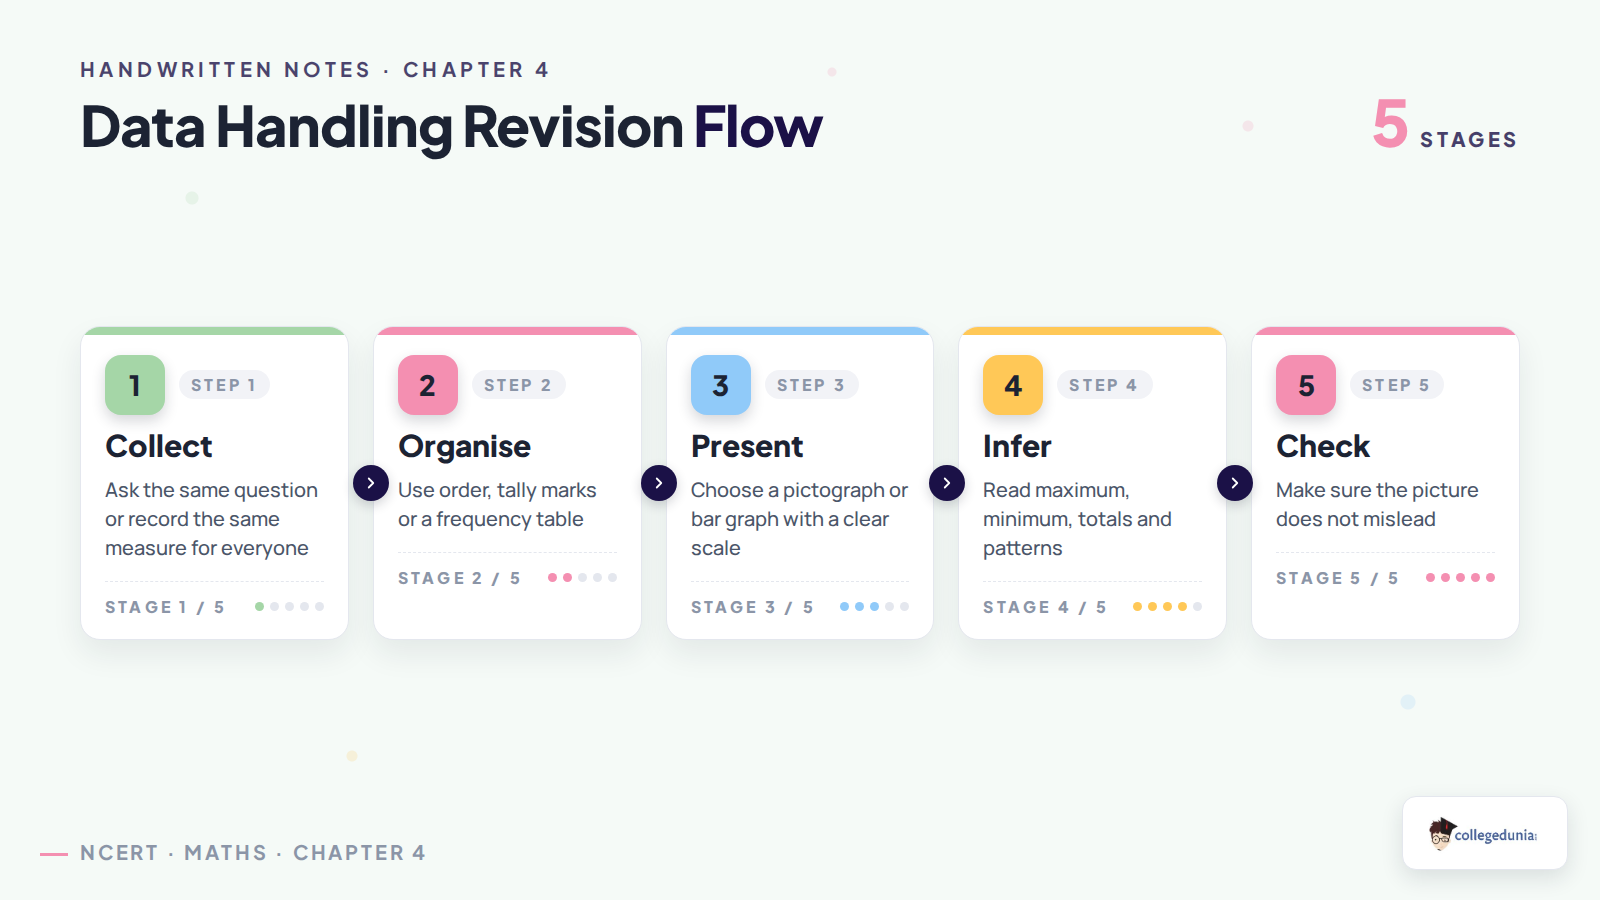
Start with the question being asked. Then decide whether the data is a list, a table, a pictograph or a bar graph. This keeps the method simple.
| Topic | Fast Revision Check | Common Trap |
|---|---|---|
| Tally marks | Count full groups of five first. | Counting every stroke again. |
| Frequency table | Frequency means number of times. | Mixing category and count. |
| Pictograph | Read the key before counting. | Assuming one symbol means one item. |
| Bar graph | Trace the bar top to the scale. | Reading from the wrong axis. |
Pictograph and Bar Graph Difference
A pictograph uses symbols. A bar graph uses bars of equal width. Both show data, but they do it in different ways.
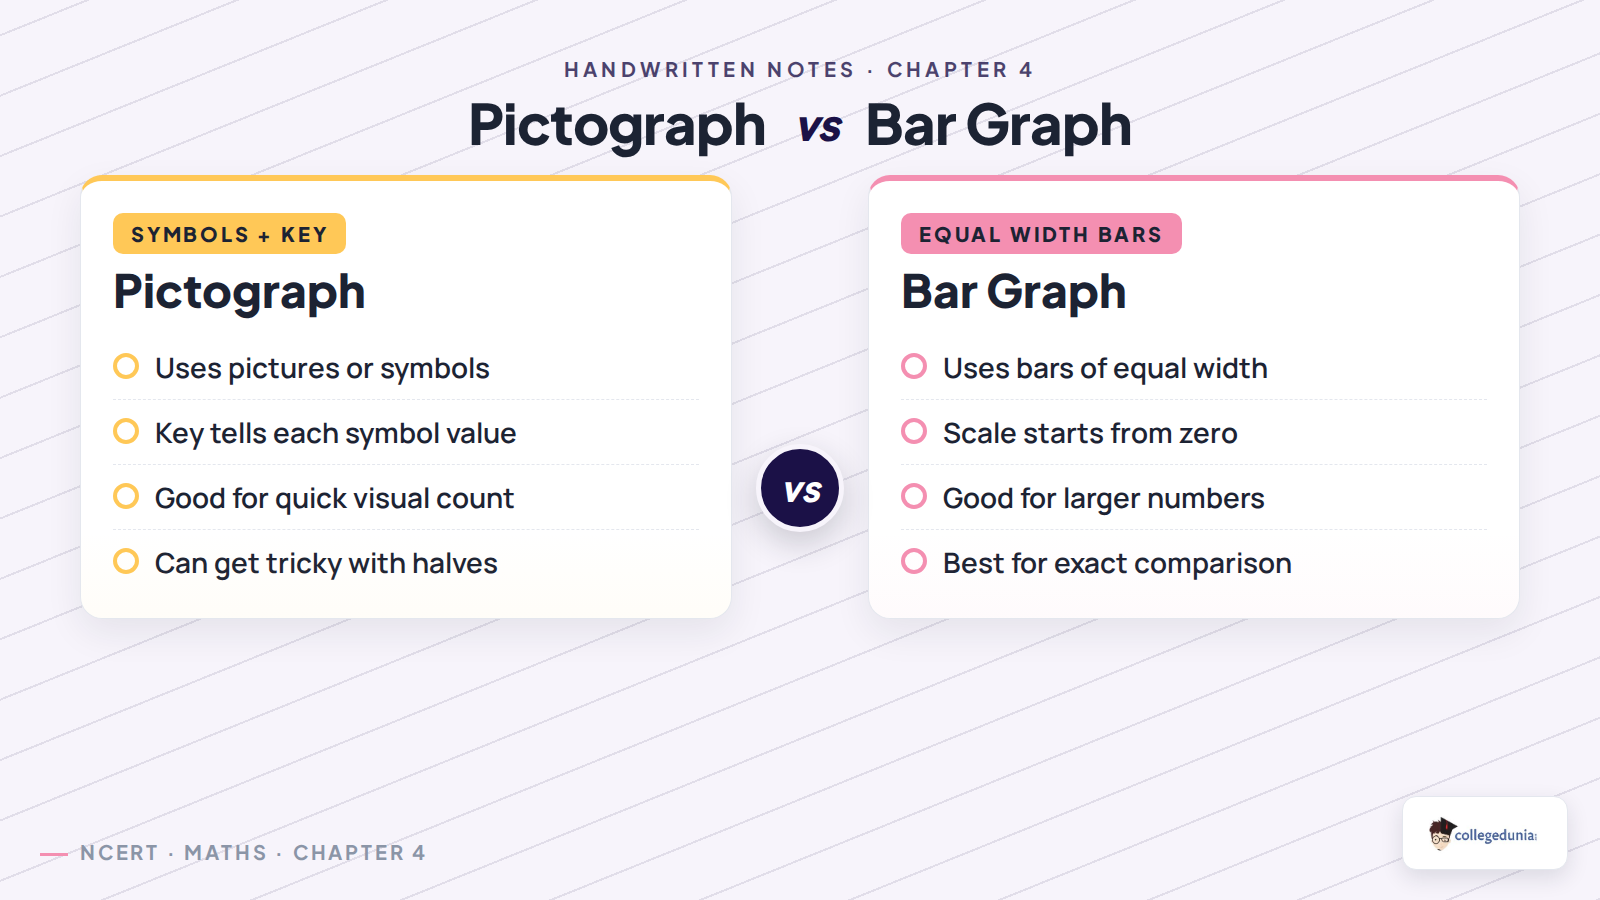
Use a pictograph when symbols make the data easy to see. Use a bar graph when exact comparison is more important.
Important Formulas and Rules for Chapter 4
This chapter has more rules than formulas. Students should remember these rules before solving the Figure it Out questions.
- Frequency means how many times a value or category occurs.
- Total from a table means value multiplied by frequency, then added.
- Pictograph count means number of symbols multiplied by key value.
- Bar height depends on the chosen scale.
- Maximum and minimum can be found from the tallest and shortest bars.
Common Mistakes in Data Handling Class 6
Most mistakes in this chapter happen because students start counting before reading the key or scale. A graph gives the answer only when its labels are read carefully.
- Do not skip the key in a pictograph.
- Do not use unequal bar widths in a bar graph.
- Do not start a bar graph scale away from zero.
- Do not compare a pictograph symbol without checking its value.
- Do not add only the first column of a frequency table.
Write the key or scale in words first. This small habit prevents most wrong answers.
Related NCERT Resources for Data Handling Class 6
| Resource | Link |
|---|---|
| NCERT Solutions | Class 6 Mathematics Chapter 4 NCERT Solutions |
| NCERT Notes | Class 6 Mathematics Chapter 4 Notes |
| NCERT Book PDF | Class 6 Mathematics Chapter 4 Book PDF |
More Class 6 Mathematics Handwritten Notes
| Chapter | Handwritten Notes |
|---|---|
| Chapter 1 | Patterns in Mathematics |
| Chapter 2 | Lines and Angles |
| Chapter 3 | Number Play |
| Chapter 5 | Prime Time |
| Chapter 6 | Perimeter and Area |
Data Handling and Presentation Class 6 Handwritten Notes FAQs
Ques. What is covered in Data Handling and Presentation handwritten notes?
Ans. The notes cover data collection, tally marks, frequency tables, pictographs, bar graphs, scales and graph-reading mistakes.
Ques. Are these handwritten notes based on the 2026-27 Ganita Prakash textbook?
Ans. Yes. The PDF follows Class 6 Mathematics Ganita Prakash Chapter 4 for the 2026-27 session.
Ques. How should students revise this chapter from the PDF?
Ans. Students should revise the key, scale and frequency rules first, then solve pictograph and bar graph questions.
Ques. Why are handwritten notes useful for Data Handling and Presentation?
Ans. Handwritten notes keep each rule beside a short example, which helps students revise graph-reading steps quickly.



Comments