



The NCERT Class 11 Economics Chapter 3 Organisation of Data Book PDF gives students the official Statistics for Economics chapter for the 2026-27 syllabus. Use it to read NCERT's explanation of raw data, classification, frequency distribution, tally marks and bivariate tables.
- Book section: official NCERT chapter text, examples, tables and exercise questions.
- Best use: read the PDF before making notes on class intervals and tally marks.
- Revision cue: practise one frequency table from raw marks or income data.
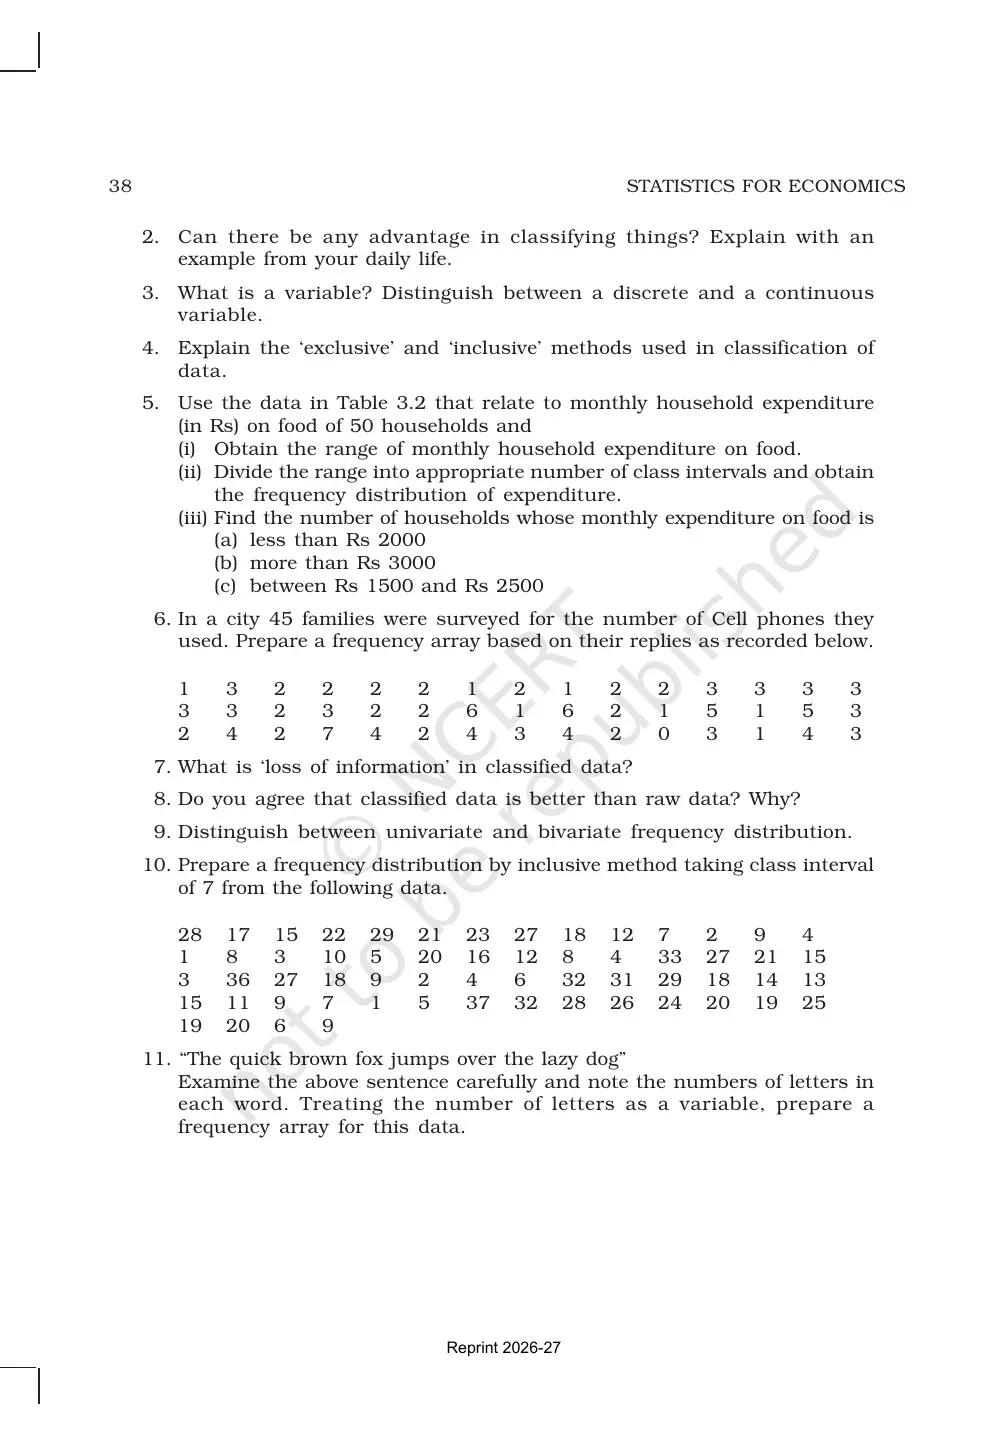
Student Feedback: In a Collegedunia check of 11,240 Class 11 Economics students, 71% said this chapter became easier after they made one tally-mark table by hand.
Organisation of Data Class 11 NCERT Book PDF: What It Covers
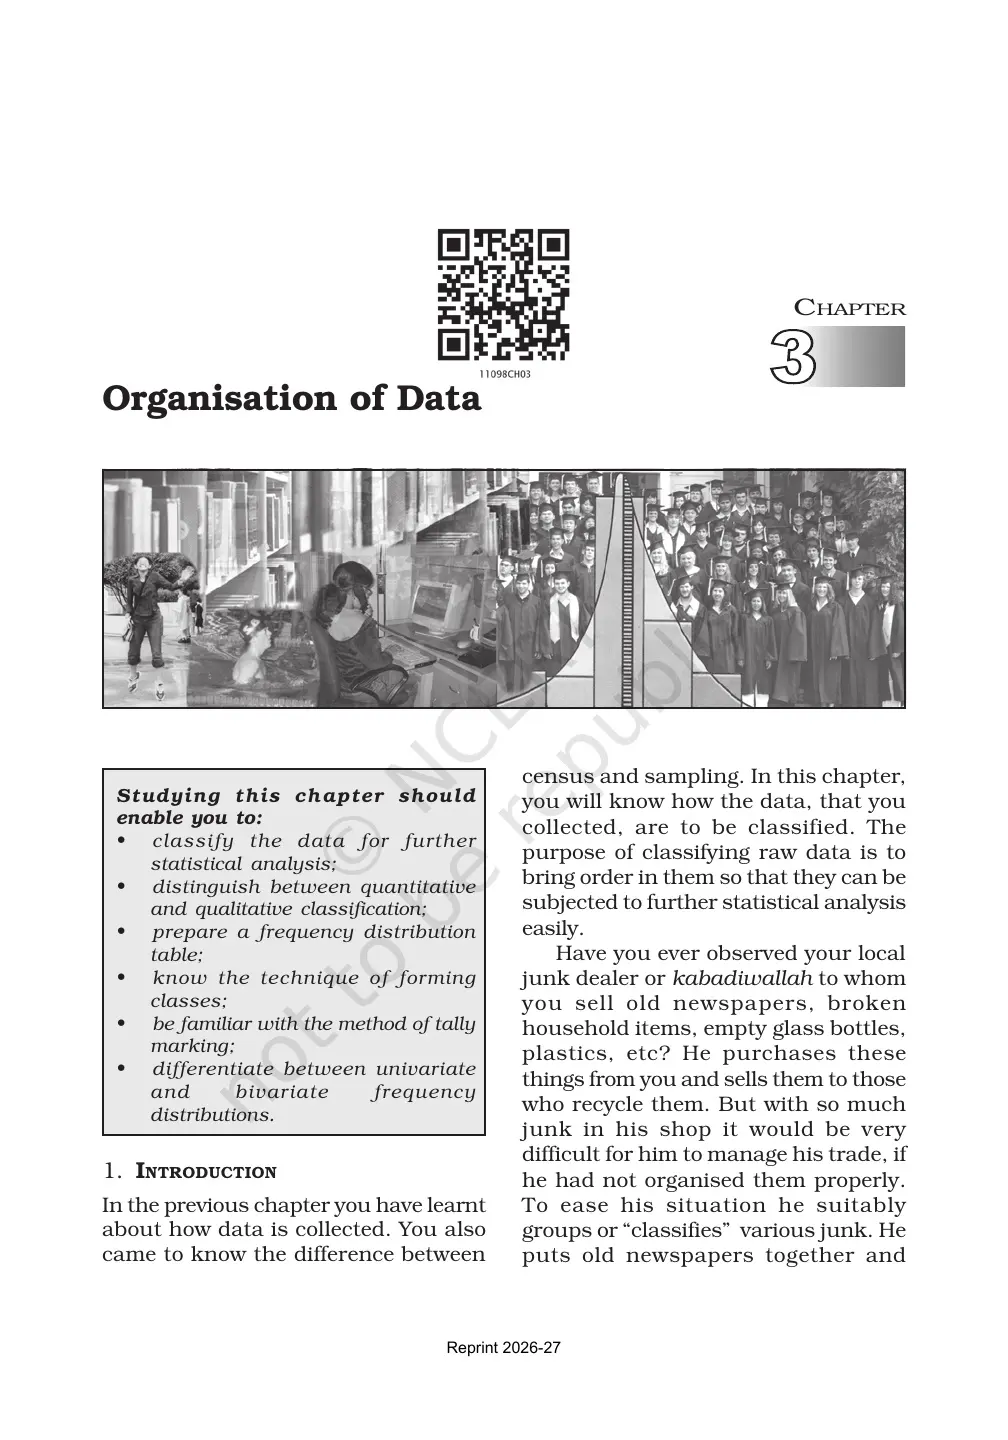
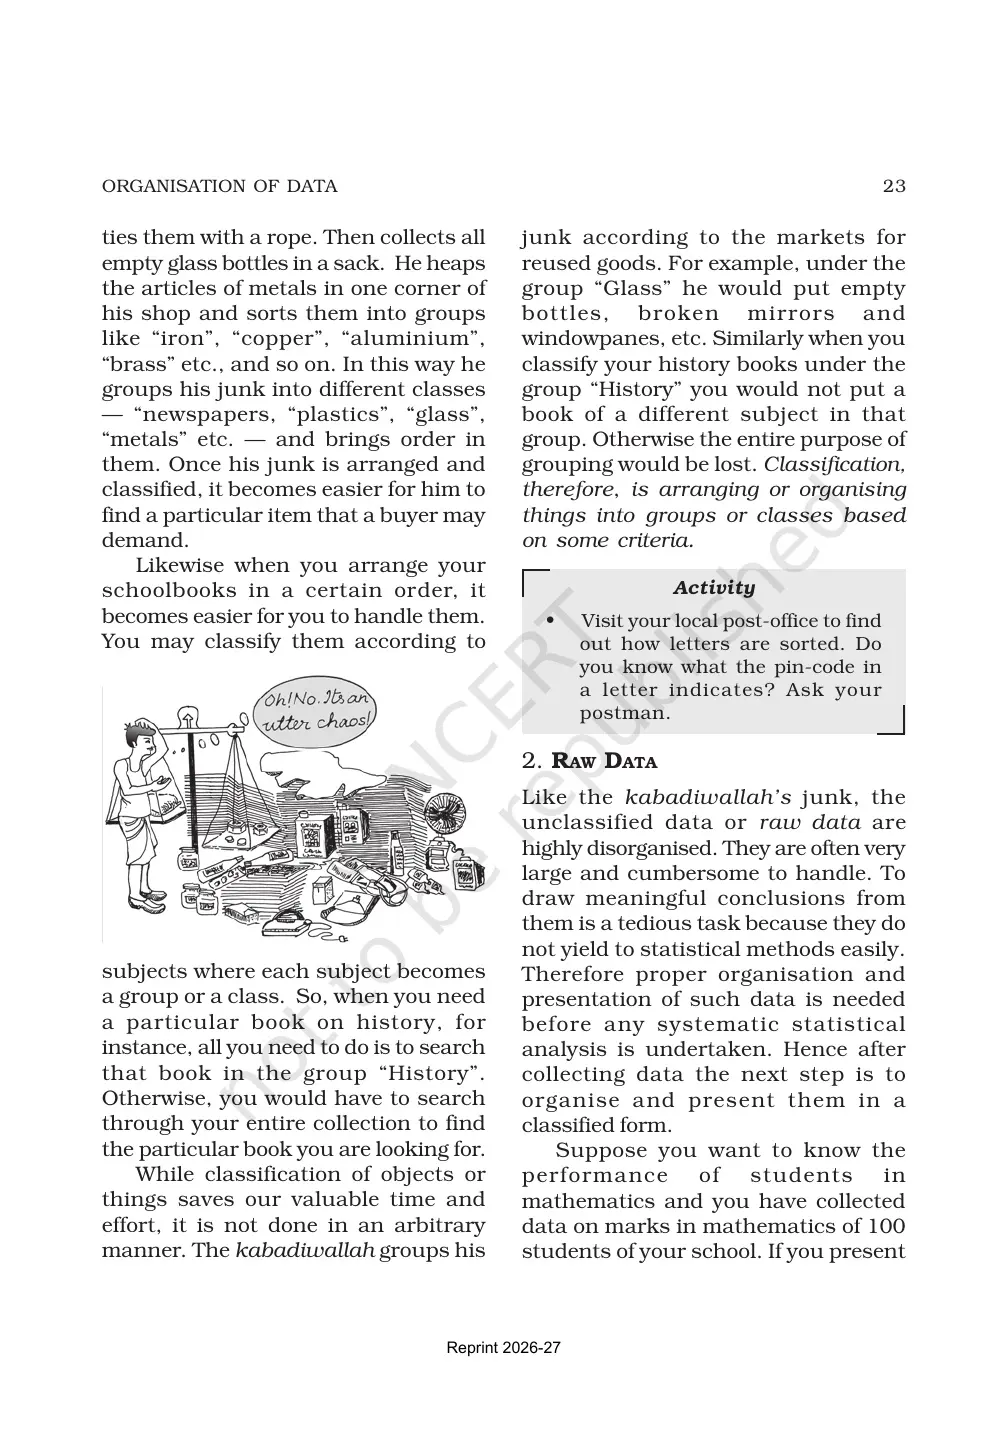
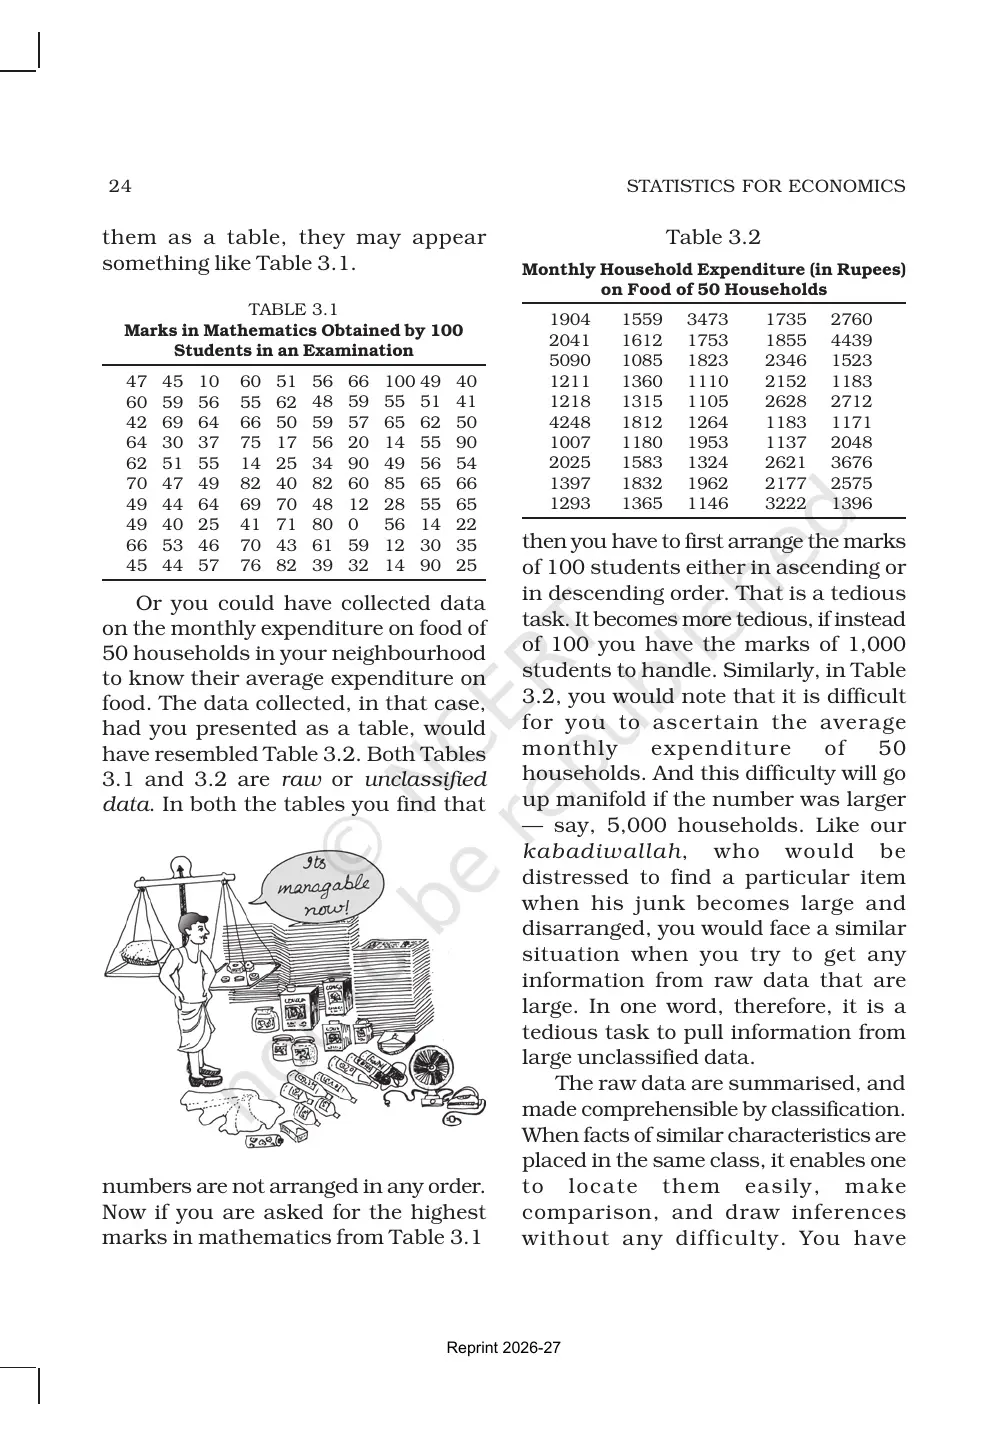
The chapter explains why collected data must be arranged before analysis. NCERT starts with raw data, then moves to classification, class intervals, tally marks and frequency tables.
The PDF is the source text for Chapter 3. It gives the learning outcomes, worked tables, activities and exercise questions in the same order as the official book.
| NCERT area | What students should notice | Answer cue |
|---|---|---|
| Raw data | Unarranged observations are hard to read. | State why grouping is needed. |
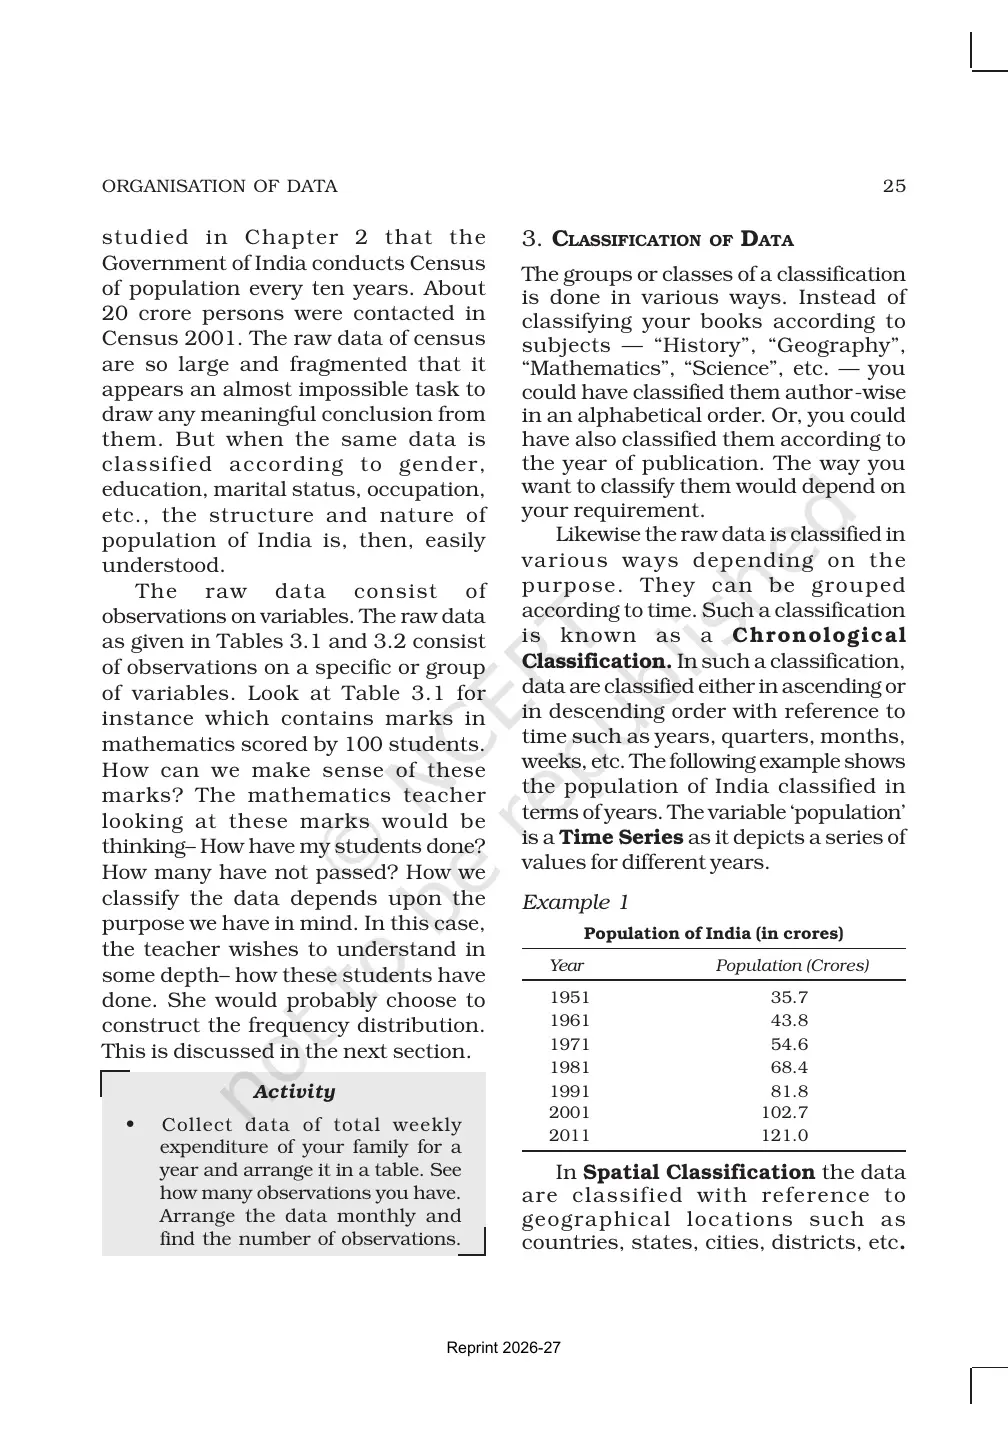
| Classification | Data can be grouped by quality, quantity, time or place. | Give one example for each type. |
| Frequency distribution | Class intervals and frequencies make patterns visible. | Check totals after tallying. |
Organisation of Data Quick Revision for Class 11
Source: Magnet Brains on YouTube
Types of Classification in Organisation of Data
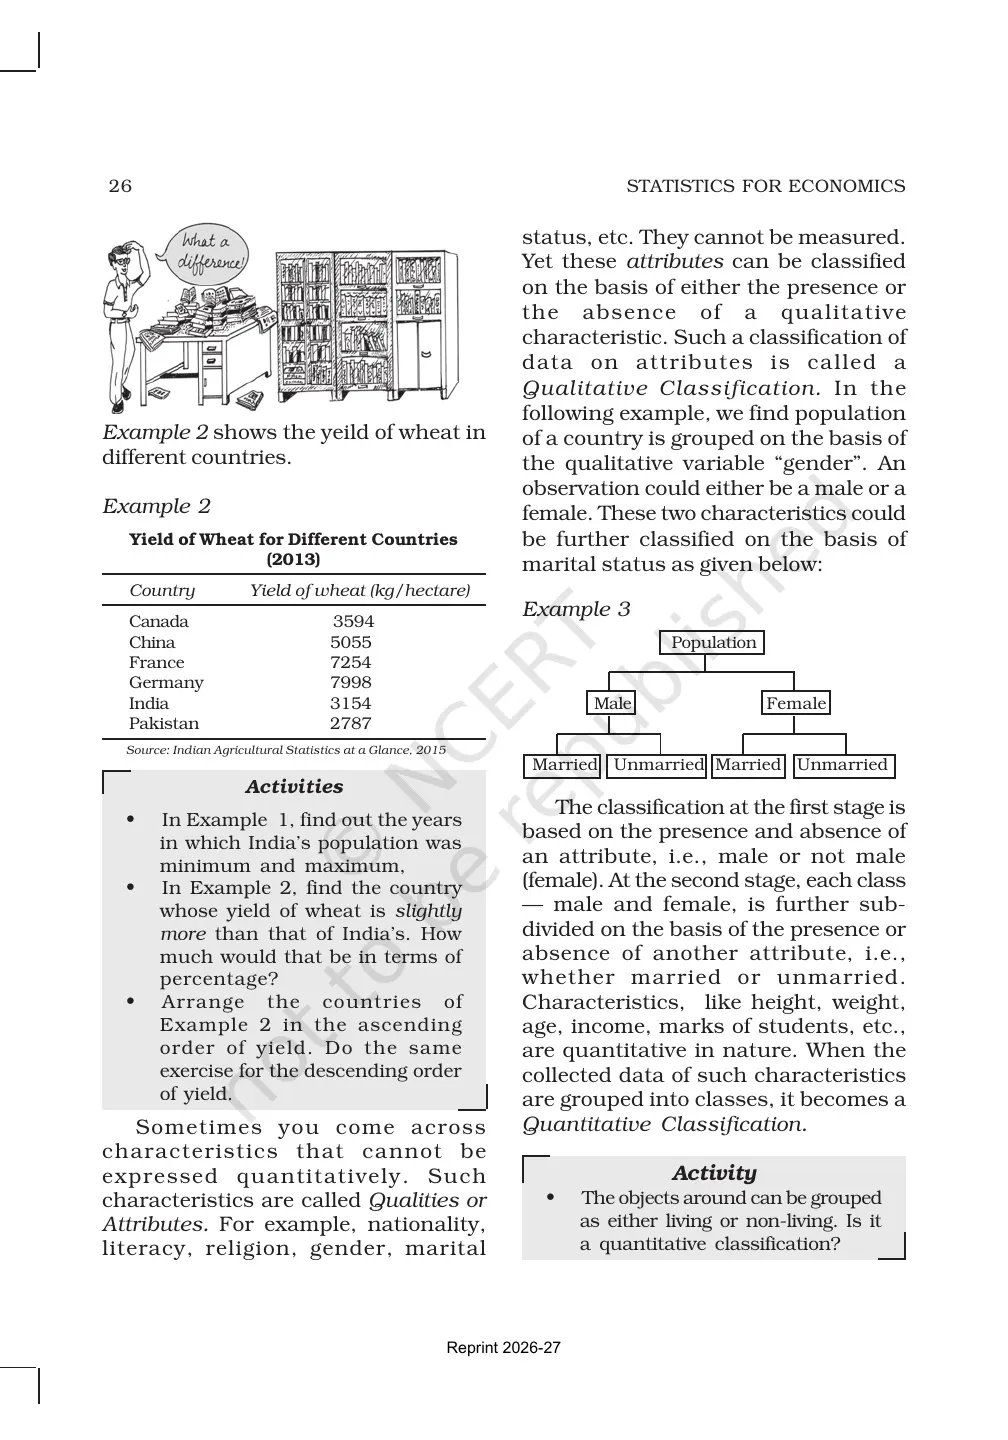
Classification means arranging data into groups based on a clear feature. NCERT uses this idea to make raw observations easier to compare.
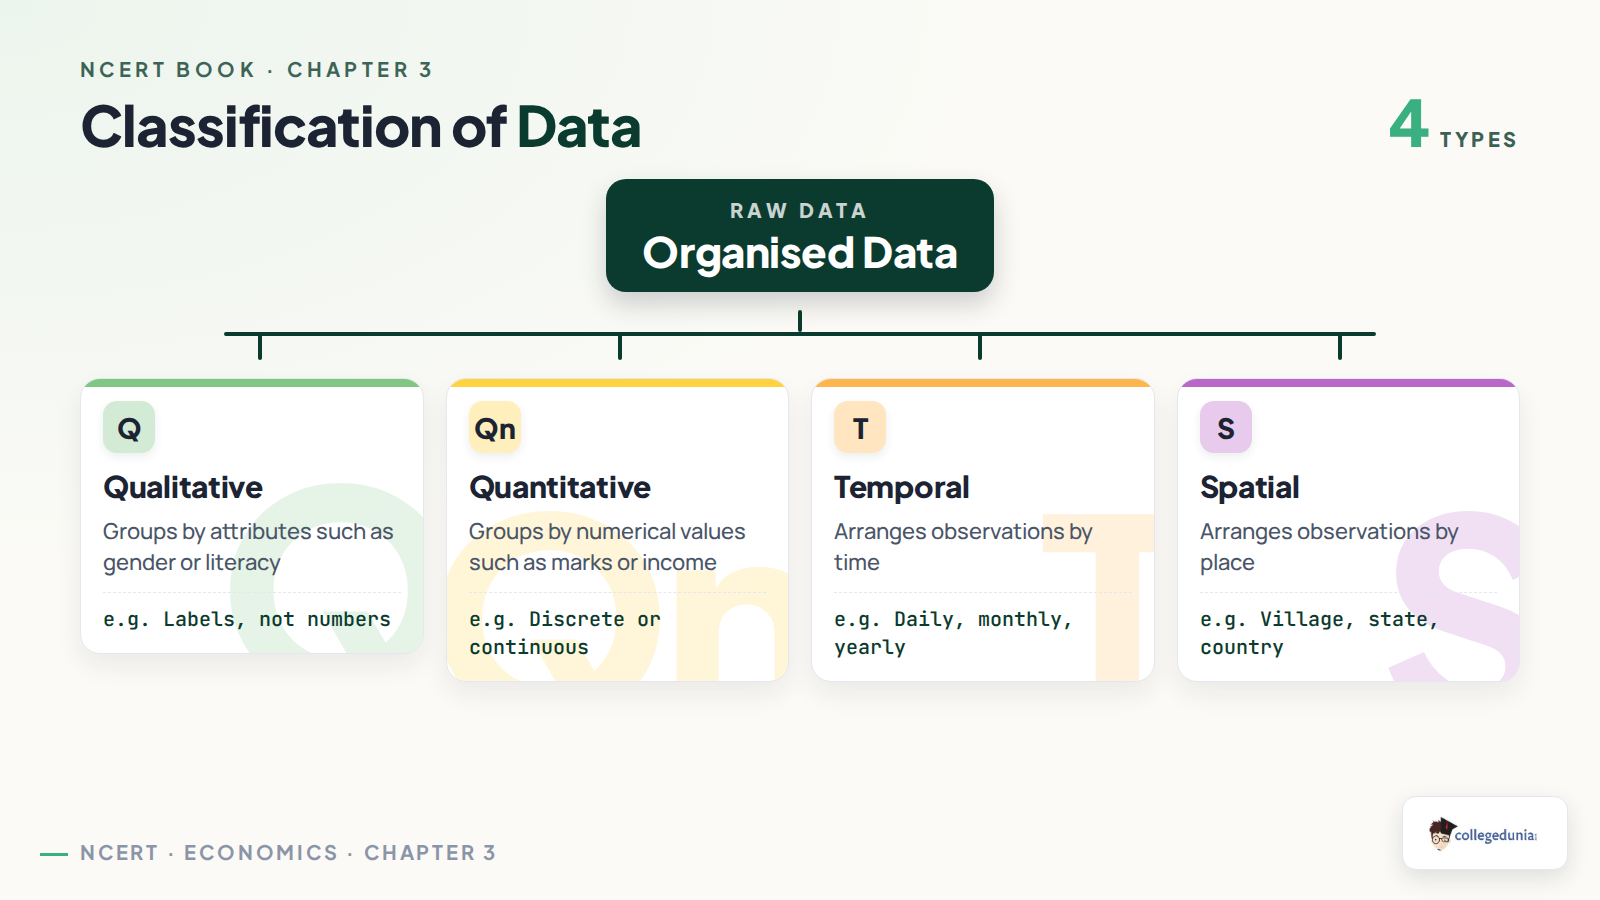
- Qualitative classification: groups data by attributes such as gender or literacy.
- Quantitative classification: groups data by numbers such as marks, income or age.
- Temporal classification: arranges observations according to time.
- Spatial classification: arranges observations according to place.
The main scoring point is to match the grouping basis with the example given in the question.
Frequency Distribution in Organisation of Data
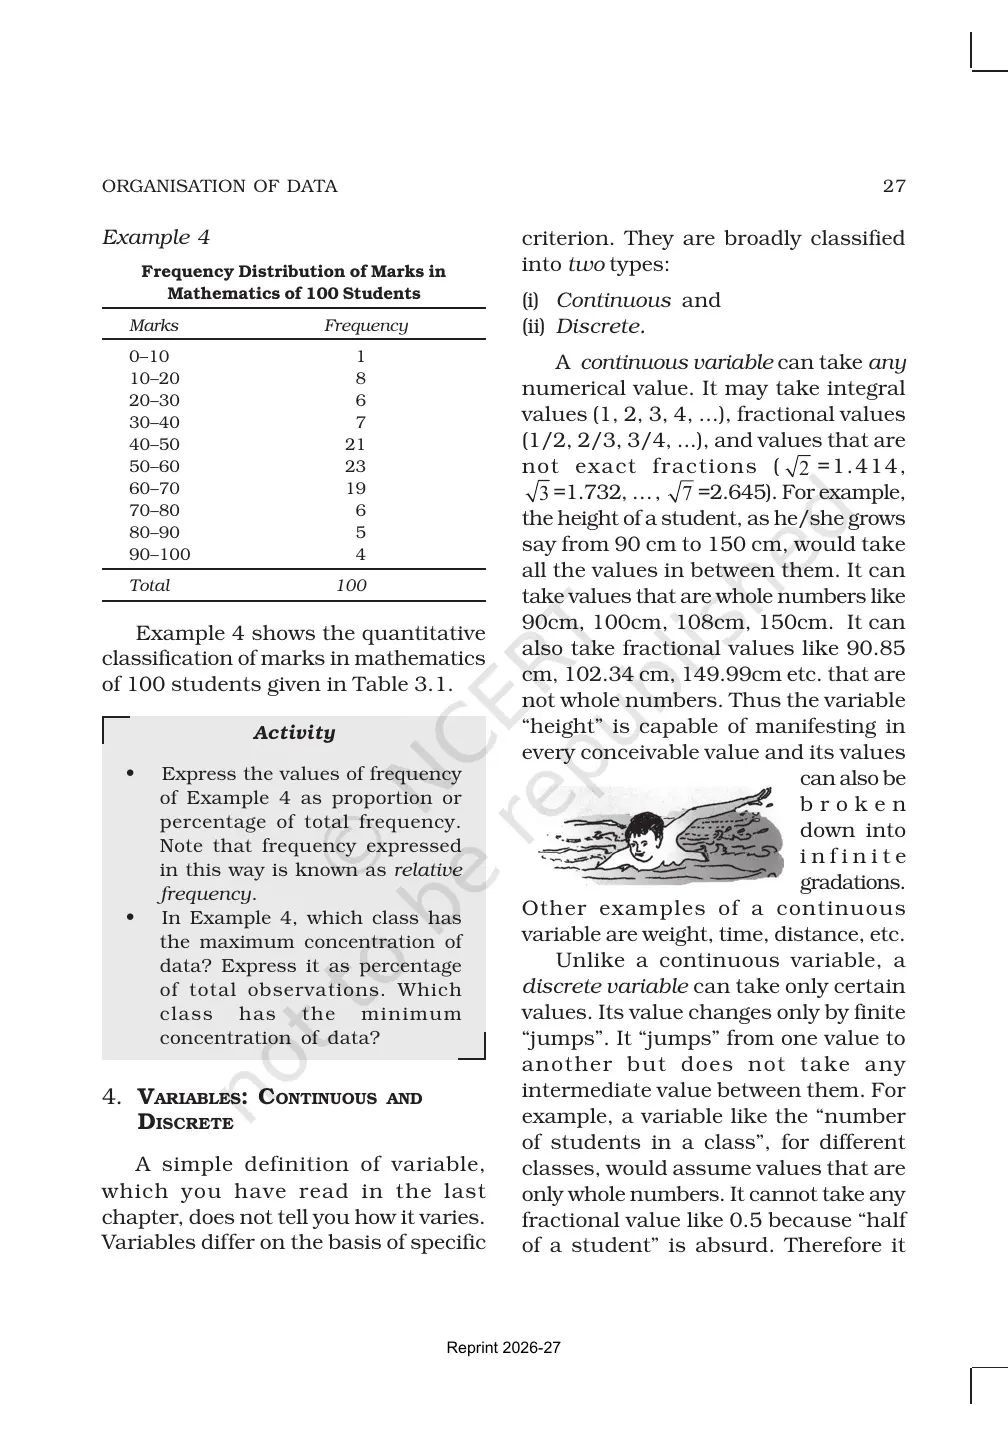
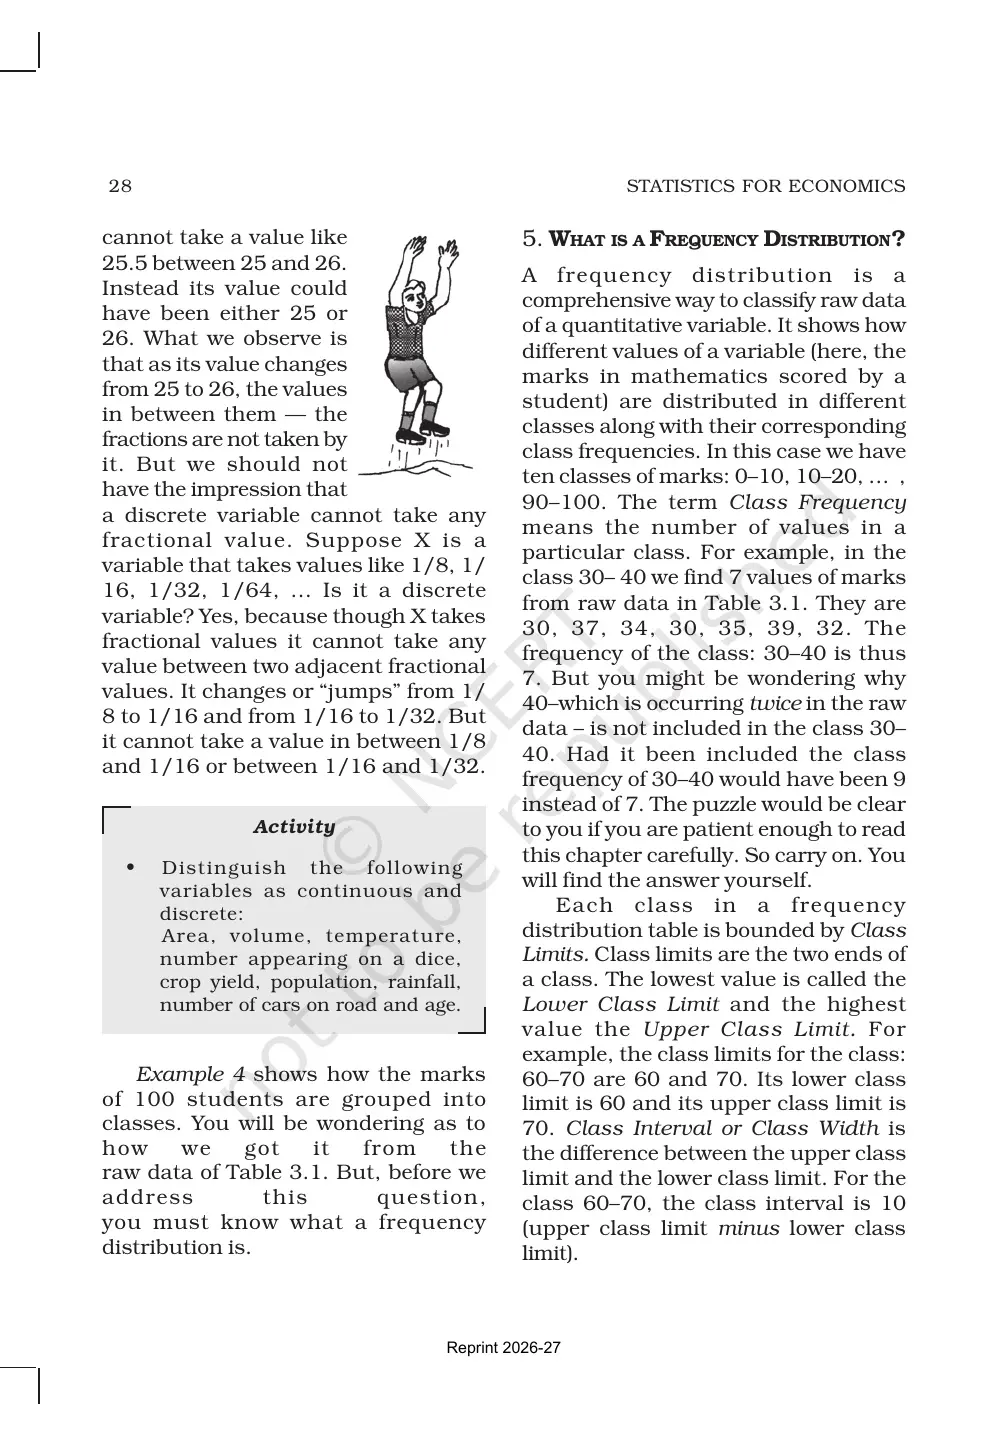
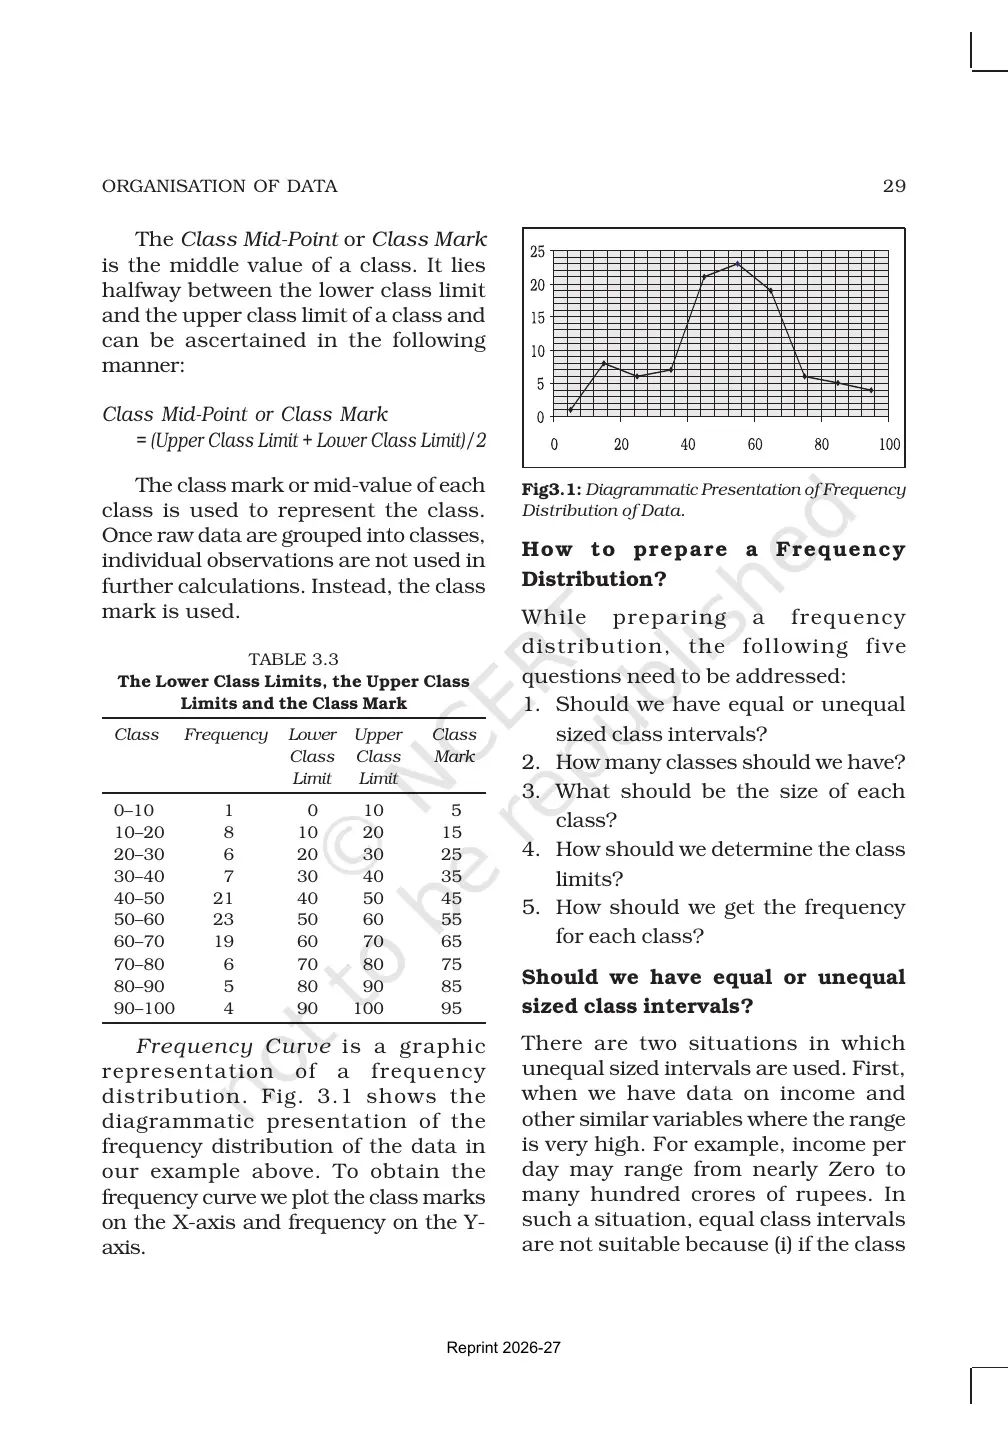
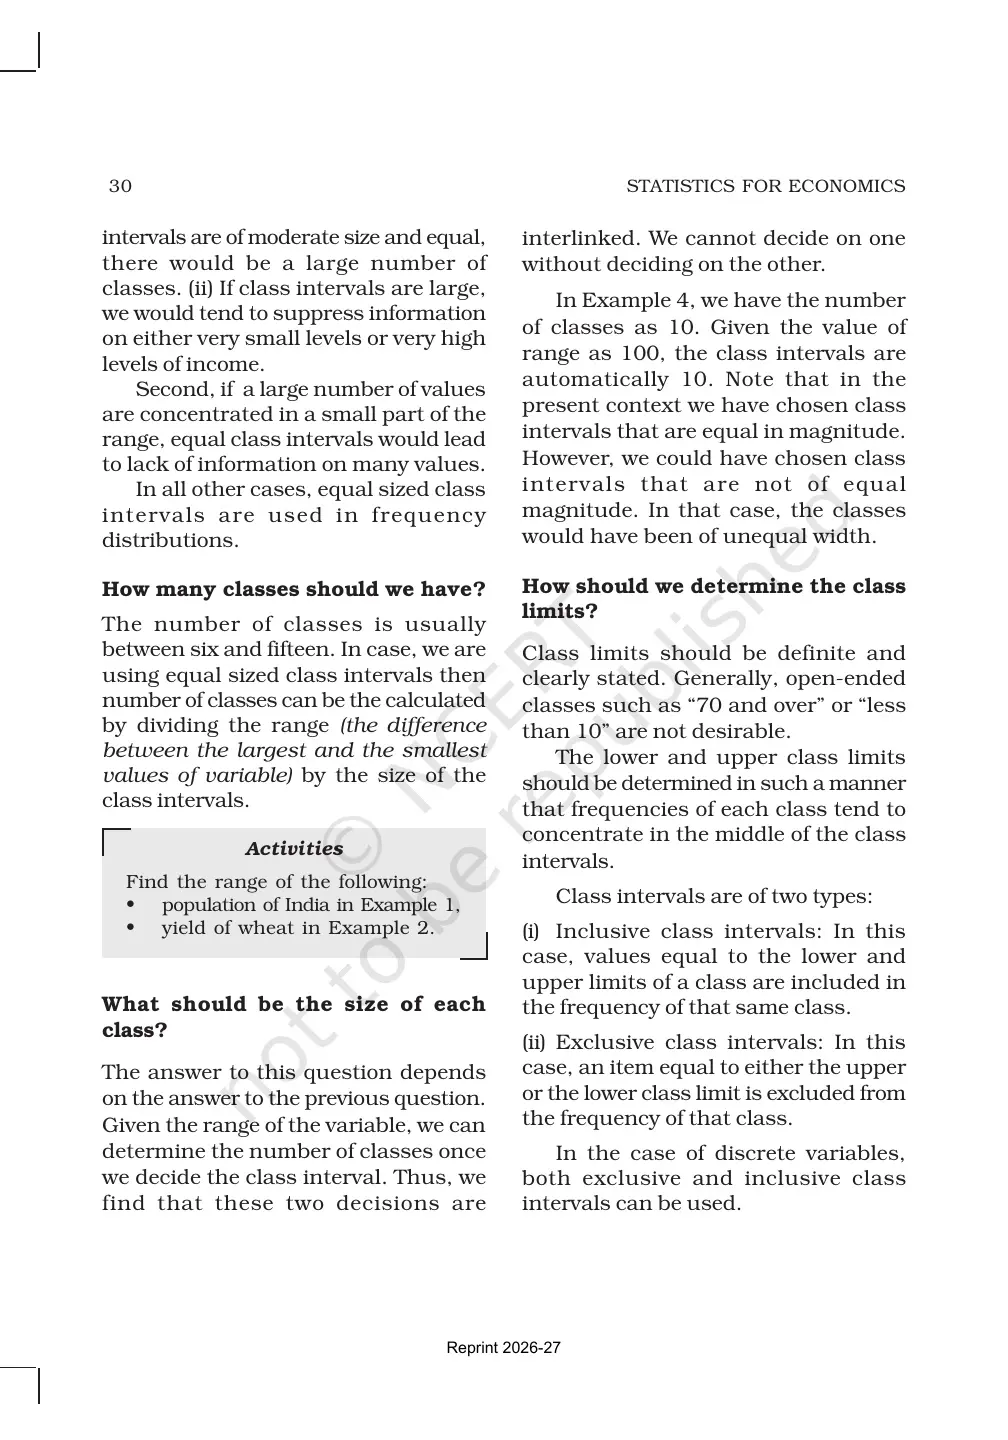
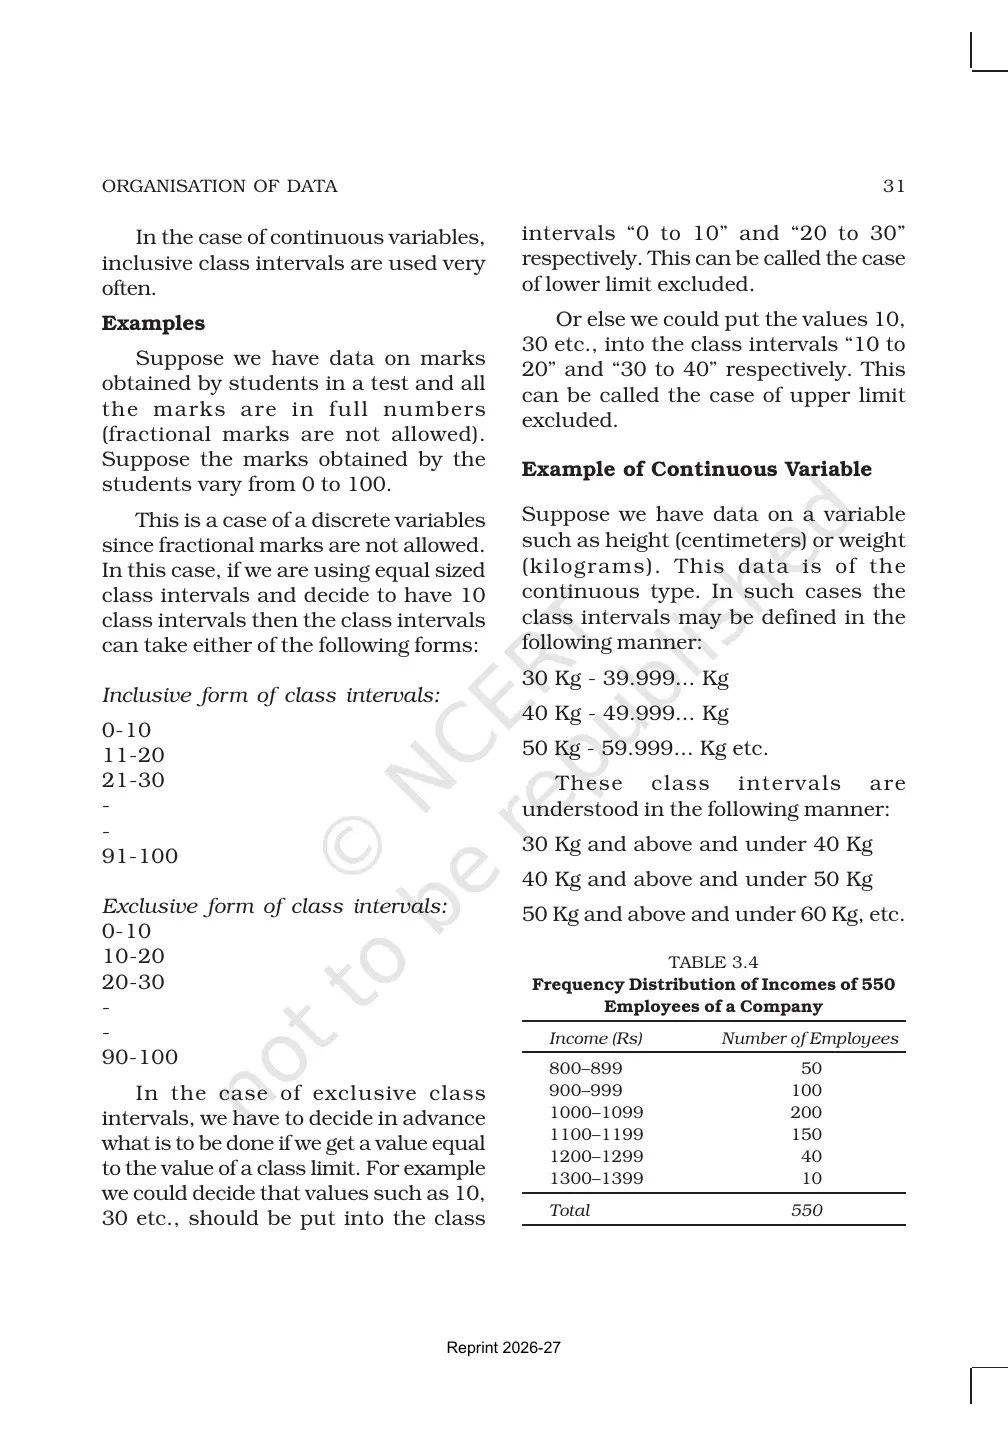
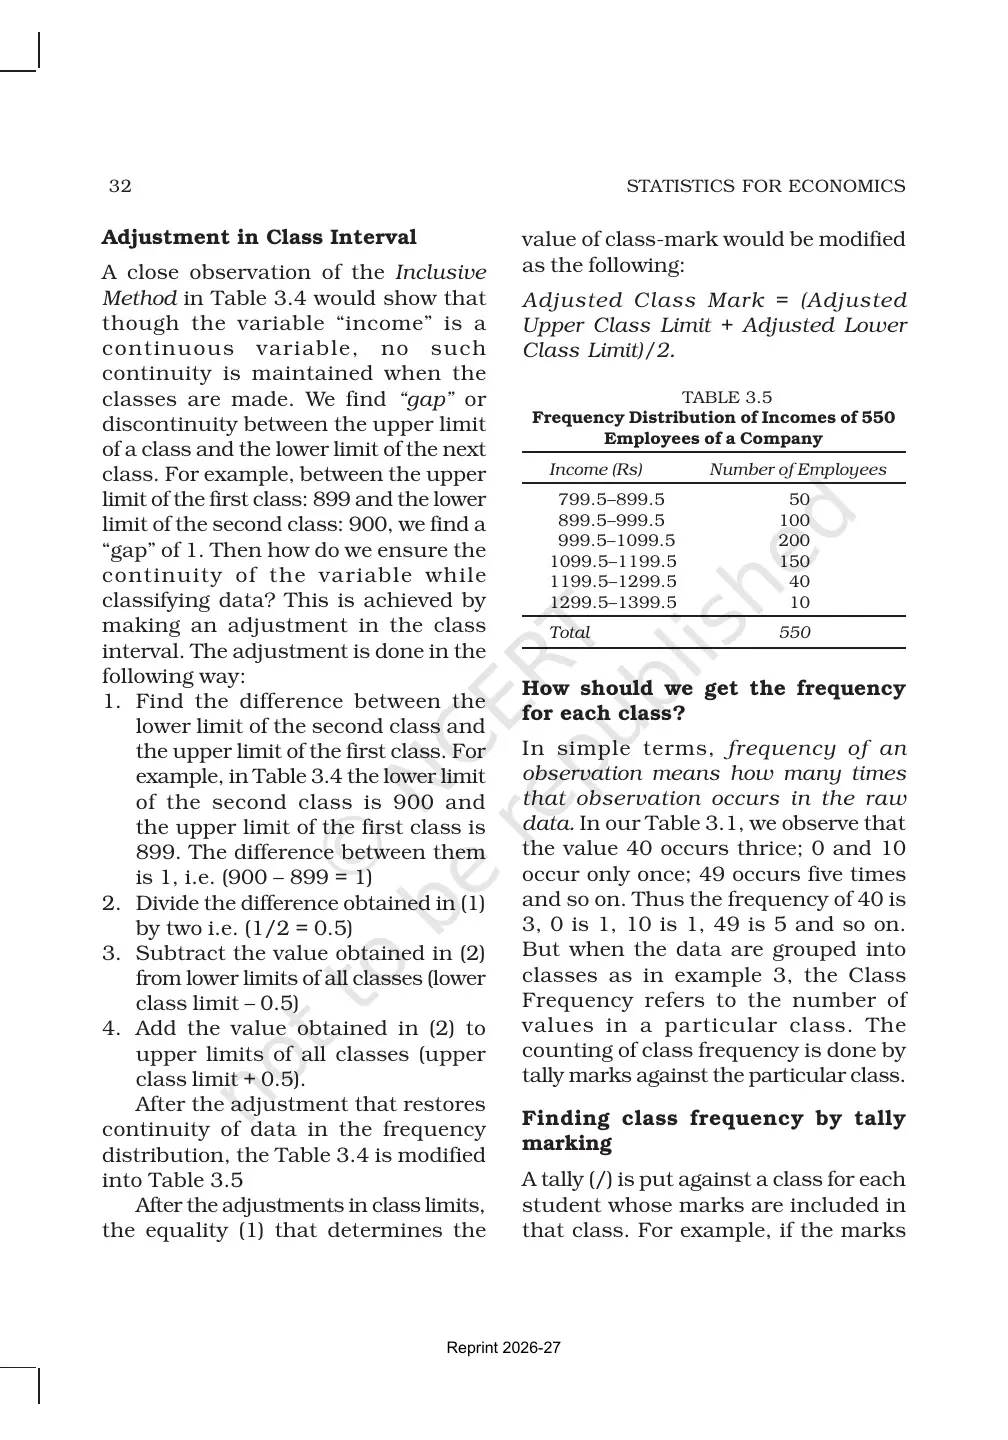
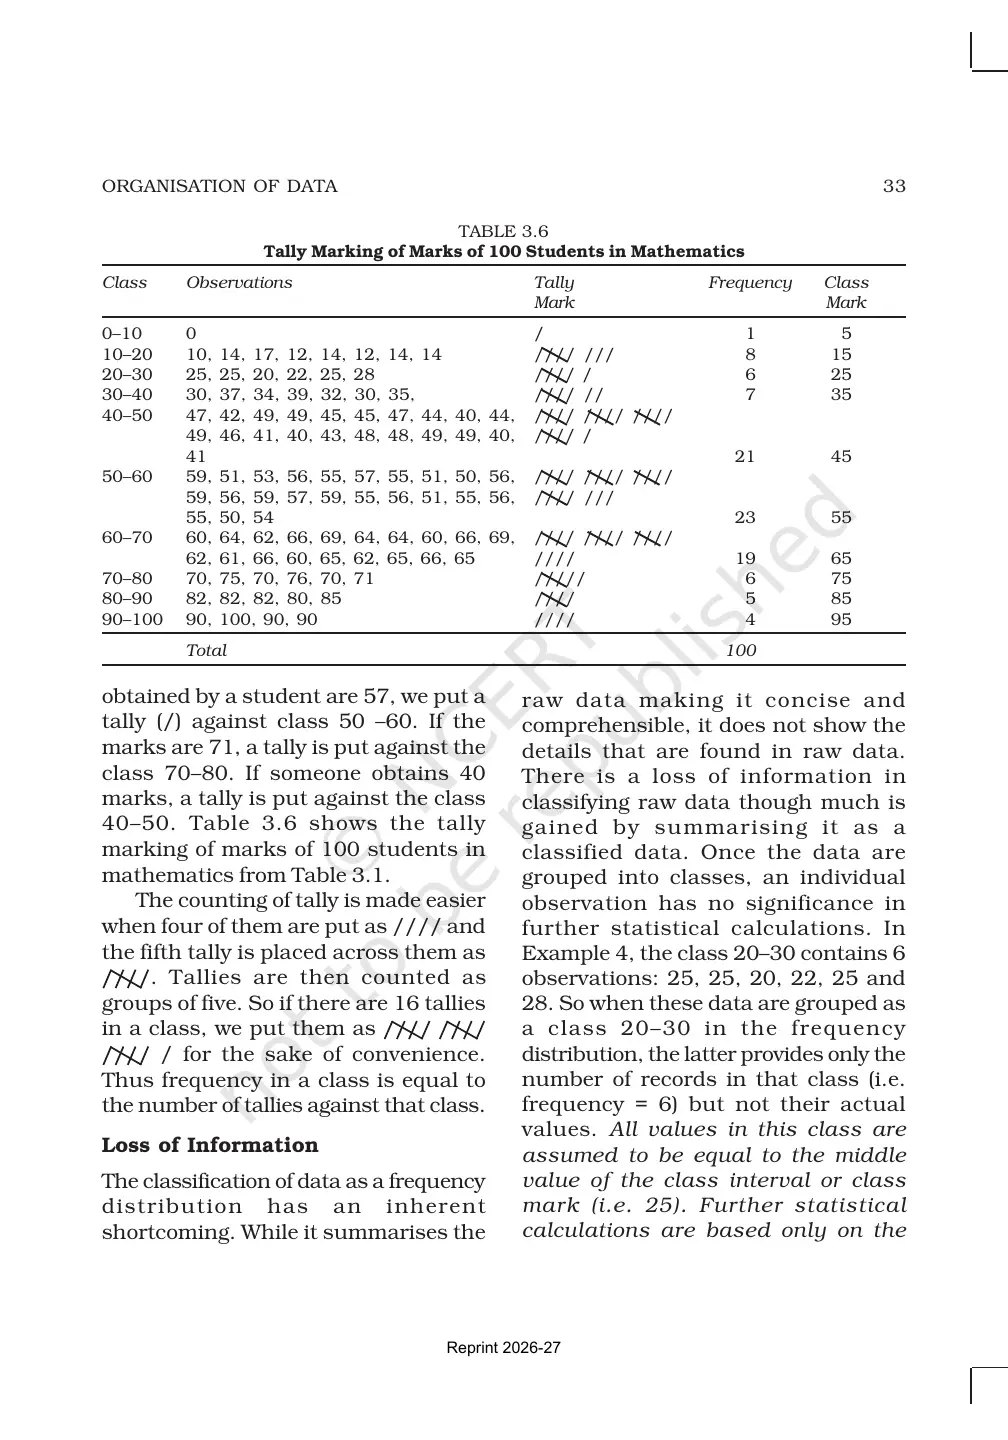
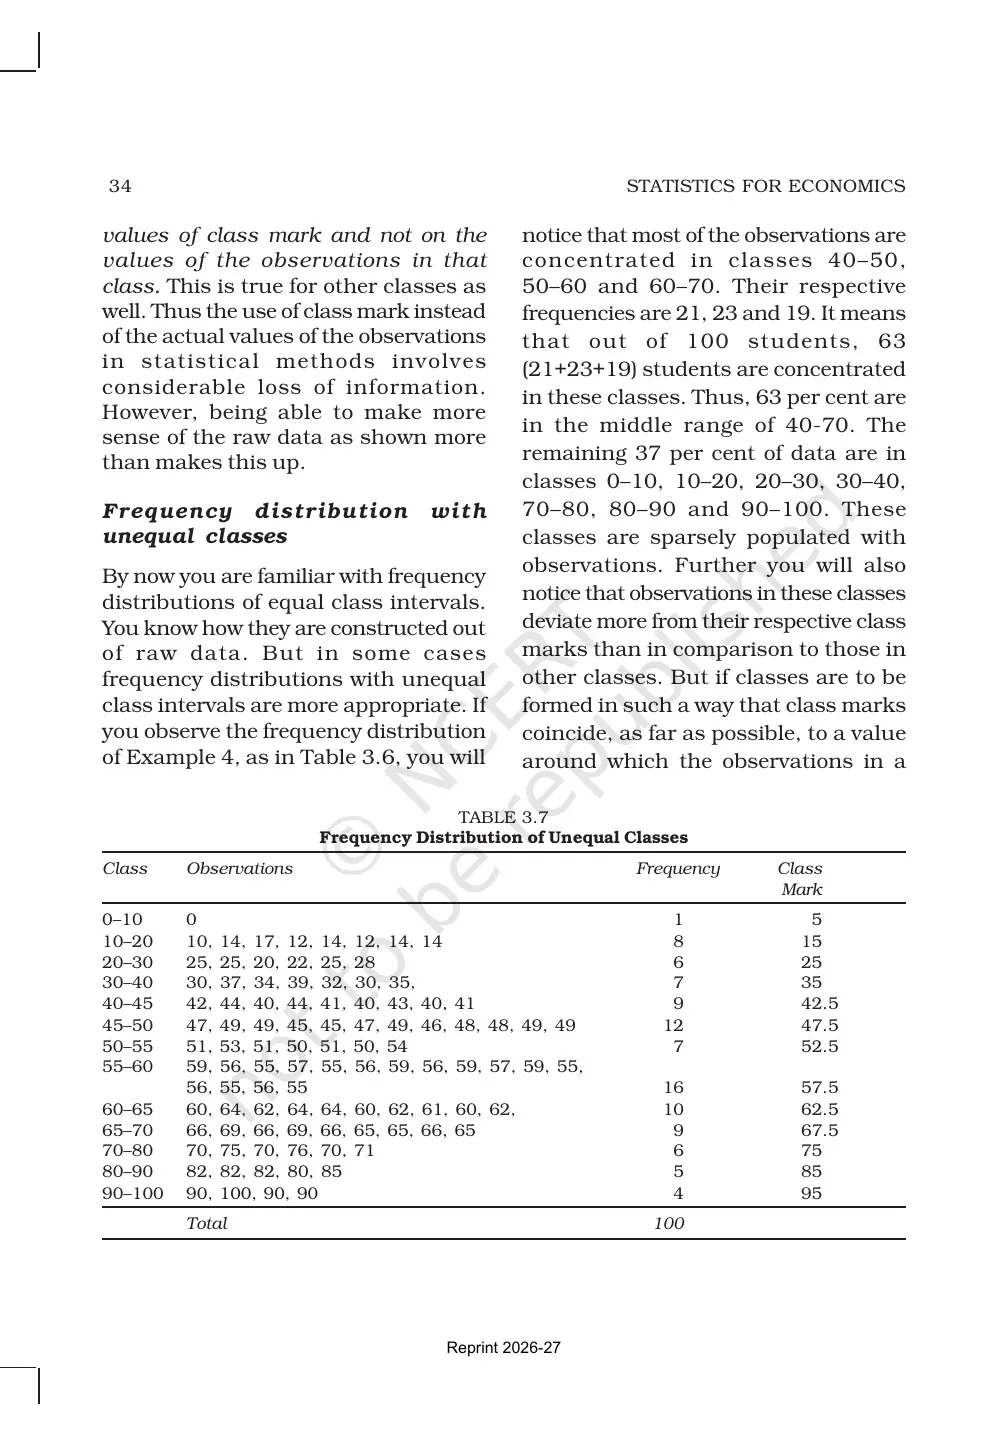
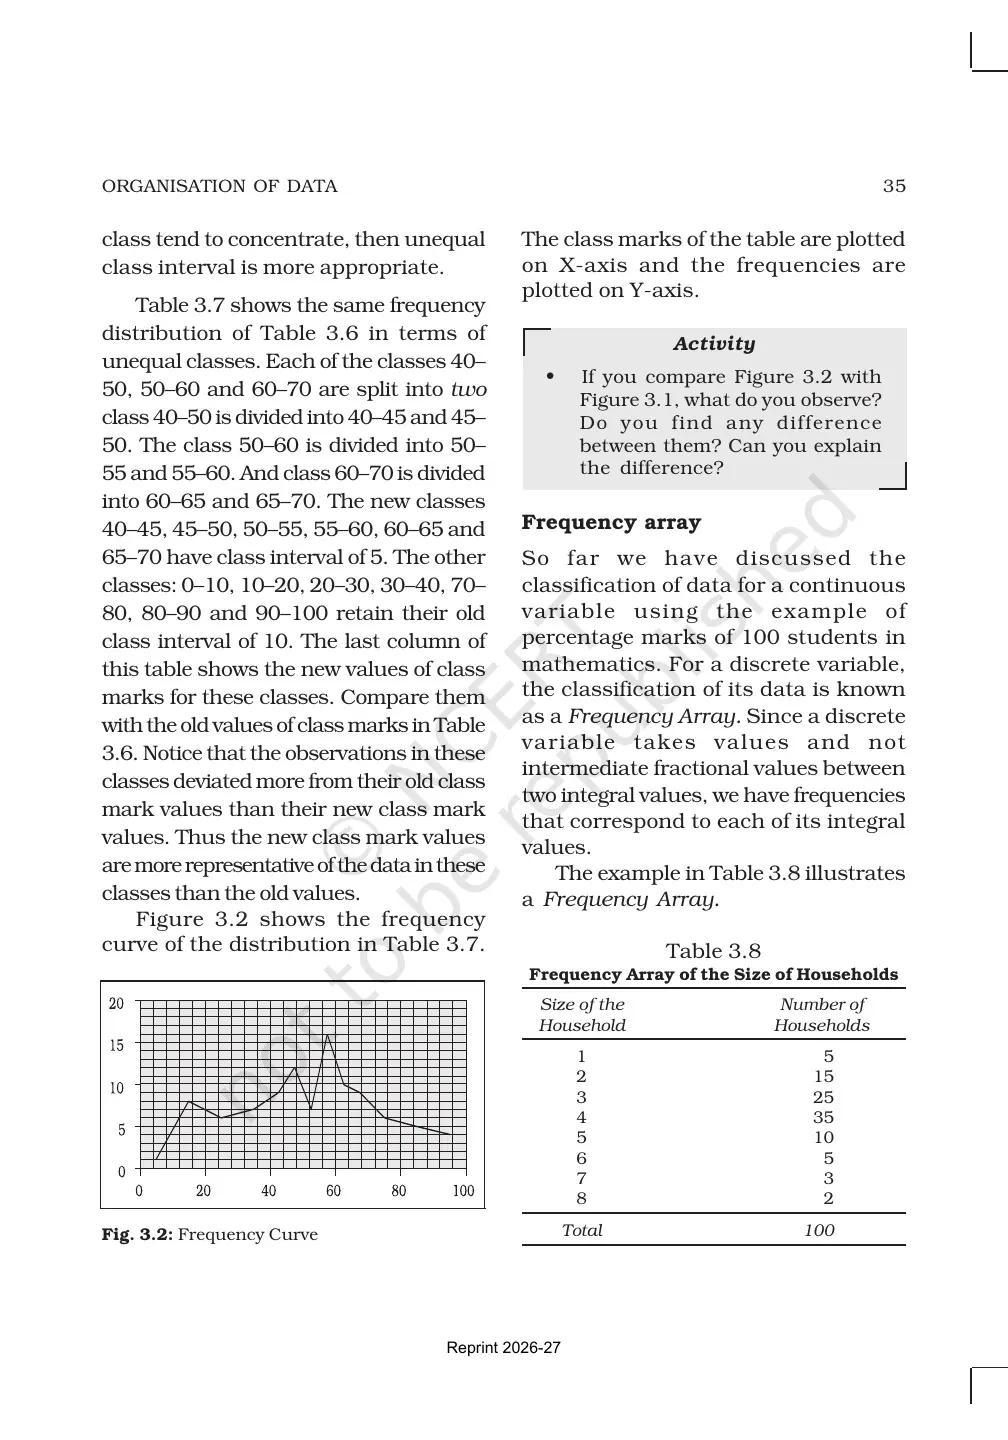
A frequency distribution shows how often each value or class appears. This is where students learn class intervals, limits and tally marks.
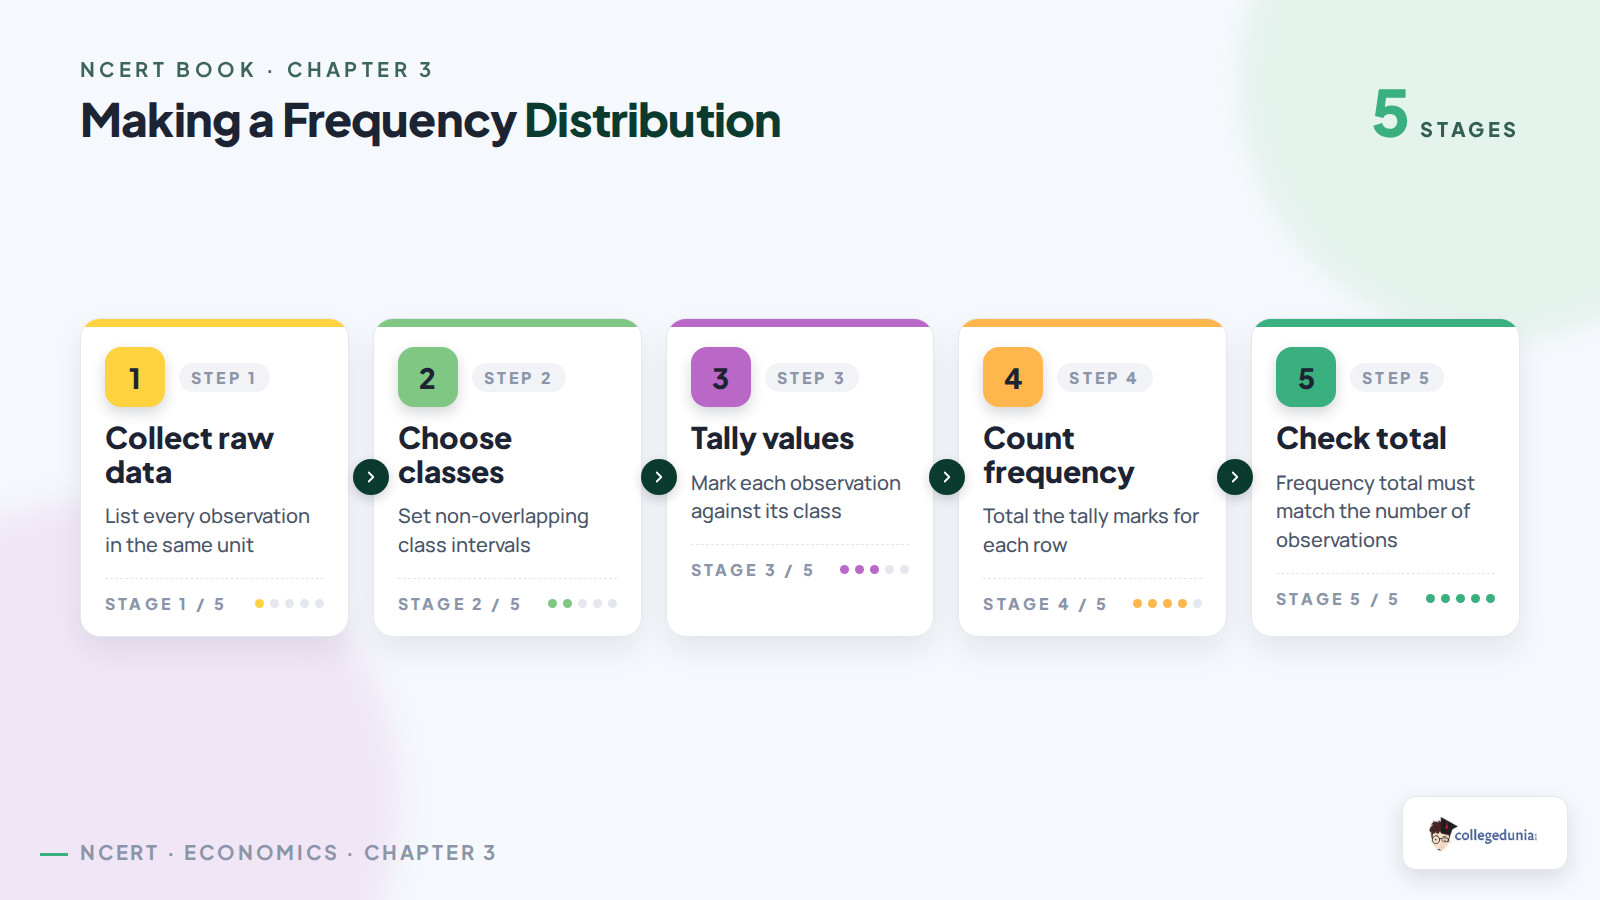
- Collect raw data and keep every observation in the same unit.
- Choose class intervals that do not overlap.
- Use tally marks so each observation is counted once.
- Count frequency and check whether the total matches the data set.
Class Intervals and Tally Marks in Organisation of Data
NCERT explains class intervals with inclusive and exclusive forms. Students should read the lower limit, upper limit and class size carefully before filling the table.
| Term | Meaning | Common mistake |
|---|---|---|
| Lower limit | Smallest value in a class. | Writing it as the midpoint. |
| Upper limit | Largest boundary of a class. | Counting the same value twice. |
| Tally mark | A quick count mark placed against a class. | Forgetting the fifth cross mark. |
| Frequency | Total number of observations in a class. | Not matching the final total. |
In table questions, the total frequency must equal the number of observations in the raw data.
How to Use the Organisation of Data NCERT Book PDF
Read the PDF in three passes. First, underline the types of classification. Second, mark every frequency table. Third, solve the exercise questions without looking at the worked examples.
- For definitions: write meaning plus one example.
- For tables: copy the headings before filling values.
- For class intervals: check whether the method is inclusive or exclusive.
- For revision: pair this PDF with notes after one full reading.
Related Class 11 Economics Resources for Organisation of Data
Also Check: use the official book PDF with notes and practice resources for the same chapter.
| Resource | Best use | Link |
|---|---|---|
| NCERT Notes | Revise classification and frequency tables quickly. | Organisation of Data Notes |
| NCERT Solutions | Practise textbook questions after reading the PDF. | Organisation of Data NCERT Solutions are scheduled. |
| Handwritten Notes | Use for quick visual revision before class tests. | Organisation of Data Handwritten Notes are scheduled. |
Class 11 Economics NCERT Book PDF Chapter Resources
The table below keeps this NCERT Book PDF connected with live Class 11 Economics pages. Chapters 1 to 8 come from Statistics for Economics, and Chapters 9 to 16 come from Indian Economic Development.
| Chapter | Title | Live revision link |
|---|---|---|
| Chapter 1 | Introduction | Introduction Book PDF |
| Chapter 2 | Collection of Data | Collection of Data Book PDF |
| Chapter 3 | Organisation of Data | Current NCERT Book PDF |
| Chapter 4 | Presentation of Data | Presentation of Data Notes |
| Chapter 5 | Measures of Central Tendency | Measures of Central Tendency Notes |
| Chapter 7 | Index Numbers | Index Numbers Notes |
Organisation of Data Class 11 Economics NCERT Book PDF FAQs
Ques. What does the Class 11 Economics Chapter 3 Organisation of Data NCERT Book PDF include?
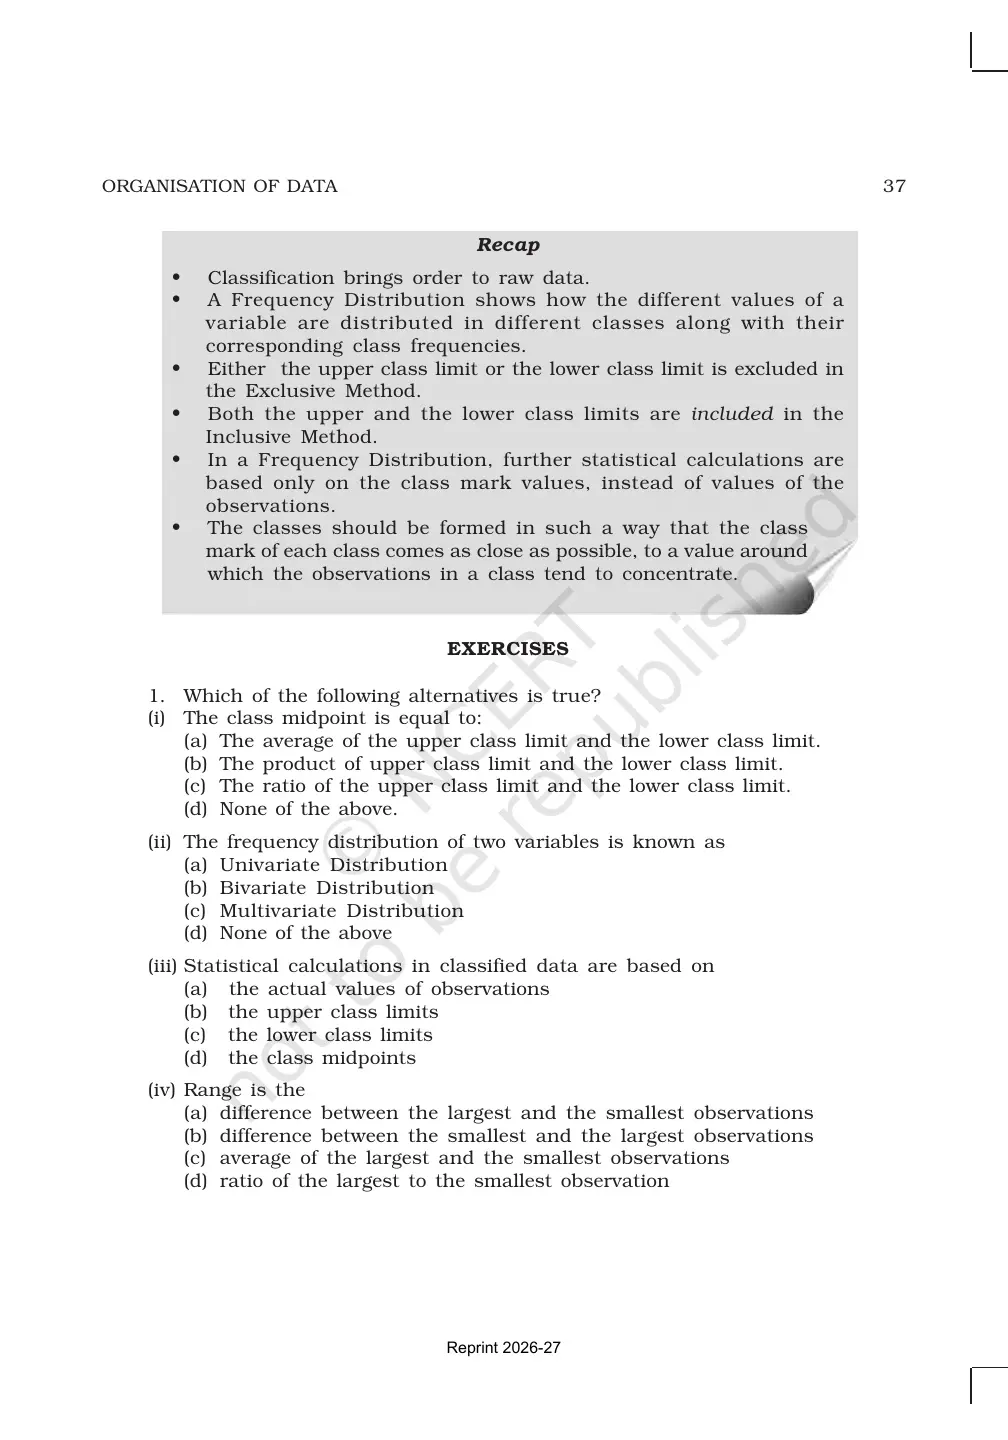
Ans. It includes the official NCERT chapter text, examples, tables, learning outcomes and exercise questions from Statistics for Economics.
Ques. Which book does Organisation of Data belong to?
Ans. Organisation of Data belongs to the Class 11 Statistics for Economics NCERT textbook.
Ques. Is this NCERT Book PDF useful for the 2026-27 syllabus?
Ans. Yes. The PDF is from the official NCERT reprint for 2026-27 and should be used as the source chapter before notes or solutions.
Ques. What should students revise first from Organisation of Data?
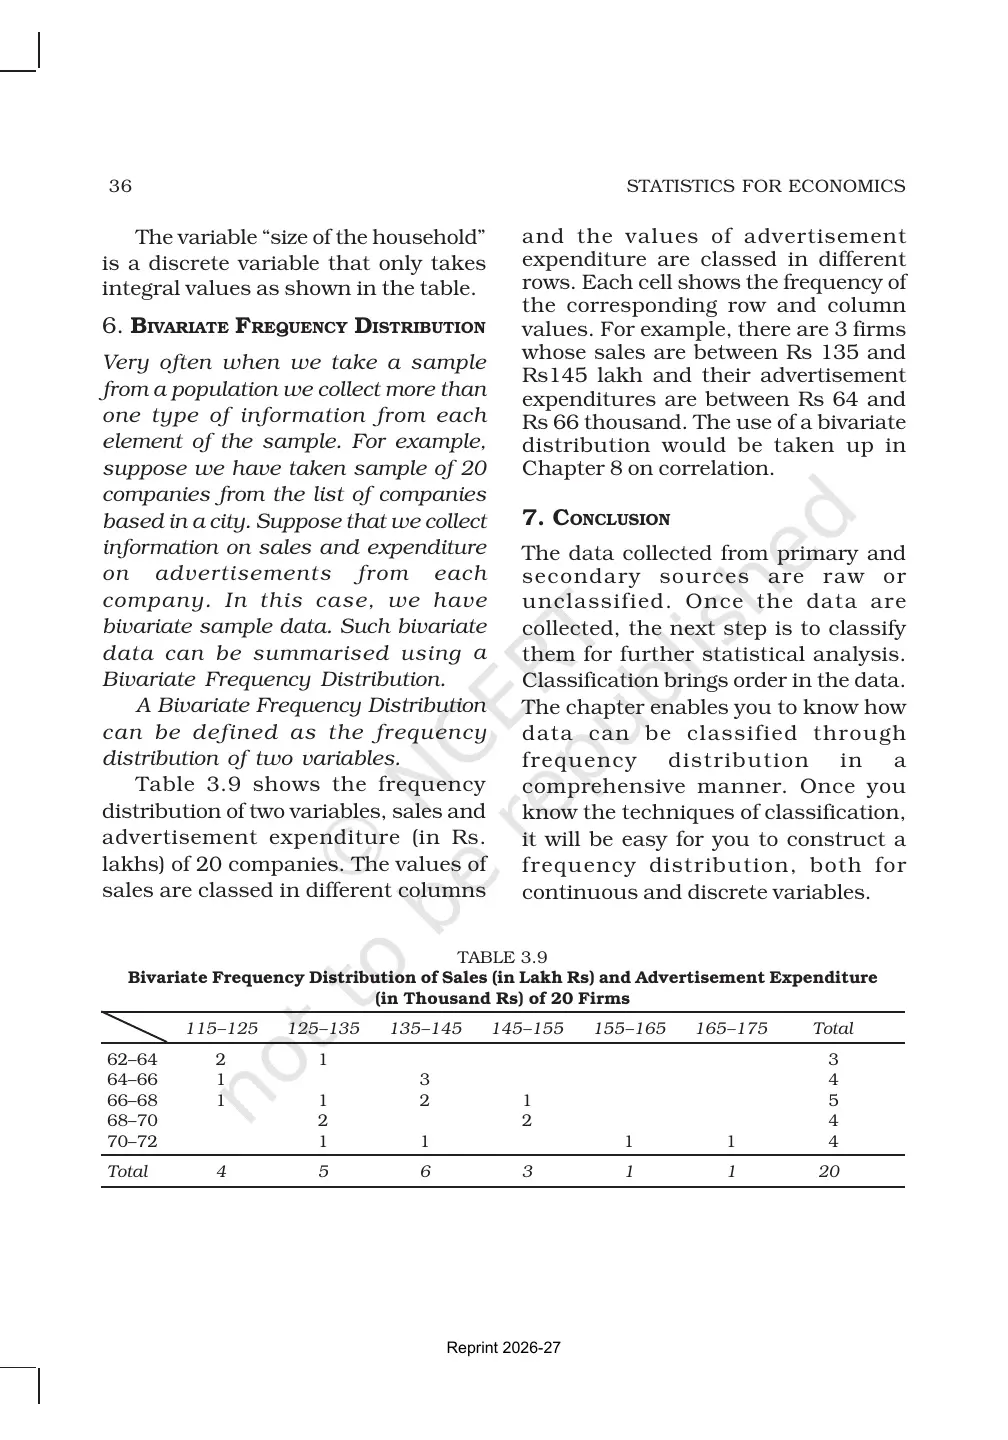
Ans. Students should revise types of classification, class intervals, tally marks, frequency distribution and bivariate frequency tables.



Comments