




If you are preparing for the Class 11 Informatics Practices paper, Understanding Data is the chapter you cannot afford to skip. It is the official 14 page chapter file from the 2026-27 reprint, it runs from page 81 to page 94, and it is the chapter that takes you from a plain list of numbers to mean, median, mode, range and standard deviation.
- Understanding Data is Chapter 5 of the NCERT Informatics Practices textbook for Class 11.
- It has five sections, from structured and unstructured data to the five statistical measures used for summarisation.
- The chapter ends with an 11 point Summary on page 92 and 10 exercise questions.
Every page of this Understanding Data chapter file is the official NCERT 2026-27 reprint, checked against the printed Informatics Practices textbook for Class 11 and paired on Collegedunia with solved answers, notes and handwritten revision pages for the same chapter.
What the Understanding Data Class 11 Chapter PDF Contains, Page by Page
The chapter opens with a quote from Gary Schubert on the gap between data, information, knowledge and wisdom, followed by a five point contents box. NCERT moves in one straight line: what data is, how you collect it, where you store it, how you process it, and how you summarise it. Read it in that order and the last section stops feeling like a maths chapter.
| Section | What is printed there | Why it matters in the exam |
|---|---|---|
| 5.1 Introduction to Data | The census and college placement examples, the definition of data, and seven examples of data we come across | The definition question is lifted word for word from here |
| 5.1.1 Importance of Data | ATM, meteorology, market analysis and dynamic pricing, plus six more scenarios | Feeds every two mark question that asks why data is needed |
| 5.1.2 Types of Data | Structured data with Table 5.1 and Table 5.2, unstructured data, and metadata | Exercise questions 4 and 9 come only from this page |
| 5.2 Data Collection | The three grocery store scenarios and the list of places where data is generated | Exercise questions 1, 3 and 8 are built on it |
| 5.3 Data Storage | The definition of data storage, six storage devices, and the limits of file processing | A guaranteed one mark question on storage devices |
| 5.4 Data Processing | Figure 5.1 with the input, processing and output cycle, and Figure 5.2 with three worked problem statements | The model answer shape for exercise question 2 |
| 5.5.1 Measures of Central Tendency | Mean, median and mode with Examples 5.1, 5.2 and 5.3 on the same height data | The largest source of marks in the chapter |
| 5.5.2 Measures of Variability | Range and standard deviation with Examples 5.4 and 5.5, plus Table 5.3 | Exercise questions 5, 6 and 7 all sit here |
| Technique picker, page 91 | Six problem statements to be matched with the right statistical method | The exact shape CBSE uses for case based questions |
| Summary, page 92 | Eleven bullet points that compress the whole chapter | The single best page for last minute revision |
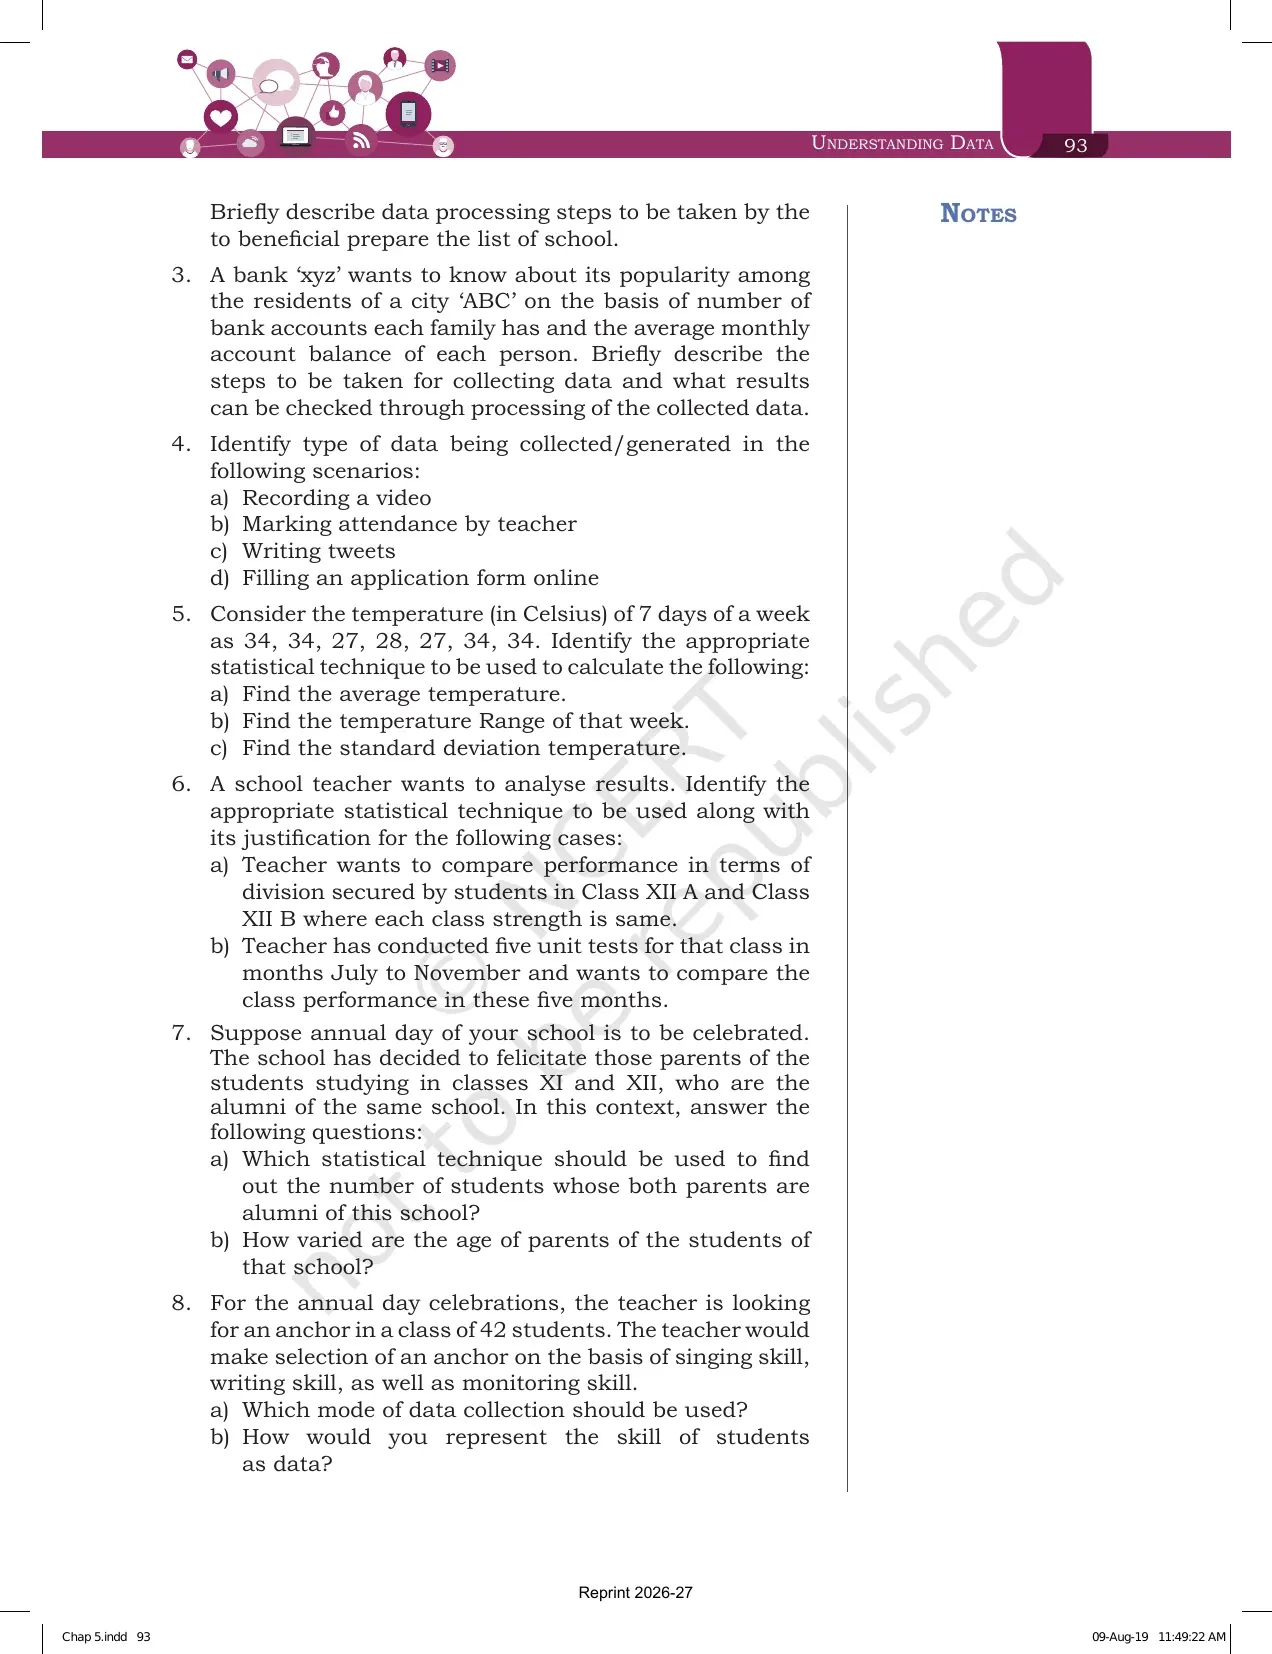
| Exercise, pages 92 to 94 | 10 questions, most of them scenario based rather than recall | School tests repeat these almost word for word |
Tip: the three Think and Reflect boxes and Activity 5.1 are two lines each, but each one has produced a one mark question in school tests. Read them along with the main text instead of skipping past the margin.
Understanding Data Chapter 5 Explained in Video
Source: Magnet Brains on YouTube
Introduction to Data: What Counts as Data and Why NCERT Calls It Plural
Section 5.1 starts with decisions, not definitions. Choosing a college means looking at placement records of previous years, faculty qualifications, laboratory and hostel facilities and fees. Governments run a census. A coaching staff studies past performances of opponent teams. Banks keep account details and transactions. All of it is data.
The definition the marker looks for comes a page later. Data is a collection of characters, numbers and other symbols that represents values of some situations or variables. One more line from the same paragraph is asked as a one mark question: data is plural, and the singular of the word data is datum.
NCERT then lists seven kinds of data we meet every day, and this list is the safest thing to write when a question asks for examples.
- Personal details such as name, age, gender and contact details of a person.
- Transaction data generated through banking, ticketing and shopping, whether online or offline.
- Media such as images, graphics, animations, audio and video.
- Documents and web pages, plus online posts, comments and messages.
- Signals generated by sensors.
- Satellite data, including meteorological, communication and earth observation data.
One margin box sits beside this section and it is easy to miss. A knowledge base is a store of information consisting of facts, assumptions and rules which an AI system can use for decision making. That single line links this chapter back to the Artificial Intelligence section of Chapter 2.
Importance of Data and the Decision Making Examples NCERT Prints
Section 5.1.1 answers one question: why bother storing data at all? The answer is that processed data shows possibilities or hidden traits which are otherwise not visible to humans. When you withdraw money from an ATM, the bank has to debit that amount from the linked account, so it must keep the data and update it. Meteorological offices watch satellite data for an upcoming cyclone.
The business examples are the ones that make the best answers, because each has a number or a name attached to it.
- Market monitoring. Companies track market behaviour for their products, pick up customer demands and feedback, and change the product accordingly.
- Dynamic pricing. Airlines and railways set the price from the relationship between demand and supply, and cab booking apps raise or drop fares with demand at a given time.
- Happy hours. Restaurants decide when and how much discount to offer by analysing sales data across different time periods.
Six more scenarios are printed as a bullet list, and they are the quickest thing to revise the night before the paper. Electronic voting machines record the votes cast, and the data from all machines is pooled to declare results far faster than manual counting of ballot papers.
The other five are one line each. Scientists record data during experiments to compare results. Pharmaceutical companies record data while testing a new medicine for its effectiveness. Libraries maintain data about books and memberships. Search engines return results after analysing large volumes of data across the World Wide Web. Weather alerts are generated from satellite data.
Types of Data: Structured Data, Unstructured Data and Metadata
Section 5.1.2 is the most examined page of the chapter. Data arrives in different formats, so NCERT splits it into two broad categories on the basis of format. Learn both definitions in the book's own words, because exercise question 9 asks you to differentiate them with one example each.
| Point of difference | Structured data | Unstructured data |
|---|---|---|
| Definition | Data which is organised and can be recorded in a well defined format | Data which is not in the traditional row and column structure |
| Storage shape | Tabular, in rows and columns | No particular format and no fixed structure |
| What a column holds | One parameter, called an attribute, characteristic or variable | Not applicable |
| What a row holds | Data of one observation across the different attributes | Not applicable |
| Book examples | Table 5.1, an inventory of kitchen items kept by a shop | A newspaper page and the content of an email |
| More examples | Fee records, ATM withdrawal records, library records | Web pages, text documents, business reports, books, audio and video files, social media messages |
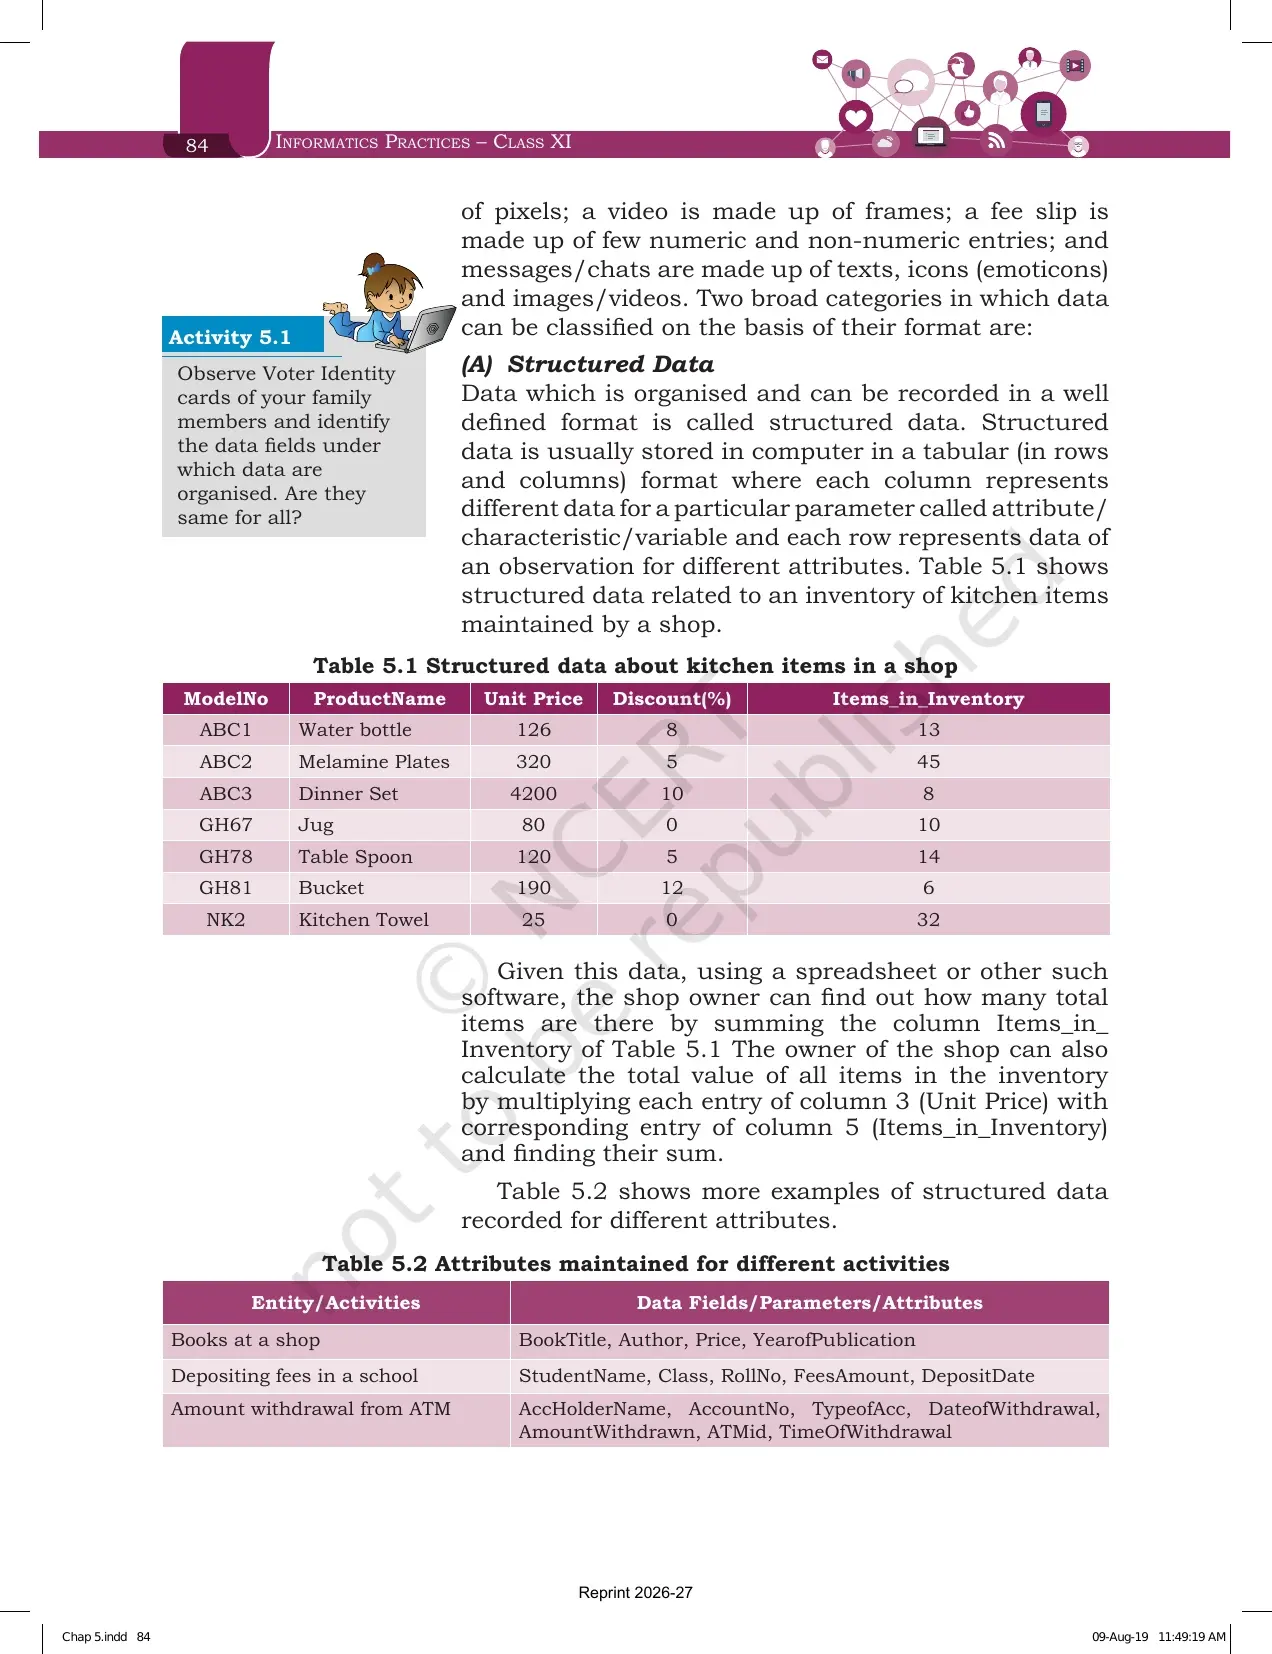
Table 5.1 is worth copying once by hand. It holds seven kitchen items with five attributes: ModelNo, ProductName, Unit Price, Discount and Items_in_Inventory. The shop owner finds the total stock by summing the Items_in_Inventory column, and the total value by multiplying Unit Price with Items_in_Inventory row by row and adding the results. That is the whole idea of structured data in one sentence.
Table 5.2 then lists the attributes kept for three activities, and this is the table exercise question 1 imitates.
- Books at a shop: BookTitle, Author, Price, YearofPublication.
- Depositing fees in a school: StudentName, Class, RollNo, FeesAmount, DepositDate.
- Amount withdrawal from ATM: AccHolderName, AccountNo, TypeofAcc, DateofWithdrawal, AmountWithdrawn, ATMid, TimeOfWithdrawal.
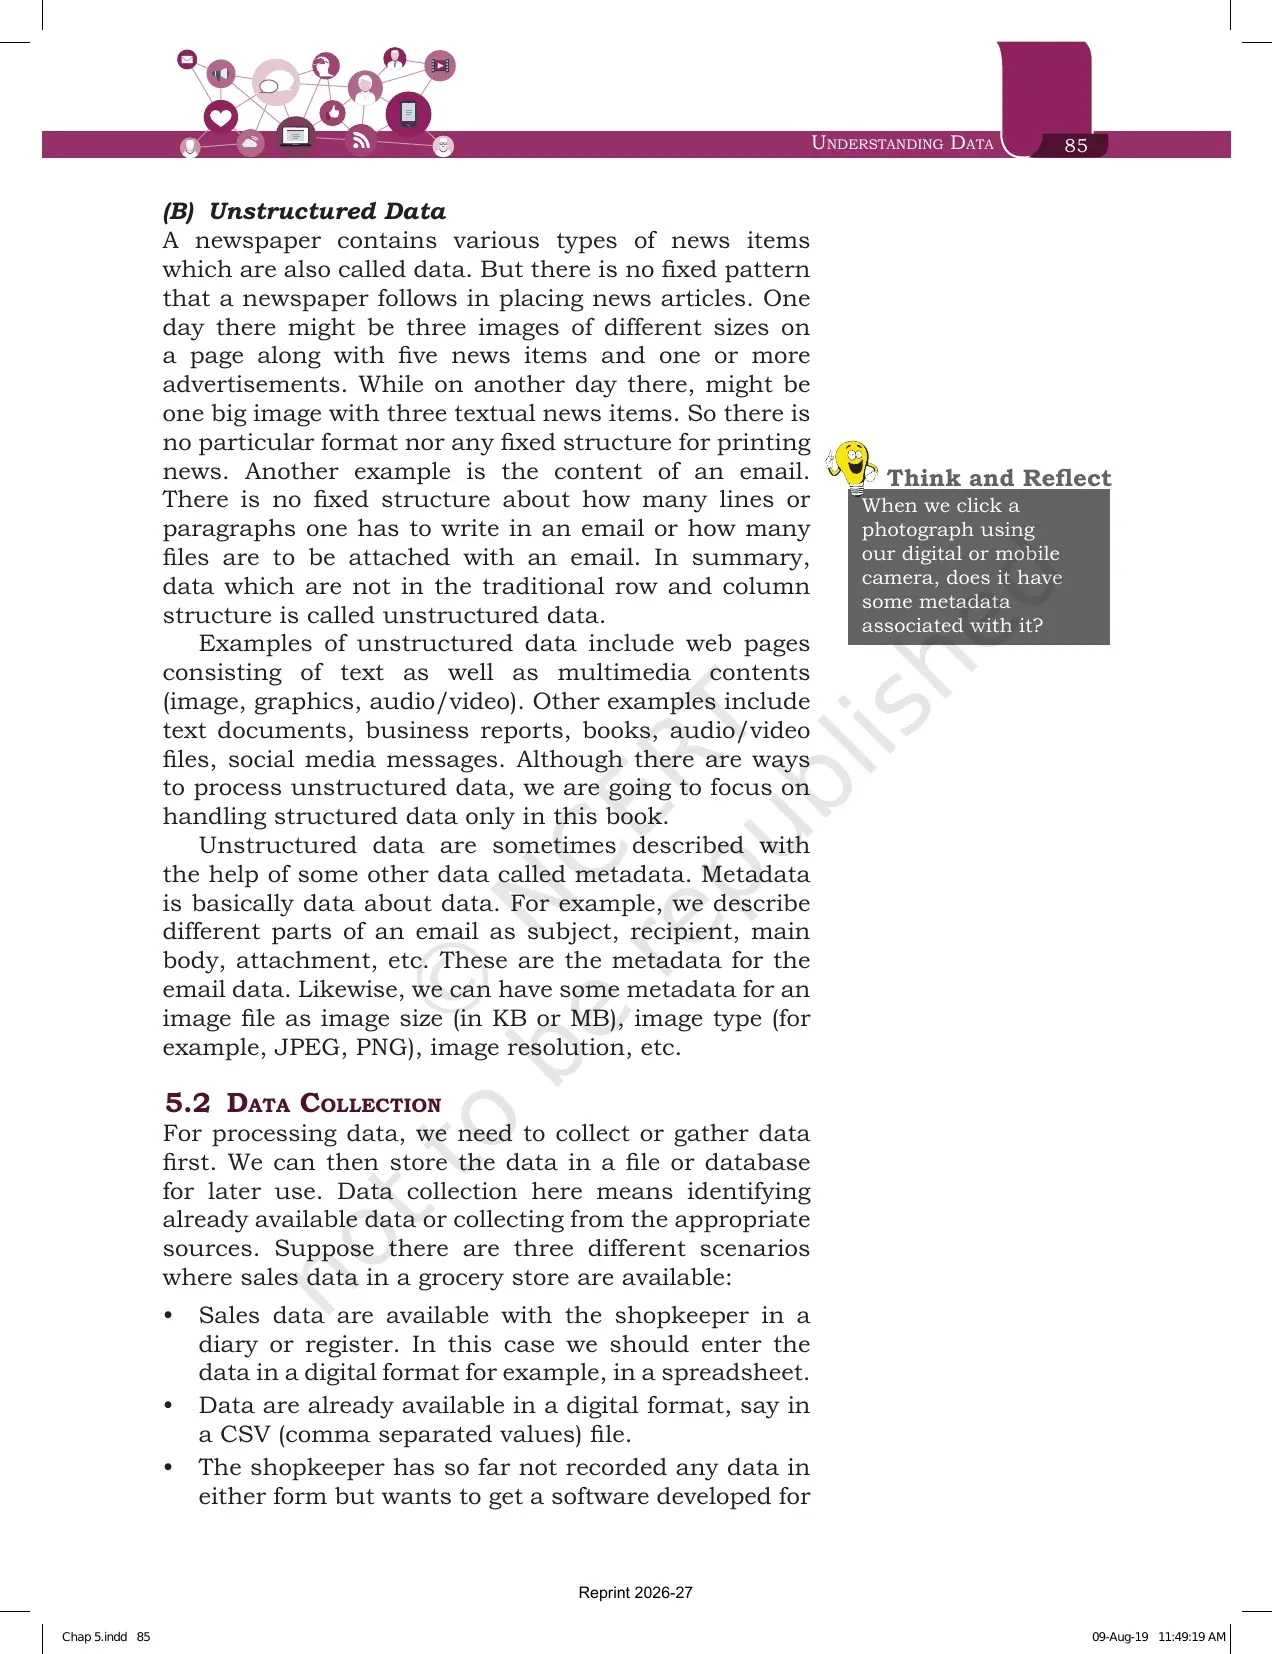
For unstructured data the book uses a newspaper. One day a page carries three images of different sizes with five news items and an advertisement, another day it carries one big image with three textual news items. There is no fixed pattern, so it is unstructured. An email is the second example, because nothing fixes how many lines or attachments it must have.
The section closes on a term that is asked on its own. Metadata is basically data about data. The subject, recipient, main body and attachment of an email are metadata for that email. For an image file the metadata is the image size in KB or MB, the image type such as JPEG or PNG, and the image resolution.
Activity 5.1 asks you to open the Voter Identity cards of your family members and list the data fields under which the data is organised. It is the same exercise done on a real document, and it is the fastest way to see what an attribute means.
Data Collection and the Three Grocery Store Scenarios in Section 5.2
Before anything can be processed, it has to be collected. NCERT defines data collection as identifying already available data or collecting it from the appropriate sources. The chapter explains it through one shop and three situations, and this is the block most short answer questions are lifted from.
- Data is on paper. The shopkeeper keeps sales in a diary or register, so you enter it in a digital format, for example a spreadsheet.
- Data is already digital. It sits in a CSV file, which stands for comma separated values, and can be used as it is.
- No data exists yet. Software has to be developed, in a language such as Python, that stores and retrieves data from a CSV file or from a database management system like MySQL.
That third scenario is the sentence that connects this chapter to the rest of the book. It names Python, CSV files and MySQL together, and every one of the three comes back in the database chapters.
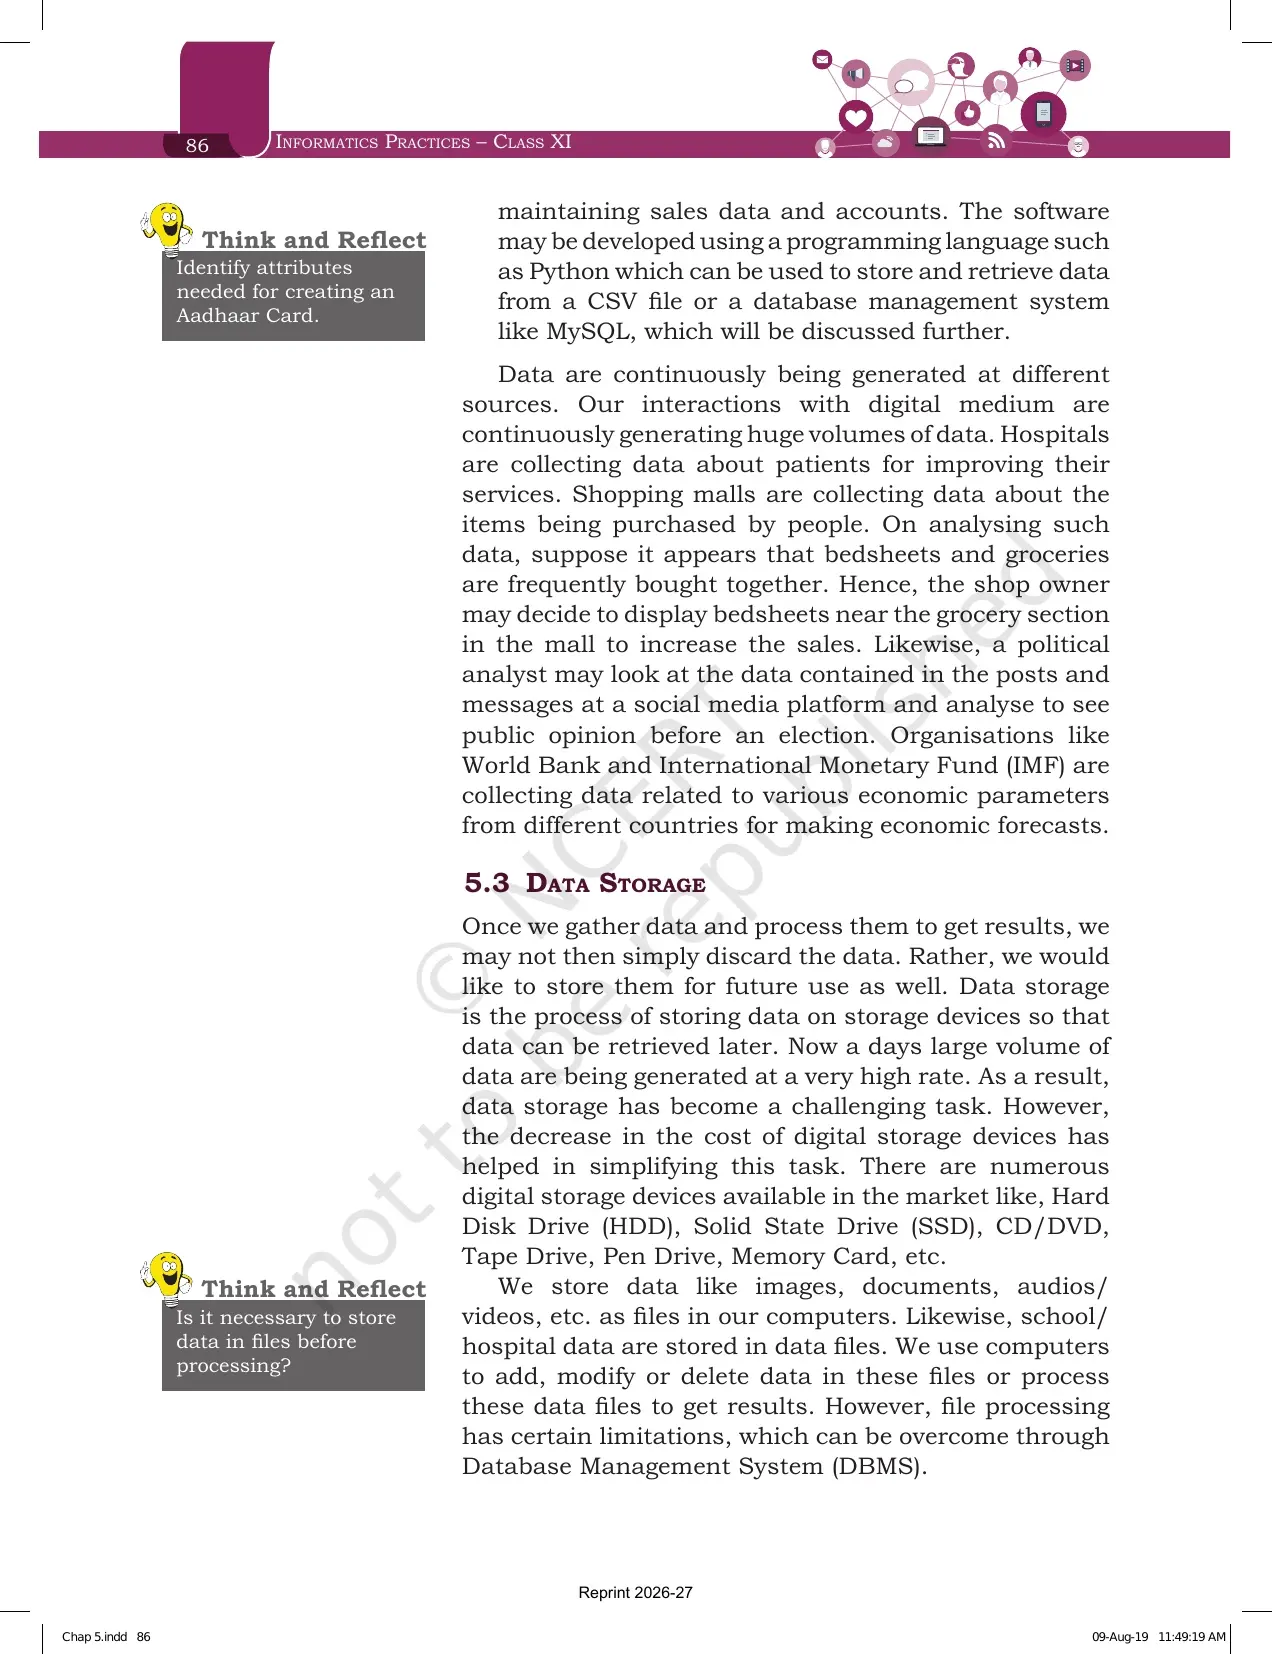
The second half of the section lists where data is being generated right now. Hospitals collect data about patients to improve services. Shopping malls collect data about the items purchased, and if the analysis shows that bedsheets and groceries are frequently bought together, the owner may move the bedsheets next to the grocery section to lift sales.
Two more sources close the section. A political analyst reads posts and messages on a social media platform to judge public opinion before an election. The World Bank and the International Monetary Fund collect economic data from different countries for making economic forecasts. The Think and Reflect box here asks you to identify the attributes needed for creating an Aadhaar Card, which is exercise question 1 in disguise.
Data Storage: Devices, Data Files and Why DBMS Replaces File Processing
Section 5.3 is short but carries a definition and a device list, and both are one mark answers. Data storage is the process of storing data on storage devices so that data can be retrieved later. The chapter adds a reason: large volumes of data are now generated at a very high rate, which makes storage a challenging task, and the falling cost of digital storage devices is what keeps it manageable.
| Storage device named in the chapter | Short form printed by NCERT |
|---|---|
| Hard Disk Drive | HDD |
| Solid State Drive | SSD |
| Compact Disc and Digital Versatile Disc | CD/DVD |
| Tape Drive | Not applicable |
| Pen Drive | Not applicable |
| Memory Card | Not applicable |
The last paragraph is the one that gets asked as a two mark question. Images, documents, audio and video are stored as files, and school or hospital records are stored in data files that we add to, modify, delete from or process. File processing has certain limitations, and those limitations are overcome through a Database Management System, or DBMS.
The Think and Reflect box beside that paragraph asks whether it is necessary to store data in files before processing. The honest answer is no, because a DBMS can hold the data instead, and that is exactly where the database chapters pick up.
Data Processing: The Input, Processing and Output Cycle in Figure 5.1
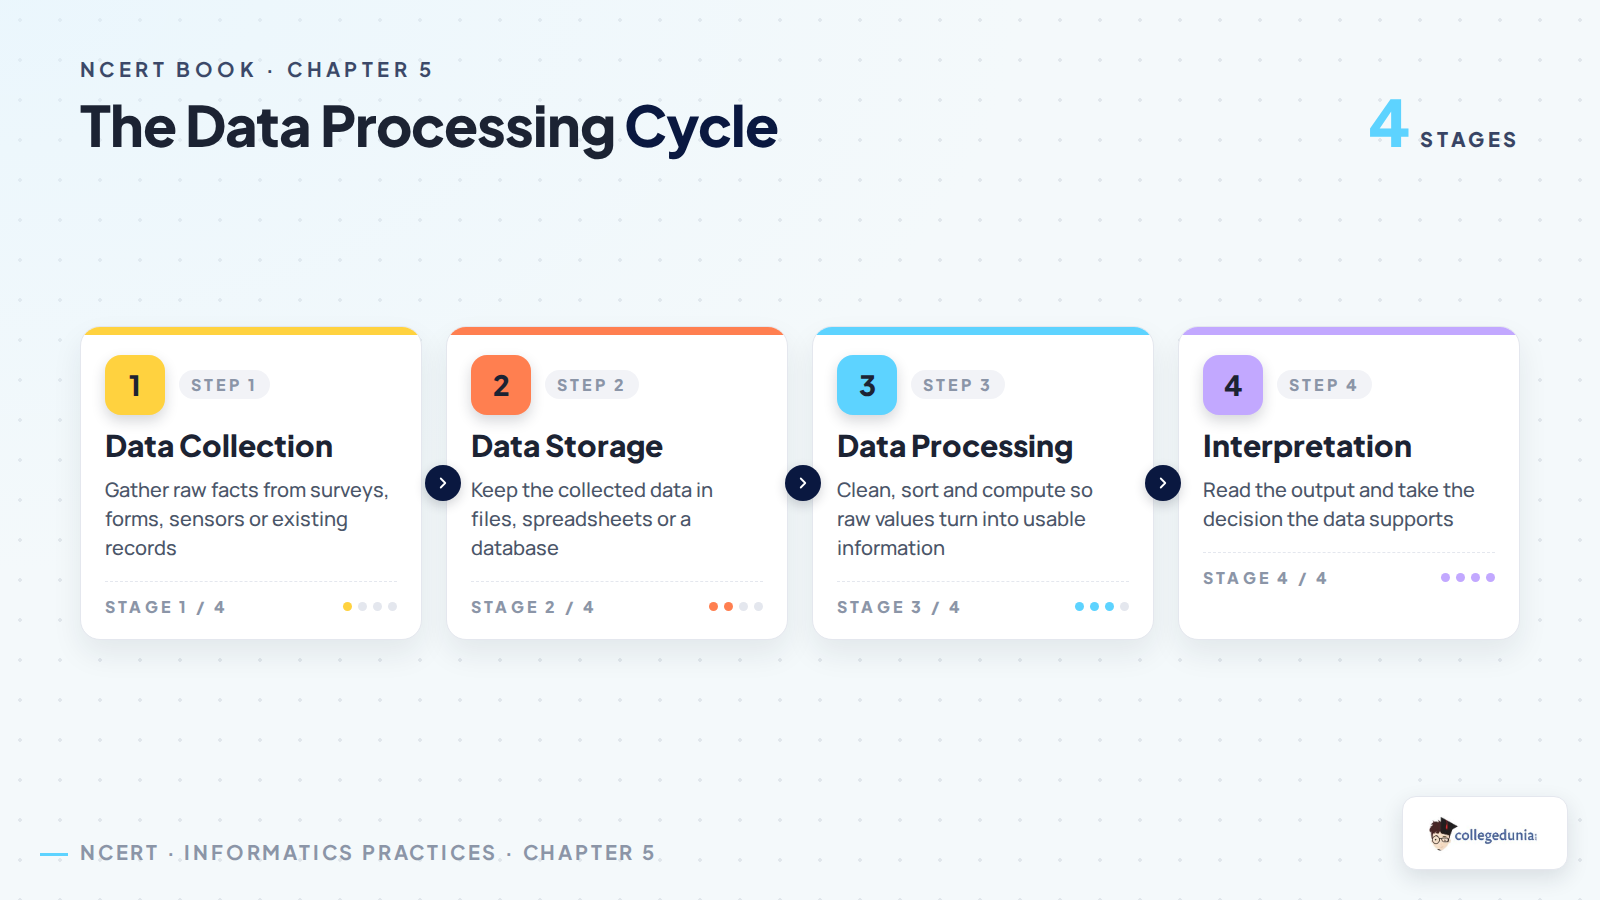
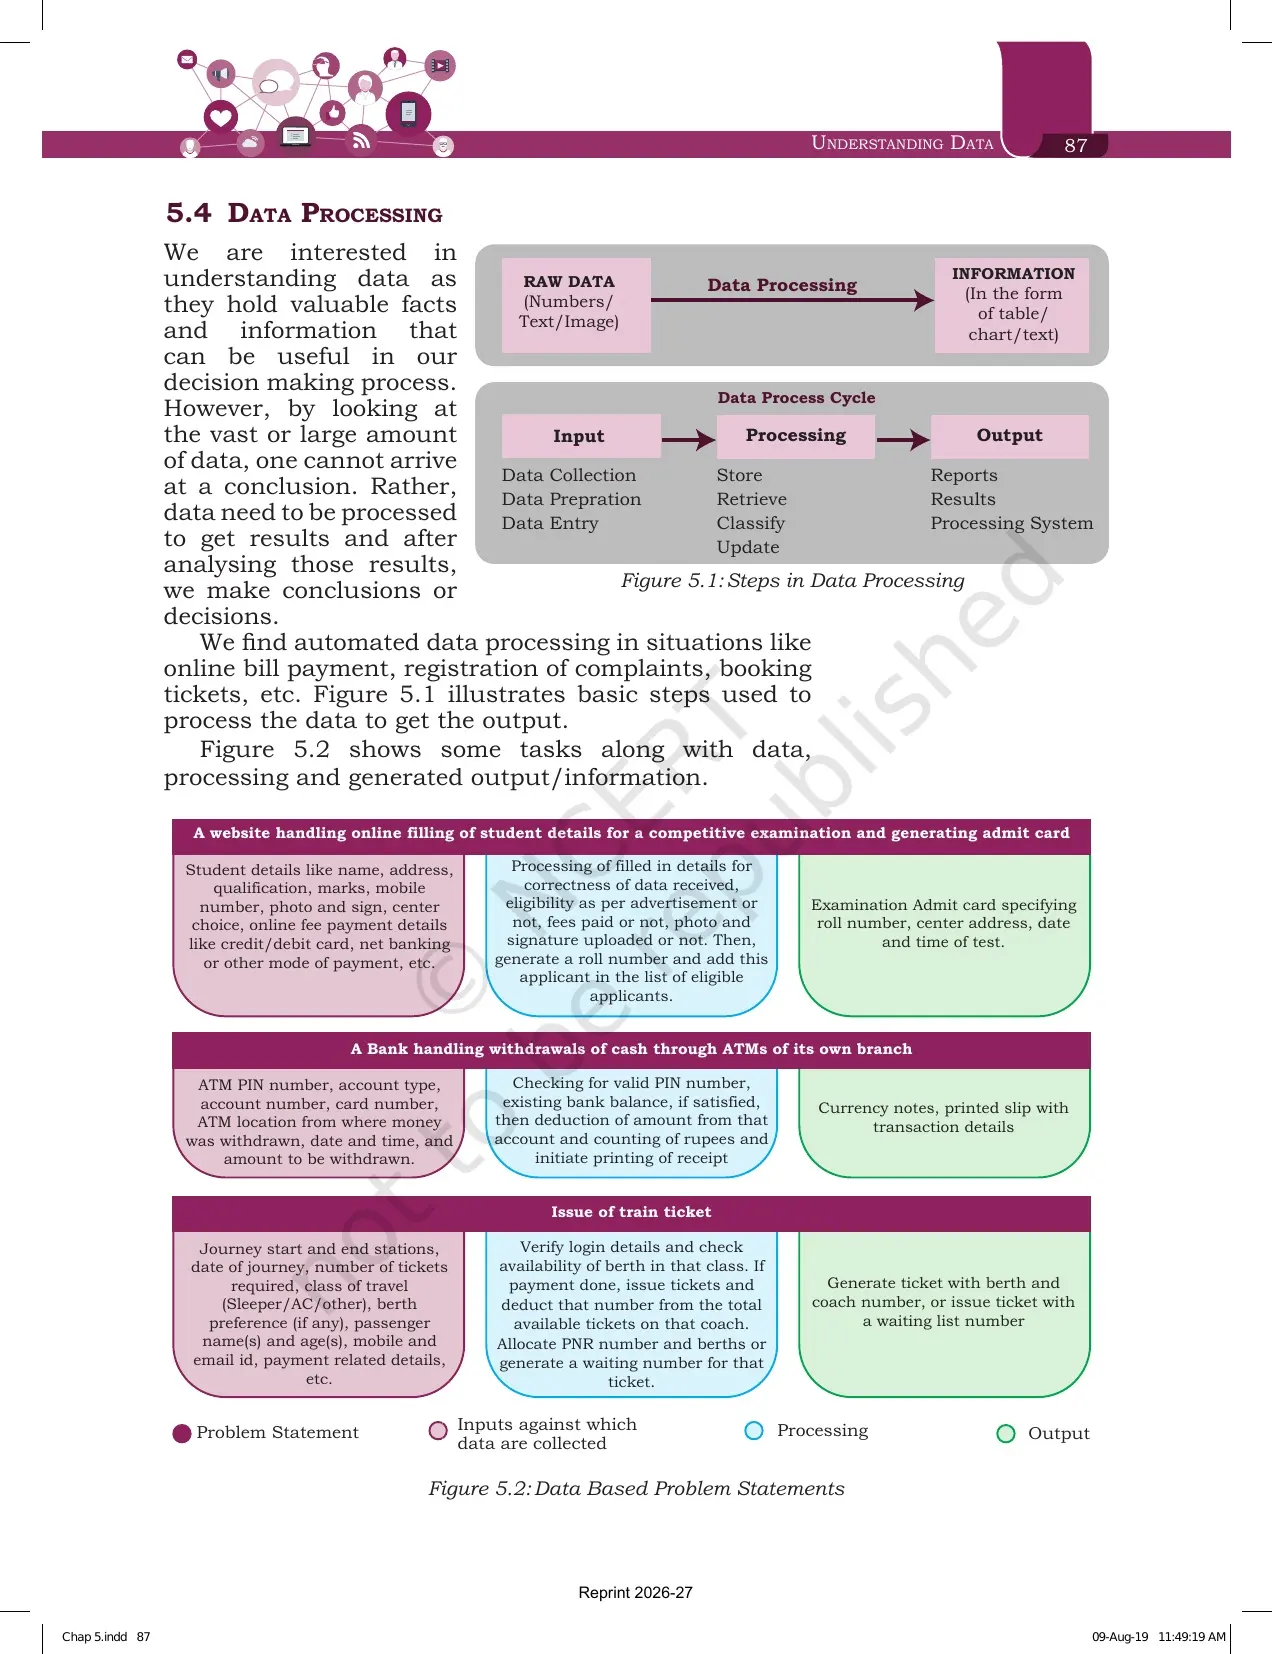
Section 5.4 explains why raw data alone is useless. Looking at a large amount of data, nobody arrives at a conclusion. Data has to be processed to get results, and only after analysing those results do we make decisions. Figure 5.1 draws this as a straight line: raw data in the form of numbers, text or images goes into data processing, and information comes out in the form of a table, a chart or text.
Below that line the same figure prints the data process cycle in three columns, and this three column shape is what the marker expects when a question says describe the data processing steps.
| Stage | Tasks printed in Figure 5.1 |
|---|---|
| Input | Data collection, data preparation, data entry |
| Processing | Store, retrieve, classify, update |
| Output | Reports, results, processing system |
Automated data processing is everywhere in the examples: online bill payment, registration of complaints and booking tickets. Figure 5.2 then works three full problem statements, each split into the inputs collected, the processing done and the output produced. Copy this three column layout into your answer sheet and you have already earned most of the marks on exercise questions 2 and 3.
| Problem statement | Inputs collected | Processing | Output |
|---|---|---|---|
| A website taking student details for a competitive examination and generating an admit card | Name, address, qualification, marks, mobile number, photo and sign, centre choice, online fee payment details | Check the details for correctness, check eligibility against the advertisement, check fee payment and uploads, generate a roll number and add the applicant to the eligible list | Admit card with roll number, centre address, date and time of the test |
| A bank handling cash withdrawal through its own ATMs | ATM PIN, account type, account number, card number, ATM location, date and time, amount to be withdrawn | Check the PIN and the existing balance, deduct the amount, count the currency and start printing the receipt | Currency notes and a printed slip with the transaction details |
| Issue of a train ticket | Start and end stations, date of journey, number of tickets, class of travel, berth preference, passenger names and ages, contact and payment details | Verify login details, check berth availability in that class, issue tickets on payment, reduce the coach count, allot a PNR number and berths or a waiting number | Ticket with berth and coach number, or a ticket with a waiting list number |
Measures of Central Tendency: Mean, Median and Mode in Section 5.5.1
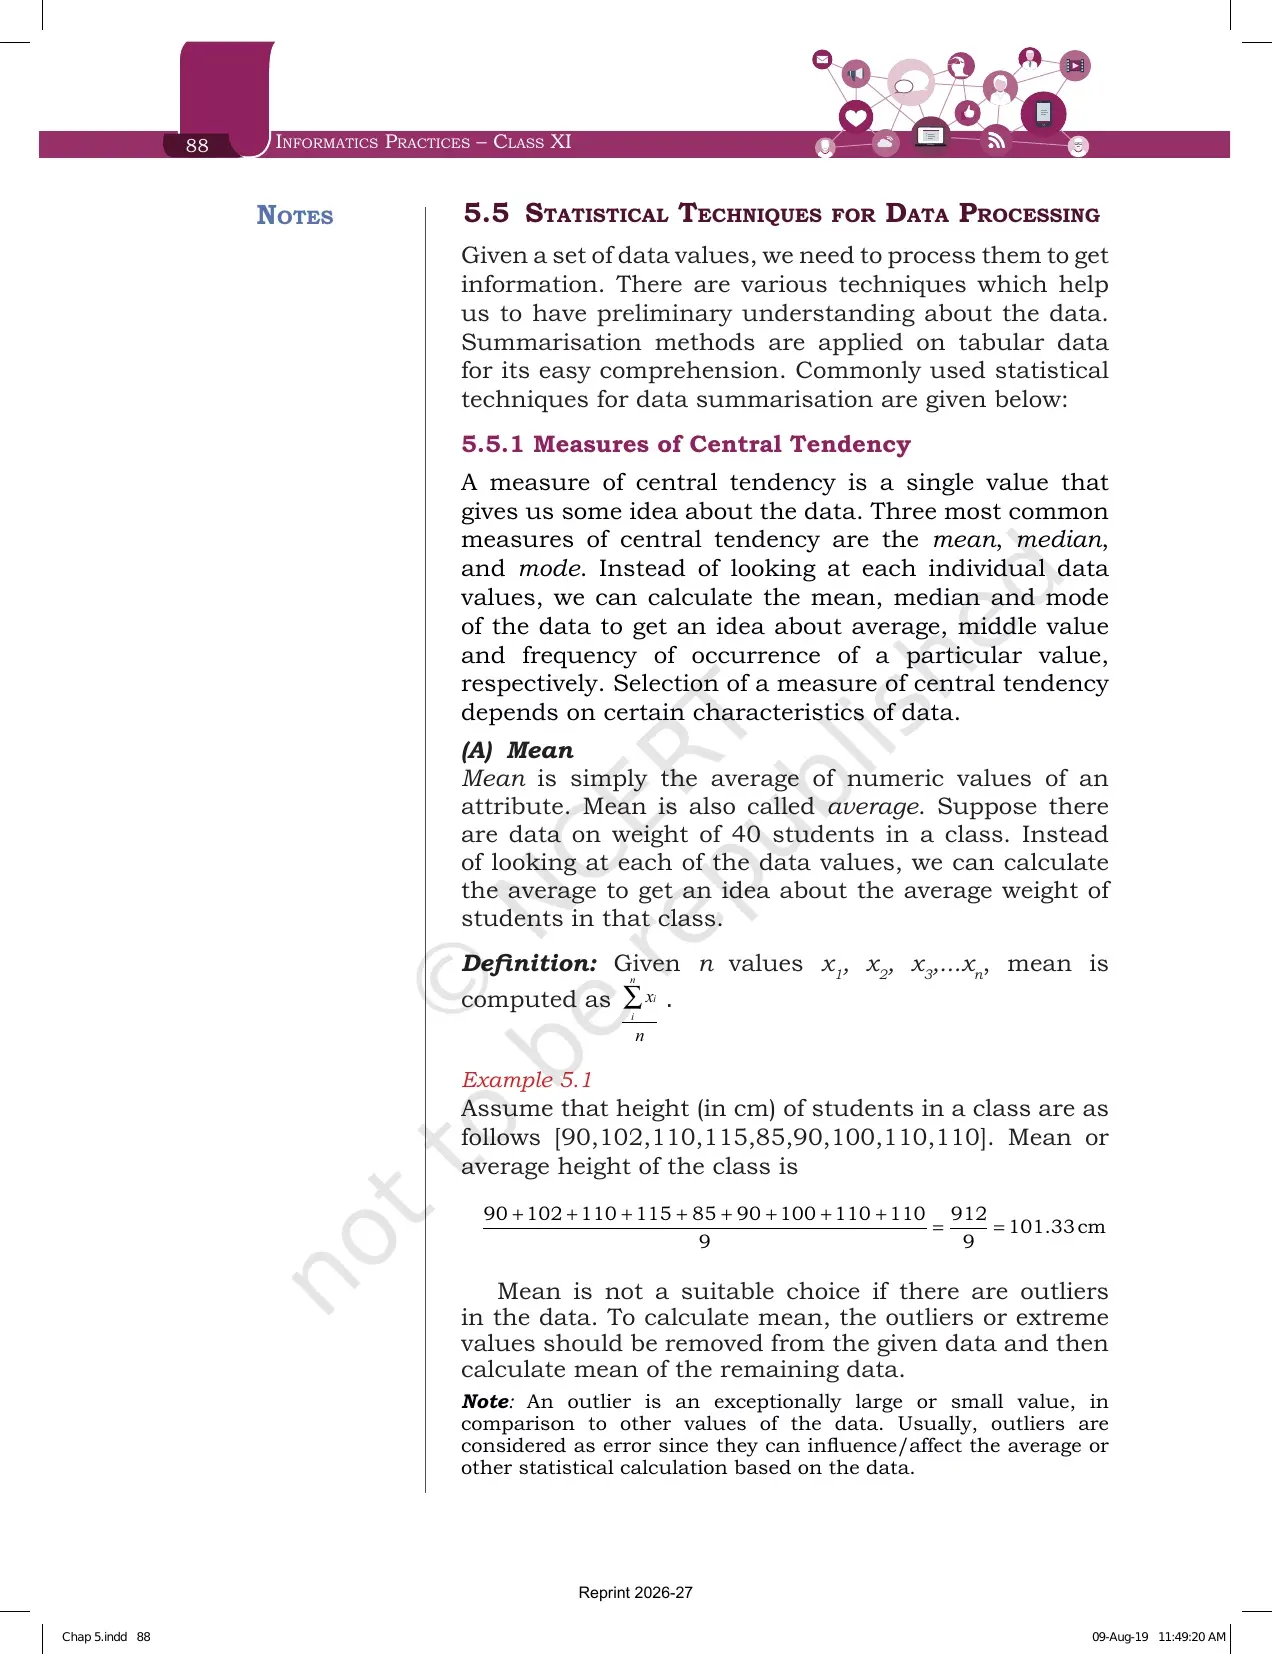
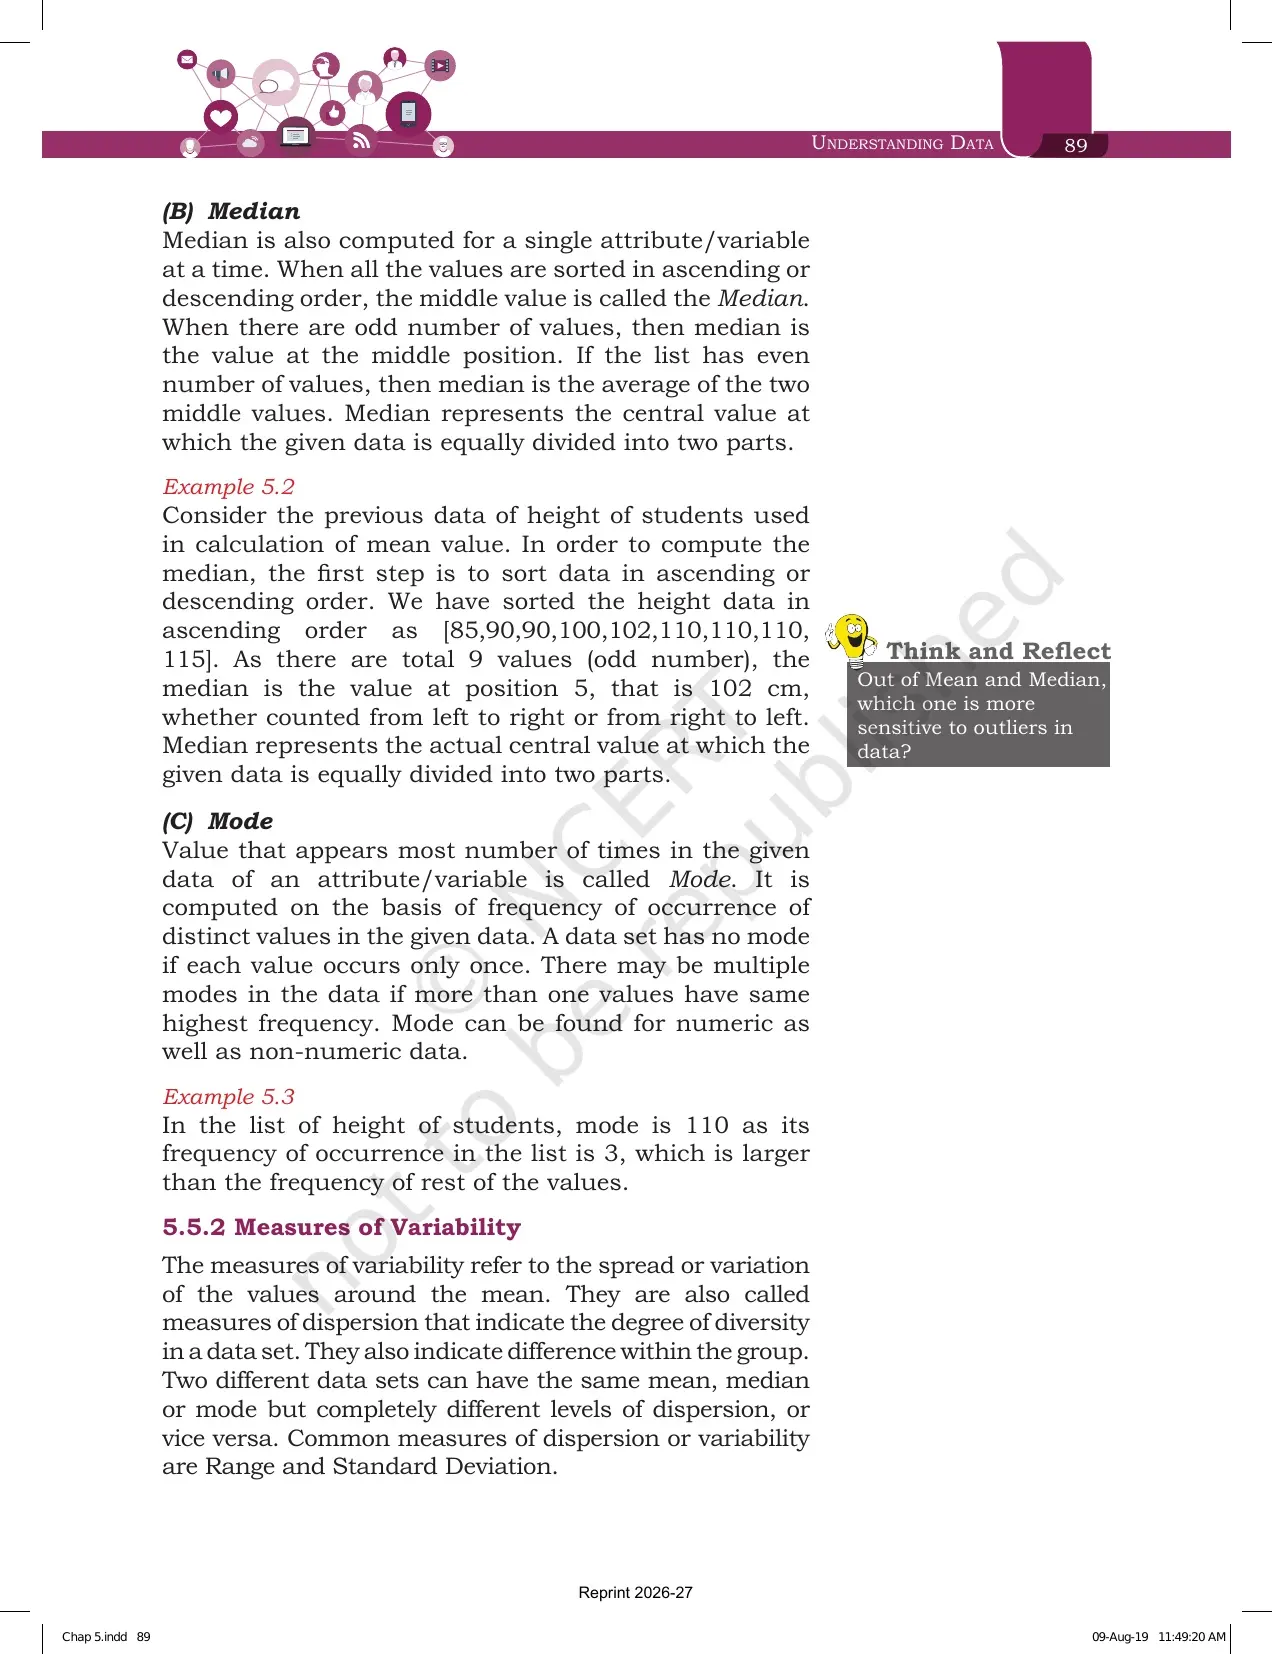
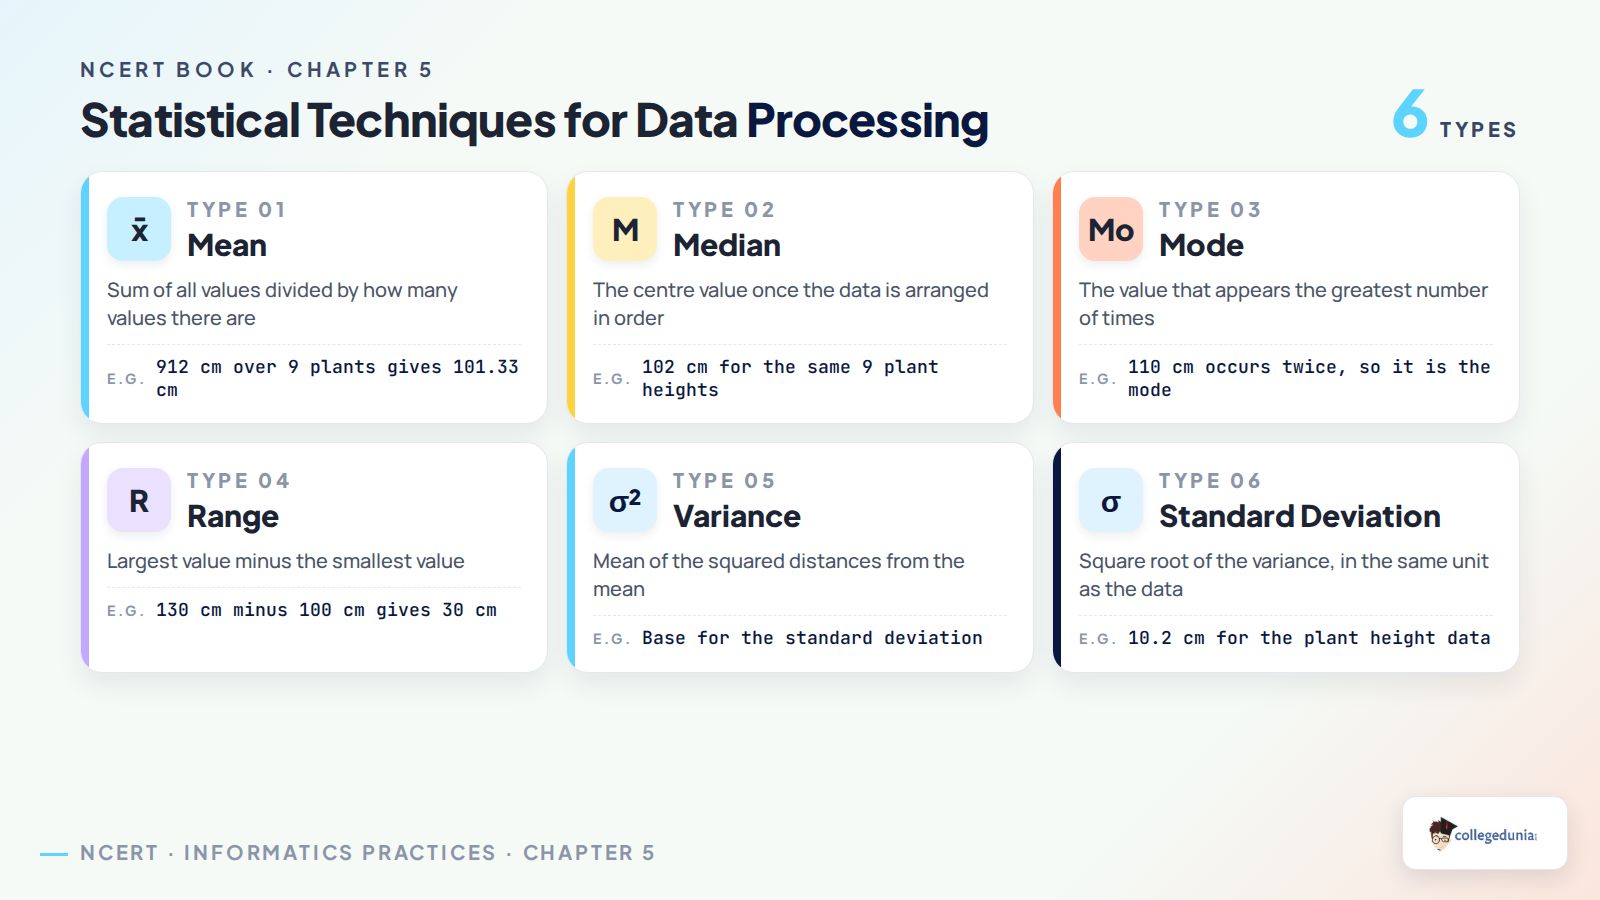
Section 5.5 opens with one sentence worth memorising. A measure of central tendency is a single value that gives us some idea about the data. The three common ones are mean, median and mode, and each of the three worked examples uses the same nine heights in centimetres: 90, 102, 110, 115, 85, 90, 100, 110 and 110.
Mean is simply the average of the numeric values of an attribute. Given n values, it is computed as x̄ = i=1n xin . In Example 5.1 the nine heights add up to 912, so the mean is 912 divided by 9, that is 101.33 cm.
The warning that follows the example is asked more often than the calculation. Mean is not a suitable choice when the data has outliers, so the extreme values should be removed first and the mean taken on what remains. NCERT defines an outlier as an exceptionally large or small value compared with the other values, usually treated as an error because it affects the average and other statistical calculations.
| Measure | How it is found | Result on the nine heights | What it tells you |
|---|---|---|---|
| Mean | Add all values and divide by how many there are | 912 divided by 9 gives 101.33 cm | The average value of the attribute |
| Median | Sort the data, then take the middle value | Sorted, the value at position 5 is 102 cm | The central value that splits the data into two equal parts |
| Mode | Count how often each distinct value appears | 110, because it occurs 3 times | The value that appears the most number of times |
For the median, the first step is always sorting. The heights sorted in ascending order are 85, 90, 90, 100, 102, 110, 110, 110 and 115. There are 9 values, an odd number, so the median is the value at position 5, that is 102 cm, counted from either end.
When the list has an even number of values, the median is the average of the two middle values. The Think and Reflect box here asks which of mean and median is more sensitive to outliers. The answer is the mean, and one line of reasoning earns the mark.
For the mode, four rules are printed and each has appeared as a one mark question. A data set has no mode if every value occurs only once, and there can be more than one mode if two or more values share the same highest frequency.
The rule that decides the case based questions is the last one. Mode is the only one of the three central tendency measures that works on non-numeric data as well as numeric data. That is why the popular car colour question in the technique table on page 91 is answered with mode.
Measures of Variability: Range and Standard Deviation in Section 5.5.2
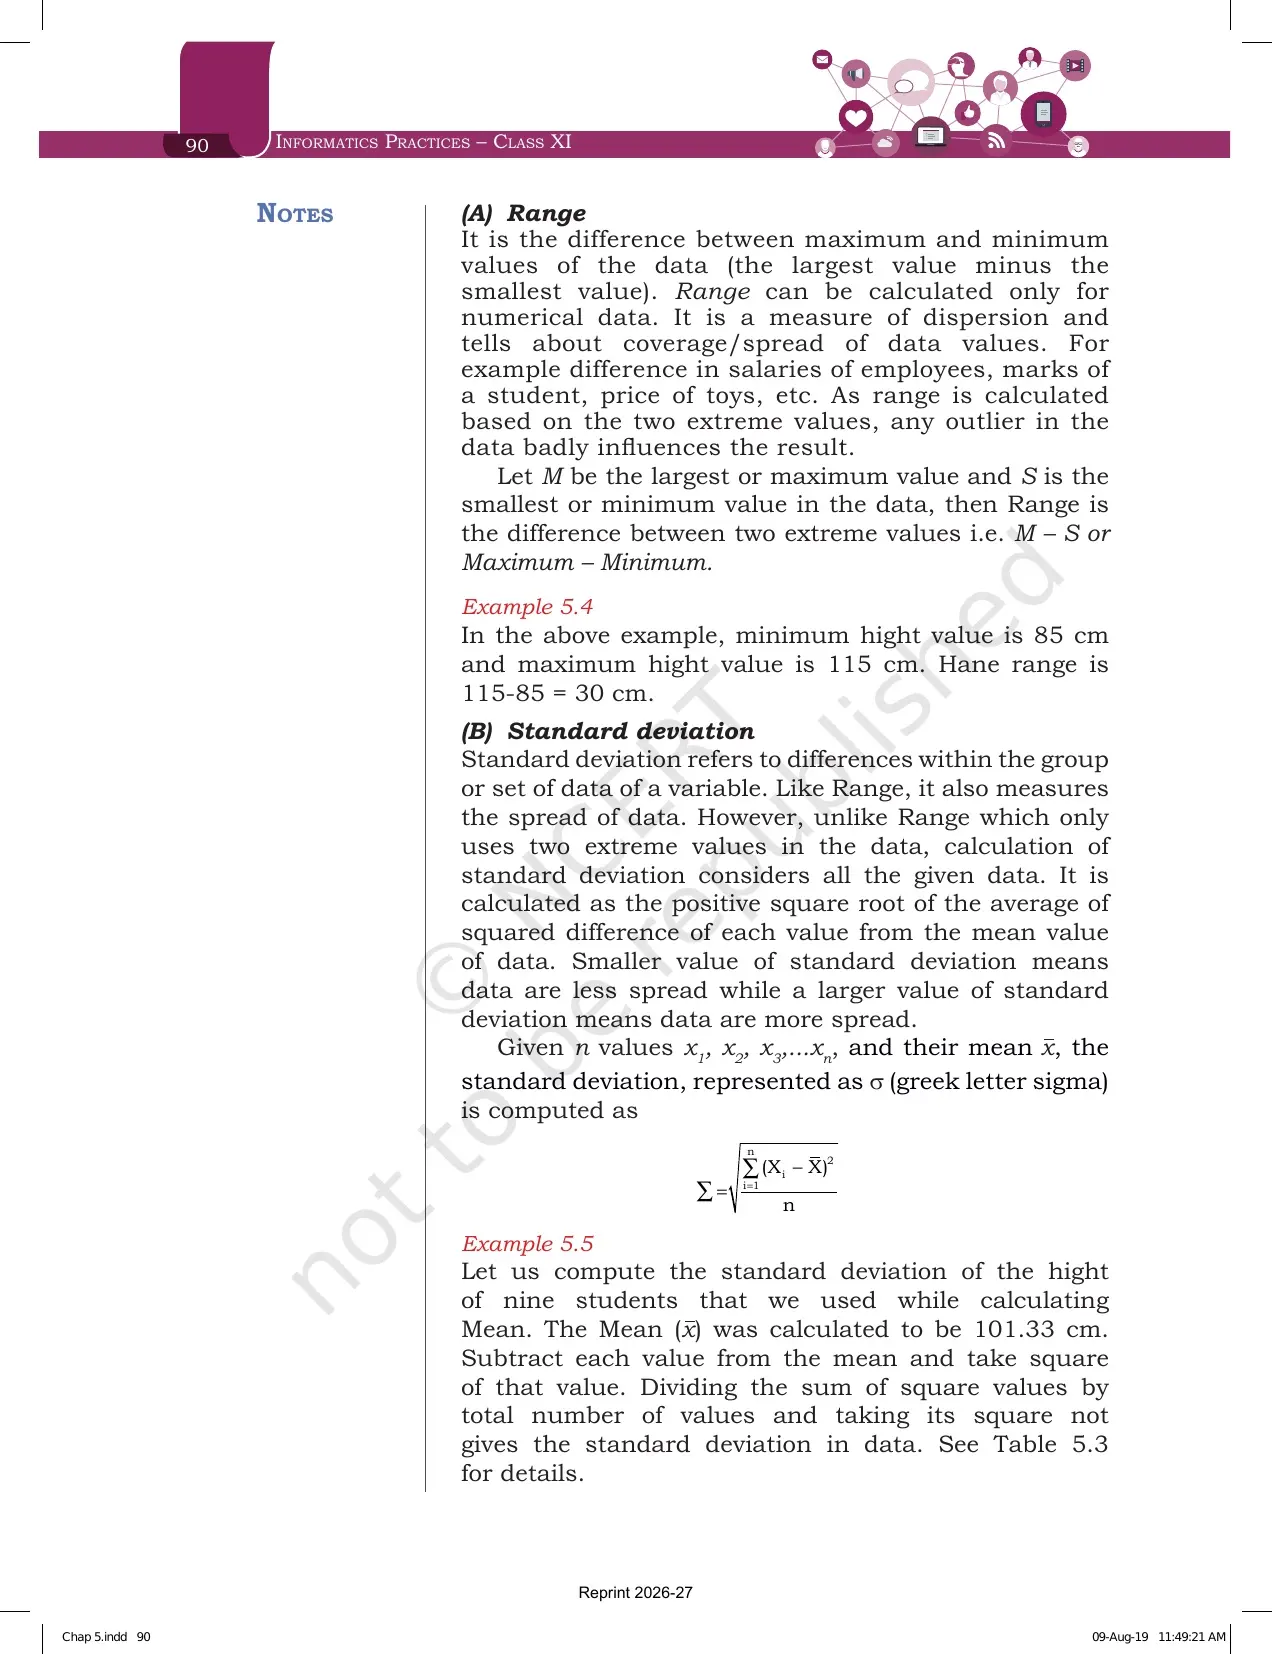
Section 5.5.2 opens with the definition and two alternative names. The measures of variability refer to the spread or variation of the values around the mean, and they are also called measures of dispersion. They show the degree of diversity in a data set and the difference within a group.
The line examiners love is the next one. Two different data sets can have the same mean, median or mode but completely different levels of dispersion. The two common measures of dispersion are range and standard deviation.
| Point | Range | Standard deviation |
|---|---|---|
| What it is | The difference between the maximum and minimum values | The positive square root of the average of the squared difference of each value from the mean |
| Values used | Only the two extreme values | All the given data values |
| Data type | Numerical data only | Numerical data only |
| Effect of an outlier | Badly influenced, because both ends are extremes | Affected far less, because every value contributes |
| Result on the nine heights | 115 minus 85, that is 30 cm | 10.2 cm |
Range is written in the book as M minus S, where M is the largest or maximum value and S is the smallest or minimum value. Example 5.4 uses the same heights, so the minimum is 85 cm, the maximum is 115 cm, and the range is 30 cm. The examples NCERT gives for range are the difference in salaries of employees, the marks of a student and the price of toys.
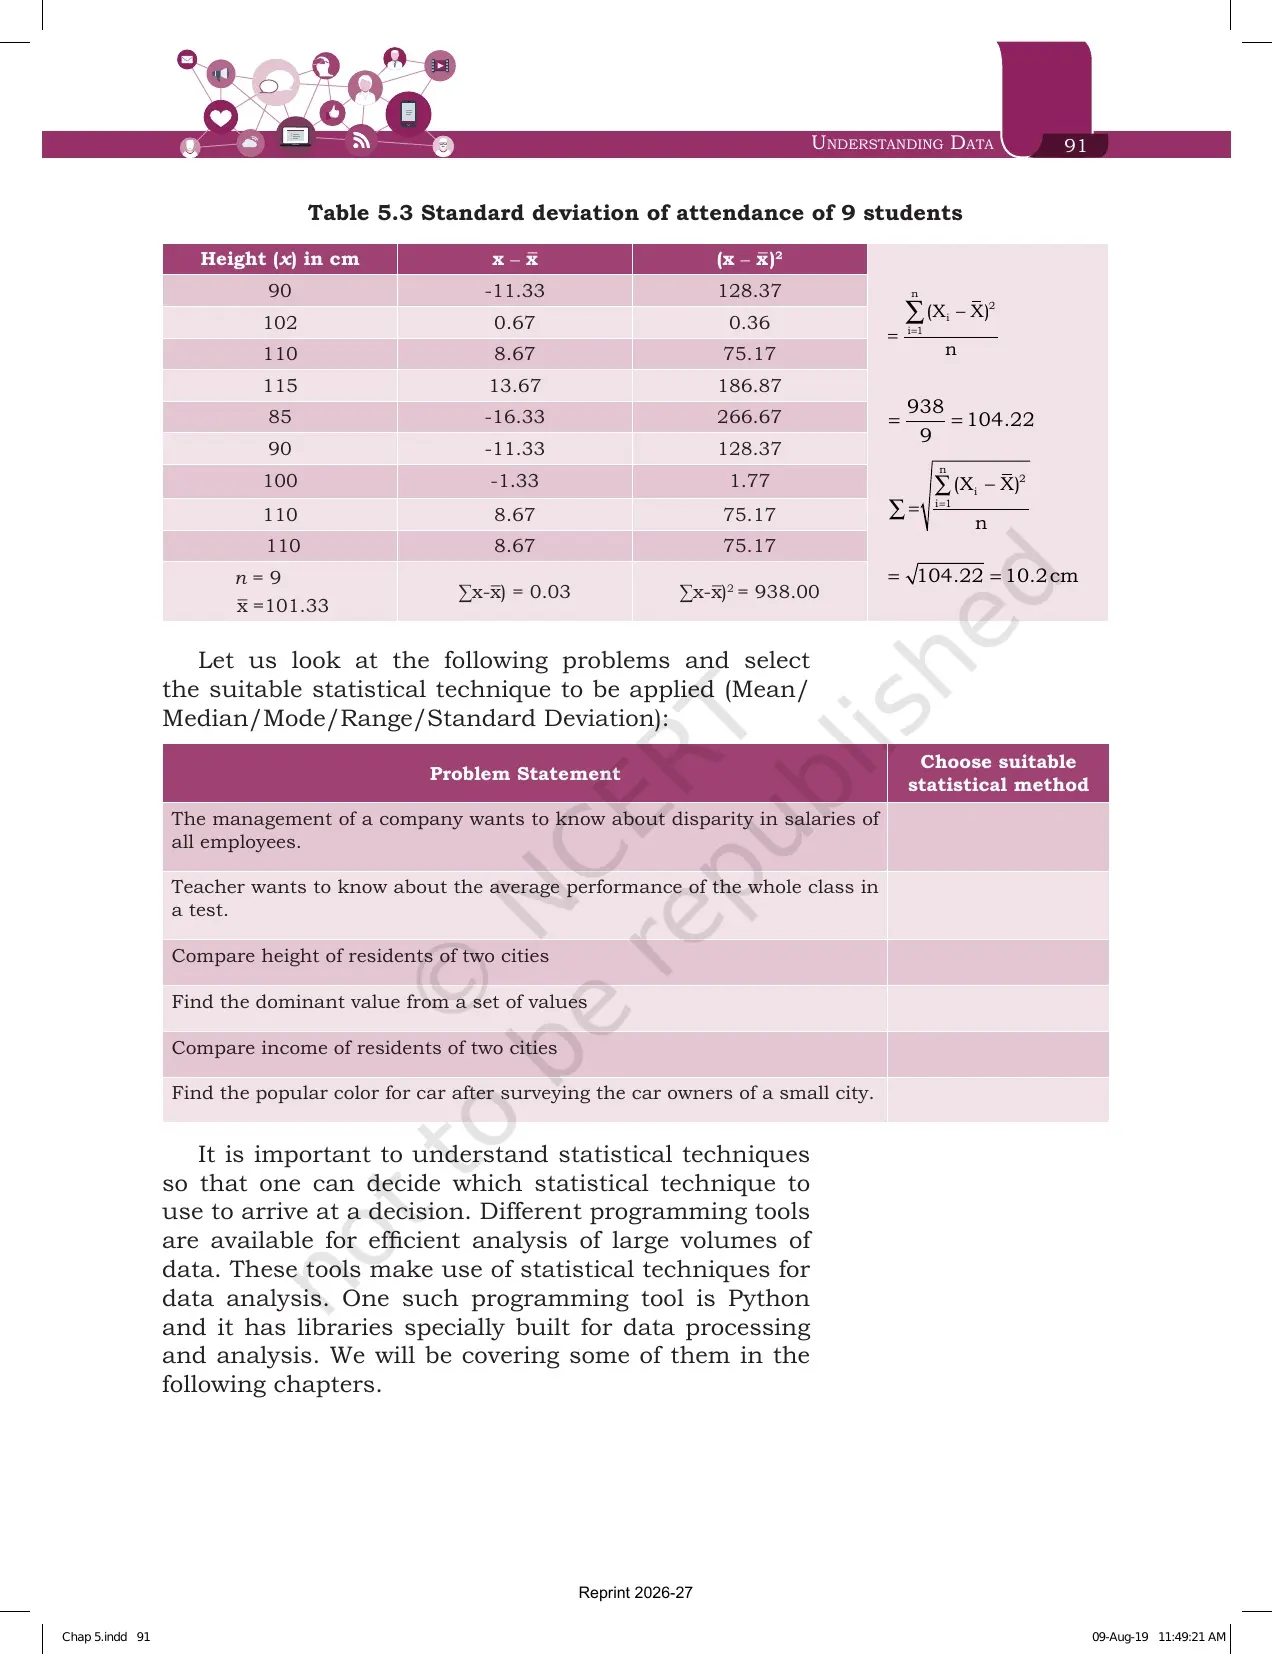
Standard deviation, written as the Greek letter sigma, is computed as σ = √i=1n (xi - x̄)2n . Example 5.5 works it in three steps that Table 5.3 sets out row by row.
- Subtract the mean from each value. With a mean of 101.33 cm, the nine differences run from -16.33 up to 13.67, and they add up to almost zero.
- Square each difference and add them. The squared differences total 938.00.
- Divide by n and take the square root. 938 divided by 9 gives 104.22, and its square root is 10.2 cm.
One line of interpretation closes the section, and it carries a mark on its own. A smaller standard deviation means the data is less spread out, and a larger standard deviation means it is more spread out.
Choosing the Right Statistical Technique for Each Problem Statement
Page 91 prints six problem statements with a blank column beside them, and you are asked to fill in the suitable method. This is the exact shape CBSE uses for case based questions, so work through it before the paper rather than during it.
| Problem statement printed on page 91 | Suitable technique | Reason to write in the answer |
|---|---|---|
| The management of a company wants to know about disparity in salaries of all employees | Standard deviation | Disparity is spread, and standard deviation uses every salary rather than the two extremes |
| A teacher wants to know the average performance of the whole class in a test | Mean | Average is the definition of mean |
| Compare the height of residents of two cities | Mean | A single average per city makes the two comparable |
| Find the dominant value from a set of values | Mode | Dominant means the highest frequency of occurrence |
| Compare the income of residents of two cities | Median | Income data carries outliers, and the median is not pulled by them |
| Find the popular colour for a car after surveying car owners of a small city | Mode | Colour is non-numeric, and mode is the only measure that works on non-numeric data |
The chapter ends by naming the tool that does all of this at scale. Python has libraries built specially for data processing and analysis, and those libraries are covered in the chapters that follow.
Exercise Questions Printed at the End of the Understanding Data Chapter
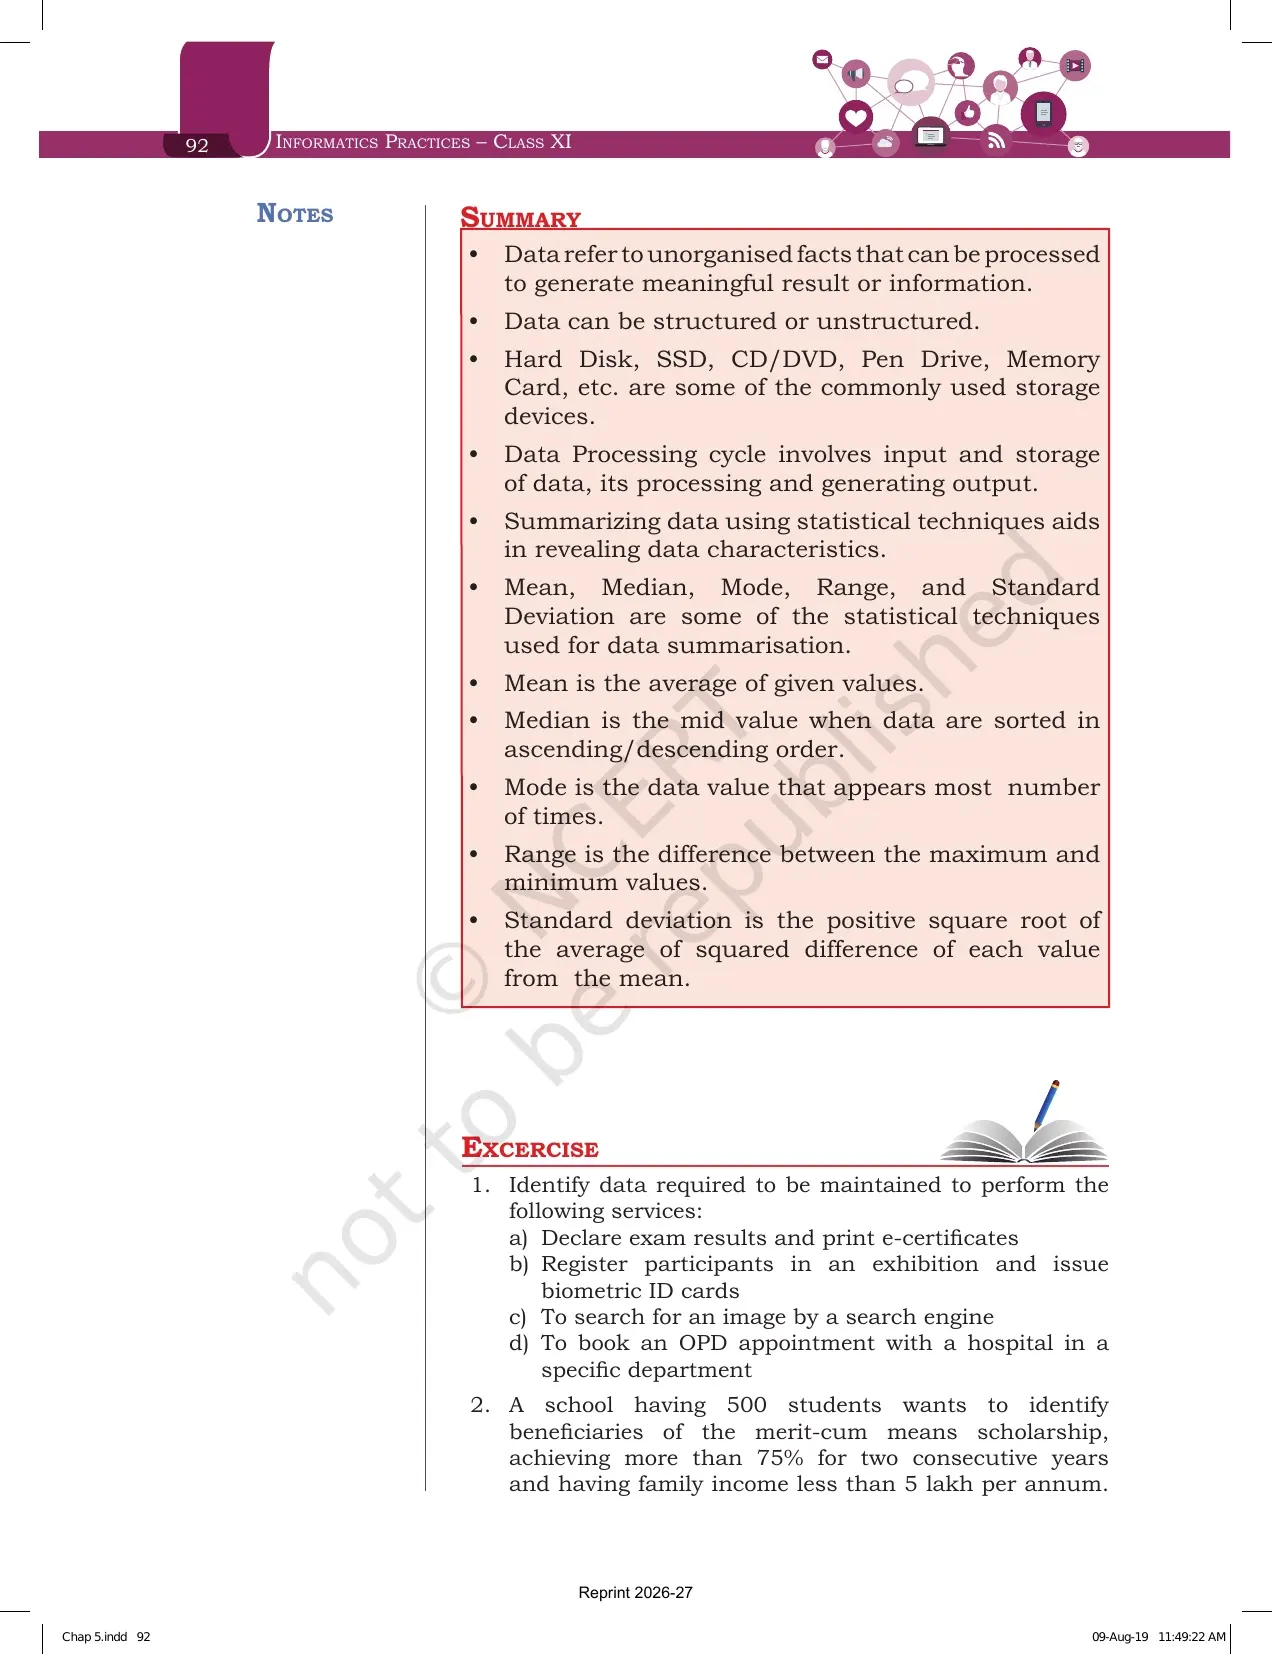
The exercise runs from page 92 to page 94 and holds 10 questions. Almost none of them are plain recall. Each one hands you a situation and asks you to pick the data, the steps or the statistical method, so practise writing the answer in the book's own three column shape.
| Question | What it asks | Which section answers it |
|---|---|---|
| 1 | Identify the data needed for four services, from printing e-certificates to booking an OPD appointment | 5.1.2 and 5.2 |
| 2 | Describe the data processing steps for picking merit-cum-means scholarship holders in a school of 500 students | 5.4 |
| 3 | Describe the data collection steps for judging a bank's popularity in a city, and the results the processing can give | 5.2 and 5.4 |
| 4 | Identify the type of data in four scenarios: recording a video, marking attendance, writing tweets and filling an online form | 5.1.2 |
| 5 | Pick the technique for the average, the range and the standard deviation of the week's temperatures 34, 34, 27, 28, 27, 34, 34 | 5.5.1 and 5.5.2 |
| 6 | Pick a technique with justification for comparing divisions across two sections, and for comparing five monthly unit tests | 5.5.1 and 5.5.2 |
| 7 | Choose the technique for counting students whose parents are both alumni, and for the variation in parents' ages | 5.5.1 and 5.5.2 |
| 8 | Choose the mode of data collection for picking an anchor from 42 students, and show how to represent skills as data | 5.2 |
| 9 | Differentiate between structured and unstructured data with one example each | 5.1.2 |
| 10 | Build a dataset for canteen items and apply statistical techniques to compare purchase price, sale price and sales | 5.1.2, 5.5.1 and 5.5.2 |
Question 5 is the one to attempt first, because the numbers are small and every part has a clean answer. The mean of 34, 34, 27, 28, 27, 34 and 34 is 31.14, the range is 34 minus 27, that is 7, and the mode is 34. Once you can do that set in under three minutes, questions 6 and 7 become one line answers.
Understanding Data Weightage in the Class 11 Informatics Practices Paper
The Class 11 Informatics Practices theory paper carries 70 marks with 30 marks of practical work. Understanding Data opens the data handling half of the textbook and leads straight into the database unit, which is the heaviest unit in the course.
| Unit | Approximate theory marks | Where Understanding Data appears |
|---|---|---|
| Unit 1, Introduction to Computer System | Around 10 | Not applicable |
| Unit 2, Introduction to Python | Around 25 | Only through the CSV and Python mention in section 5.2 |
| Unit 3, Database concepts and SQL | Around 30 | Structured and unstructured data, metadata, data collection, data storage, the data processing cycle and the five statistical measures |
| Unit 4, Introduction to Emerging Trends | Around 5 | Not applicable |
- Most common shape: a one mark question on a definition, on metadata, or on naming storage devices.
- Second most common: a two mark difference question, usually structured against unstructured data, or mean against median.
- Heaviest single item: a four or five mark case based question that gives a scenario and asks for the data fields, the processing steps and the right statistical technique.
- The same data handling base is tested again in the Computer Science and Informatics Practices domain paper of CUET (UG).
Common Mistakes Students Make in the Understanding Data Chapter
Avoid these six in the answer sheet:
- Calling an image or a video structured data because it sits in a file. The test is the row and column shape, not the file.
- Computing the median without sorting first. Sorting is step one, and skipping it loses the whole mark.
- Writing that a data set always has a mode. There is no mode when every value occurs only once, and there can be more than one mode.
- Choosing mean when the question mentions extreme salaries or incomes. Outliers pull the mean, so the median is the safer answer.
- Forgetting the square root in standard deviation. 938 divided by 9 gives 104.22, but the answer is 10.2 cm.
- Treating metadata as extra data. Metadata is data about data, such as an image's size, type and resolution.
A quick fix for the technique questions: if the word in the question is average use mean, if it is middle or income use median, if it is most common or a colour use mode, if it is difference between highest and lowest use range, and if it is spread, disparity or variation use standard deviation.
Student Feedback on the Understanding Data Chapter
What Class 11 Students Said About This Chapter
What 11,940 Class 11 Informatics Practices students told us in a Collegedunia poll run during the 2026-27 session:
- 68% of Class 11 students surveyed said the standard deviation working in Table 5.3 was the part they practised most before the paper.
- 8 out of 10 students rated the structured against unstructured data difference as the easiest two mark question in the chapter.
- 39% lost marks by picking the mean for a question that described extreme values in the data.
Source: 2026-27 Class 11 Informatics Practices student poll. Sample of 11,940 students from CBSE schools across 16 states.
How to Use the Understanding Data PDF in a Three Block Revision Plan
This chapter has almost no code, so it reads faster than the Python chapters. The risk is the opposite one: it feels easy, and then the statistics questions cost marks. Give it about ninety minutes split into three blocks, with a calculator and rough sheet beside the PDF.
- Block 1, 30 minutes. Read sections 5.1 and 5.1.1. Copy the definition of data and the seven example types, then do Activity 5.1 on a real Voter Identity card. Finish with exercise question 1.
- Block 2, 30 minutes. Read sections 5.1.2 to 5.4. Rebuild Table 5.1 in a spreadsheet, add the two totals the book describes, and draw Figure 5.1 from memory. Finish with exercise questions 2, 3, 4 and 9.
- Block 3, 30 minutes. Read section 5.5 with pen and paper. Recompute all five measures on the nine heights, then fill the technique table on page 91 yourself. Finish with exercise questions 5, 6, 7 and 10, and read the Summary on page 92.
Repeat block 3 the night before the paper, because the five statistical measures feed more marks than any other page in the chapter. Students who recomputed Table 5.3 by hand at least once reported the fewest slips on the standard deviation question.
How the Understanding Data Chapter PDF Works with Notes, Solutions and Handwritten Notes
The book PDF gives you the original text, both figures, the three tables and the exercise list. It does not give you written answers or a condensed summary. Those sit on the other Collegedunia pages for the same chapter, and using them together is faster than reading any one of them alone.
| Resource | What it adds beyond the book PDF | Link |
|---|---|---|
| NCERT Solutions | Written answers to all 10 exercise questions, including the scenario answers for questions 2, 3 and 10 and the full technique justification for questions 5, 6 and 7 | Understanding Data Class 11 NCERT Solutions |
| Revision Notes | The structured against unstructured comparison, the data processing cycle and all five statistical formulas condensed into one revision file | Understanding Data Class 11 Notes |
| Handwritten Notes | A topper's handwritten revision pages with the standard deviation table worked out by hand and colour coded technique cues | Understanding Data Class 11 Handwritten Notes |
Also Check: the Working with Lists and Dictionaries chapter PDF, which gives you the list and dictionary structures used to hold the data this chapter teaches you to summarise.
All Chapters of Class 11 Informatics Practices in NCERT Book PDF Format
Five chapters of the Class 11 Informatics Practices textbook are available here as official NCERT Book PDF files. The first two cover computing and technology, the next two build Python, and this one opens the data handling work. Every link below opens the same official NCERT file for the 2026-27 session.
| Chapter | Pages | NCERT Book PDF |
|---|---|---|
| Chapter 1 | 14 | Computer System Class 11 NCERT Book PDF |
| Chapter 2 | 16 | Emerging Trends Class 11 NCERT Book PDF |
| Chapter 3 | 24 | Brief Overview of Python Class 11 NCERT Book PDF |
| Chapter 4 | 26 | Working with Lists and Dictionaries Class 11 NCERT Book PDF |
| Chapter 5 | 14 | Understanding Data Class 11 NCERT Book PDF (you are here) |
Understanding Data Class 11 Informatics Practices Chapter 5 NCERT Book PDF FAQs
Questions Class 11 Students Ask Most About the Understanding Data Chapter PDF
Ques. Where can I download the NCERT Class 11 Informatics Practices Chapter 5 Understanding Data PDF?
Ans. You can download it free from the card at the top of this page. It is the official NCERT chapter file for the 2026-27 session and carries all 14 pages, including Table 5.1 on structured data, Figure 5.1 with the data processing cycle, Table 5.3 with the standard deviation working, the Summary on page 92 and the full exercise set.
Ques. What topics are covered in Chapter 5 Understanding Data?
Ans. Five heads are listed on the chapter opener: Introduction to Data, Data Collection, Data Storage, Data Processing, and Statistical Techniques for Data Processing. Inside those it also covers the importance of data, structured and unstructured data, metadata, storage devices, the data processing cycle, and the five measures of mean, median, mode, range and standard deviation.
Ques. What is data according to the NCERT Class 11 Informatics Practices textbook?
Ans. Data is a collection of characters, numbers and other symbols that represents values of some situations or variables. The book also notes that data is plural and the singular of the word data is datum. Using computers, data is kept in electronic form because electronic processing is faster and easier than manual processing.
Ques. What is the difference between structured and unstructured data?
Ans. Structured data is organised and can be recorded in a well defined format, normally a table of rows and columns where each column is one attribute and each row is one observation. An inventory of kitchen items in Table 5.1 is the book's example. Unstructured data is data that is not in the traditional row and column structure, such as a newspaper page, an email, a web page or a social media message. This is exercise question 9.
Ques. What is metadata with an example?
Ans. Metadata is basically data about data, and it is used to describe unstructured data. The subject, recipient, main body and attachment of an email are the metadata for that email. For an image file the metadata includes the image size in KB or MB, the image type such as JPEG or PNG, and the image resolution.
Ques. What are the steps in the data processing cycle printed in Figure 5.1?
Ans. Raw data in the form of numbers, text or images goes through data processing and comes out as information in the form of a table, chart or text. The cycle has three stages. Input covers data collection, data preparation and data entry. Processing covers store, retrieve, classify and update. Output covers reports, results and the processing system.
Ques. Which storage devices are named in the Understanding Data chapter?
Ans. The chapter names Hard Disk Drive (HDD), Solid State Drive (SSD), CD and DVD, Tape Drive, Pen Drive and Memory Card. It defines data storage as the process of storing data on storage devices so that data can be retrieved later, and notes that falling storage costs have made this easier as data volumes grow.
Ques. How is the mean calculated in Example 5.1 of the chapter?
Ans. The nine student heights are 90, 102, 110, 115, 85, 90, 100, 110 and 110 centimetres. Adding them gives 912, and dividing by 9 gives a mean of 101.33 cm. The chapter adds that mean is not a suitable choice when the data has outliers, so extreme values should be removed before the mean is taken.
Ques. What is the difference between mean and median in Class 11 Informatics Practices?
Ans. Mean is the average, found by adding all values and dividing by how many there are. Median is the middle value once the data is sorted in ascending or descending order, and it is the average of the two middle values when the count is even. Mean is far more sensitive to outliers, so median is the safer measure for data such as income.
Ques. How do you find the mode, and can it be used on non-numeric data?
Ans. Mode is the value that appears the most number of times, worked out from the frequency of occurrence of each distinct value. A data set has no mode if every value occurs only once, and it can have several modes if two or more values share the highest frequency. Mode is the only one of the three central tendency measures that works on non-numeric data such as car colour.
Ques. What is the difference between range and standard deviation?
Ans. Range is the largest value minus the smallest value, so it uses only the two extremes and is badly affected by an outlier. Standard deviation uses every value in the data and is the positive square root of the average of the squared difference of each value from the mean. On the nine heights the range is 30 cm and the standard deviation is 10.2 cm.
Ques. How is standard deviation calculated in Example 5.5?
Ans. Take the mean of 101.33 cm, subtract it from each of the nine heights, and square each difference. Those squared differences add up to 938. Dividing 938 by 9 gives 104.22, and the square root of 104.22 gives a standard deviation of 10.2 cm. A smaller value means the data is less spread out, and a larger value means it is more spread out.
Ques. How many exercise questions are there at the end of the Understanding Data chapter?
Ans. There are 10 questions on pages 92 to 94. Most are scenario based rather than recall, covering the data needed for four services, the processing steps for a scholarship list, data collection for a bank survey, the type of data in four situations, the right statistical technique in three separate questions, the structured against unstructured difference, and a canteen dataset to build and analyse.
Ques. Is Understanding Data part of the 2026-27 Class 11 Informatics Practices syllabus?
Ans. Yes. Understanding Data is Chapter 5 of the NCERT Informatics Practices textbook for Class 11 and it opens the data handling half of the book, leading into the database chapters. The PDF on this page is the current 2026-27 reprint that CBSE schools follow, and the same content is tested again in the CUET (UG) domain paper.



Comments