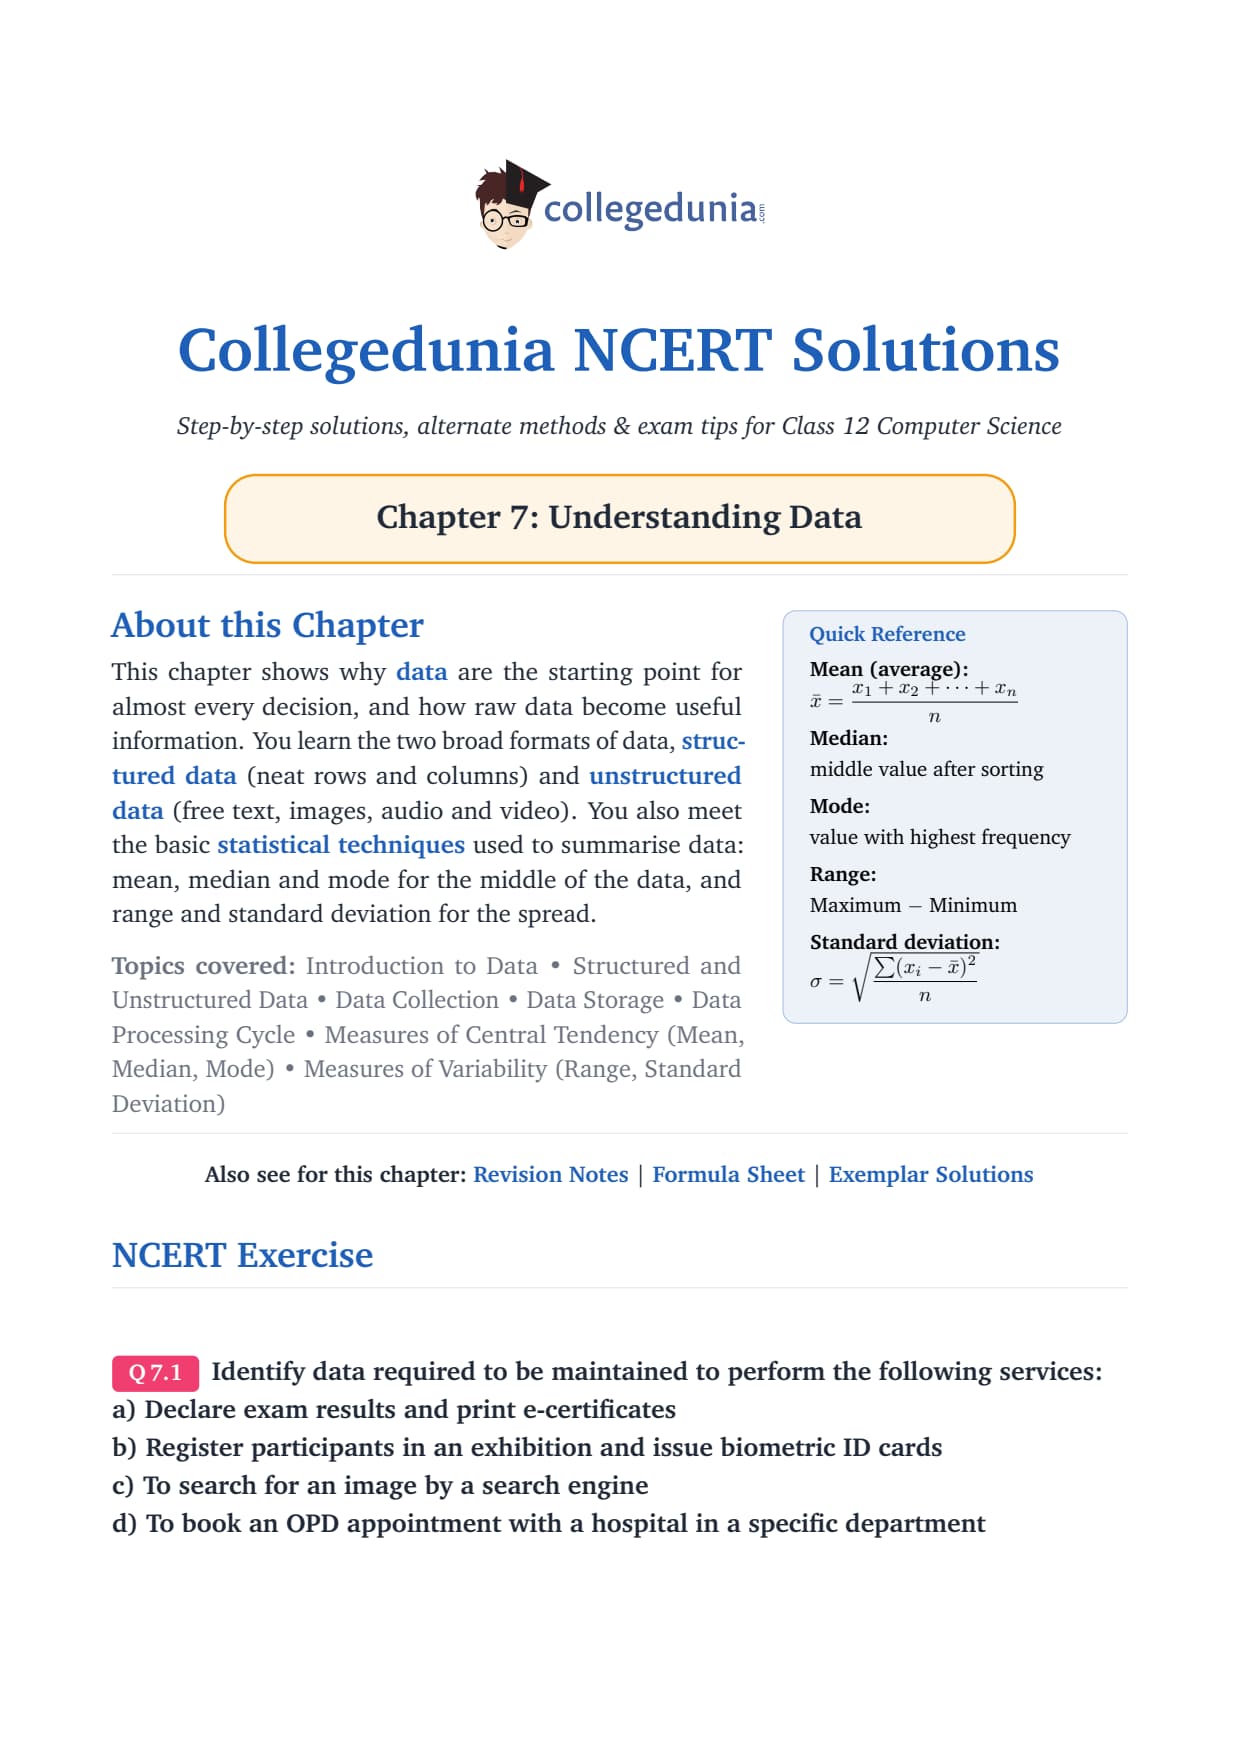
The NCERT Solutions for Class 12 Computer Science Chapter 7 Understanding Data cover all 10 exercise questions, according to the latest 2026-27 CBSE syllabus. Every answer follows the textbook's own flow: what data are, how structured and unstructured data differ, the steps of the data processing cycle, and the basic statistical techniques (mean, median, mode, range, standard deviation) used to summarise data.
All 10 NCERT questions solved with clear steps, sample datasets, and an Expert Solution per question that adds exam strategy and common-trap warnings.
Full coverage of structured versus unstructured data, primary versus secondary data, data collection methods, and the central-tendency and spread measures the CBSE board paper tests directly.
Answers aligned with the 2026-27 CBSE Class 12 Computer Science syllabus and useful for CUET and JEE-level data questions; no NEET references because Computer Science is not a medical subject.
Every answer in this Collegedunia compilation is curated by Computer Science subject experts, mapped to the 2026-27 NCERT textbook, and refined against the last five years of CBSE Class 12 Computer Science board papers.
Student Feedback: What 9,800 students told us about this chapter
61% of Class 12 students said the hardest part of Understanding Data was choosing the right statistical technique for each question. 2 out of 5 students told us they mixed up range and standard deviation in the board exam.
Toppers found that writing a one-line reason next to each chosen technique added 1 to 2 marks on the justification questions, and the average student spent 2 to 3 hours on this chapter across the first read and exercise practice.
Source: 2026-27 Class 12 Computer Science student poll. Sample of 9,800 students from CBSE schools across 12 states, conducted before the 2026 boards.
What the NCERT Solutions for Class 12 Computer Science Chapter 7 Understanding Data Cover
This chapter answers one big question: how do raw data become useful information? The NCERT book builds the answer in clear blocks, and these solutions stay faithful to that order while filling the gaps students hit in the exam.
What data are: data are raw facts, and processing turns them into information through the input, process and output cycle.
Structured and unstructured data: structured data fit fixed rows and columns; unstructured data (text, images, audio, video) do not.
Data collection and storage: primary versus secondary data, the methods used to gather data, and how data are stored for later use.
Statistical techniques: mean, median and mode for the centre of the data, and range and standard deviation for the spread.
Exercise-wise Breakdown of the Understanding Data Chapter NCERT Solutions
Chapter 7 of NCERT Class 12 Computer Science carries 10 end-of-chapter exercise questions. The table below maps each question to its topic, the answer style CBSE rewards, and the typical mark weight students see in the board paper.
Question
Topic covered
Answer style
Typical marks
Q 1
Identify the data (attributes) needed by four services
List the fields each service must store
1 mark per part (4 parts)
Q 2
Data processing steps for a scholarship list
Input, process (filter), output cycle
3 to 4 marks
Q 3
Collect and process bank popularity data
Collection (primary, secondary) plus mean
3 to 4 marks
Q 4
Classify four scenarios as structured or unstructured
One word per part with a short reason
1 mark per part (4 parts)
Q 5
Pick mean, range and standard deviation for temperatures
Name the technique and show the working
3 marks
Q 6
Choose mode or mean to compare results
Technique plus a because-clause reason
2 to 3 marks
Q 7
Frequency count versus standard deviation
Map "how many" and "how varied" to a tool
2 marks
Q 8
Observation method and a rating-scale table
Collection method plus a structured table
2 to 3 marks
Q 9
Differentiate structured and unstructured data
Difference table with one example each
2 to 3 marks
Q 10
Build a canteen dataset and compare items
Table plus difference, mean and spread
4 to 5 marks
The dataset-building question (Q 10) and the technique-choice questions (Q 5 and Q 6) carry the heaviest marks. Students who name the correct measure and add a one-line reason for the choice score full marks.
Structured and Unstructured Data: The Column Test
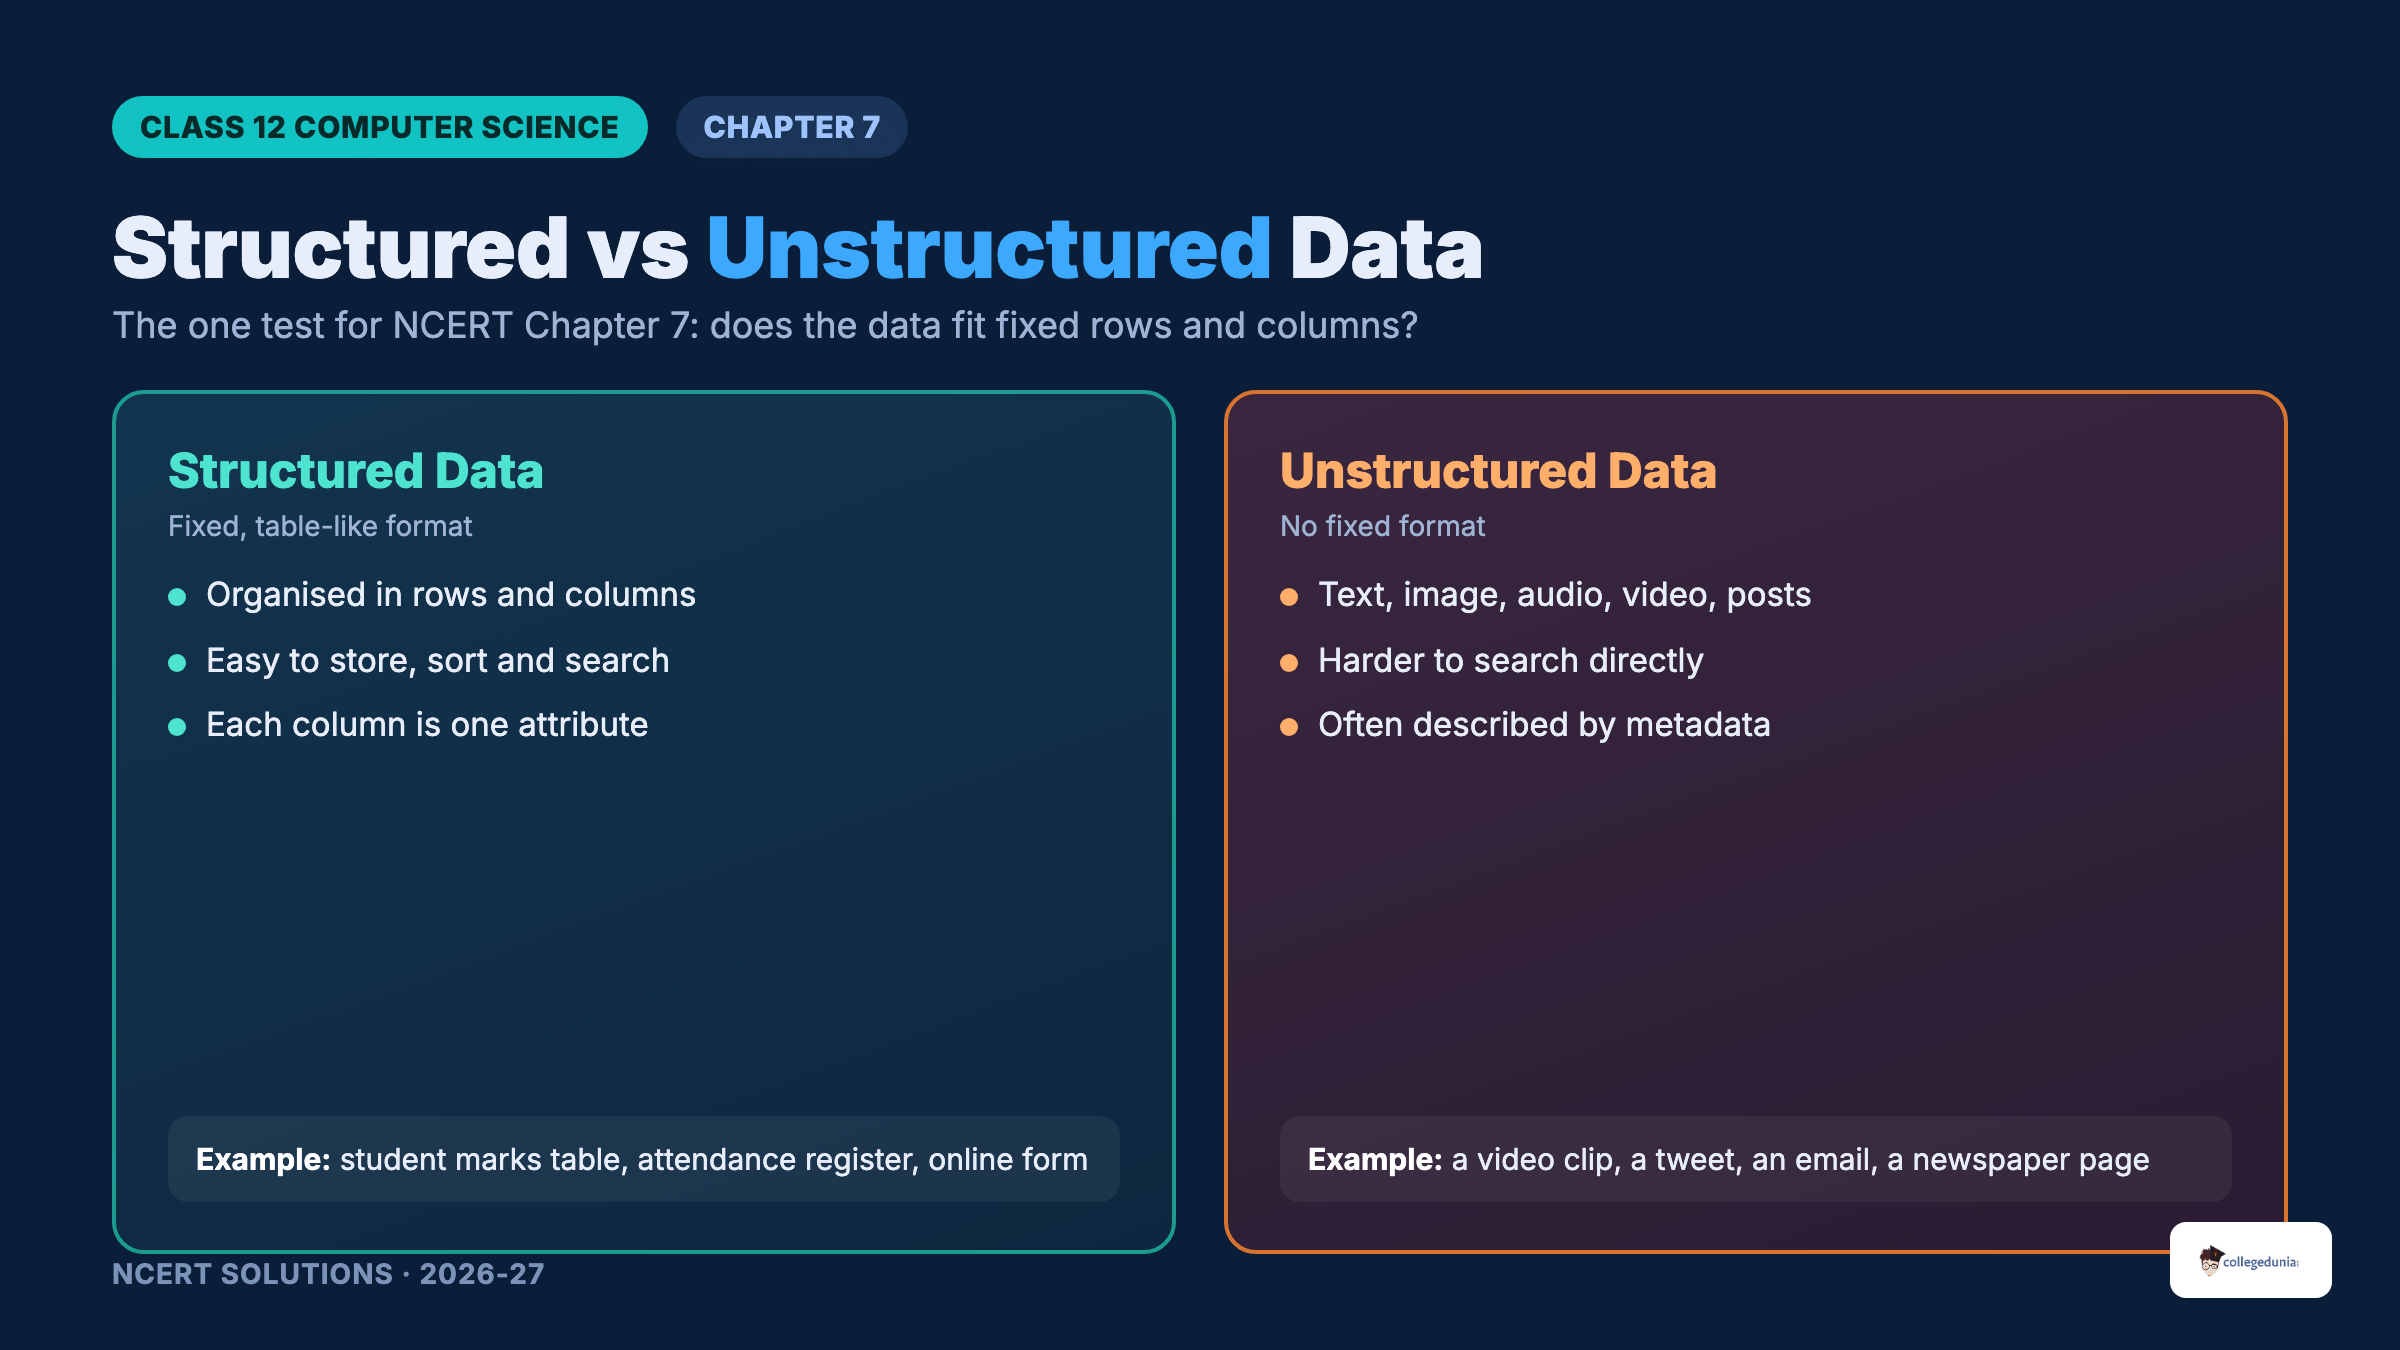
Data come in two broad formats, and the whole chapter rests on telling them apart. Structured data are organised in a fixed, well-defined format, usually a table of rows and columns, where each column is one attribute and each row is one record. Unstructured data have no fixed row-and-column format. The test is simple: can you put this neatly into named columns? If yes, it is structured; if no, it is unstructured.
Structured: a marks table, an attendance register, an online application form. Easy to store, sort and search.
Unstructured: a video, a tweet, an email, a newspaper page. Harder to search, and often described by metadata (data about the data).
Why it matters: the next two chapters on databases and SQL are built on structured data, so getting this contrast right sets up everything that follows.
Quick Tip: Judge the format, not the topic. A tweet is text, which feels orderly, but one tweet is a single word and the next is a paragraph with three images, so there is no shared column layout. That makes a tweet unstructured.
This single test answers Question 4 and Question 9 cleanly, and it also explains Question 1: when a question says "identify the data" for a service, it is asking you to list the structured attributes (the columns) that service must store.
Identifying Data and the Data Processing Cycle
Before any service can run, you must decide what it stores. "Identify the data" means name every attribute (field) the service needs. Once the data are collected, the data processing cycle turns them into a result through three stages.
Input: collect and enter the data, for example marks and family income for all 500 students in Question 2.
Processing: clean, sort, filter and calculate. In Question 2 this is filtering on marks above 75% in both years AND income below 5 lakh.
Output: the final report, such as the sorted scholarship beneficiary list.
A handy trick for the "identify the data" questions is to picture the service's final output and work backwards. Any field that must appear on the e-certificate (name, exam, marks, result, certificate number) has to be stored first, so it belongs on your list of attributes.
Watch Out: In Question 2, "two consecutive years" is an AND of two checks, not one. A student who scored above 75% in only one year does not qualify. The full rule is Year1 above 75 AND Year2 above 75 AND income below 5 lakh.
Data Collection: Primary, Secondary and the Observation Method
Data collection means gathering the data you need from the right source. The chapter splits data by where it comes from and by how it is gathered, and both ideas show up in the exercise.
Primary versus secondary data (Q 3)
Primary data are collected fresh by the investigator for the current purpose, for example a new survey. Secondary data already exist for another purpose and are reused. In Question 3 the bank already stores every account and balance, so most of that data is secondary and can be pulled straight from its database; only the family grouping might need a small fresh primary survey.
The observation method (Q 8)
Some data cannot be collected by asking. In Question 8 the teacher must watch each student sing, check each student's writing, and observe monitoring behaviour, so the data are gathered by the observation method, a form of primary data collection. The skills are then stored as a rating scale (say 1 to 5) in a table, one row per student and one column per skill, which turns fuzzy qualities into structured data the teacher can sort.
Tip: A numeric rating beats free-text labels like "very good" because numbers can be added, sorted and compared automatically, while words cannot.
Statistical Techniques: Mean, Median, Mode, Range and Standard Deviation
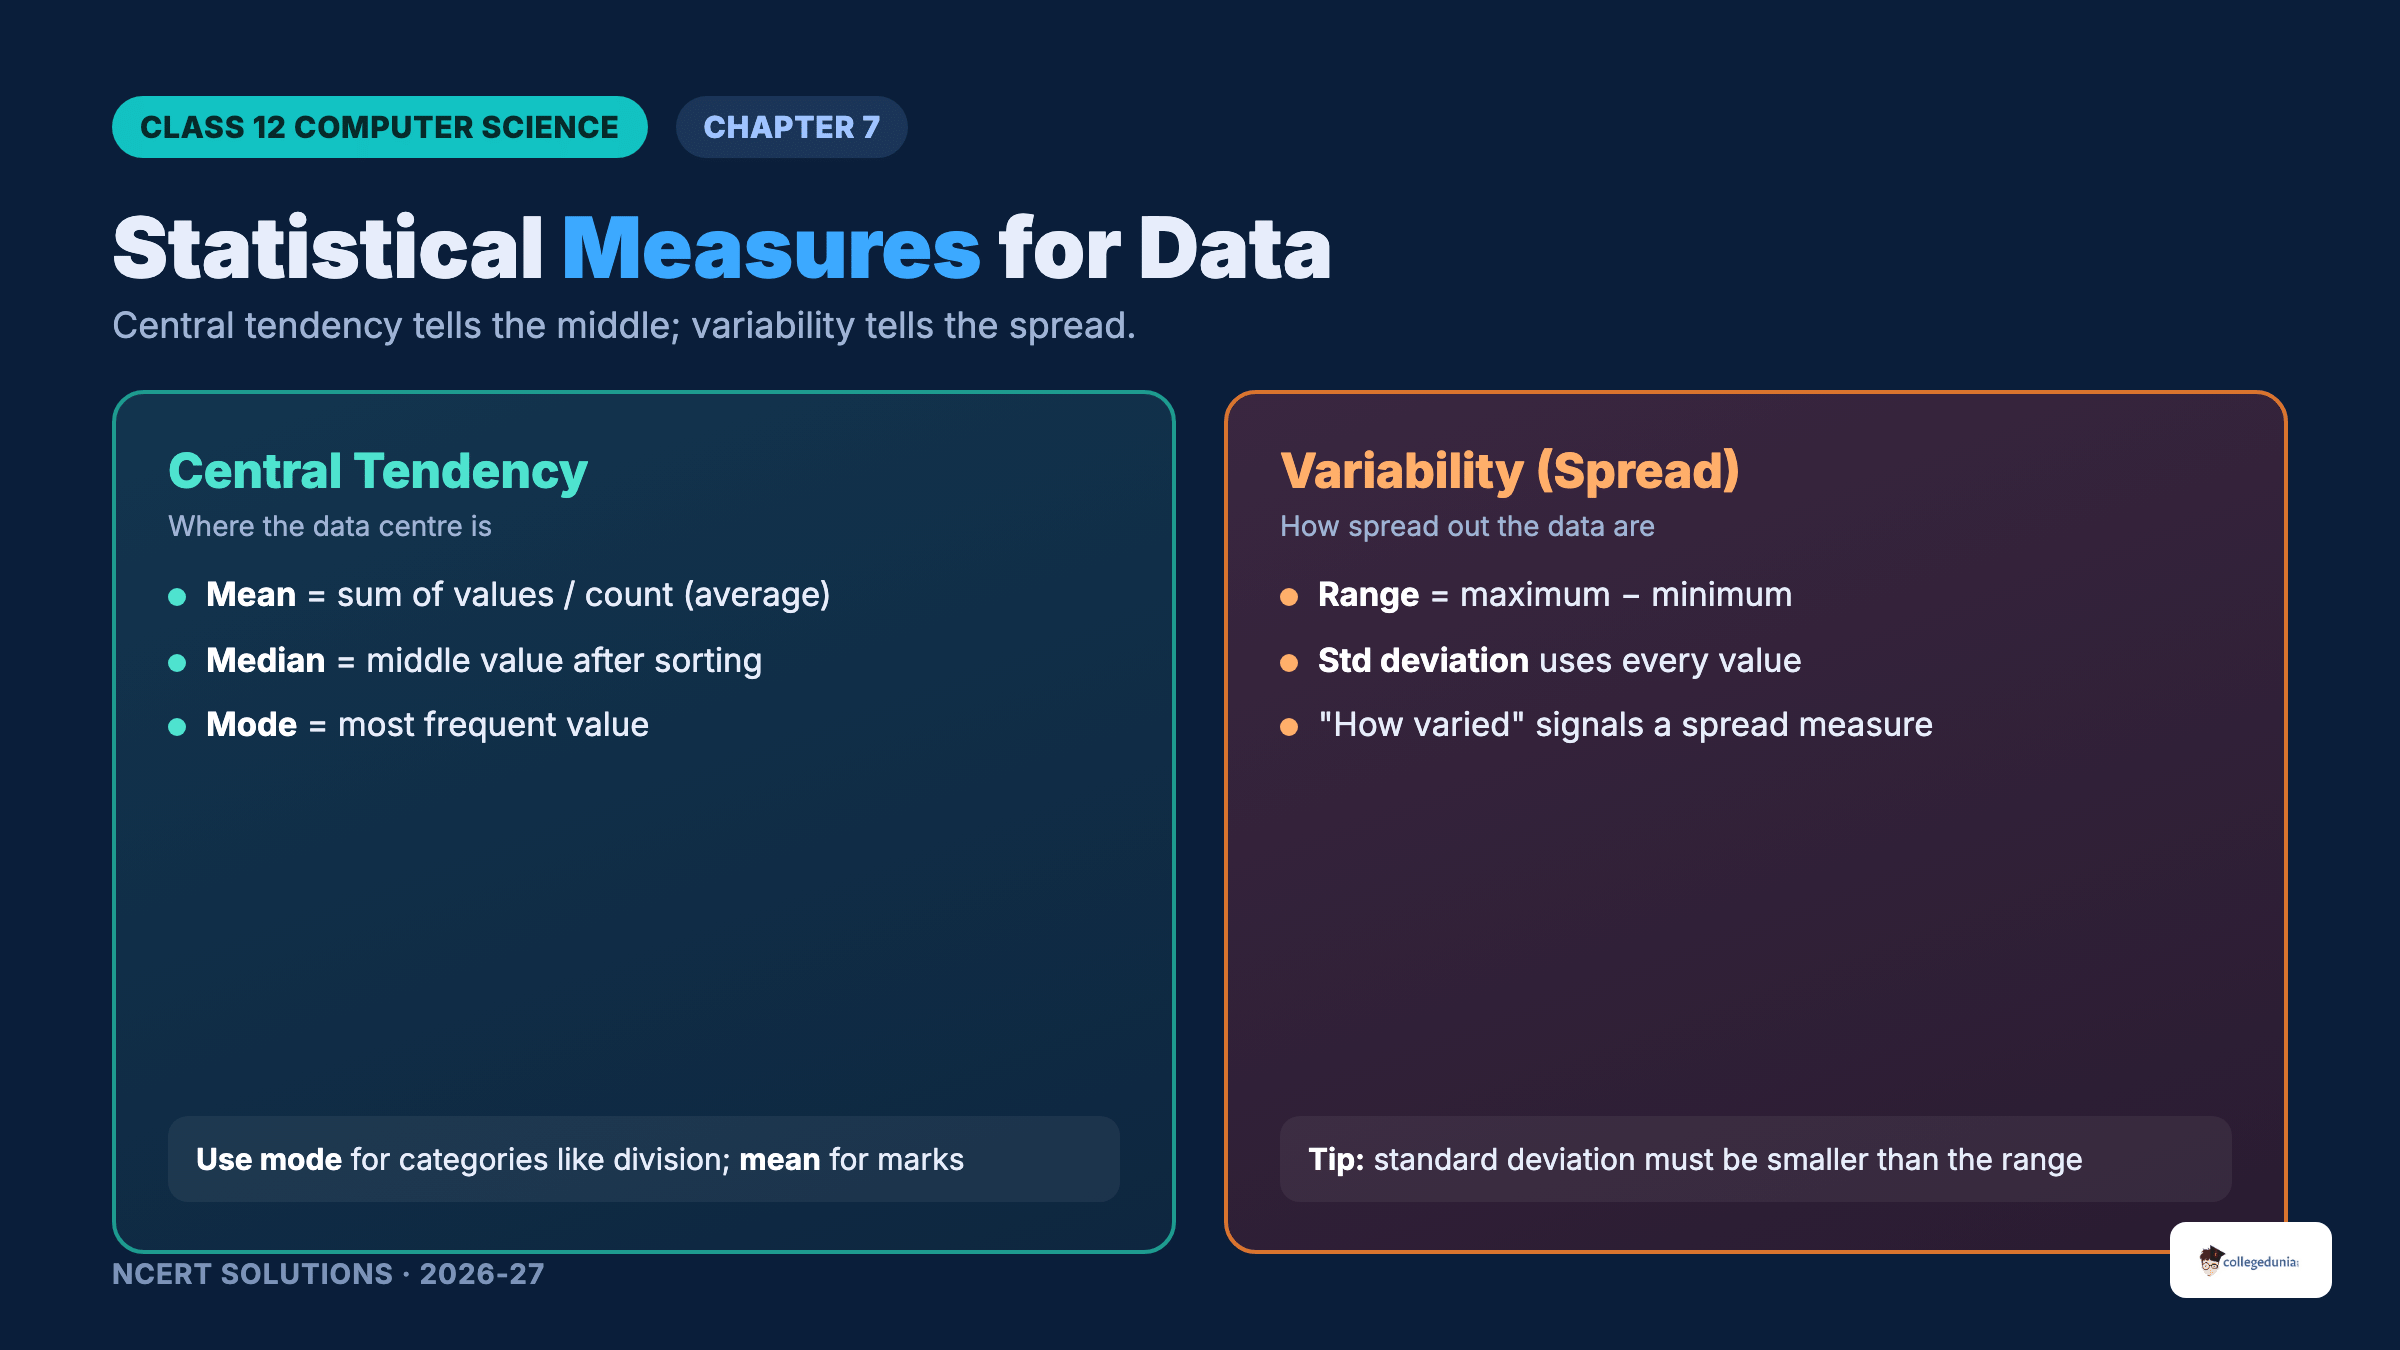
Half the exercise asks you to pick the right statistical technique, so keep the two families clear. Measures of central tendency find the middle of the data; measures of variability find the spread.
Central tendency: mean, median, mode
The mean is the average: add all values and divide by the count. The median is the middle value after sorting. The mode is the most frequent value. The right choice depends on the data type. For numeric marks, use the mean (Question 6 part b). For a category such as division, use the mode, because you cannot average a label like "First Division" (Question 6 part a).
Variability: range and standard deviation
The range is the maximum value minus the minimum value, so it looks at only two extremes. The standard deviation uses every value: it is the square root of the average of the squared differences from the mean. For the seven temperatures 34, 34, 27, 28, 27, 34, 34 in Question 5, the mean is about 31.14, the range is 34 minus 27 which is 7, and the standard deviation is about 3.31.
Measure
What it finds
How to get it
Mean
Average (centre)
Sum of values divided by count
Median
Middle value (centre)
Sort the values, take the middle one
Mode
Most common value (centre)
The value that occurs most often
Range
Spread between extremes
Maximum minus minimum
Standard deviation
Spread using all values
Square root of the average squared difference from the mean
Remember: The standard deviation must always come out smaller than the range, because the range captures the full spread while the standard deviation is a kind of average distance from the centre. Use this as a quick self-check on Question 5.
Common Mistakes Students Make in the Understanding Data Chapter
The repeat-offender mistakes in Understanding Data board answers:
Confusing range and standard deviation: both measure spread, but range uses only two values while standard deviation uses all of them. Do not give the range when the question asks for standard deviation.
Classifying data by topic, not format: a tweet is text but has no fixed columns, so it is unstructured. Judge the format alone.
Treating "two consecutive years" as one check: in Question 2 both years must be above 75%, joined by AND.
Naming a technique without a reason: Questions 6, 7 and 10 award marks for the justification, so always add a because-clause.
Using the n minus 1 standard deviation: the NCERT formula divides by n, so for Question 5 the answer is about 3.31, not the 3.58 a calculator's sample mode gives.
How to Use the Understanding Data NCERT Solutions PDF for Board Prep
The Understanding Data chapter is concept-heavy rather than program-heavy, so the best approach is two passes: one for the data formats and definitions, one for matching techniques to questions.
First pass: data formats and definitions (1 hour)
Read the chapter and note structured versus unstructured data, primary versus secondary data, and the data processing cycle. Write one line of meaning next to each term so the definitions stick before you attempt the exercise.
Second pass: match techniques to questions (1 to 1.5 hours)
Work Questions 5, 6, 7 and 10 on paper, deciding the technique and writing a short reason each time. Then open these solutions and check your choices and your arithmetic. Pay attention to the n formula for standard deviation and to the AND logic in the filtering question.
CUET and JEE angle
For students preparing competitive exams, the structured-versus-unstructured idea and the basic statistics here appear in CUET Computer Science and in JEE-level data and reasoning questions. The technique-choice habit built in this chapter doubles as competitive prep.
Previous Year Question Trends from the Understanding Data Chapter
The Understanding Data chapter is tested in CBSE board papers mainly through definition, classify-the-data, and choose-the-technique questions. The table below maps the asked question types across recent board papers.
Year
Question type asked
Marks
2025
Differentiate structured and unstructured data; give one example
2
2024
Classify given scenarios as structured or unstructured
2
2023
Define primary and secondary data with examples
2
2022
Name the measure of central tendency for a given task
1 + 2
2021
Describe the data processing cycle steps
3
Also Check: The full set of CBSE board paper questions for this chapter is included in the downloadable PDF above, updated for the 2026-27 cycle.
Other Resources for Class 12 Computer Science Chapter 7 Understanding Data
Pair this NCERT Solutions PDF with the matching revision notes, handwritten notes and the official NCERT book chapter. All resources for Class 12 Computer Science Chapter 7 Understanding Data are linked below.
Resource
What it covers
Open
NCERT Solutions
Step-by-step answers to all 10 exercise questions, with an Expert Solution for each.
You are here
Notes
Concept-first revision notes on data formats, the processing cycle, and statistical measures.
NCERT Solutions for Class 12 Computer Science: All Chapters
Related Links: Use the table below to open the NCERT Solutions for the other chapters of Class 12 Computer Science. Every chapter ships with the same step-by-step answer style, full PDF download, and revision FAQ.
All NCERT Solutions for Class 12 Computer Science Chapter 7 Understanding Data with Step-by-Step Solutions
Q 1
Identify data required to be maintained to perform the following services: a) Declare exam results and print e-certificates b) Register participants in an exhibition and issue biometric ID cards c) To search for an image by a search engine d) To book an OPD appointment with a hospital in a specific department
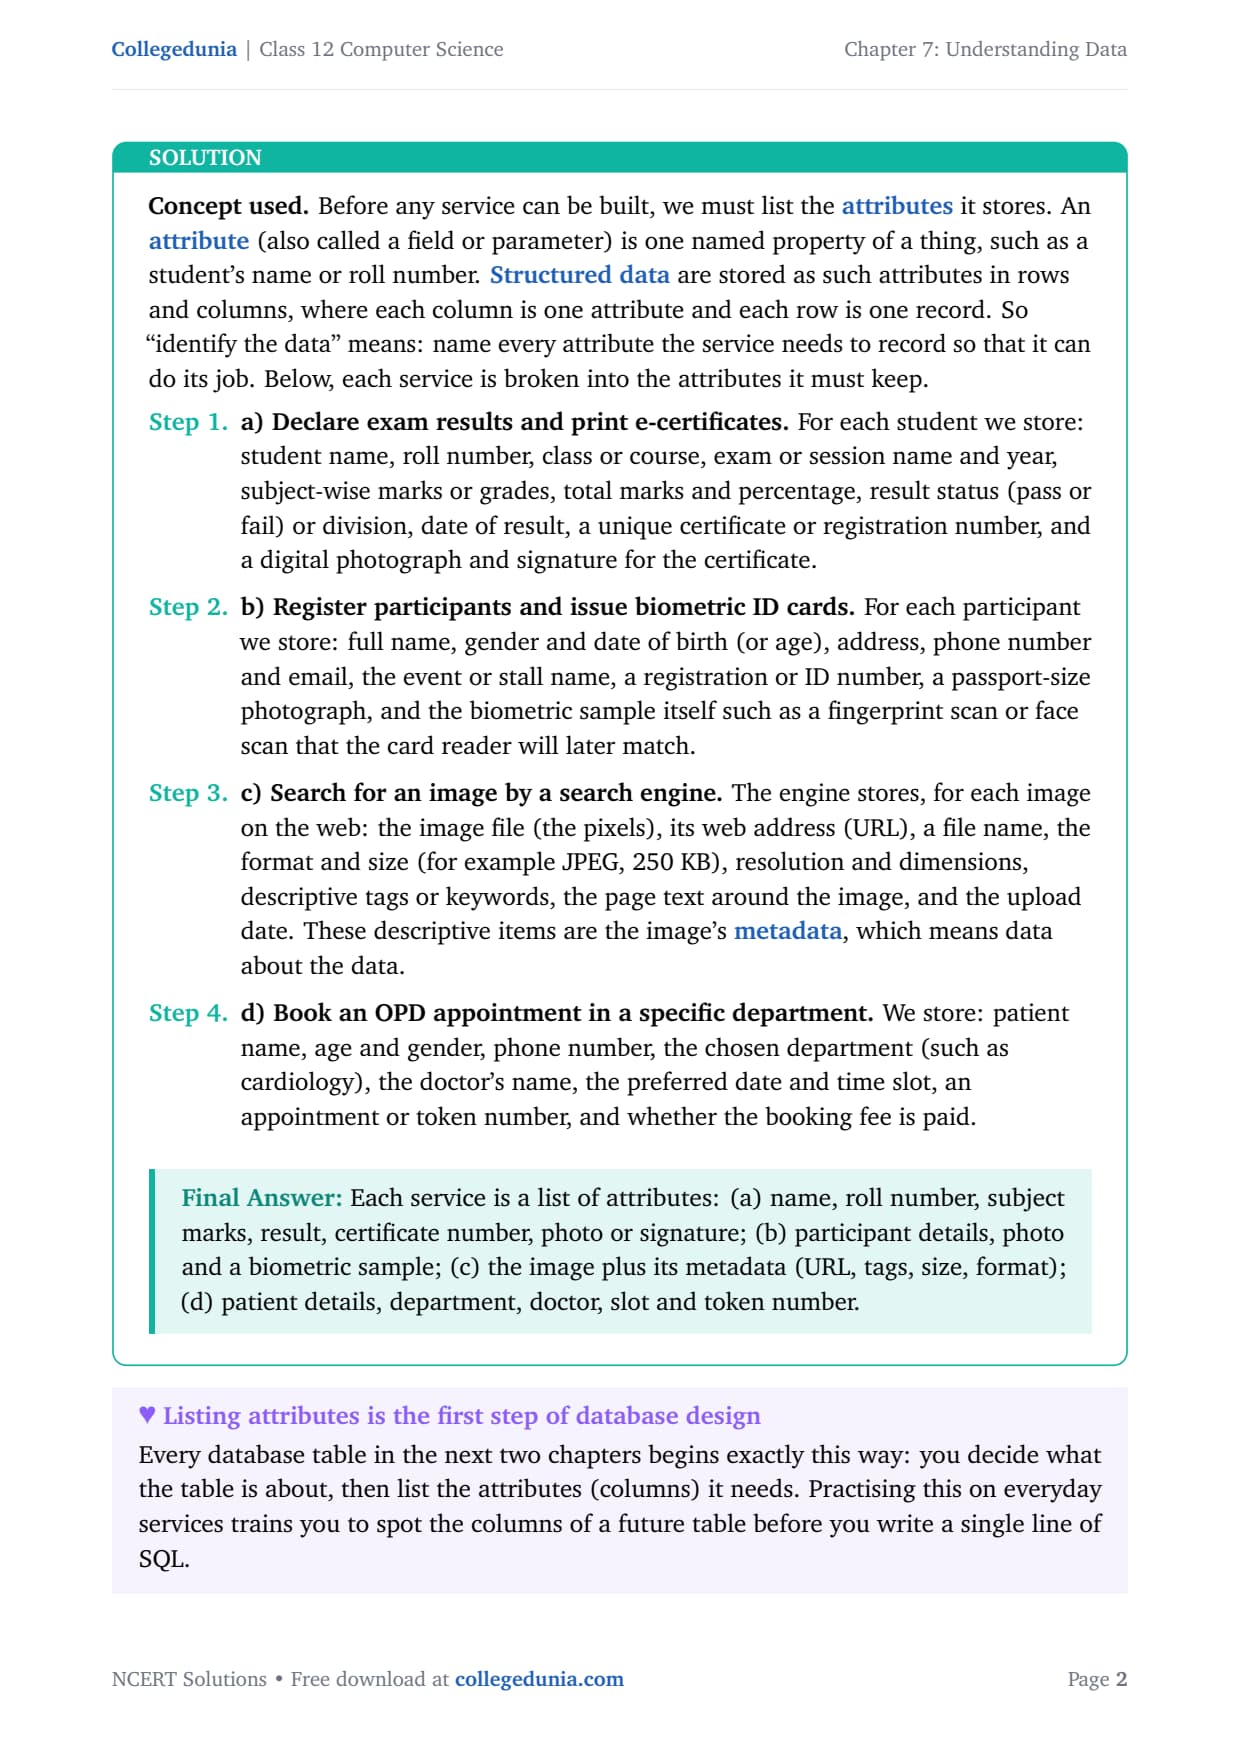
To "identify the data" for a service means to list every attribute (named field) it must store. An attribute is one property of a thing, such as a student's name or roll number. So for each service we name the fields it needs to do its job.
a) Exam results and e-certificates. Student name, roll number, class or course, exam name and year, subject-wise marks or grades, total and percentage, result status or division, date of result, a unique certificate number, and a photograph and signature for the certificate.
b) Register participants and issue biometric ID cards. Full name, gender and date of birth, address, phone and email, event or stall name, a registration or ID number, a photograph, and the biometric sample itself (a fingerprint or face scan) that the reader will later match.
c) Image search by a search engine. The image file, its web address (URL), file name, format and size, resolution and dimensions, descriptive tags or keywords, the page text around the image, and the upload date. These descriptive items are the image's metadata, meaning data about the data.
d) Book an OPD appointment. Patient name, age and gender, phone number, the chosen department, the doctor's name, the preferred date and time slot, an appointment or token number, and whether the fee is paid.
Answer: Each service is a list of attributes: (a) name, roll number, marks, result, certificate number, photo or signature; (b) participant details, photo and a biometric sample; (c) the image plus its metadata; (d) patient details, department, doctor, slot and token number.
AI
Ananya Iyer
M.Tech Computer Science, IIT Bombay
Verified Expert
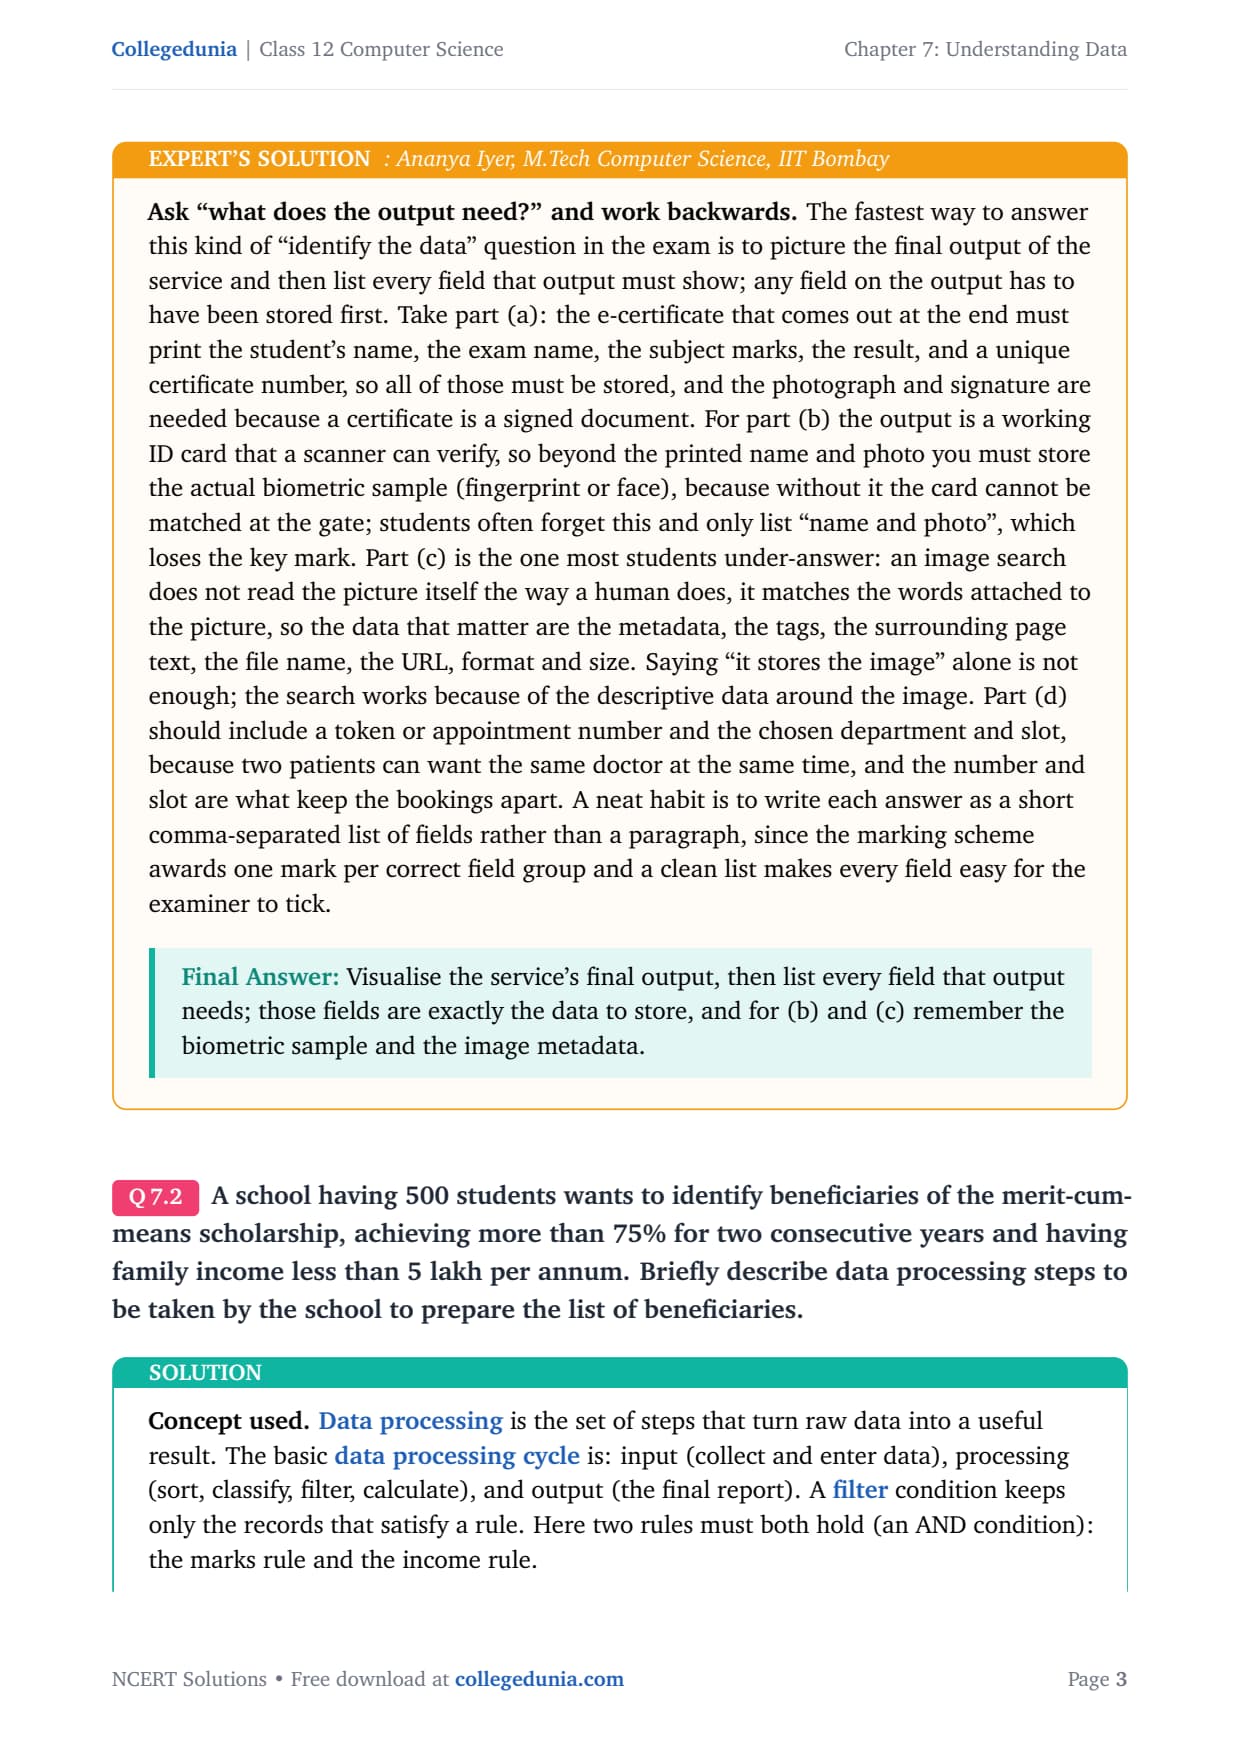
Ask "what does the output need?" and work backwards. Picture the final output of the service, then list every field that output must show, because any field on the output had to be stored first.
For (a), the e-certificate must print the name, exam, marks, result and a unique certificate number, plus a photo and signature because a certificate is a signed document, so all of those must be stored.
For (b), the output is a card a scanner can verify, so beyond the printed name and photo you must store the actual biometric sample; "name and photo" alone loses the key mark.
Part (c) is the one most students under-answer: an image search matches the words attached to the picture, so the metadata, tags, surrounding text, file name and URL are the data that matter, not just "the image".
Write each answer as a short comma-separated list of fields, not a paragraph, because the scheme awards one mark per correct field group and a clean list is easy to tick.
Answer: Visualise each service's final output, then list every field it needs; for (b) include the biometric sample and for (c) include the image metadata.
Q 2
A school having 500 students wants to identify beneficiaries of the merit-cum-means scholarship, achieving more than 75% for two consecutive years and having family income less than 5 lakh per annum. Briefly describe data processing steps to be taken by the school to prepare the list of beneficiaries.
Data processing turns raw data into a useful result through the cycle of input (collect), processing (filter and calculate) and output (report). A filter keeps only the records that satisfy a rule. Here two rules must both hold, an AND condition: the marks rule and the income rule.
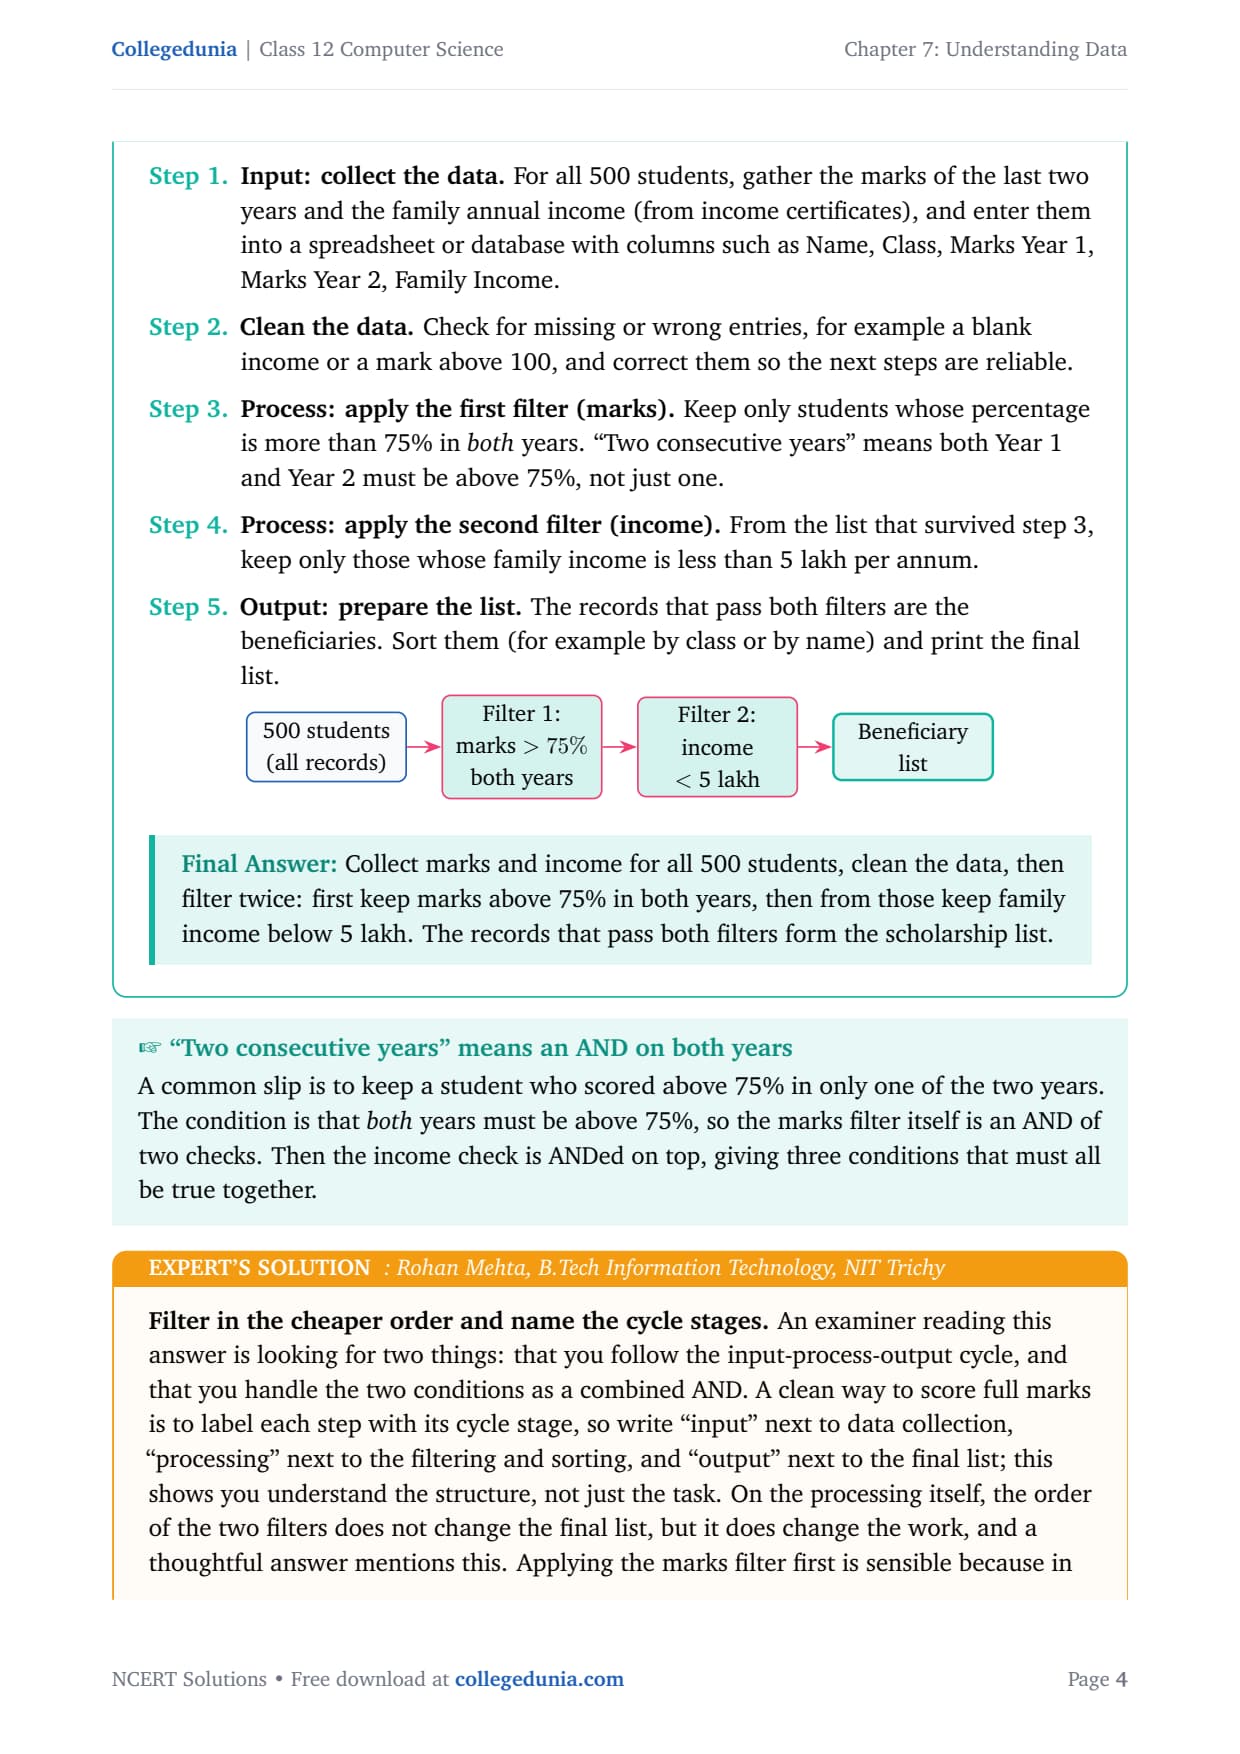
Input. For all 500 students, gather the marks of the last two years and the family annual income, and enter them in a table with columns such as Name, Class, Marks Year 1, Marks Year 2, Family Income.
Clean the data. Check for missing or wrong entries, for example a blank income or a mark above 100, and correct them.
Process, filter 1 (marks). Keep only students whose percentage is above 75% in both years.
Process, filter 2 (income). From the survivors, keep only those whose family income is less than 5 lakh per annum.
Output. The records passing both filters are the beneficiaries. Sort them by class or name and print the final list.
Answer: Collect marks and income for all 500 students, clean the data, then filter twice (marks above 75% in both years, then family income below 5 lakh). The records passing both filters form the scholarship list.
RM
Rohan Mehta
B.Tech Information Technology, NIT Trichy
Verified Expert
Label each step with its cycle stage and handle the conditions as one combined AND. The examiner wants to see the input, process and output structure and the correct logic.
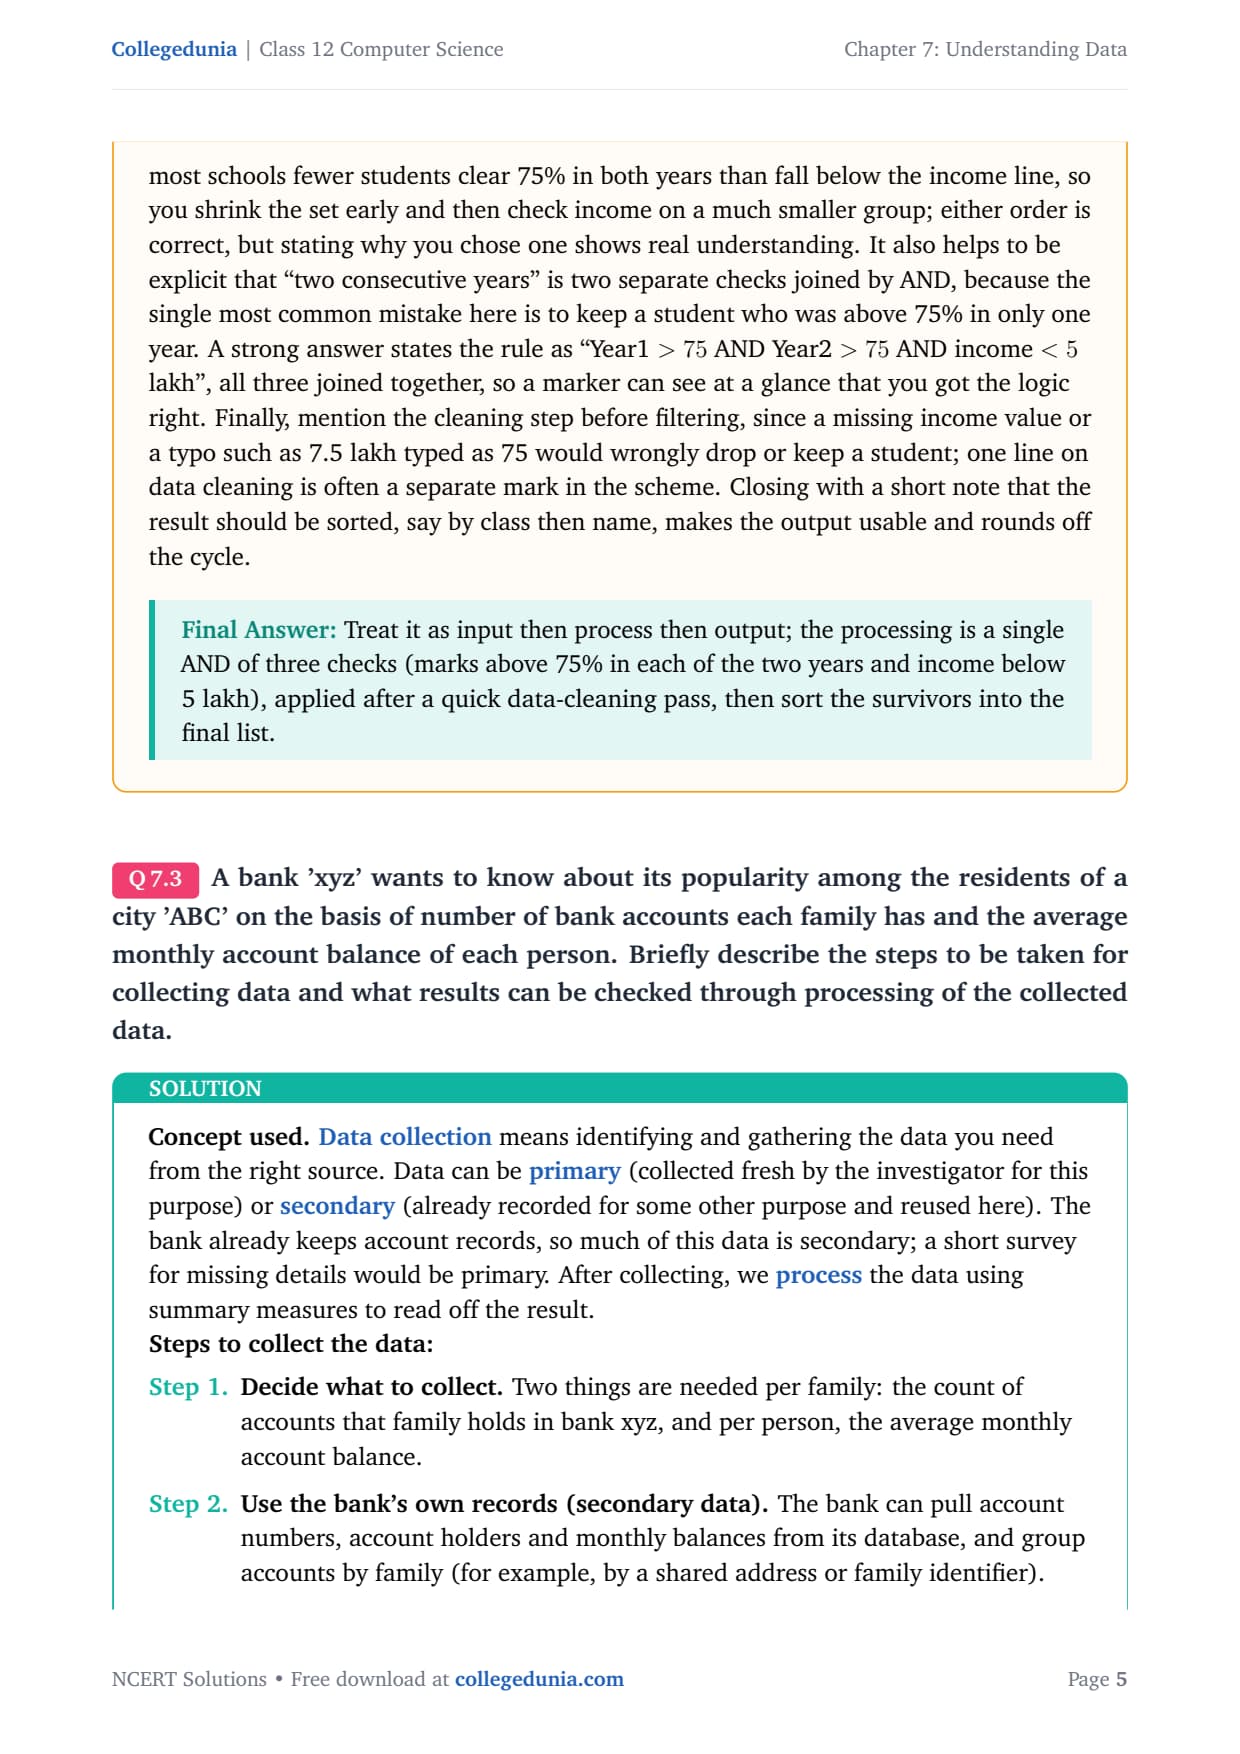
The order of the two filters does not change the result, but applying the marks filter first usually shrinks the set early, so you check income on a smaller group. Either order is correct; stating why you chose one shows understanding.
"Two consecutive years" is two checks joined by AND, so write the rule as Year1 above 75 AND Year2 above 75 AND income below 5 lakh, all joined together.
Mention the cleaning step, because a missing income or a typo such as 7.5 lakh typed as 75 would wrongly drop or keep a student; one line on cleaning is often a separate mark.
Close by noting the output should be sorted, say by class then name, to make it usable, which rounds off the cycle.
Answer: Treat it as input then process then output; the processing is a single AND of three checks applied after a quick cleaning pass, then sort the survivors into the final list.
Q 3
A bank 'xyz' wants to know about its popularity among the residents of a city 'ABC' on the basis of number of bank accounts each family has and the average monthly account balance of each person. Briefly describe the steps to be taken for collecting data and what results can be checked through processing of the collected data.
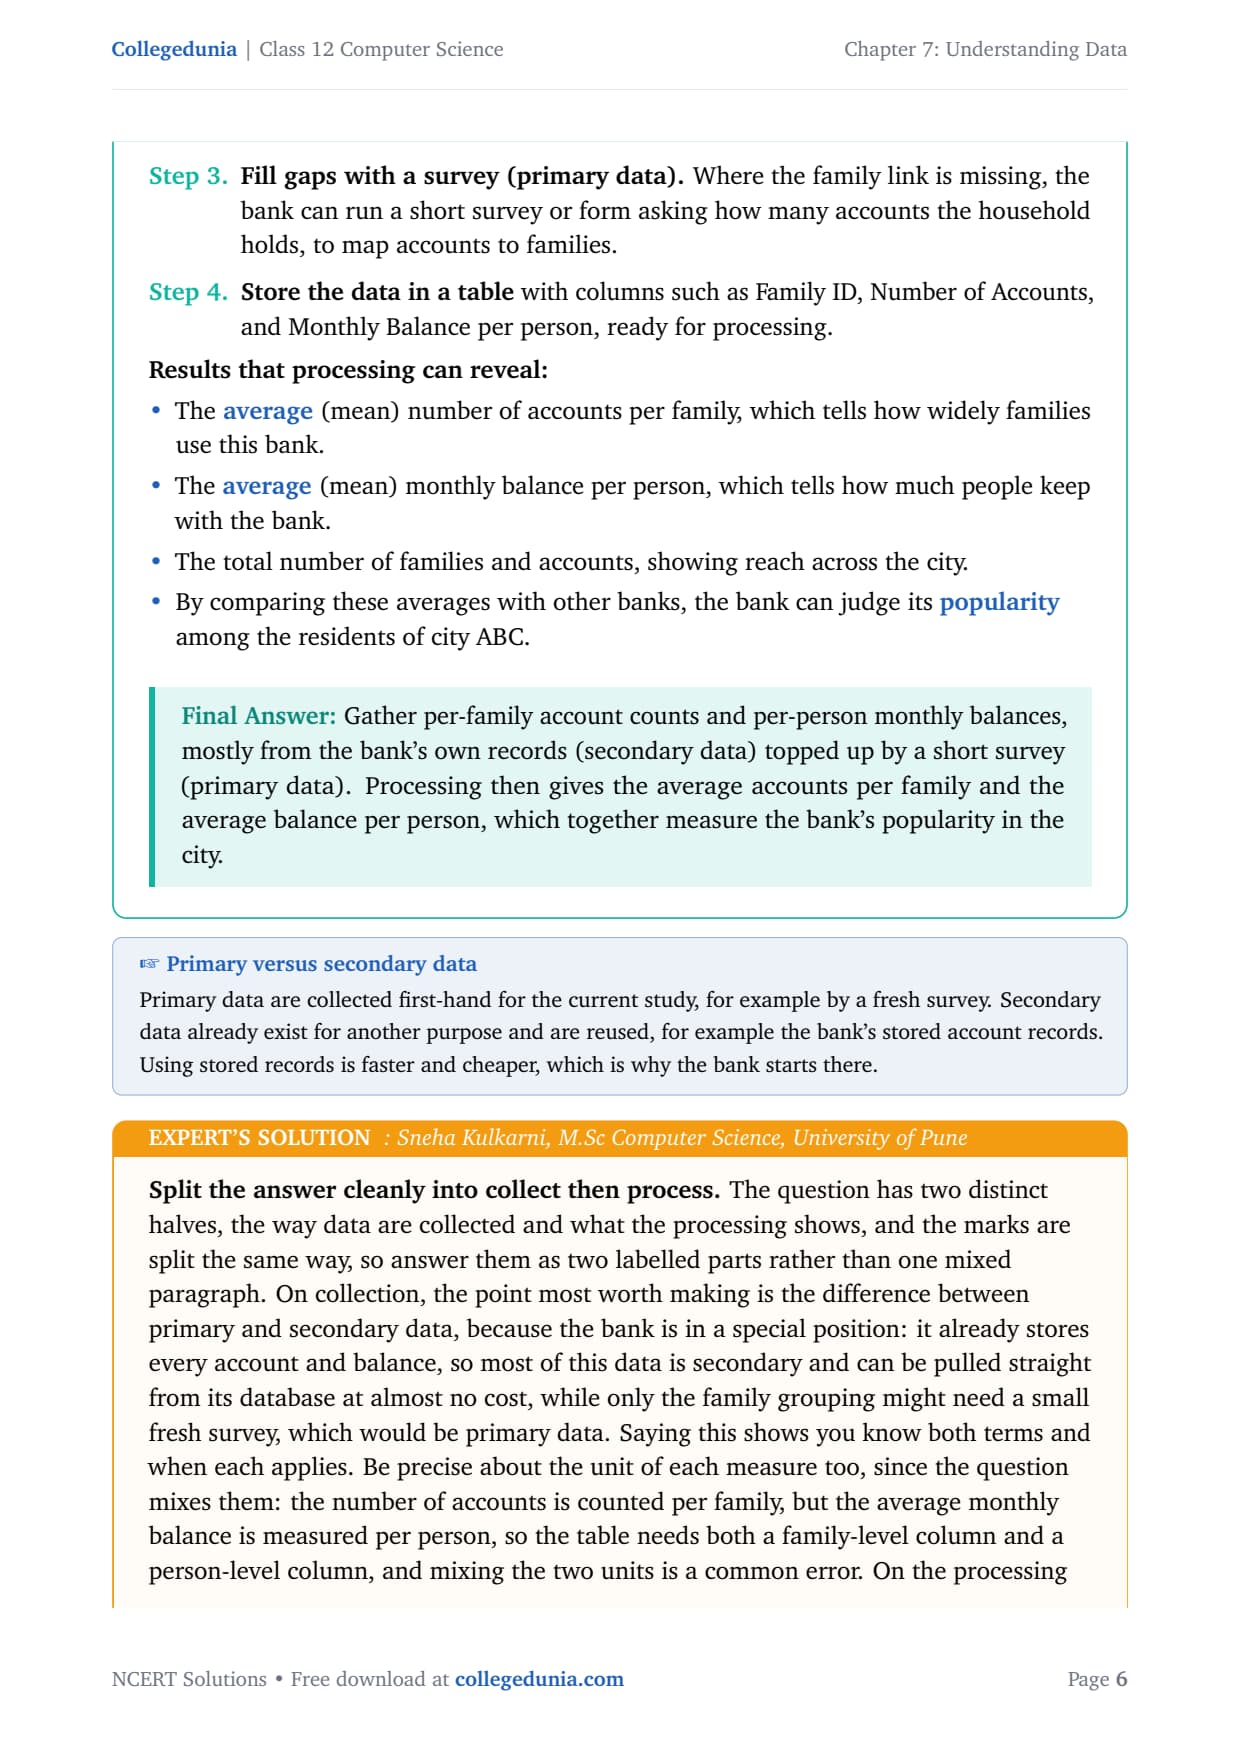
Data collection means gathering the data you need from the right source. Data can be primary (collected fresh for this purpose) or secondary (already recorded for another purpose and reused). The bank already keeps account records, so much of this data is secondary; a short survey for missing details would be primary.
Steps to collect the data:
Decide what to collect. Per family, the count of accounts in bank xyz, and per person, the average monthly balance.
Use the bank's own records (secondary data). Pull account numbers, holders and monthly balances from the database, and group accounts by family using a shared address or family identifier.
Fill gaps with a survey (primary data). Where the family link is missing, run a short form asking how many accounts the household holds.
Store the data in a table with columns such as Family ID, Number of Accounts, and Monthly Balance per person.
Results that processing can reveal:
The average (mean) number of accounts per family, showing how widely families use the bank.
The average (mean) monthly balance per person, showing how much people keep with the bank.
The total families and accounts, showing reach across the city, and a comparison with rival banks to judge popularity.
Answer: Gather per-family account counts and per-person monthly balances, mostly from the bank's own records (secondary) topped up by a short survey (primary). Processing then gives the average accounts per family and the average balance per person, which together measure popularity.
SK
Sneha Kulkarni
M.Sc Computer Science, University of Pune
Verified Expert
Split the answer cleanly into collect then process, because the question and the marks are split the same way.
On collection, make the primary-versus-secondary point: the bank already stores every account and balance, so most data is secondary and almost free to pull, while only the family grouping might need a small primary survey.
Be precise about units: accounts are counted per family but balance is averaged per person, so the table needs a family-level column and a person-level column; mixing the units is a common error.
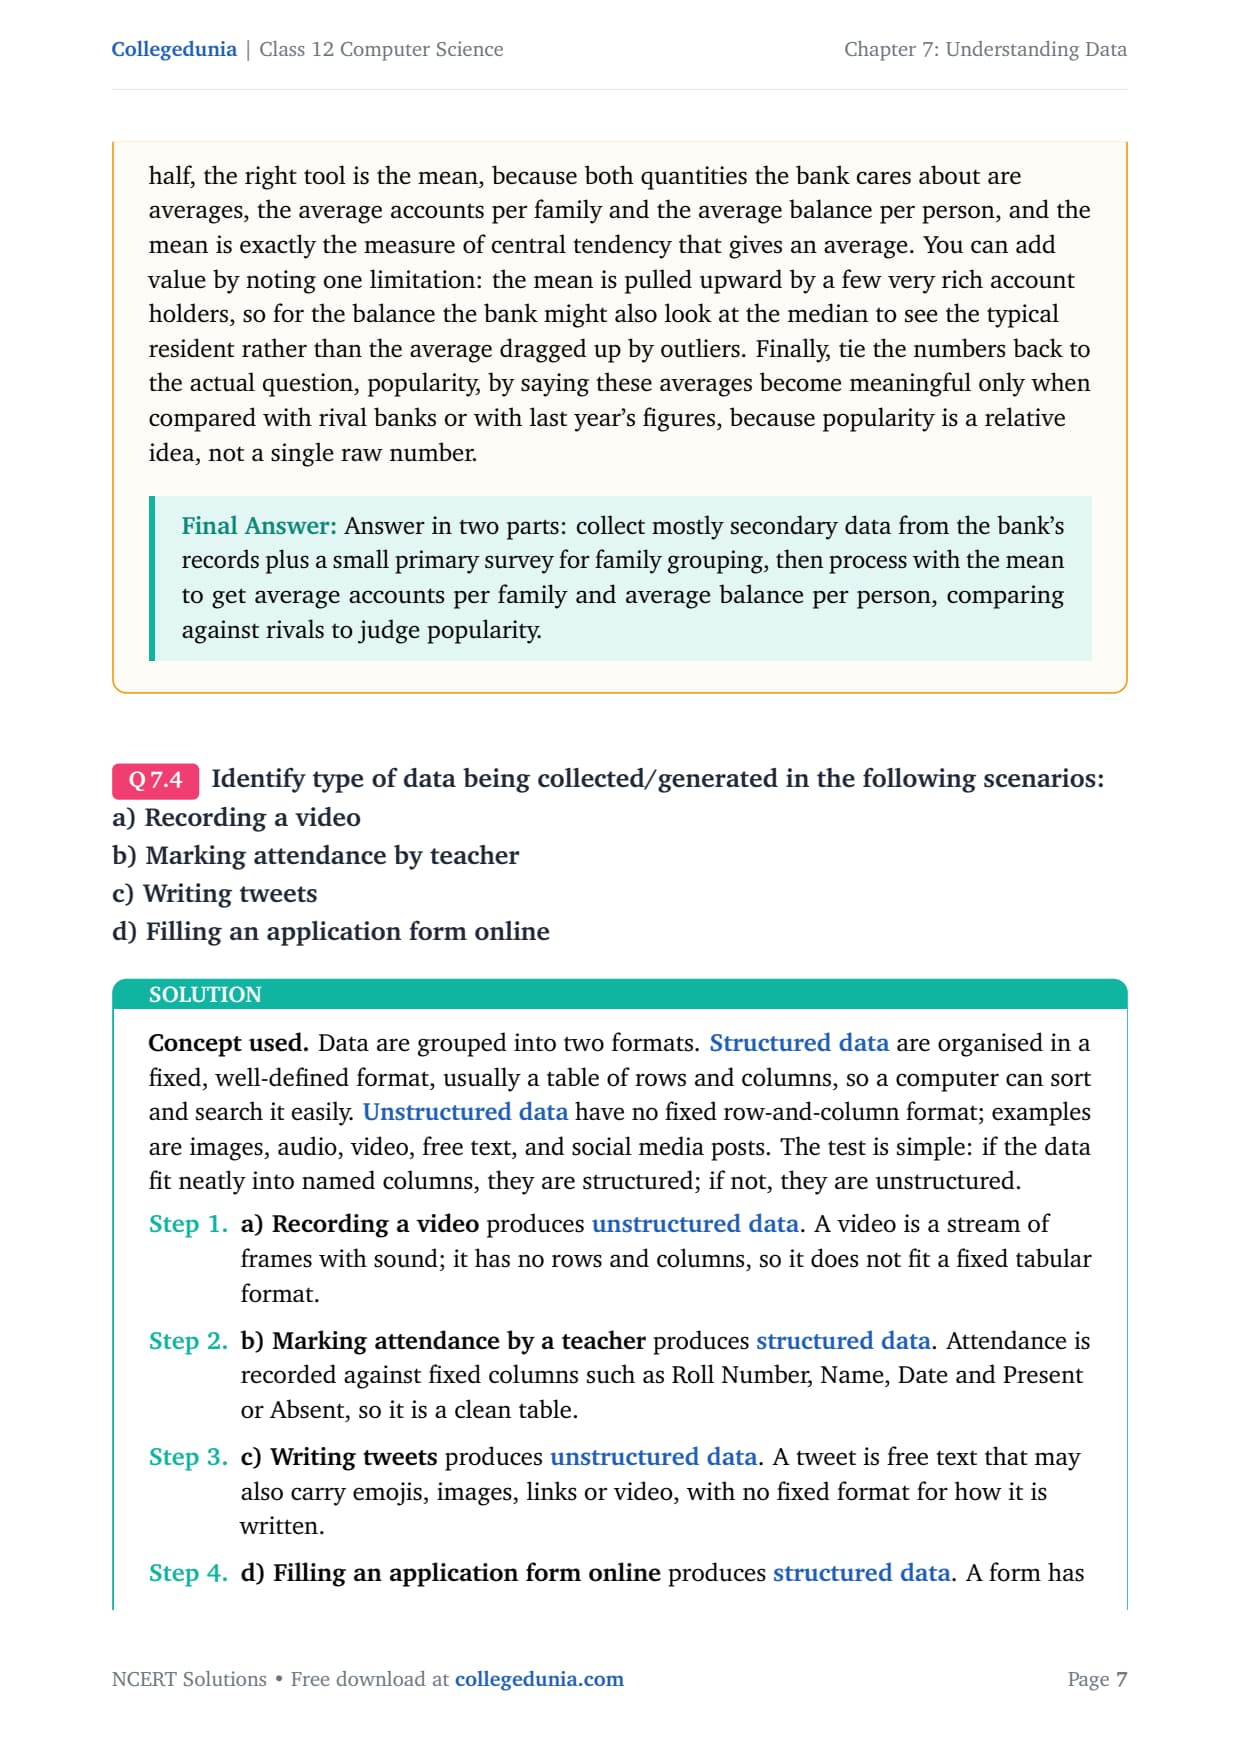
On processing, the right tool is the mean, since both quantities are averages. You can add that the mean is pulled up by a few rich holders, so the median is worth a look for the typical resident.
Tie the numbers back to popularity by noting these averages are meaningful only when compared with rival banks or last year's figures, because popularity is a relative idea.
Answer: Collect mostly secondary data plus a small primary survey, then use the mean for average accounts per family and average balance per person, comparing against rivals to judge popularity.
Q 4
Identify type of data being collected/generated in the following scenarios: a) Recording a video b) Marking attendance by teacher c) Writing tweets d) Filling an application form online
Data are grouped into two formats. Structured data are organised in a fixed table of rows and columns, so a computer can sort and search them easily. Unstructured data have no fixed format; examples are images, audio, video, free text and social posts. The test: if the data fit neatly into named columns, they are structured; if not, unstructured.
a) Recording a video: unstructured. A video is a stream of frames with sound; it has no rows and columns.
b) Marking attendance: structured. Attendance fits fixed columns such as Roll Number, Name, Date and Present or Absent, so it is a clean table.
c) Writing tweets: unstructured. A tweet is free text that may carry emojis, images, links or video, with no fixed format.
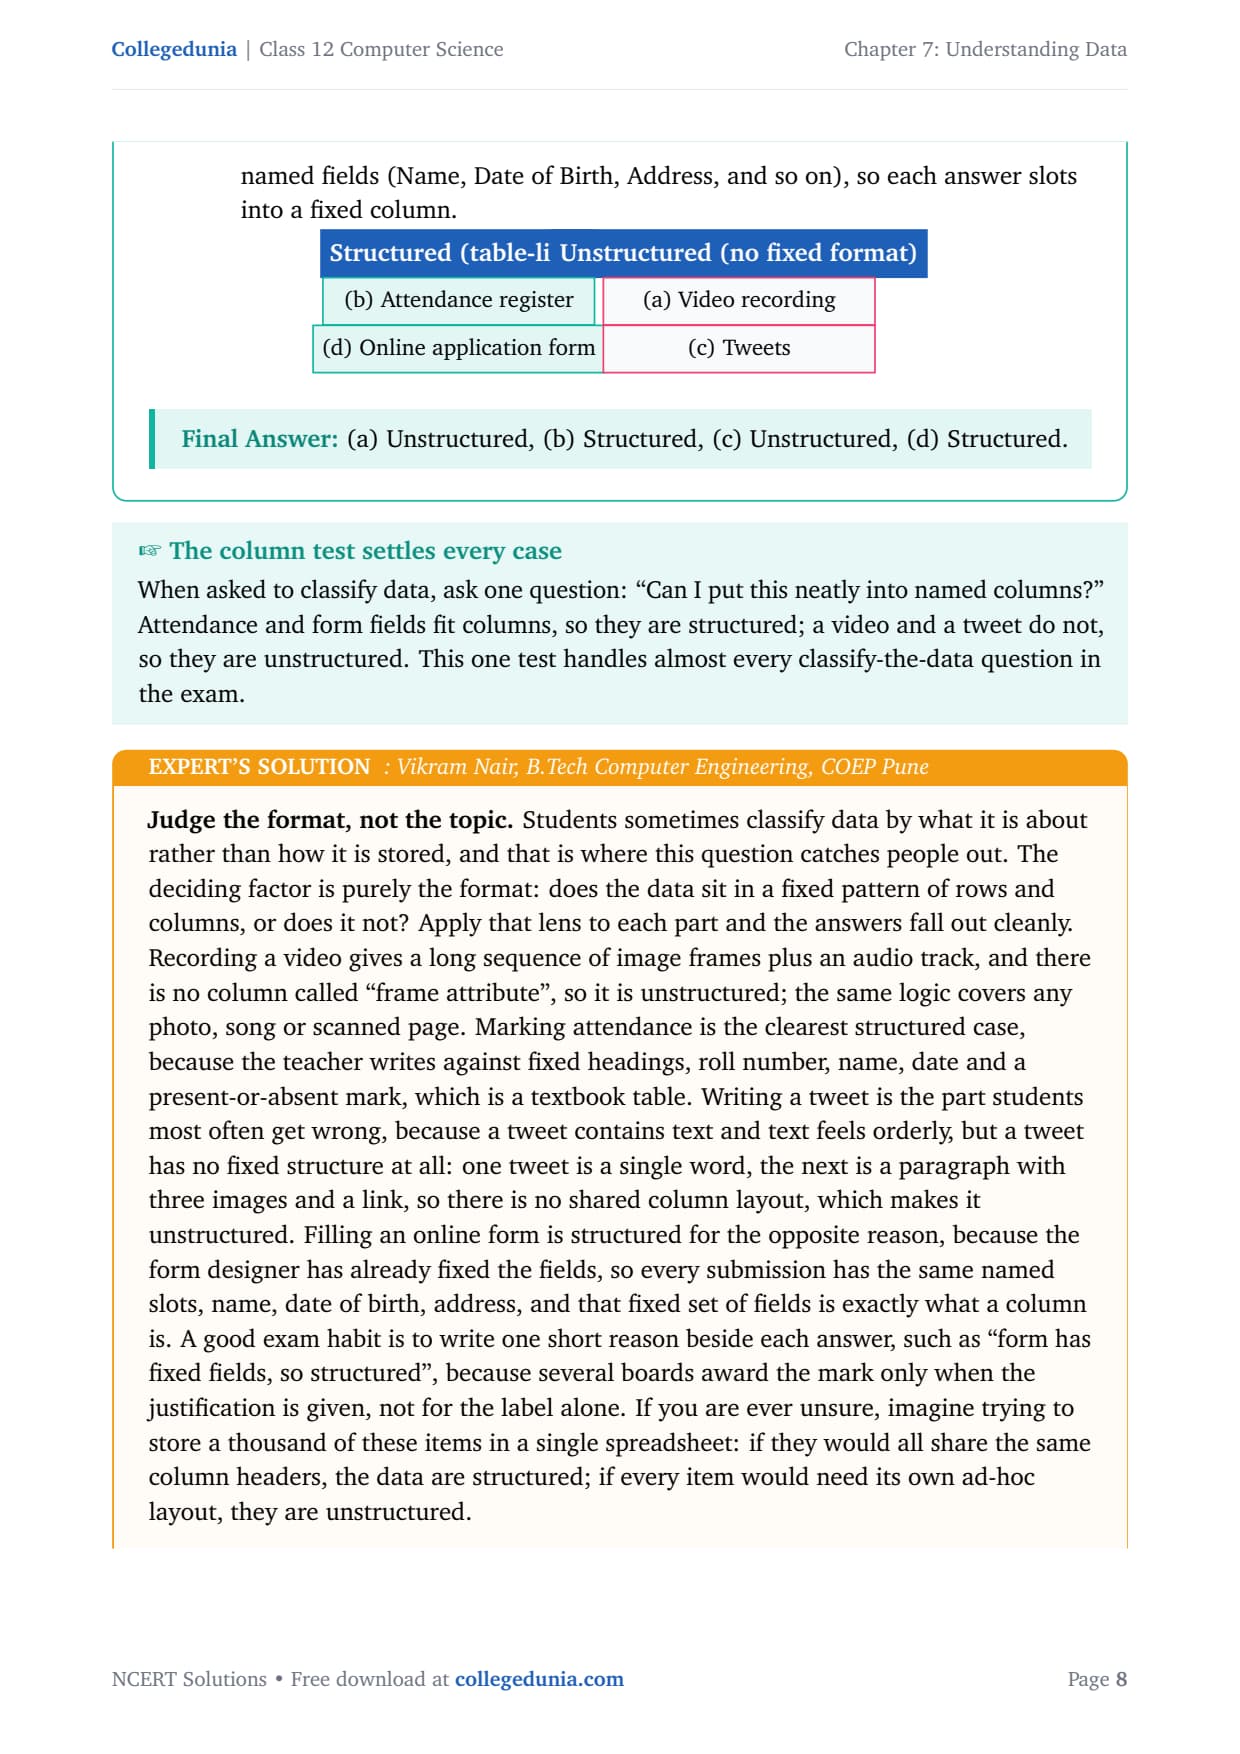
d) Filling an application form online: structured. A form has named fields (Name, Date of Birth, Address), so each answer slots into a fixed column.
Judge the format, not the topic. The deciding factor is purely whether the data sit in a fixed pattern of rows and columns.
A video gives a long sequence of frames plus audio, with no column called "frame attribute", so it is unstructured; the same logic covers any photo, song or scanned page.
A tweet is the part students most often get wrong: text feels orderly, but one tweet is a word and the next is a paragraph with images and a link, so there is no shared column layout.
An online form is structured because the designer has already fixed the fields, so every submission has the same named slots, and that fixed set of fields is exactly what a column is.
If unsure, imagine storing a thousand of these items in one spreadsheet: if they would share the same column headers, the data are structured; if each needs its own layout, unstructured. Write a short reason beside each answer, since some boards award the mark only with the justification.
Answer: Video and tweets have no fixed columns, so they are unstructured; attendance and the online form have fixed fields, so they are structured.
Q 5
Consider the temperature (in Celsius) of 7 days of a week as 34, 34, 27, 28, 27, 34, 34. Identify the appropriate statistical technique to be used to calculate the following: a) Find the average temperature. b) Find the temperature Range of that week. c) Find the standard deviation temperature.
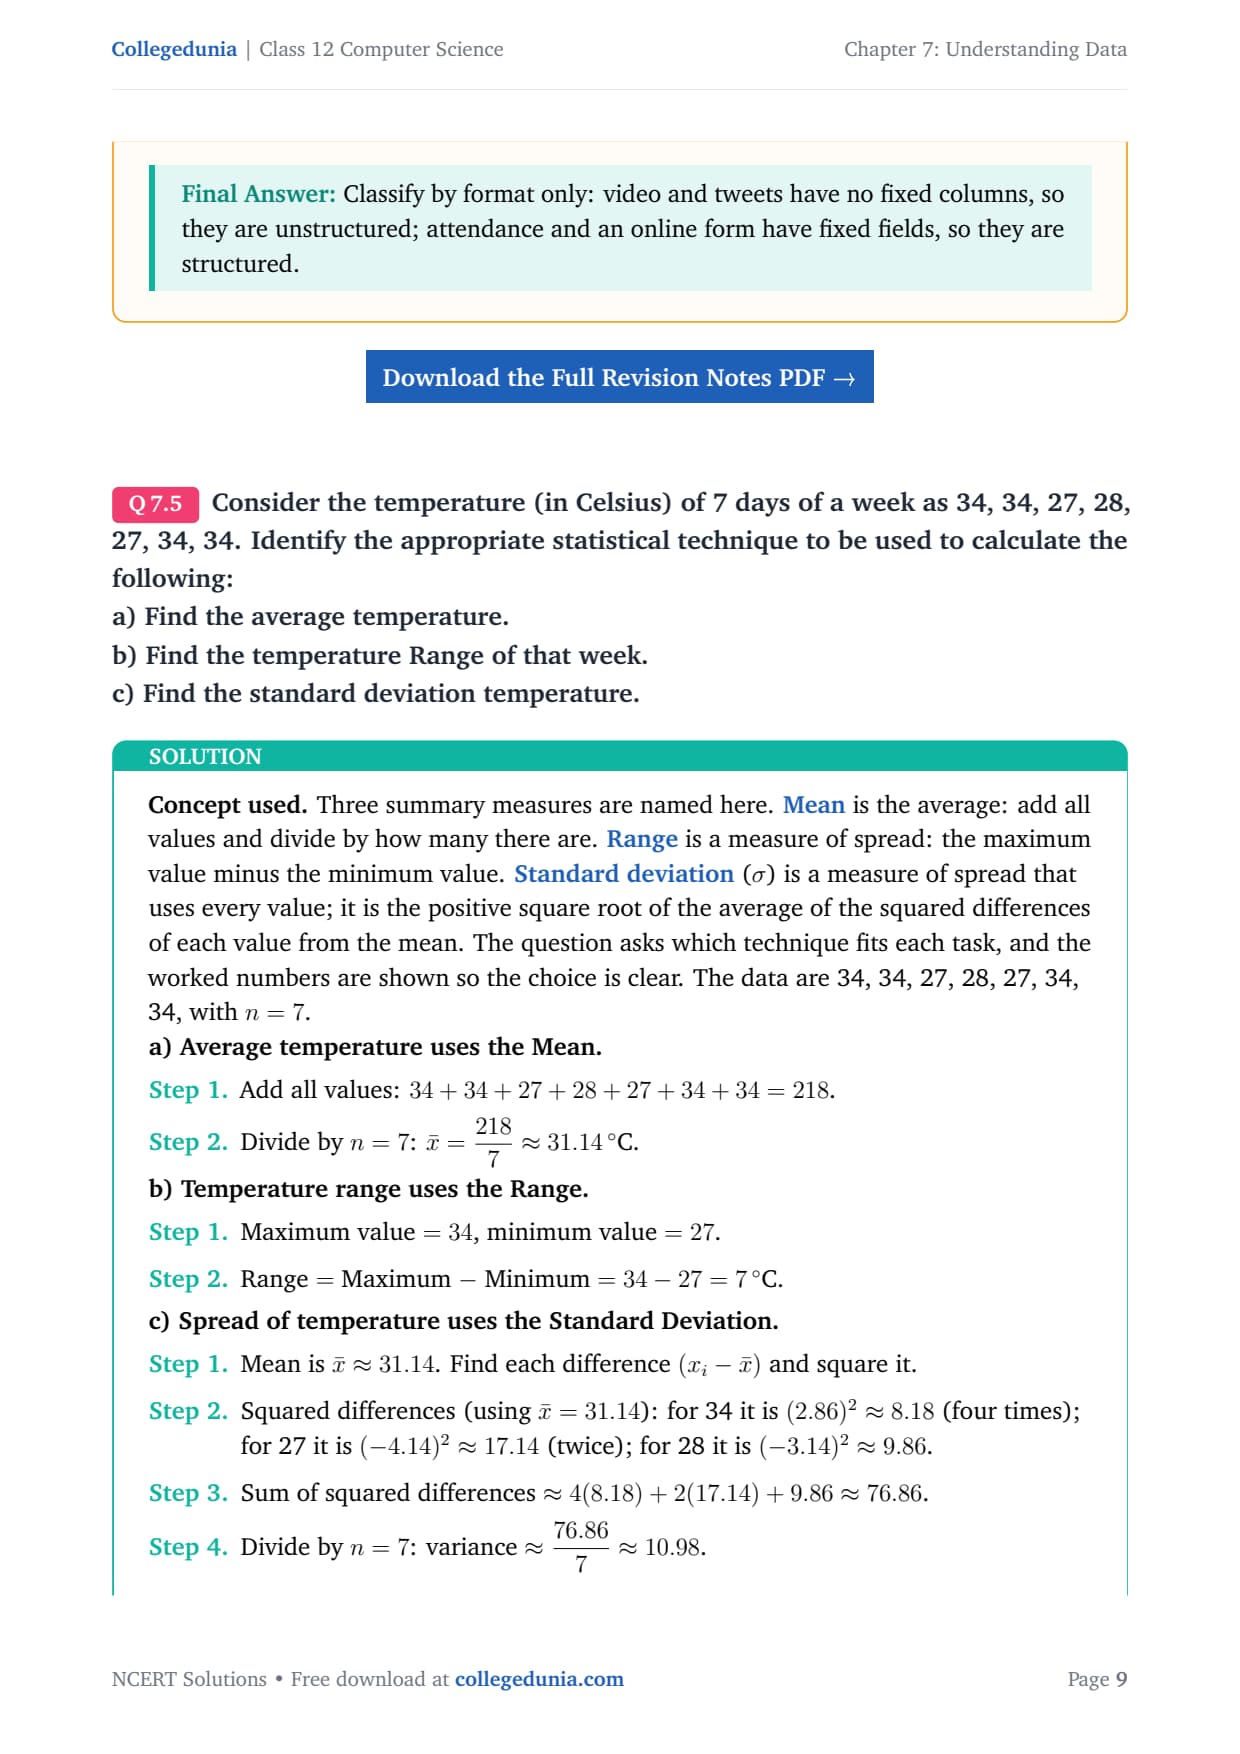
Three summary measures are named here. The mean is the average. The range is the maximum minus the minimum. The standard deviation uses every value: it is the square root of the average of the squared differences from the mean. The data are 34, 34, 27, 28, 27, 34, 34, with n = 7.
Divide by n = 7: mean = 218 / 7 = about 31.14 degrees Celsius.
b) Temperature range uses the Range.
Maximum value = 34, minimum value = 27.
Range = maximum minus minimum = 34 minus 27 = 7 degrees Celsius.
c) Spread of temperature uses the Standard Deviation.
Squared differences from the mean 31.14: for each 34 it is about 8.18 (four times), for each 27 it is about 17.14 (twice), for 28 it is about 9.86.
Sum of squared differences = about 4(8.18) + 2(17.14) + 9.86 = about 76.86.
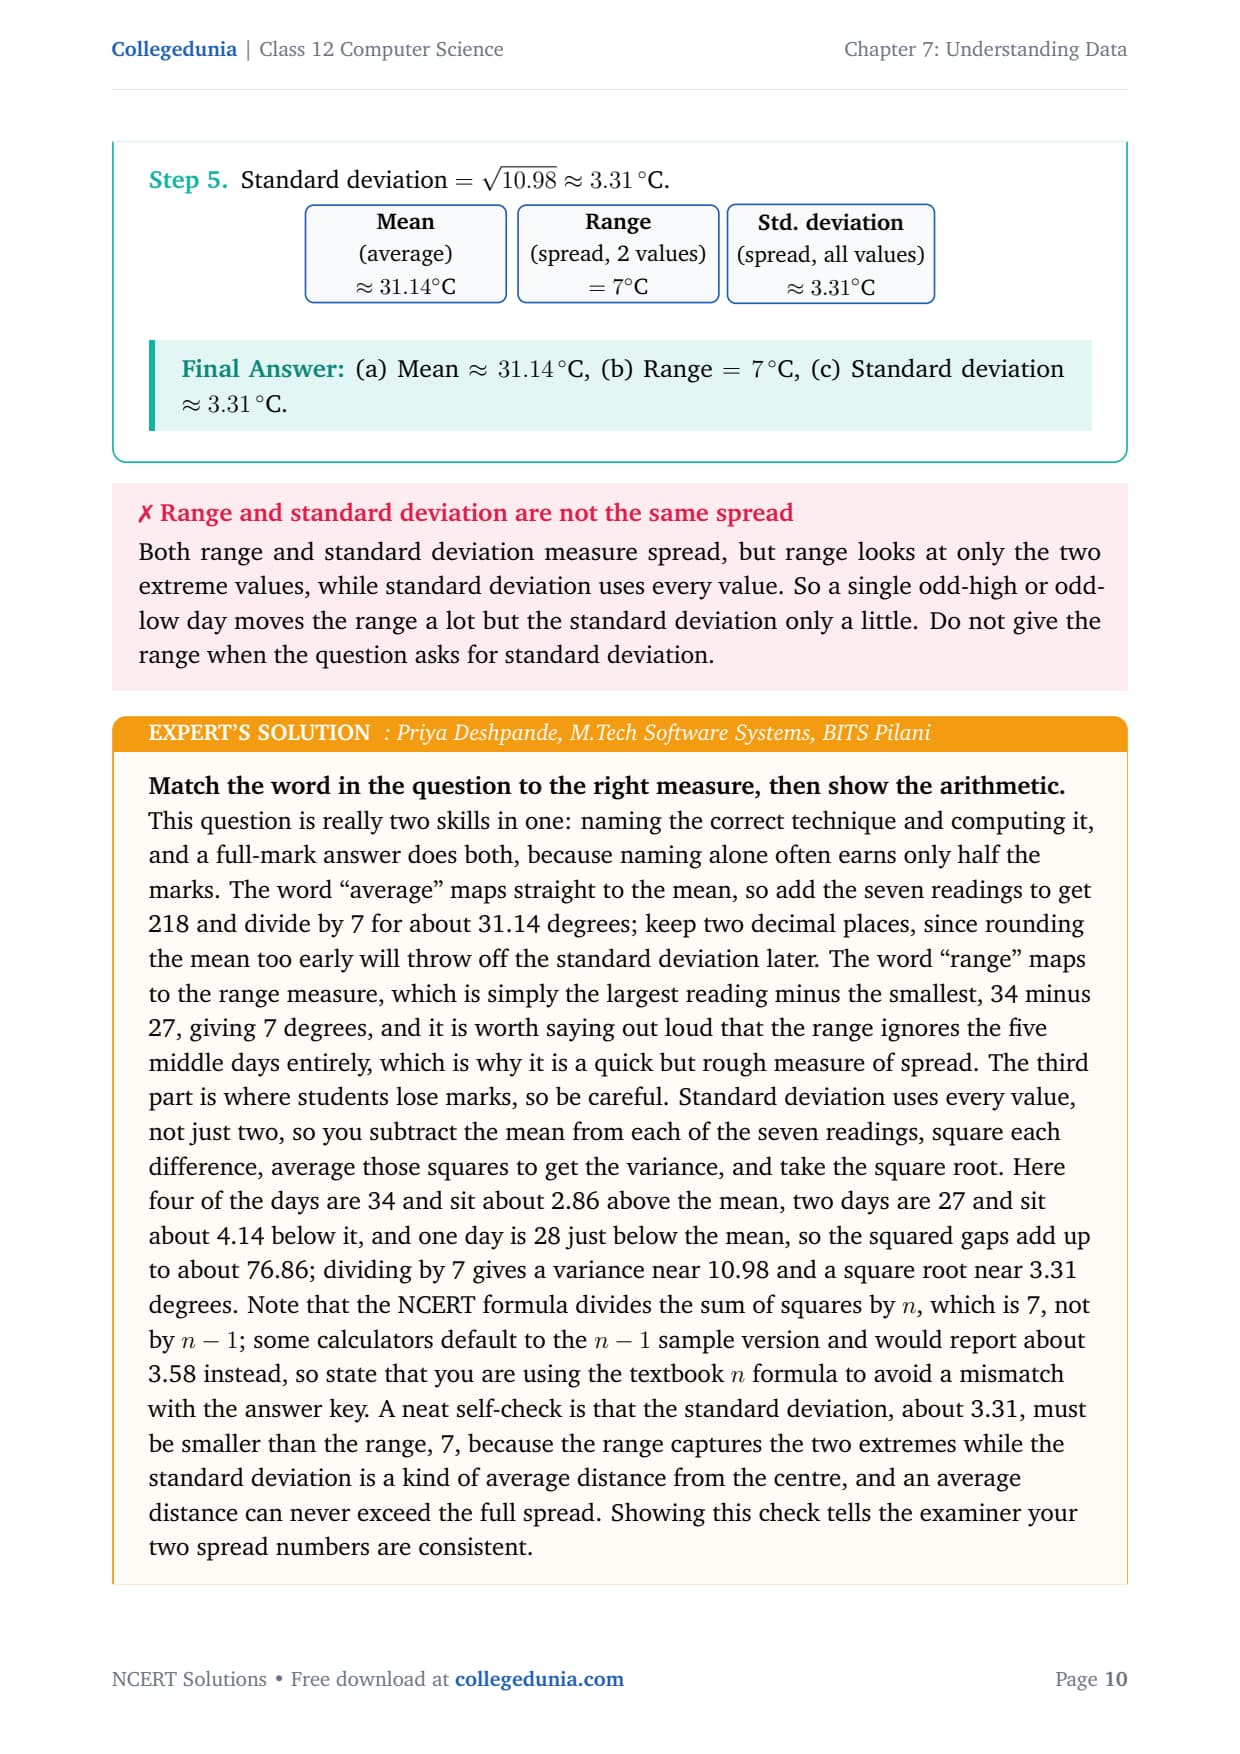
Variance = 76.86 / 7 = about 10.98; standard deviation = square root of 10.98 = about 3.31 degrees Celsius.
Answer: (a) Mean is about 31.14 degrees Celsius, (b) Range = 7 degrees Celsius, (c) Standard deviation is about 3.31 degrees Celsius.
PD
Priya Deshpande
M.Tech Software Systems, BITS Pilani
Verified Expert
Match the word in the question to the right measure, then show the arithmetic, because naming alone often earns only half the marks.
"Average" maps to the mean: add the seven readings to 218 and divide by 7 for about 31.14; keep two decimals, since rounding early throws off the standard deviation later.
"Range" maps to maximum minus minimum, 34 minus 27 = 7; say out loud that the range ignores the five middle days, which is why it is quick but rough.
For standard deviation, note the NCERT formula divides by n (which is 7), not by n minus 1; a calculator's sample mode would report about 3.58 instead, so state you are using the textbook n formula.
Self-check: the standard deviation (about 3.31) must be smaller than the range (7), because the range captures the two extremes while standard deviation is a kind of average distance from the centre.
Answer: Mean for the average (about 31.14), range for the spread between extremes (7), and standard deviation for the spread using all values (about 3.31 with the n formula).
Q 6
A school teacher wants to analyse results. Identify the appropriate statistical technique to be used along with its justification for the following cases: a) Teacher wants to compare performance in terms of division secured by students in Class XII A and Class XII B where each class strength is same. b) Teacher has conducted five unit tests for that class in months July to November and wants to compare the class performance in these five months.
The mode is the value that occurs most often; it works for categories (non-numeric data) such as divisions. The mean (average) summarises a set of numeric marks into one number, so it is the natural way to compare several groups. The right measure depends on the data type and the comparison you want.
a) Comparing divisions in two classes: use the Mode. "Division" (First, Second, Third) is a category, not a number to average. The mode gives the most common division in each class. Because both classes have the same strength, comparing the modal division of XII A with that of XII B is a fair comparison.
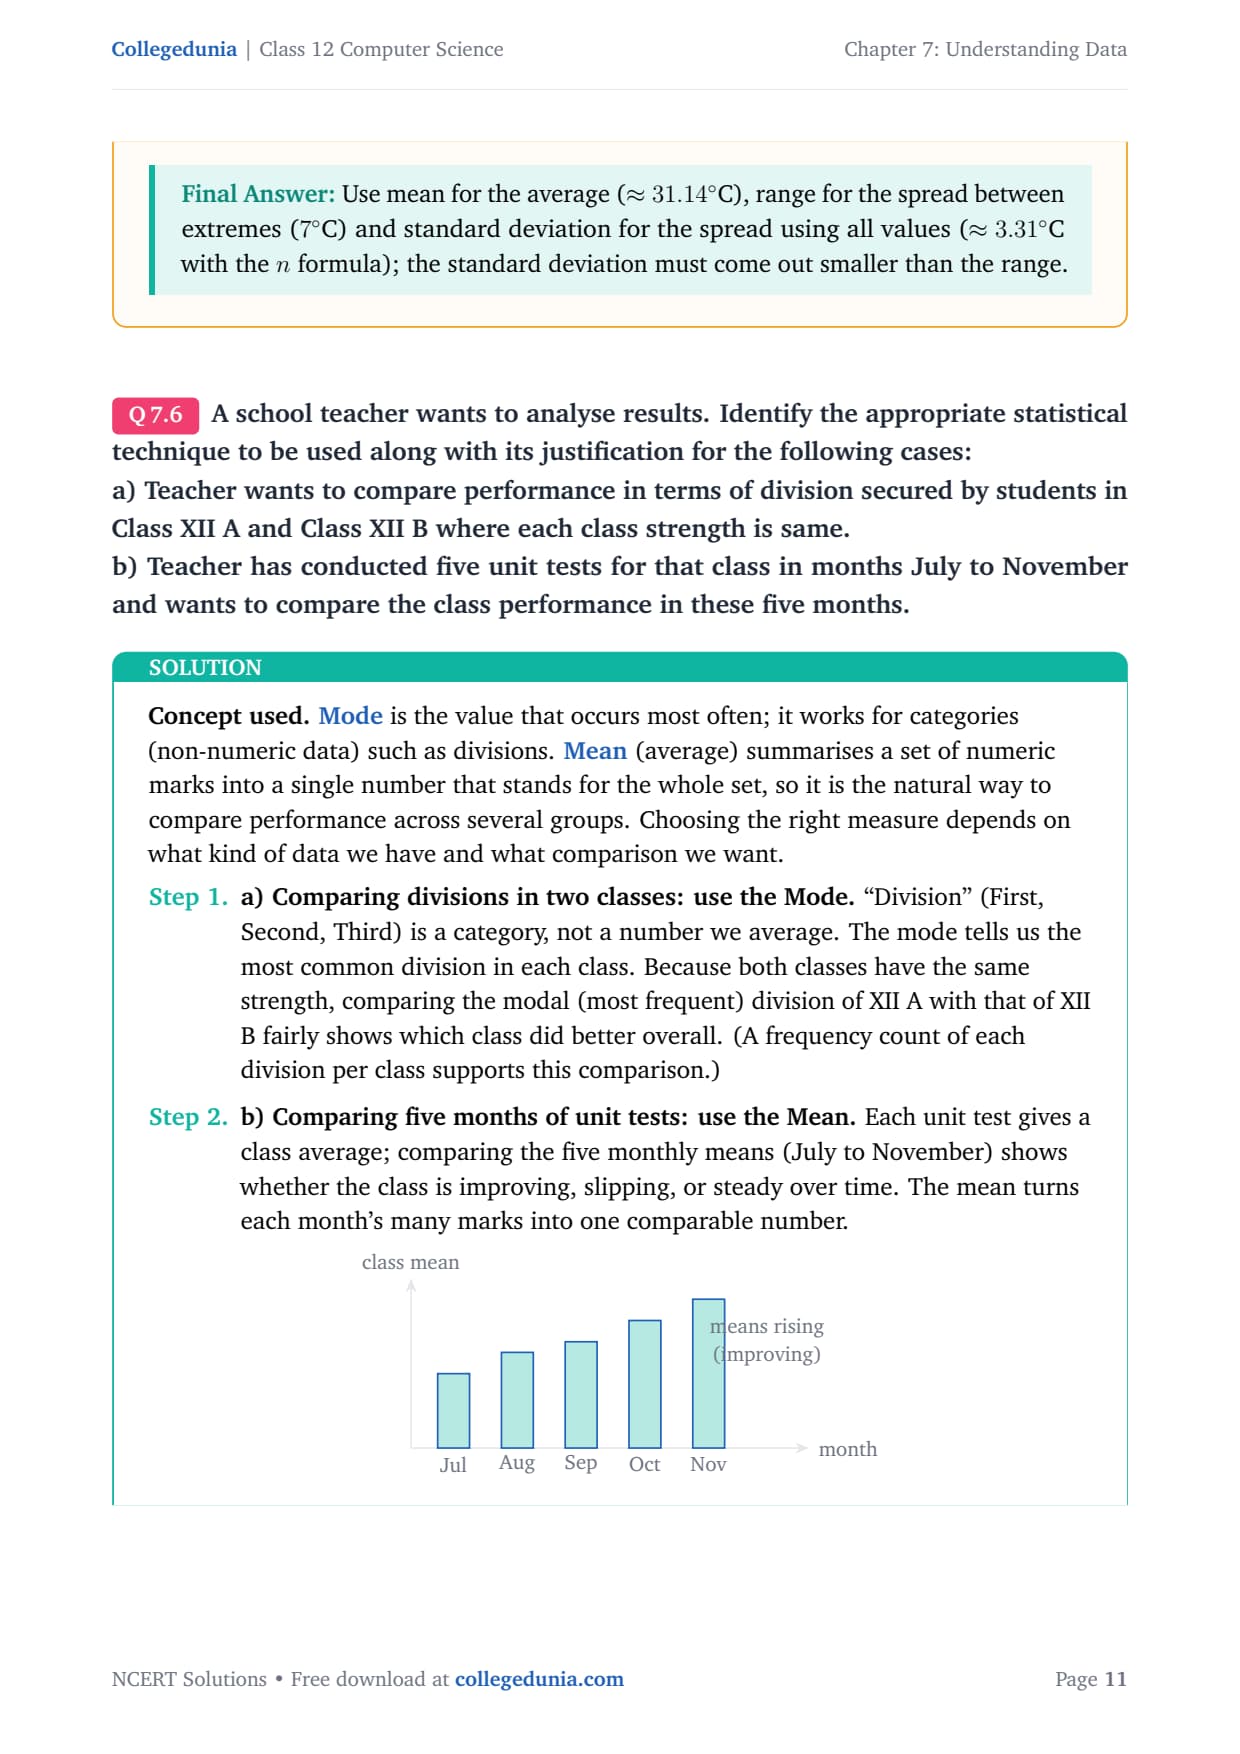
b) Comparing five months of unit tests: use the Mean. Each unit test gives a class average; comparing the five monthly means (July to November) shows whether the class is improving, slipping or steady. The mean turns each month's many marks into one comparable number.
Answer: (a) Use the Mode, because division is a category and the mode gives the most common division in each equal-strength class; (b) use the Mean, because comparing the five monthly class averages shows the trend over time.
AR
Arjun Reddy
B.Tech Computer Science, IIIT Hyderabad
Verified Expert
The question explicitly asks for justification, so naming the technique alone cannot score full marks; let the data type and the comparison decide and always say why.
In (a) the unit is "division", a label you cannot add or average, so the mean and standard deviation are out; the mode is built for categories and answers which division is most common.
Equal class strength matters and should be mentioned, because it is what makes a straight count comparison fair; with different strengths you would need proportions.
In (b) the data are numeric marks gathered five times, and you want one figure per month, so the mean is right; the mode would give only the most common mark and the range only the spread, neither a fair summary of the whole class.
Plotting the five means as a bar or line shows the trend at a glance: rising means improvement, falling means decline. Write the technique, then a because-clause tied to the data type, for every such question.
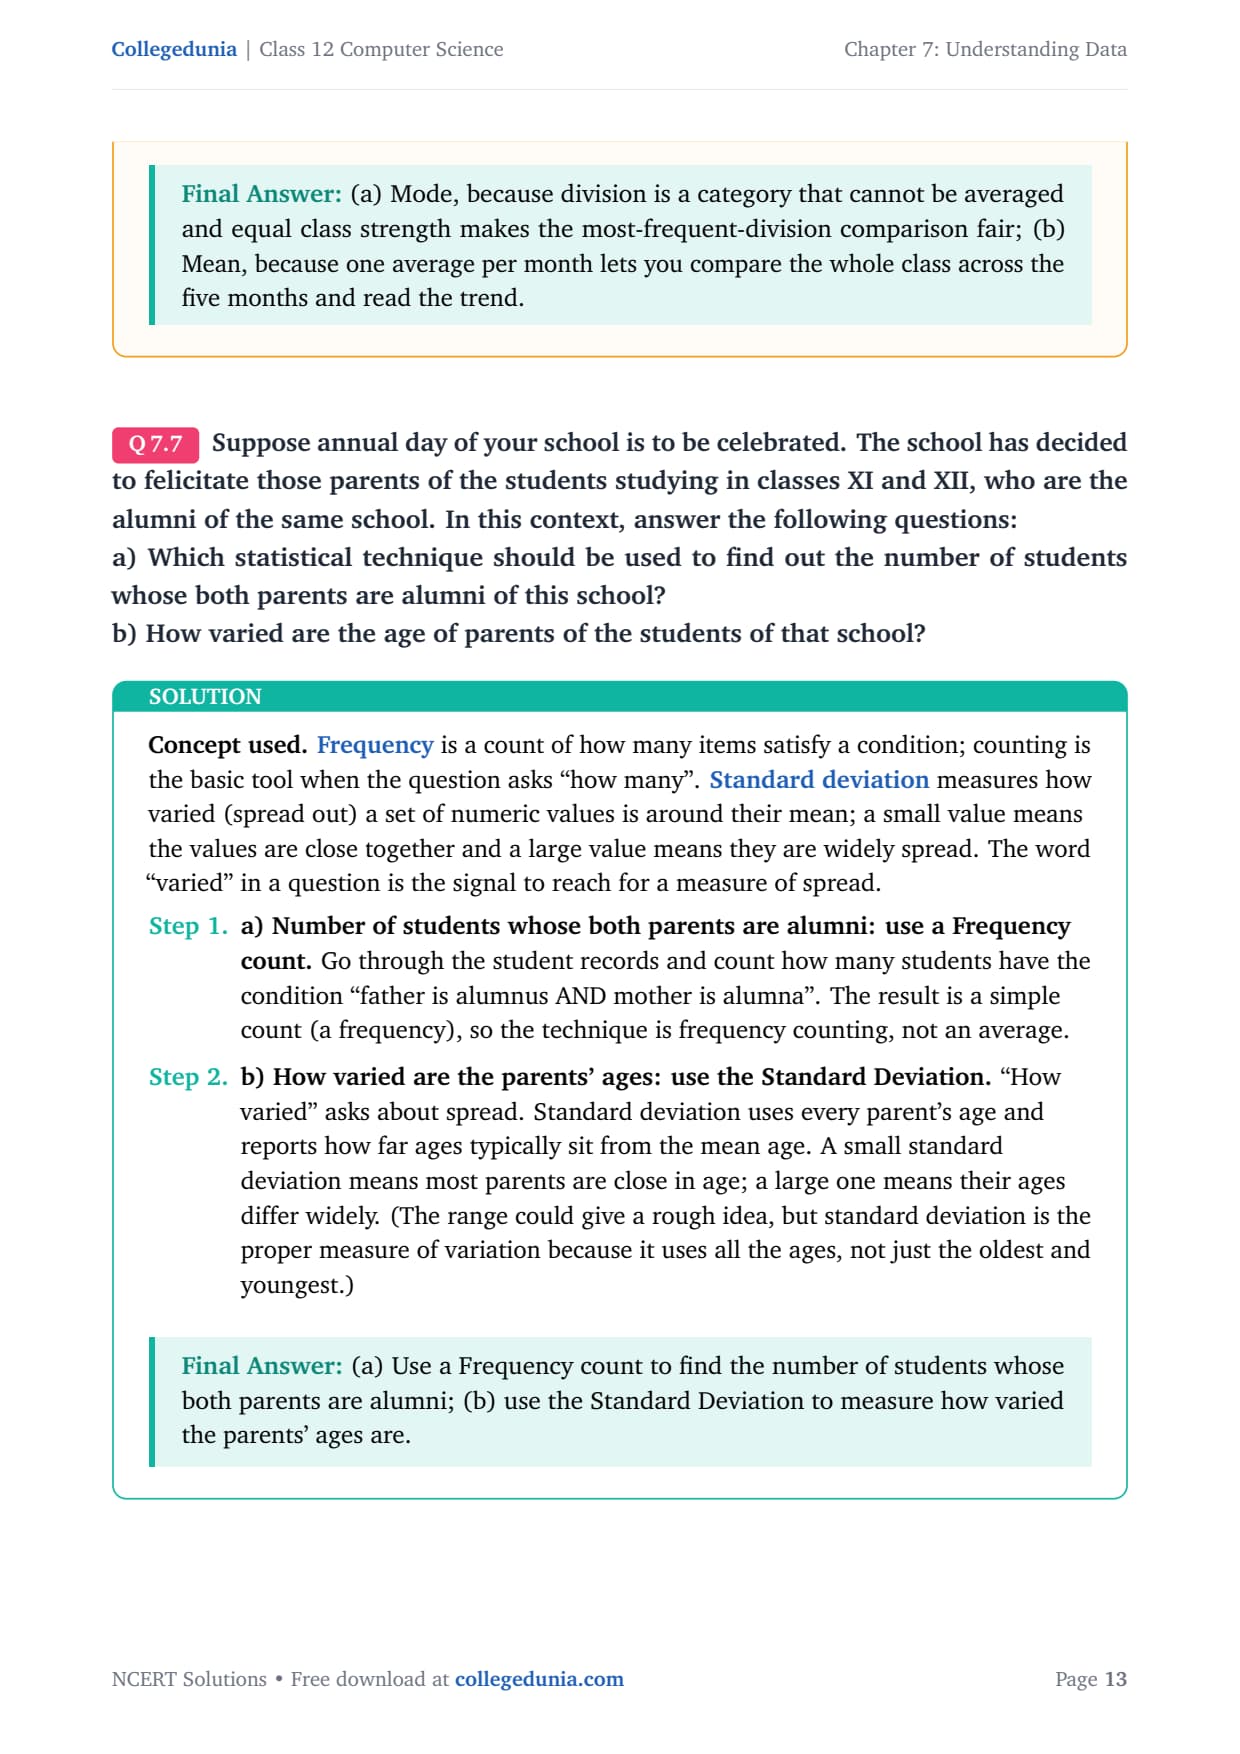
Answer: (a) Mode, because division is a category and equal strength makes the most-frequent-division comparison fair; (b) Mean, because one average per month lets you compare the whole class across the five months.
Q 7
Suppose annual day of your school is to be celebrated. The school has decided to felicitate those parents of the students studying in classes XI and XII, who are the alumni of the same school. In this context, answer the following questions: a) Which statistical technique should be used to find out the number of students whose both parents are alumni of this school? b) How varied are the age of parents of the students of that school?
Frequency is a count of how many items satisfy a condition; counting is the basic tool when the question asks "how many". Standard deviation measures how varied a set of numeric values is around their mean. The word "varied" in a question is the signal to reach for a measure of spread.
a) Number of students whose both parents are alumni: use a Frequency count. Go through the records and count how many students meet the condition "father is alumnus AND mother is alumna". The result is a simple count (a frequency), not an average.
b) How varied are the parents' ages: use the Standard Deviation. "How varied" asks about spread. Standard deviation uses every parent's age and reports how far ages typically sit from the mean age. (The range gives a rough idea, but standard deviation is the proper measure because it uses all the ages.)
Answer: (a) Use a Frequency count to find the number of students whose both parents are alumni; (b) use the Standard Deviation to measure how varied the parents' ages are.
MK
Meera Krishnan
M.Tech Data Science, IIT Madras
Verified Expert
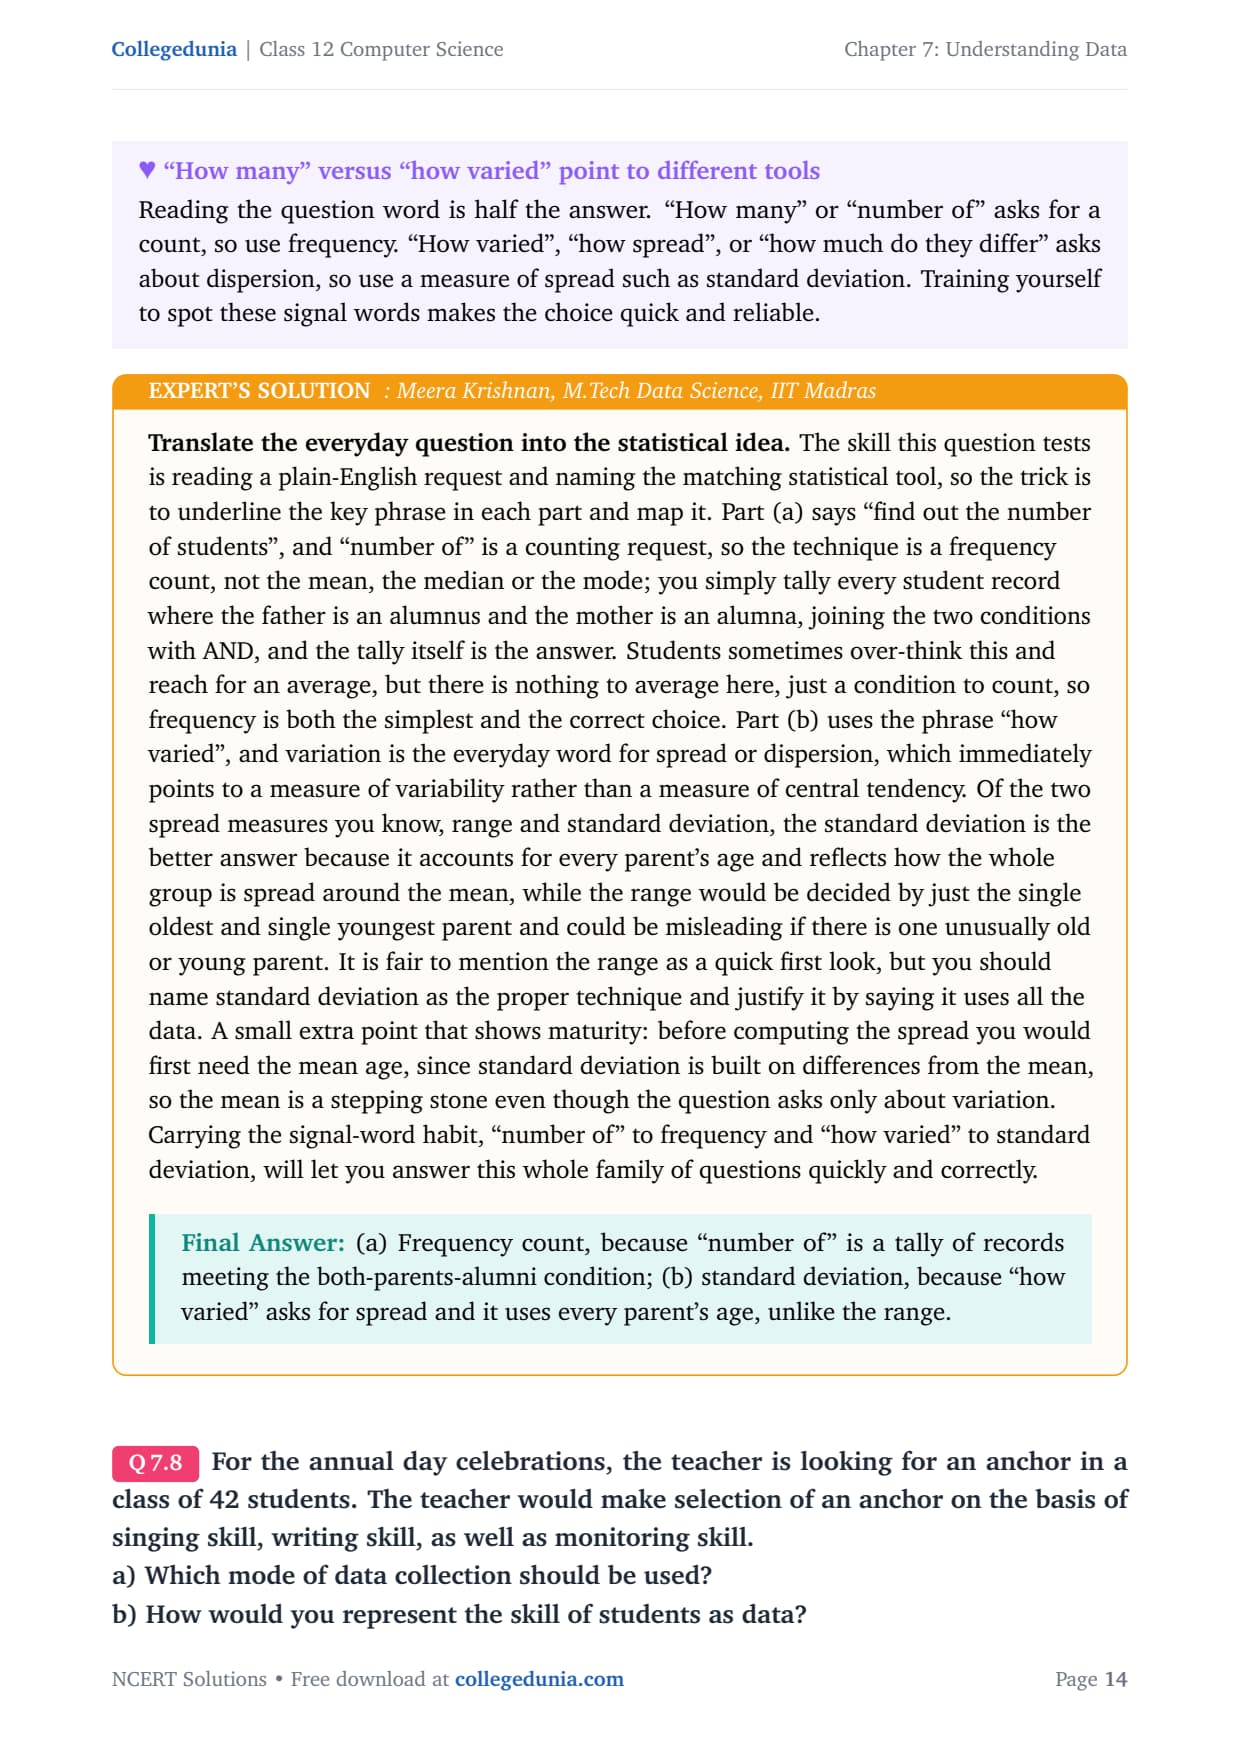
Translate the everyday question into the statistical idea: underline the key phrase in each part and map it.
Part (a) says "find out the number of students", and "number of" is a counting request, so the technique is a frequency count; tally every record where the father is an alumnus AND the mother is an alumna, and the tally is the answer.
Part (b) uses "how varied", and variation means spread, which points to a measure of variability; of range and standard deviation, the standard deviation is better because it uses every parent's age, while the range is decided by just the oldest and youngest.
You would first need the mean age, since standard deviation is built on differences from the mean, so the mean is a stepping stone even though the question asks only about variation.
Carry the signal-word habit: "number of" to frequency, "how varied" to standard deviation, and this whole family of questions becomes quick.
Answer: (a) Frequency count, because "number of" is a tally of records meeting the both-parents-alumni condition; (b) standard deviation, because "how varied" asks for spread and it uses every parent's age, unlike the range.
Q 8
For the annual day celebrations, the teacher is looking for an anchor in a class of 42 students. The teacher would make selection of an anchor on the basis of singing skill, writing skill, as well as monitoring skill. a) Which mode of data collection should be used? b) How would you represent the skill of students as data?
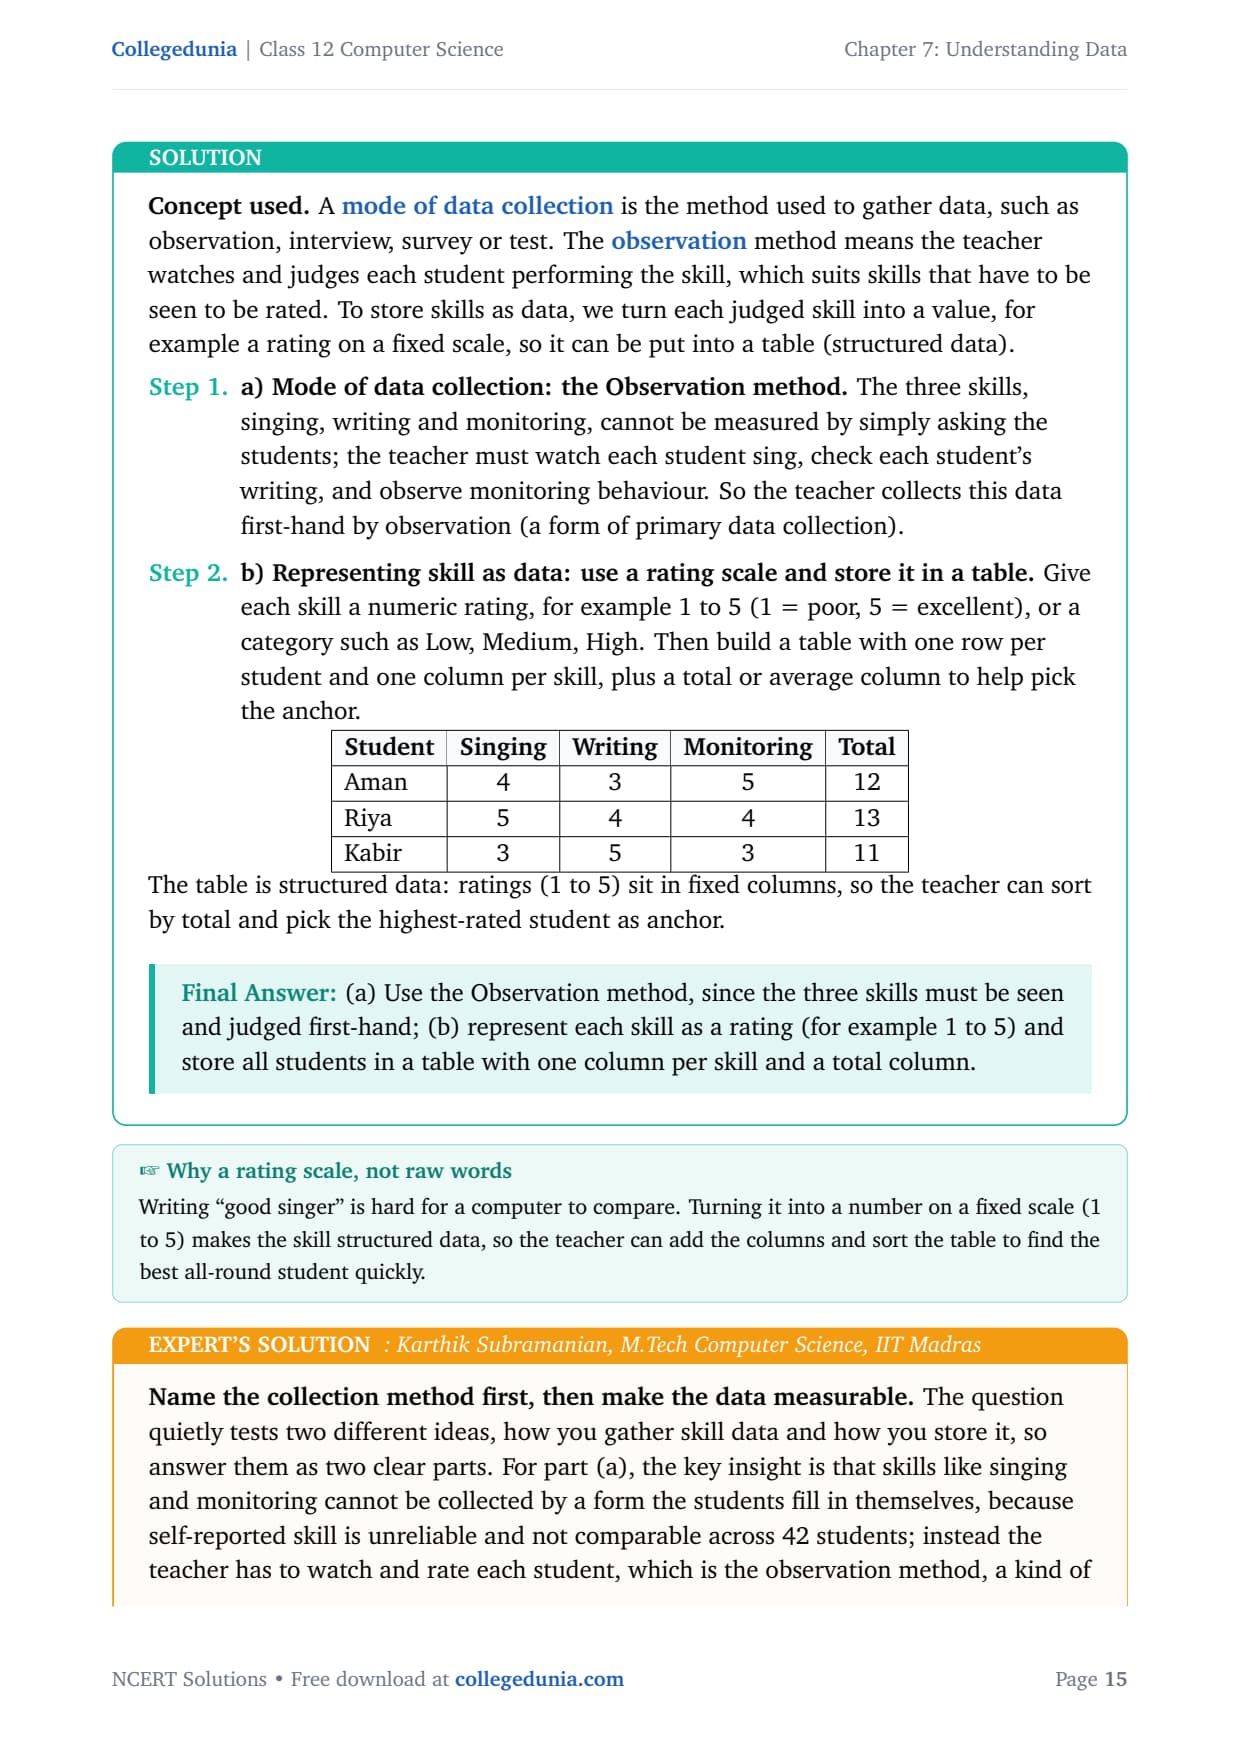
A mode of data collection is the method used to gather data, such as observation, interview, survey or test. The observation method means the teacher watches and judges each student performing the skill, which suits skills that have to be seen to be rated. To store skills as data, turn each judged skill into a value, for example a rating on a fixed scale.
a) Mode of data collection: the Observation method. The three skills, singing, writing and monitoring, cannot be measured by asking the students; the teacher must watch each student perform, so the data are collected first-hand by observation (a form of primary data collection).
b) Representing skill as data: use a rating scale in a table. Give each skill a numeric rating, for example 1 to 5, then build a table with one row per student and one column per skill, plus a total column to help pick the anchor.
Student
Singing
Writing
Monitoring
Total
Aman
4
3
5
12
Riya
5
4
4
13
Kabir
3
5
3
11
The table is structured data: ratings (1 to 5) sit in fixed columns, so the teacher can sort by total and pick the highest-rated student.
Answer: (a) Use the Observation method, since the three skills must be seen and judged first-hand; (b) represent each skill as a rating (for example 1 to 5) and store all students in a table with one column per skill and a total column.
KS
Karthik Subramanian
M.Tech Computer Science, IIT Madras
Verified Expert
Name the collection method first, then make the data measurable, because the question tests two different ideas.
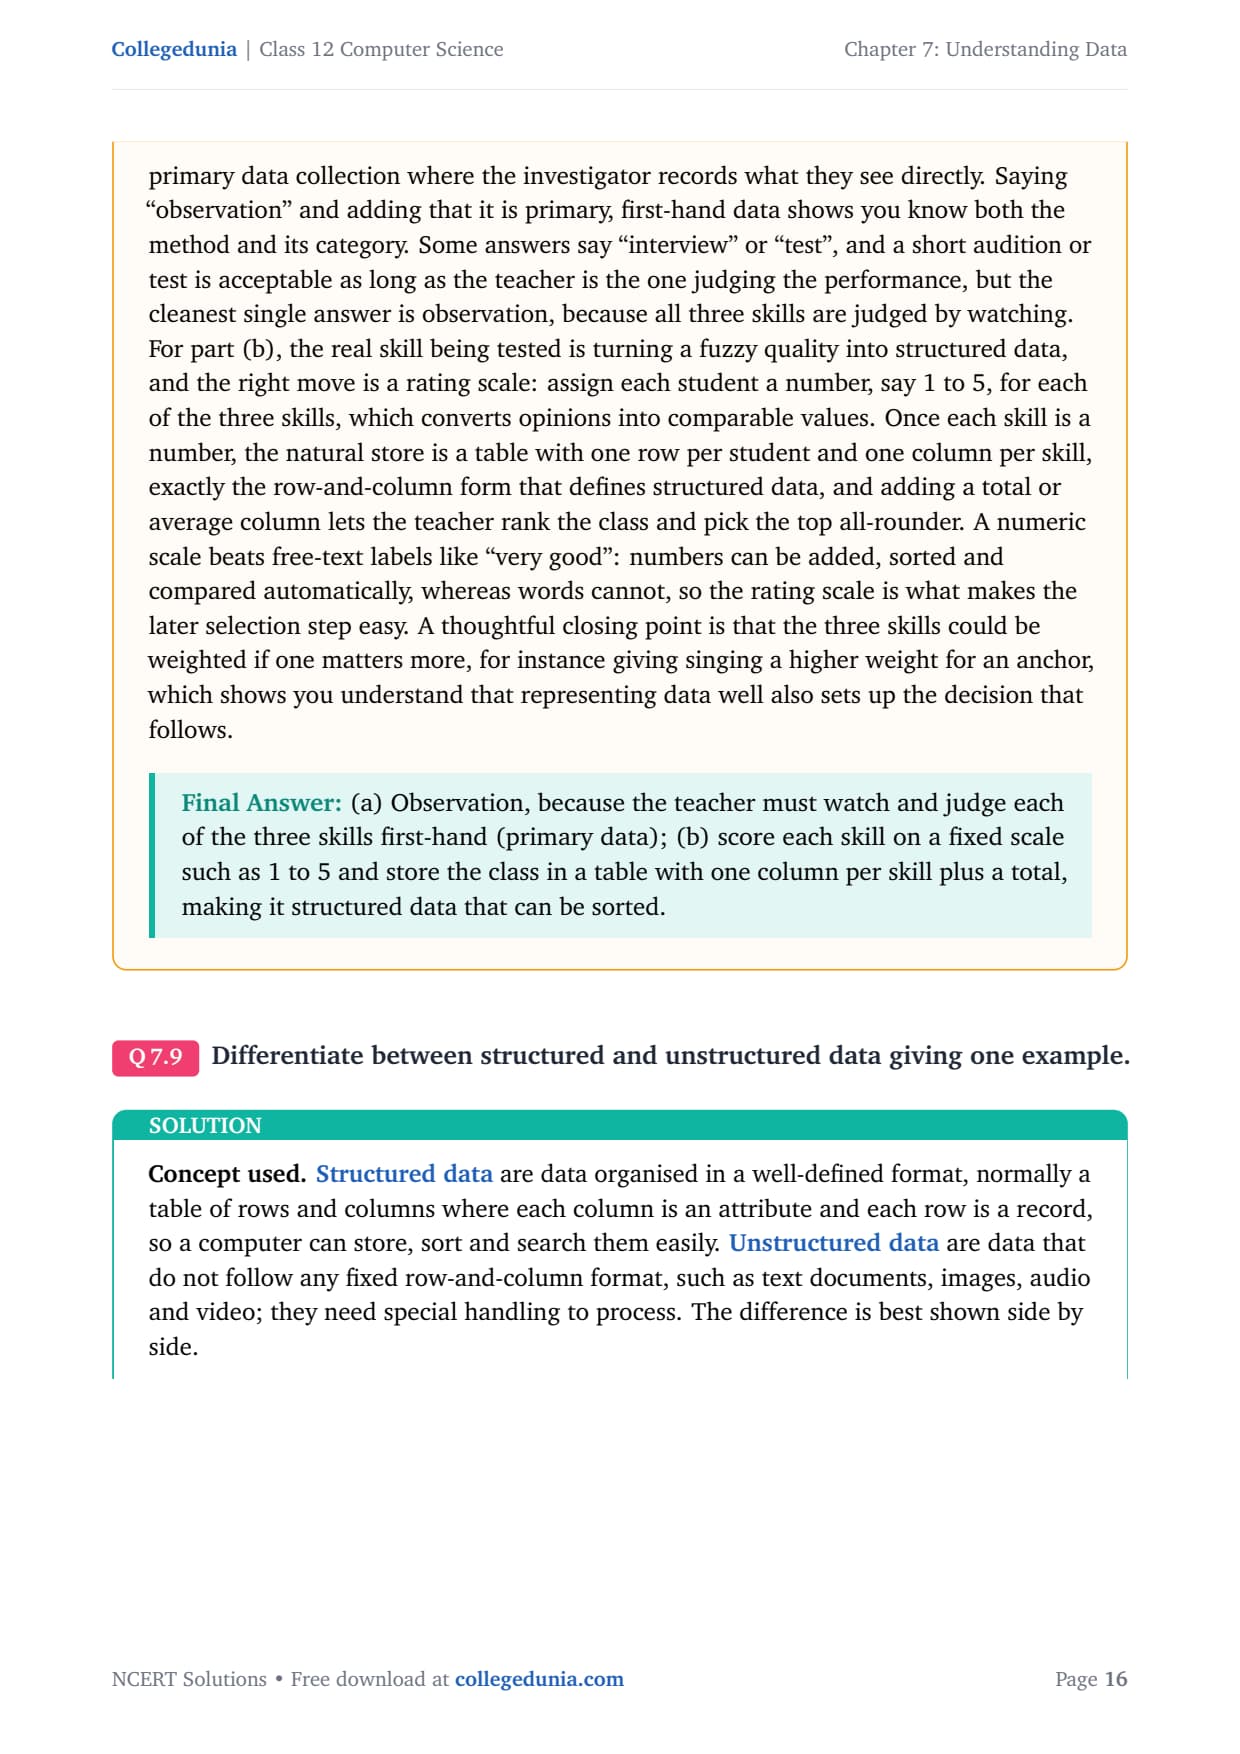
For (a), skills like singing and monitoring cannot be collected by a self-filled form, because self-reported skill is unreliable; the teacher must watch and rate each student, which is the observation method, a kind of primary, first-hand collection.
A short audition or test is acceptable as long as the teacher does the judging, but the cleanest single answer is observation, since all three skills are judged by watching.
For (b), the right move is a rating scale (say 1 to 5) per skill, stored as a table with one row per student and one column per skill, which is exactly the structured form; a total or average column lets the teacher rank and pick the top all-rounder.
A numeric scale beats free-text labels like "very good", because numbers can be added, sorted and compared automatically. You could even weight the skills if one matters more for an anchor.
Answer: (a) Observation, because the teacher must watch and judge each skill first-hand; (b) score each skill on a fixed scale such as 1 to 5 and store the class in a table with a total column, making it structured data.
Q 9
Differentiate between structured and unstructured data giving one example.
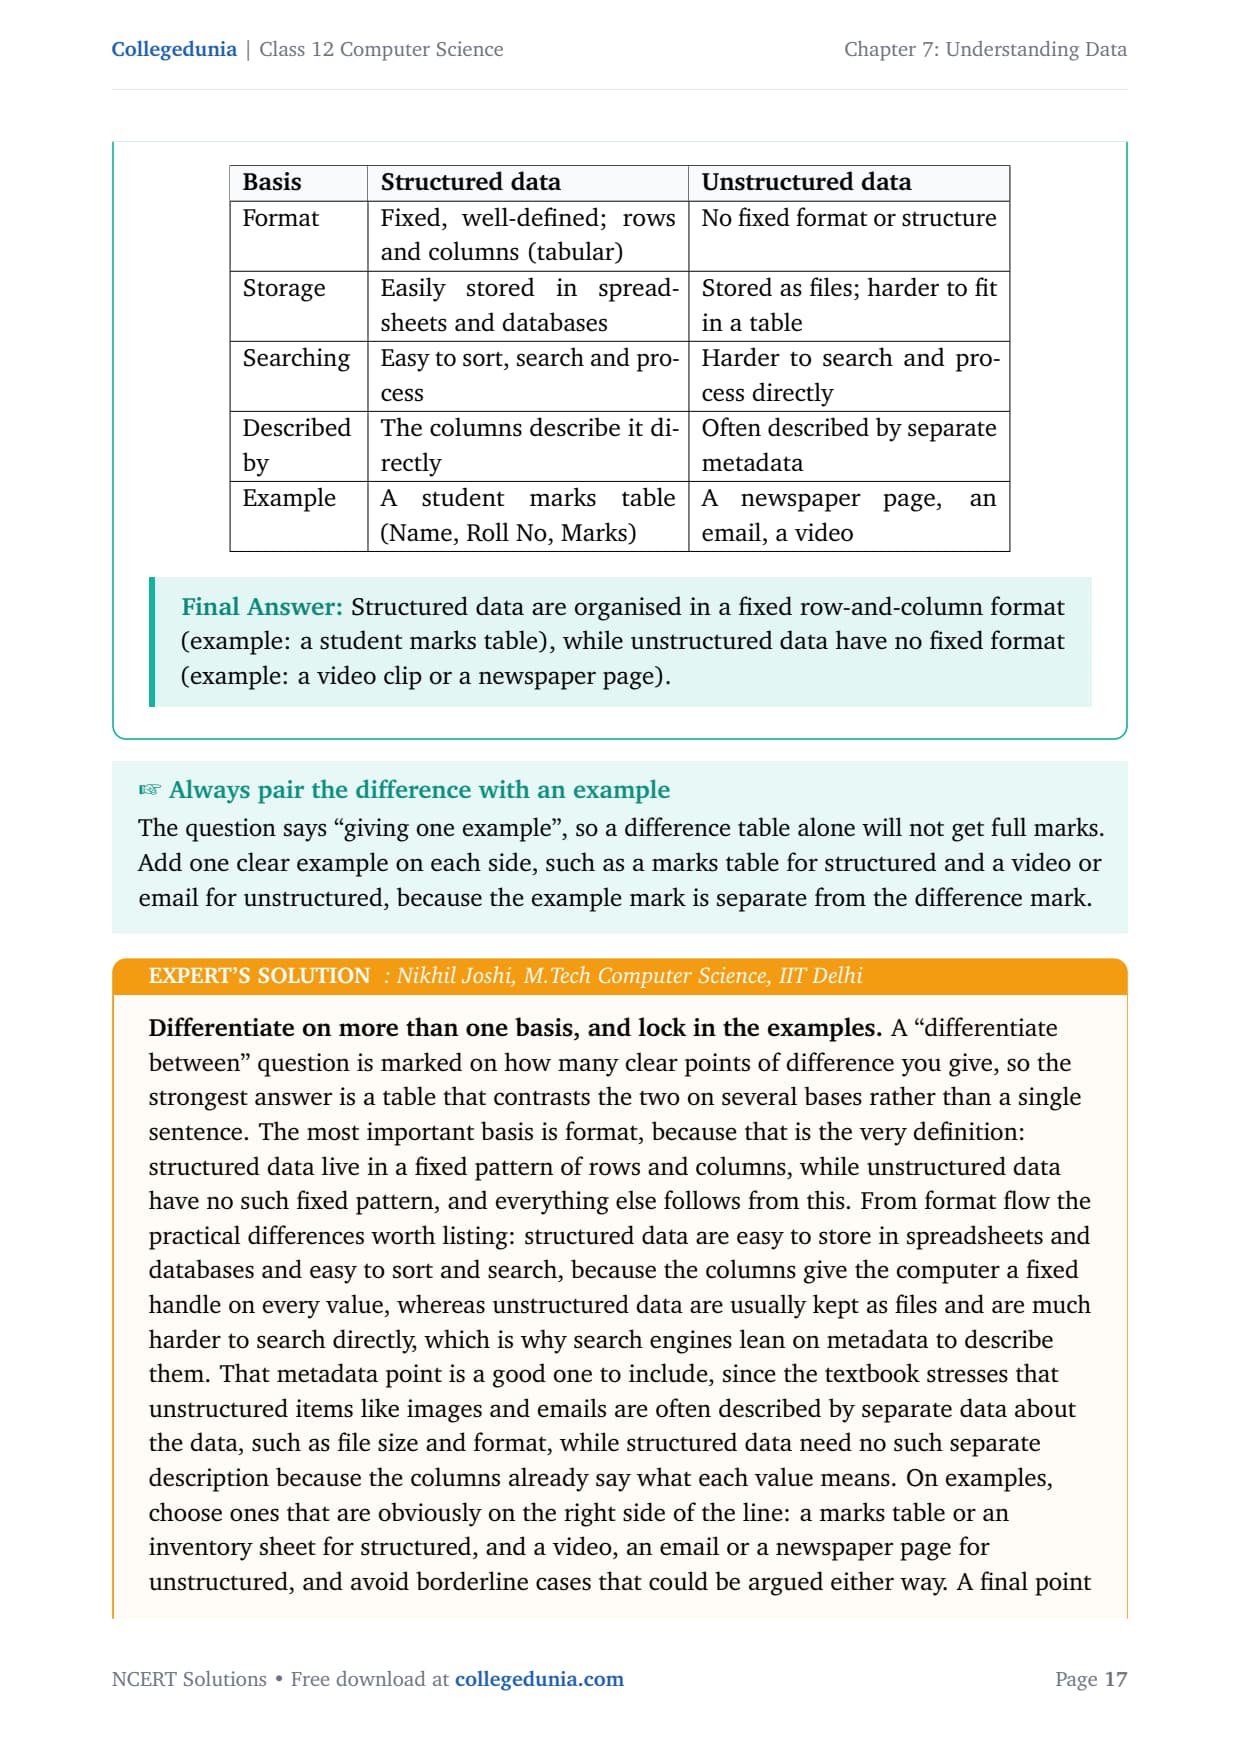
Structured data are organised in a well-defined format, normally a table of rows and columns where each column is an attribute and each row is a record, so a computer can store, sort and search them easily. Unstructured data do not follow any fixed row-and-column format, such as text documents, images, audio and video; they need special handling. The difference is best shown side by side.
Basis
Structured data
Unstructured data
Format
Fixed, well-defined; rows and columns
No fixed format or structure
Storage
Easily stored in spreadsheets and databases
Stored as files; harder to fit in a table
Searching
Easy to sort, search and process
Harder to search and process directly
Described by
The columns describe it directly
Often described by separate metadata
Example
A student marks table (Name, Roll No, Marks)
A newspaper page, an email, a video
Answer: Structured data are organised in a fixed row-and-column format (example: a student marks table), while unstructured data have no fixed format (example: a video clip or a newspaper page).
NJ
Nikhil Joshi
M.Tech Computer Science, IIT Delhi
Verified Expert
Differentiate on more than one basis, and lock in the examples, because a "differentiate between" question is marked on how many clear points of difference you give.
The most important basis is format: structured data live in a fixed pattern of rows and columns, unstructured data do not, and everything else follows from this.
From format flow the practical differences: structured data are easy to store and search because the columns give a fixed handle on every value, while unstructured data are kept as files and lean on metadata to be described.
Choose clear examples: a marks table or inventory sheet for structured, and a video, email or newspaper page for unstructured; avoid borderline cases.
A final point that often earns a mark: this book and most beginner database work focus on structured data precisely because it fits neatly into tables, which is the form the next chapters on databases and SQL build on.
Answer: Contrast on format, storage, searching and description: structured data are fixed rows and columns (a marks table), easy to store and search; unstructured data have no fixed format (a video or email) and are often described by metadata.
Q 10
The principal of a school wants to do following analysis on the basis of food items procured and sold in the canteen: a) Compare the purchase and sale price of fruit juice and biscuits. b) Compare sales of fruit juice, biscuits and samosa. c) Variation in sale price of fruit juices of different companies for same quantity (in ml). Create an appropriate dataset for these items (fruit juice, biscuits, samosa) by listing their purchase price and sale price. Apply basic statistical techniques to make the comparisons.
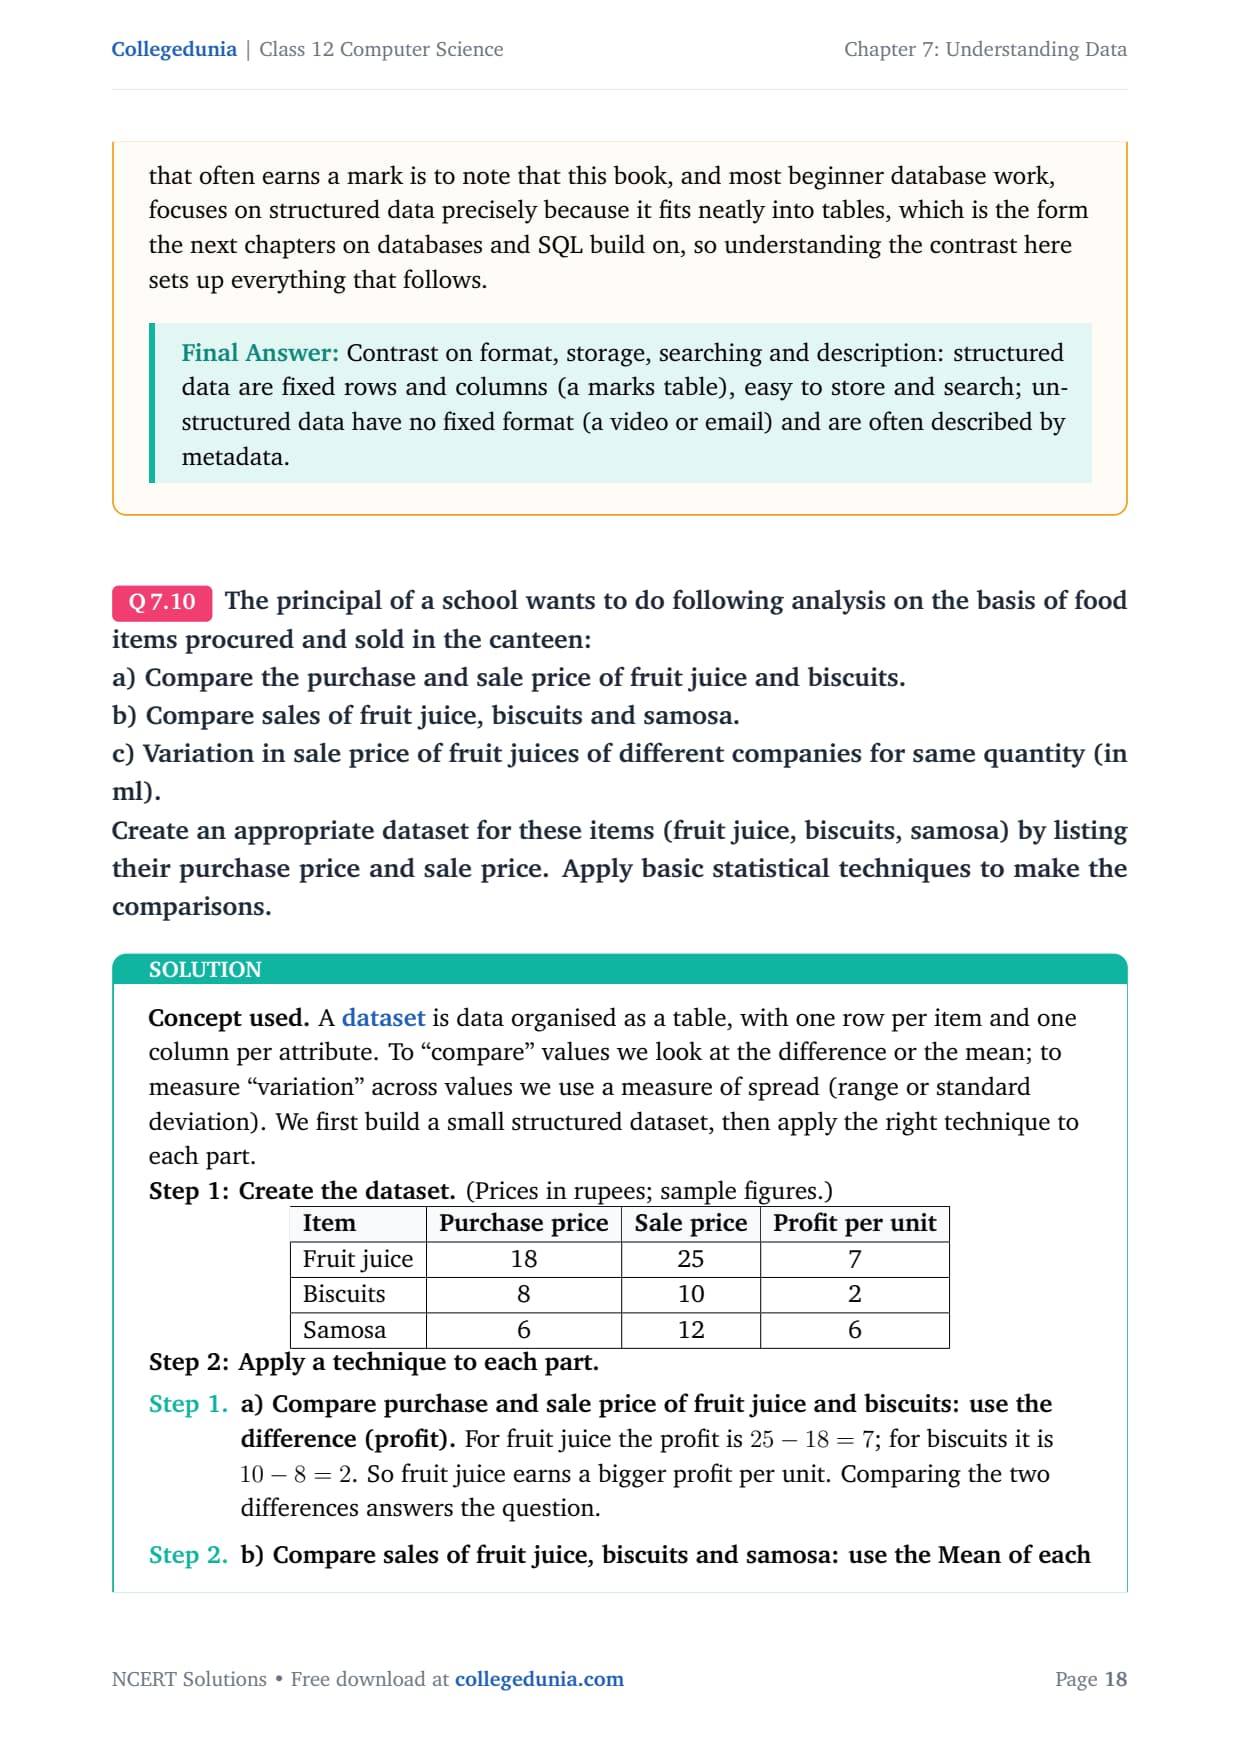
A dataset is data organised as a table, one row per item and one column per attribute. To "compare" values we look at the difference or the mean; to measure "variation" we use a measure of spread (range or standard deviation). First build a small structured dataset, then apply the right technique to each part.
Step 1: Create the dataset (prices in rupees; sample figures).
Item
Purchase price
Sale price
Profit per unit
Fruit juice
18
25
7
Biscuits
8
10
2
Samosa
6
12
6
Step 2: Apply a technique to each part.
a) Compare price of juice and biscuits: use the difference (profit). Juice profit is 25 minus 18 = 7; biscuit profit is 10 minus 8 = 2. So juice earns a bigger profit per unit.
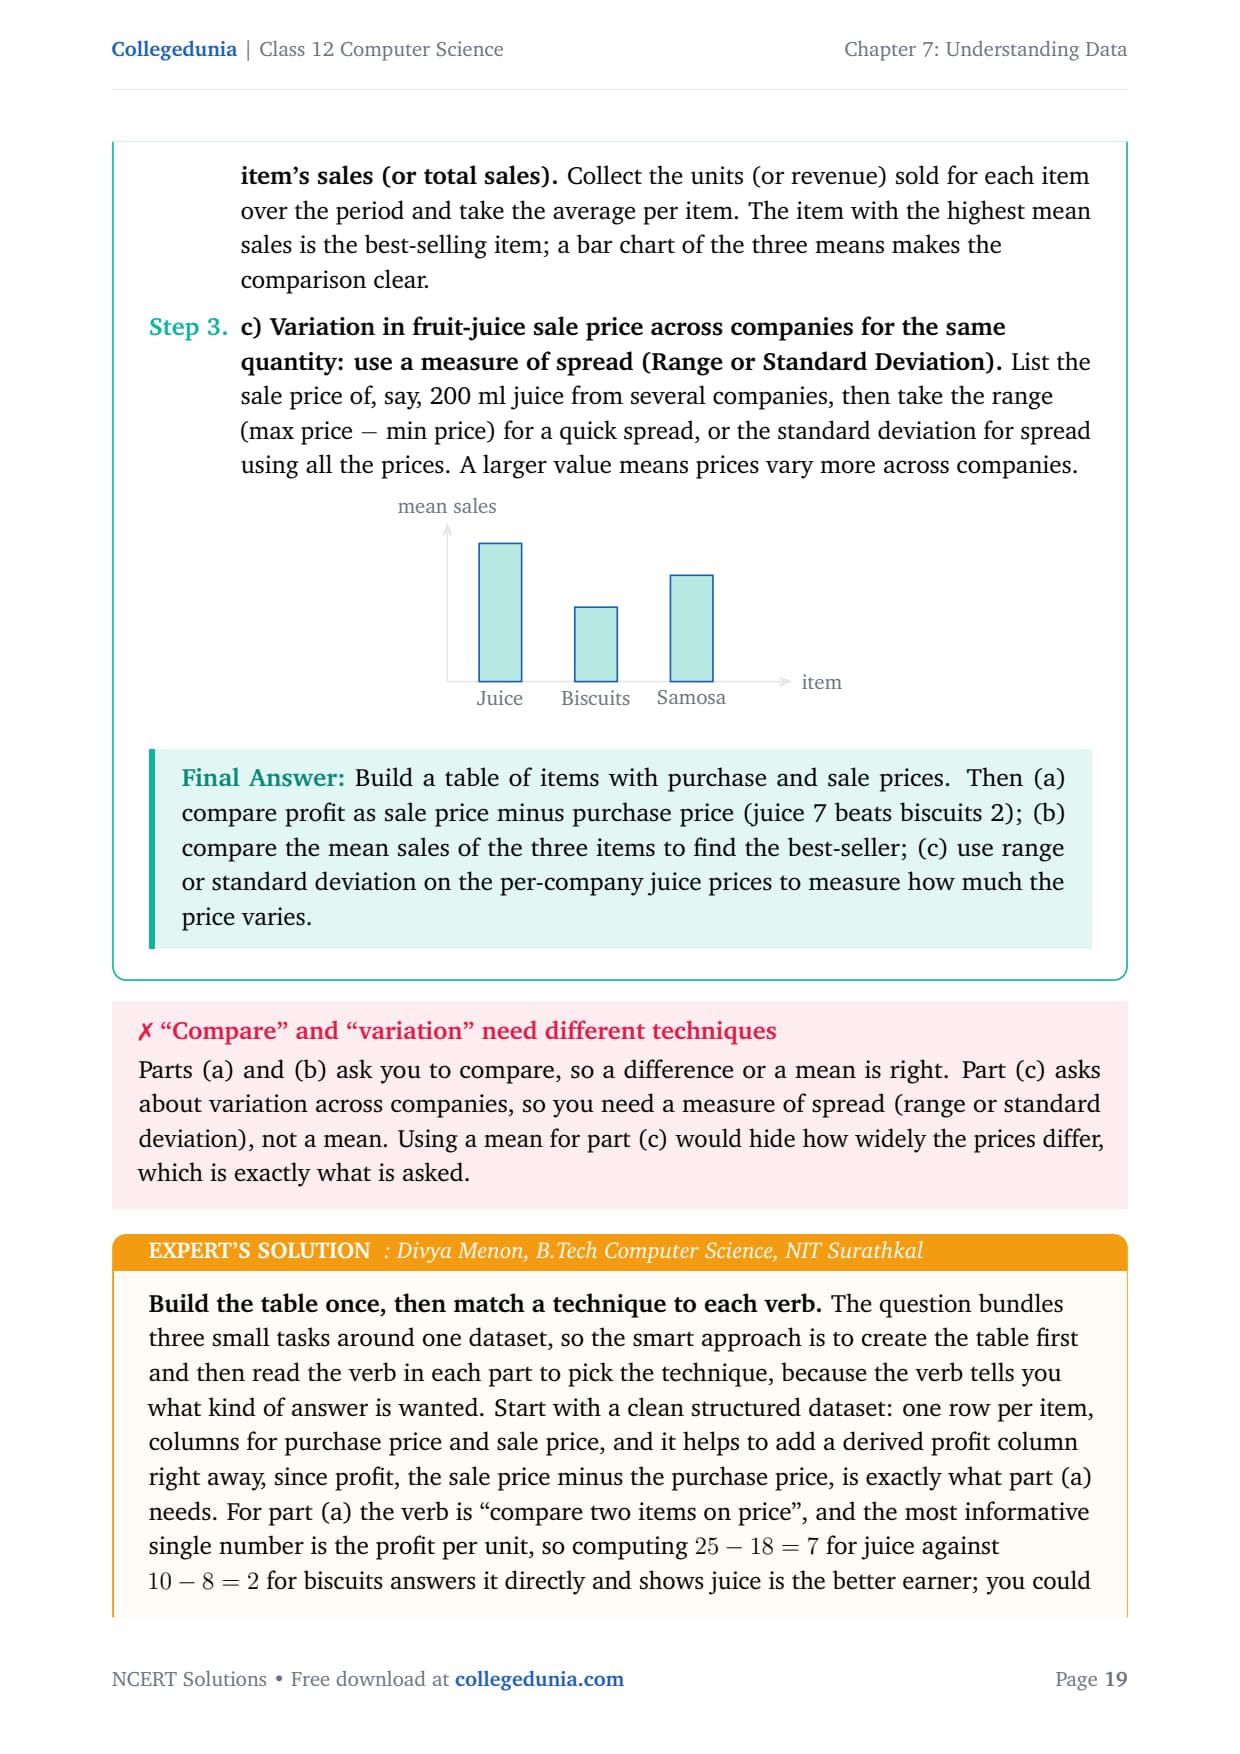
b) Compare sales of the three items: use the Mean of each item's sales. Collect units (or revenue) sold per item over the period and take the average. The highest mean is the best-seller; a bar chart of the three means makes it clear.
c) Variation in juice price across companies: use a measure of spread (Range or Standard Deviation). List the sale price of, say, 200 ml juice from several companies, then take the range (max minus min) or the standard deviation. A larger value means prices vary more.
Answer: Build a table of items with purchase and sale prices, then (a) compare profit as sale minus purchase (juice 7 beats biscuits 2); (b) compare the mean sales of the three items; (c) use range or standard deviation on the per-company juice prices to measure variation.
DM
Divya Menon
B.Tech Computer Science, NIT Surathkal
Verified Expert
Build the table once, then match a technique to each verb, because the verb tells you what kind of answer is wanted.
Start with a clean dataset: one row per item, columns for purchase and sale price, plus a derived profit column, since profit (sale minus purchase) is exactly what part (a) needs.
For (a) the verb is "compare two items on price", and the most informative single number is profit per unit, so 7 for juice against 2 for biscuits answers it directly.
For (b) "compare sales" across three items means each item has many sales figures, so reduce each to its mean and line them up; a bar chart of the three means turns the comparison into a glance. Do not confuse comparing sales (quantity sold) with comparing prices.
Part (c) changes technique: "variation" is spread, not comparison, so gather the price of the same quantity (say 200 ml) from several brands and measure the spread with the range or, more thoroughly, the standard deviation.
The deciding habit: "compare" tends to mean a difference or a mean, while "variation" means a measure of dispersion. Write the chosen technique beside each part with a one-line reason.
Answer: Make one table with purchase, sale and profit columns, then match the verb: profit difference for (a), the mean of each item's sales for (b), and range or standard deviation on the per-company juice prices for (c).
NCERT Solutions Class 12 Computer Science Chapter 7 Understanding Data FAQs
Ques. How many questions are there in NCERT Class 12 Computer Science Chapter 7 Understanding Data?
Ans. There are 10 end-of-chapter exercise questions in NCERT Class 12 Computer Science Chapter 7 Understanding Data. All 10 are solved with full answers and an Expert Solution in the PDF. The mix is two classify-or-identify-the-data questions, two data-collection and processing questions, four choose-the-technique questions on mean, mode, range, standard deviation and frequency, one differentiate question, and one dataset-building question.
Ques. What is the difference between structured and unstructured data?
Ans. Structured data are organised in a fixed, well-defined format, normally a table of rows and columns where each column is an attribute and each row is a record, so they are easy to store, sort and search. Unstructured data have no fixed row-and-column format, such as text, images, audio and video, so they are harder to search and are often described by separate metadata. A student marks table is an example of structured data, while a video clip or an email is an example of unstructured data. This is the answer to Question 9.
Ques. What is the difference between primary and secondary data in Class 12 Computer Science?
Ans. Primary data are collected first-hand by the investigator for the current purpose, for example a fresh survey or by observing students directly. Secondary data already exist for some other purpose and are reused, for example a bank's stored account records. Using stored records is faster and cheaper, which is why Question 3 starts with the bank's own database (secondary data) and only adds a small survey (primary data) to fill the gaps. The observation method in Question 8 is a form of primary data collection.
Ques. When should you use mean, mode, range or standard deviation?
Ans. Use the mean for an average of numeric values, such as the average temperature or the average marks per month. Use the mode for the most common value in category data, such as the most frequent division in a class, because you cannot average labels. Use the range (maximum minus minimum) for a quick spread, and the standard deviation when the question says "how varied" and you want a spread that uses every value. A useful check is that the standard deviation always comes out smaller than the range.
Ques. What are the steps of the data processing cycle?
Ans. The data processing cycle has three stages: input, processing and output. Input means collecting and entering the data, for example marks and family income for all 500 students in Question 2. Processing means cleaning, sorting, filtering and calculating, such as filtering students above 75% in both years AND below 5 lakh income. Output is the final result, such as the sorted scholarship beneficiary list. Following these three labelled stages in an answer shows the examiner you understand the structure of data processing.
Ques. How many pages is the Class 12th Computer Science Understanding Data NCERT Solutions PDF?
Ans. The Understanding Data NCERT Solutions PDF runs about 18 pages and covers all 10 exercise questions with step-by-step answers, sample datasets, worked statistical calculations, and an Expert Solution for each question. Both Normal and HD versions are available from this page, and both are free to download for the 2026-27 session.
Ques. Is the NCERT Solutions for Class 12 Computer Science Chapter 7 aligned with the 2026-27 syllabus?
Ans. Yes. This page reflects the current 2026-27 CBSE syllabus for Class 12 Computer Science. The Understanding Data chapter is unchanged for the current cycle, and every answer follows the NCERT textbook, including the data formats, the data processing cycle, and the statistical measures in section 7.5. The solutions are useful for the CBSE board exam, and the same data ideas help with CUET Computer Science and JEE-level data questions.
Ques. Why is standard deviation preferred over range for measuring variation?
Ans. Both range and standard deviation measure spread, but the range looks at only the two extreme values, the maximum and the minimum, while the standard deviation uses every value in the dataset. This means a single unusually high or low value moves the range a lot but the standard deviation only a little, so the standard deviation gives a more reliable picture of how varied the data really are. That is why Question 7 part (b) uses the standard deviation for the parents' ages rather than the range.








Comments