




The handwritten notes on Class 12 Computer Science Chapter 7 Understanding Data have been carefully prepared by hand for quick one-shot revision, according to the latest 2026-27 CBSE syllabus. They run for 24 ruled notebook pages in blue-ink style and cover structured vs unstructured data, the data processing cycle, data collection methods, and the statistical techniques of mean, median, mode, range, and standard deviation.
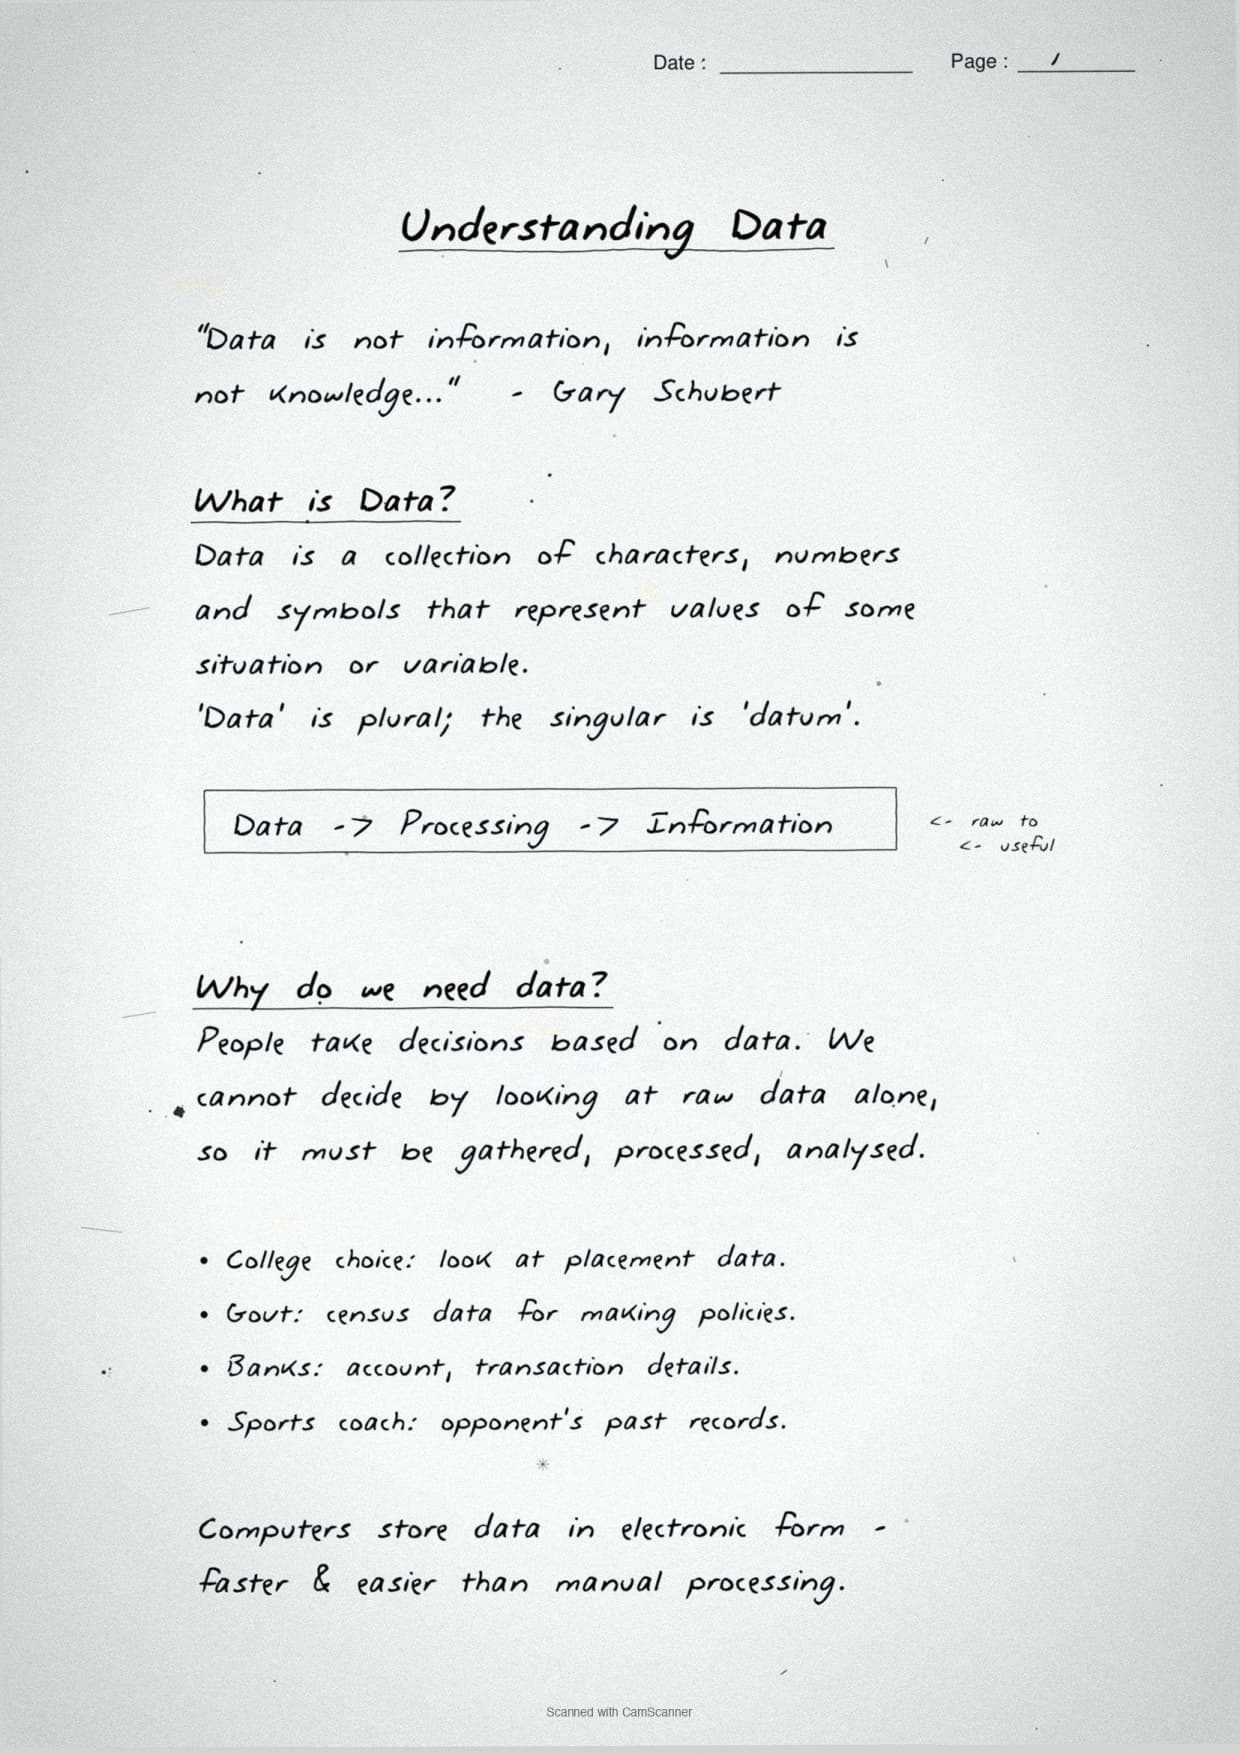
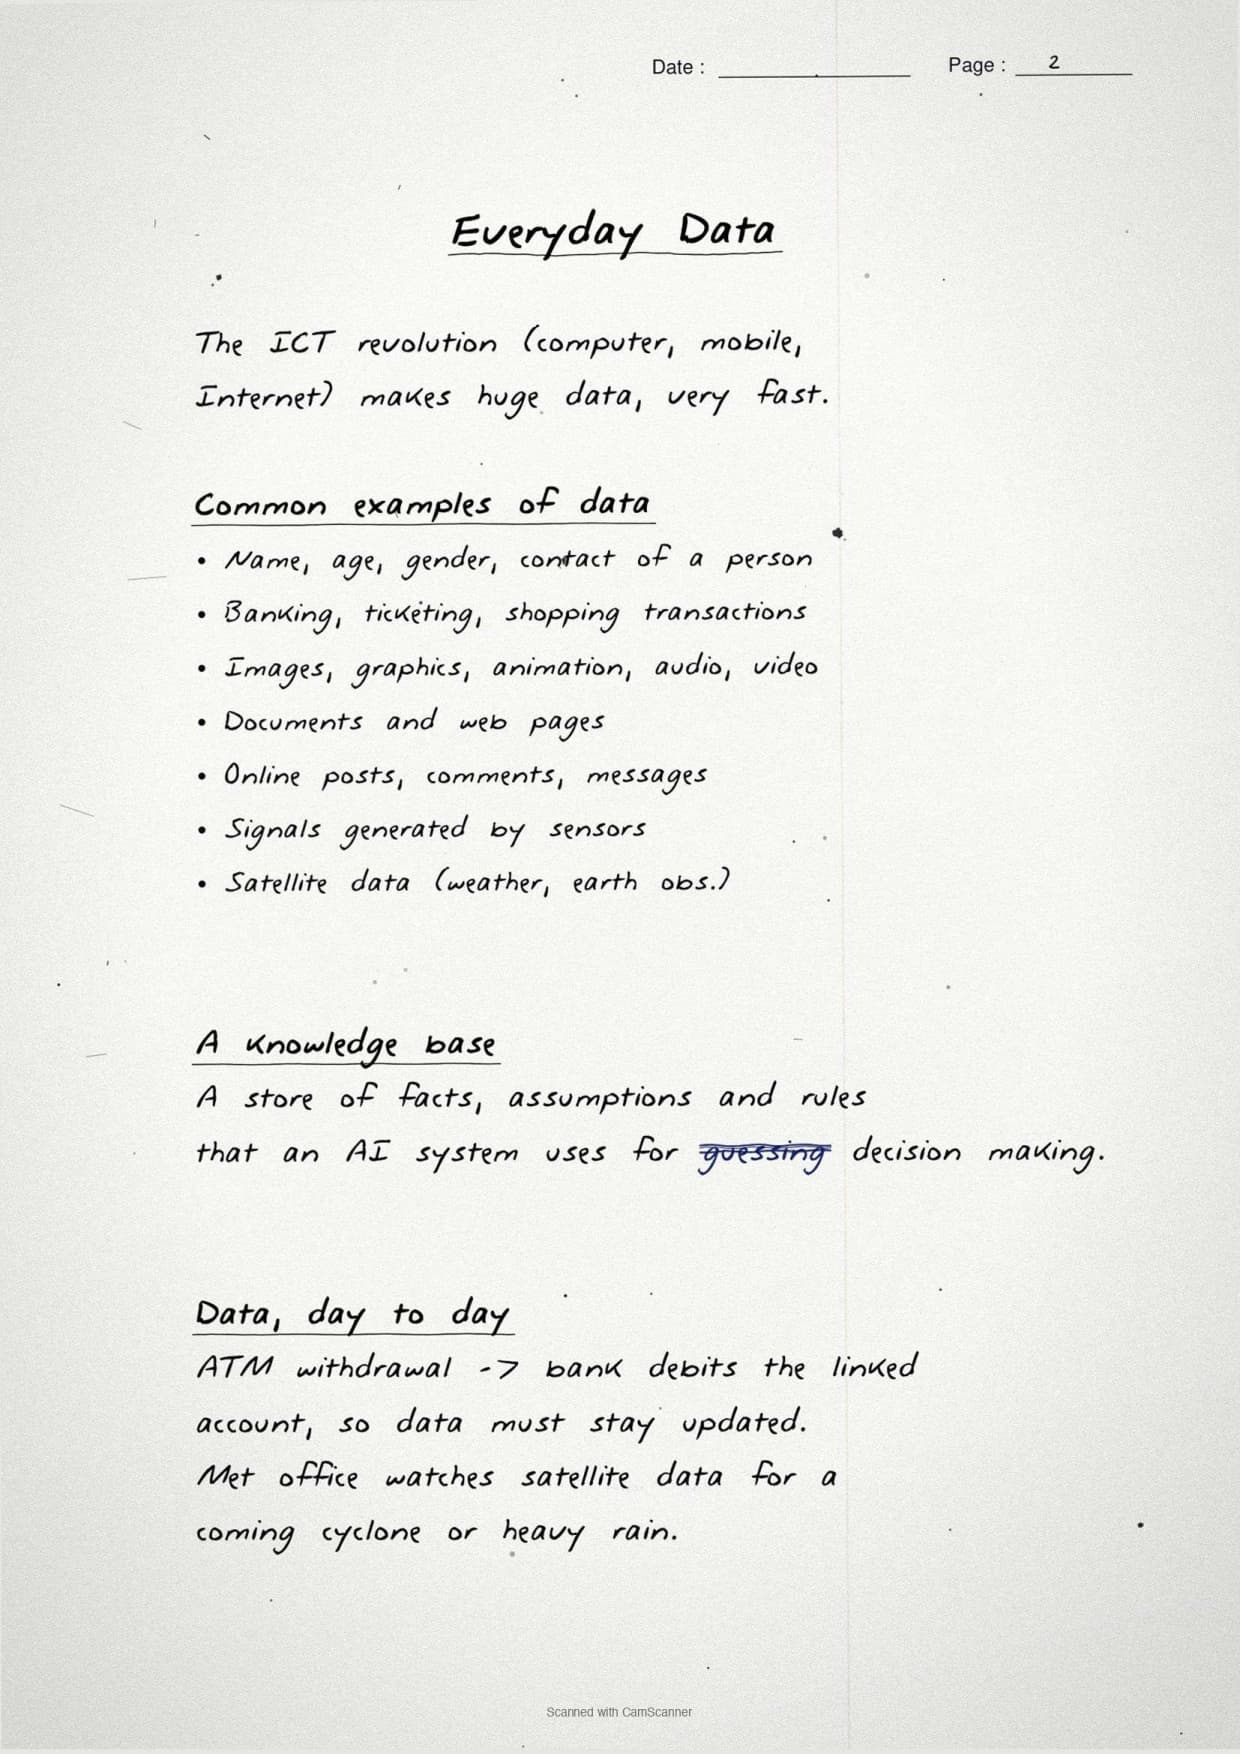
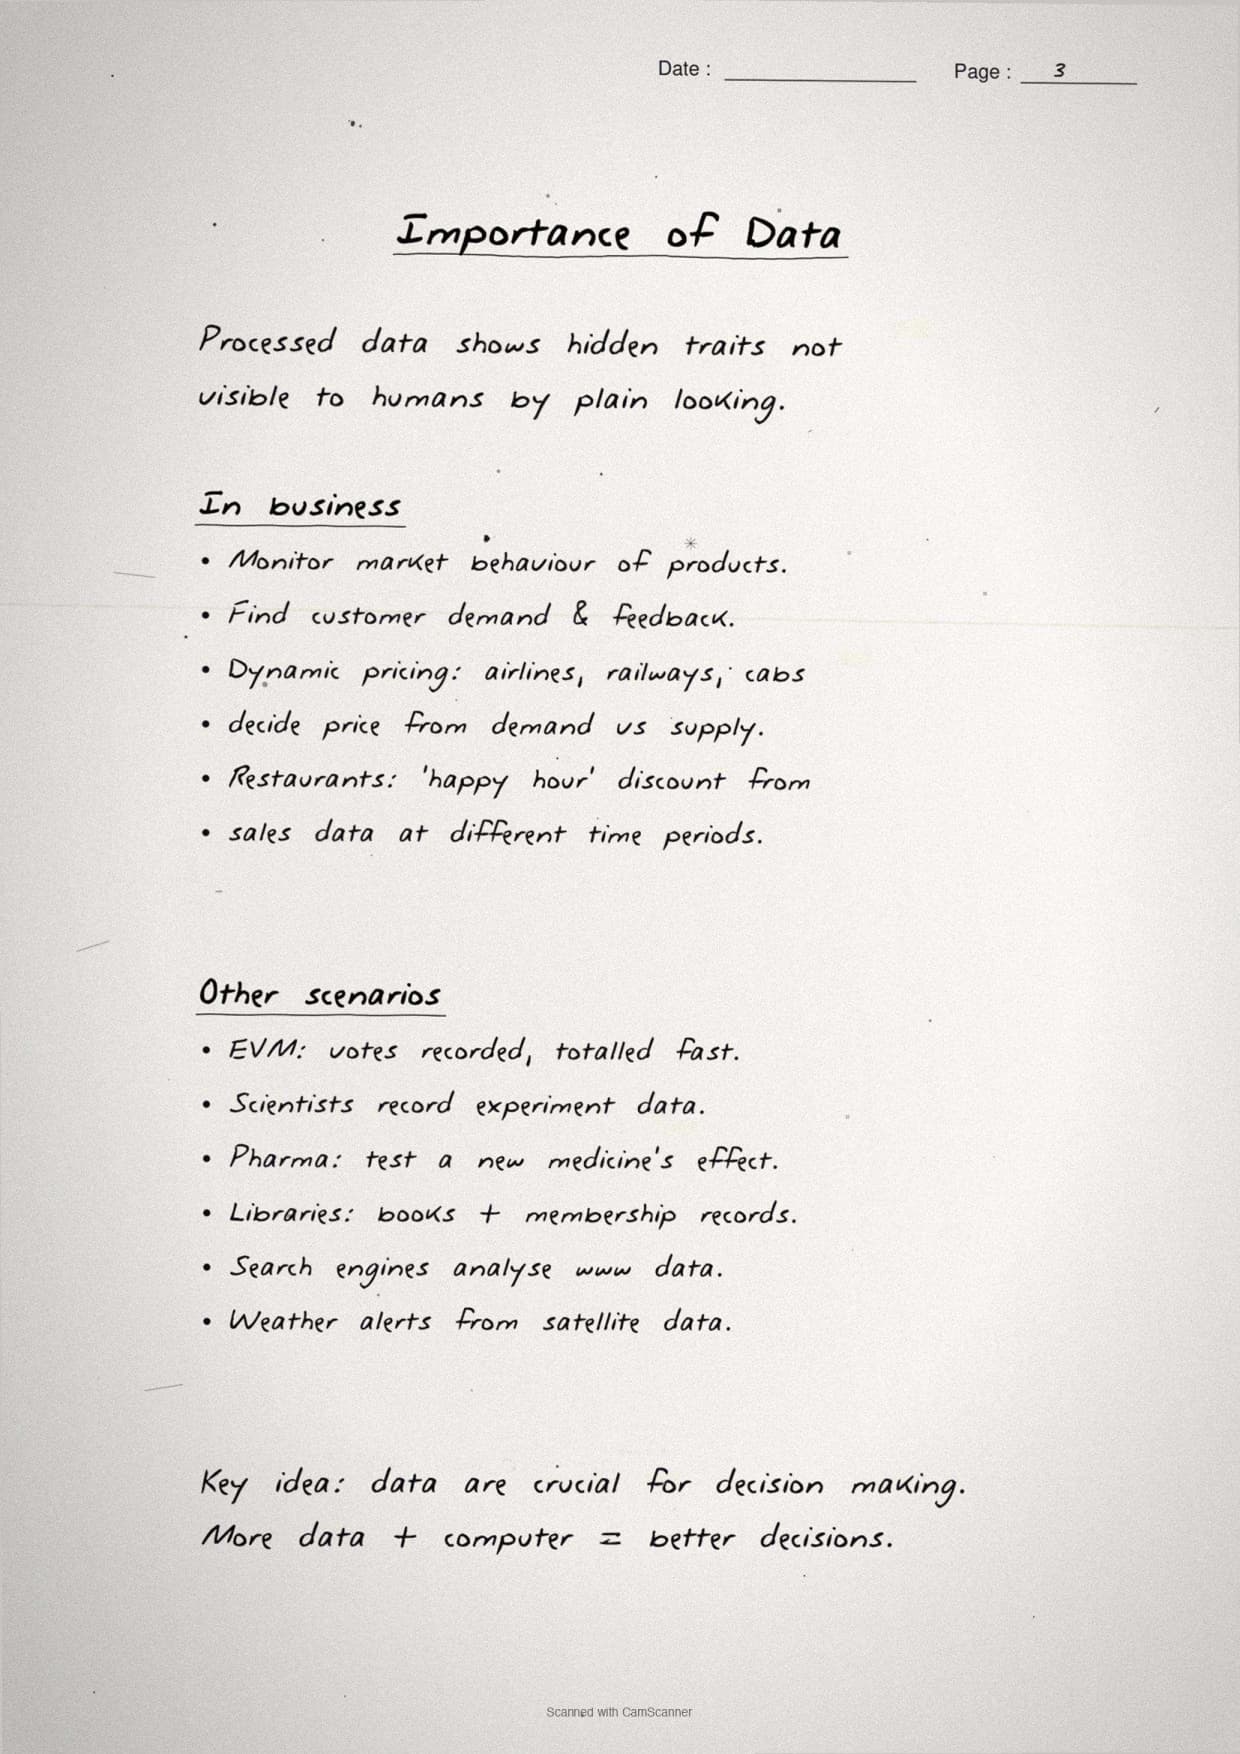
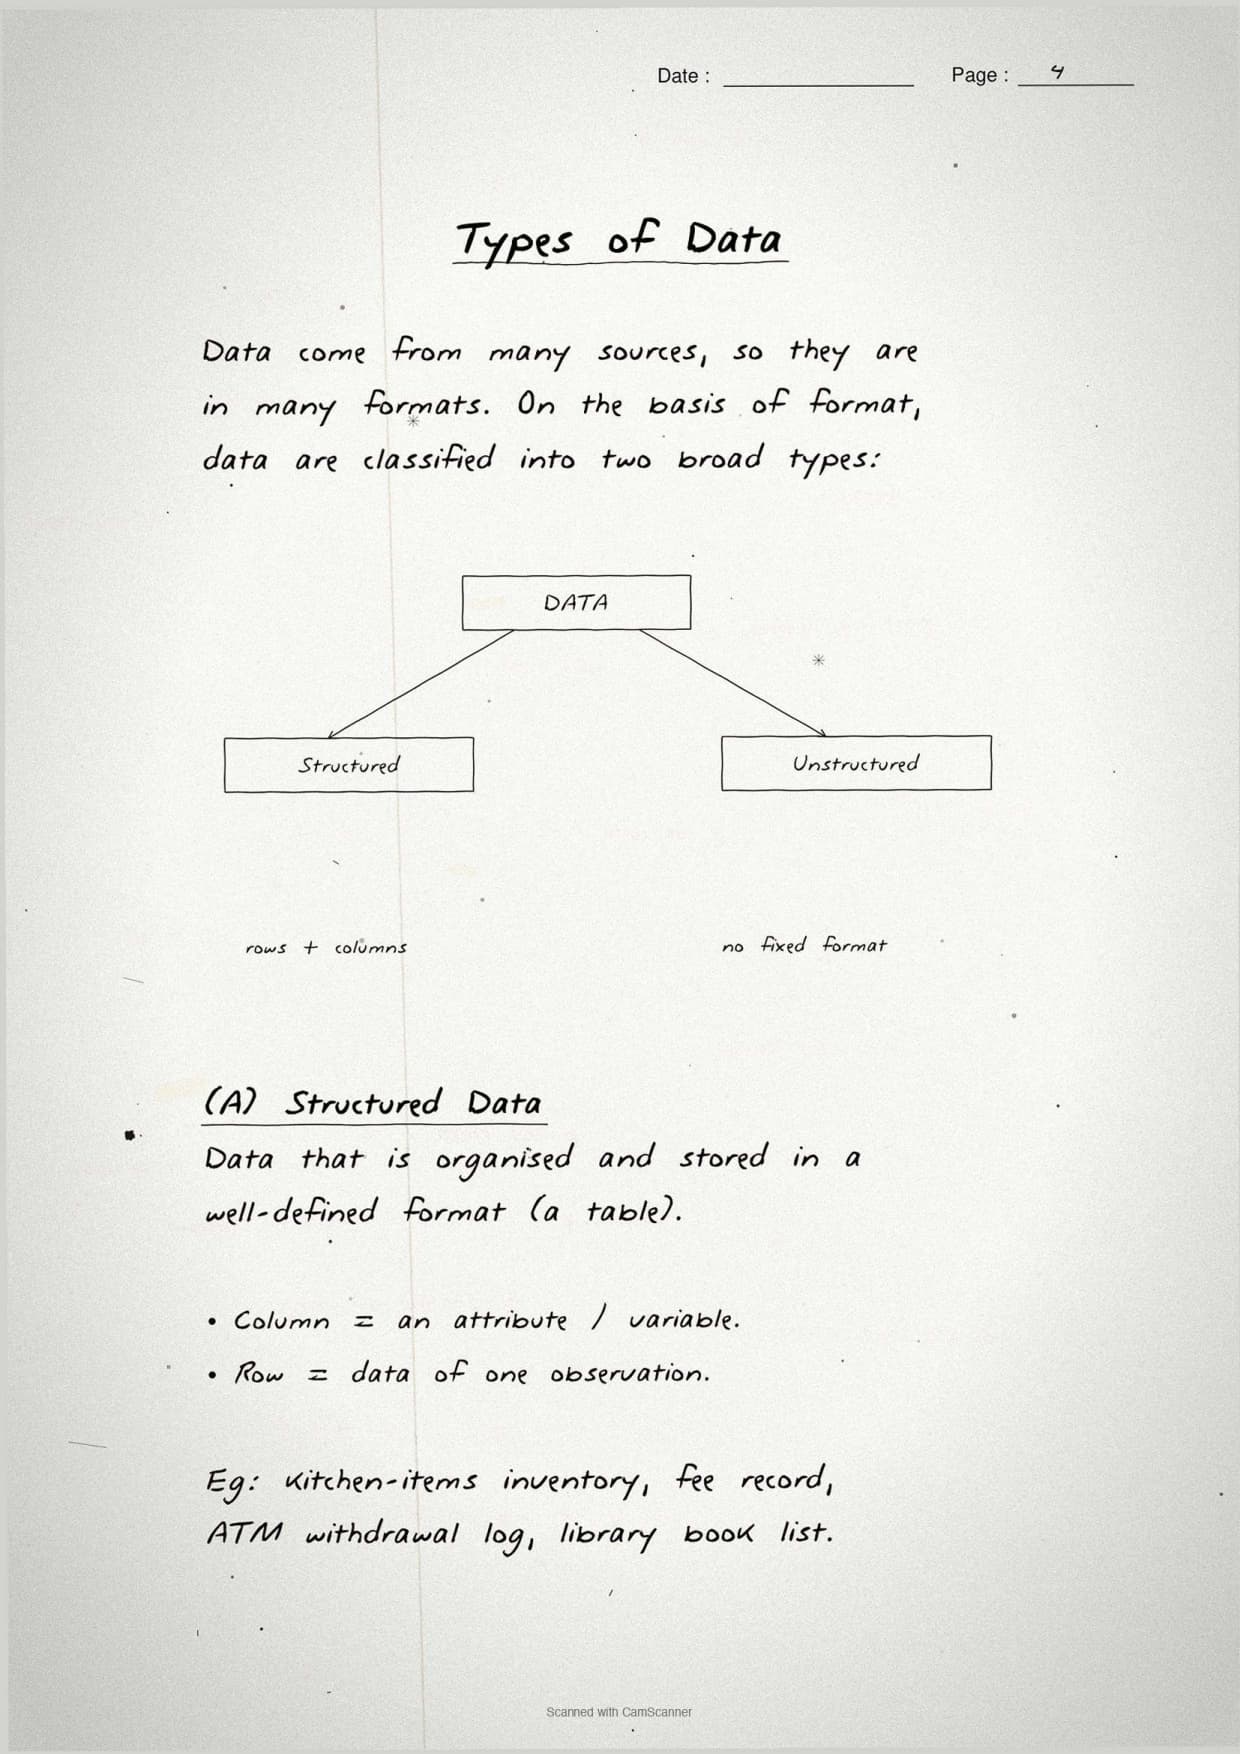
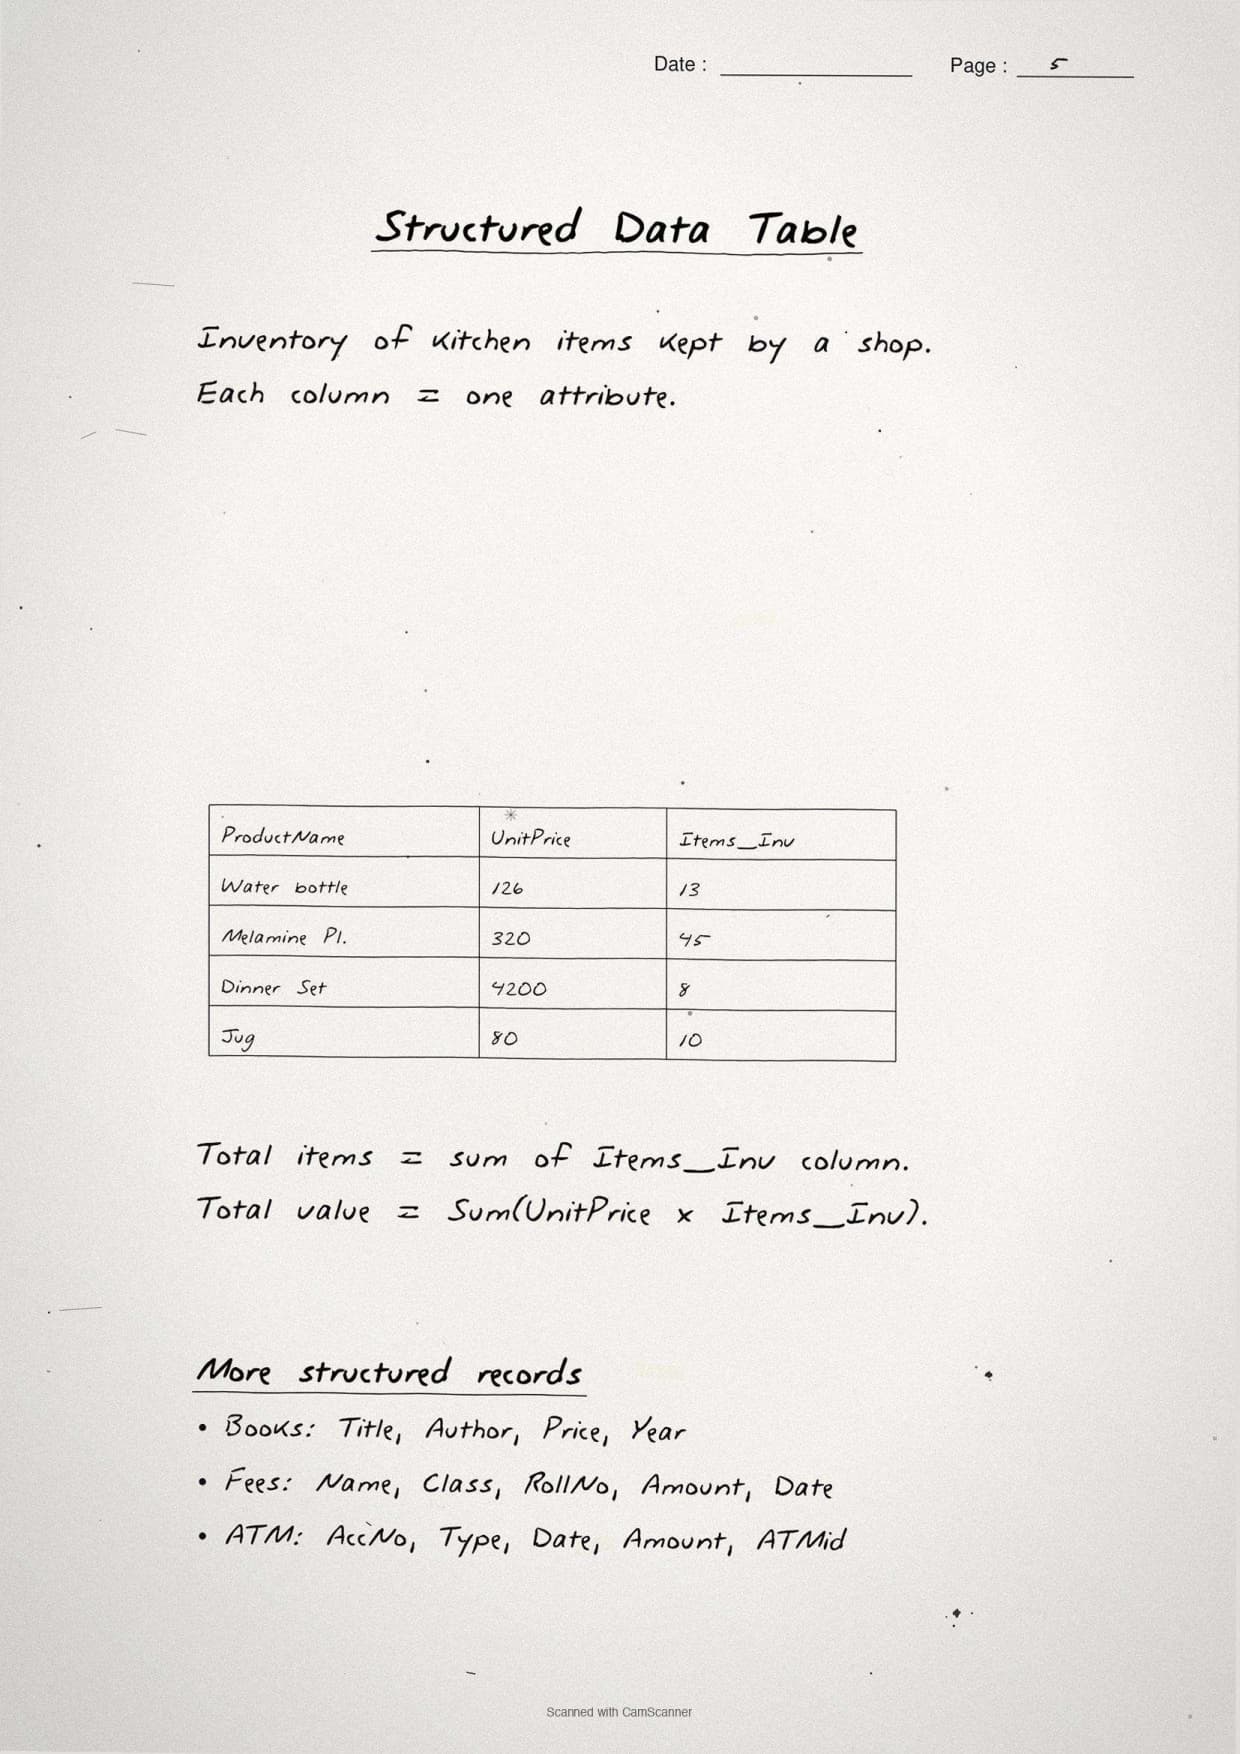
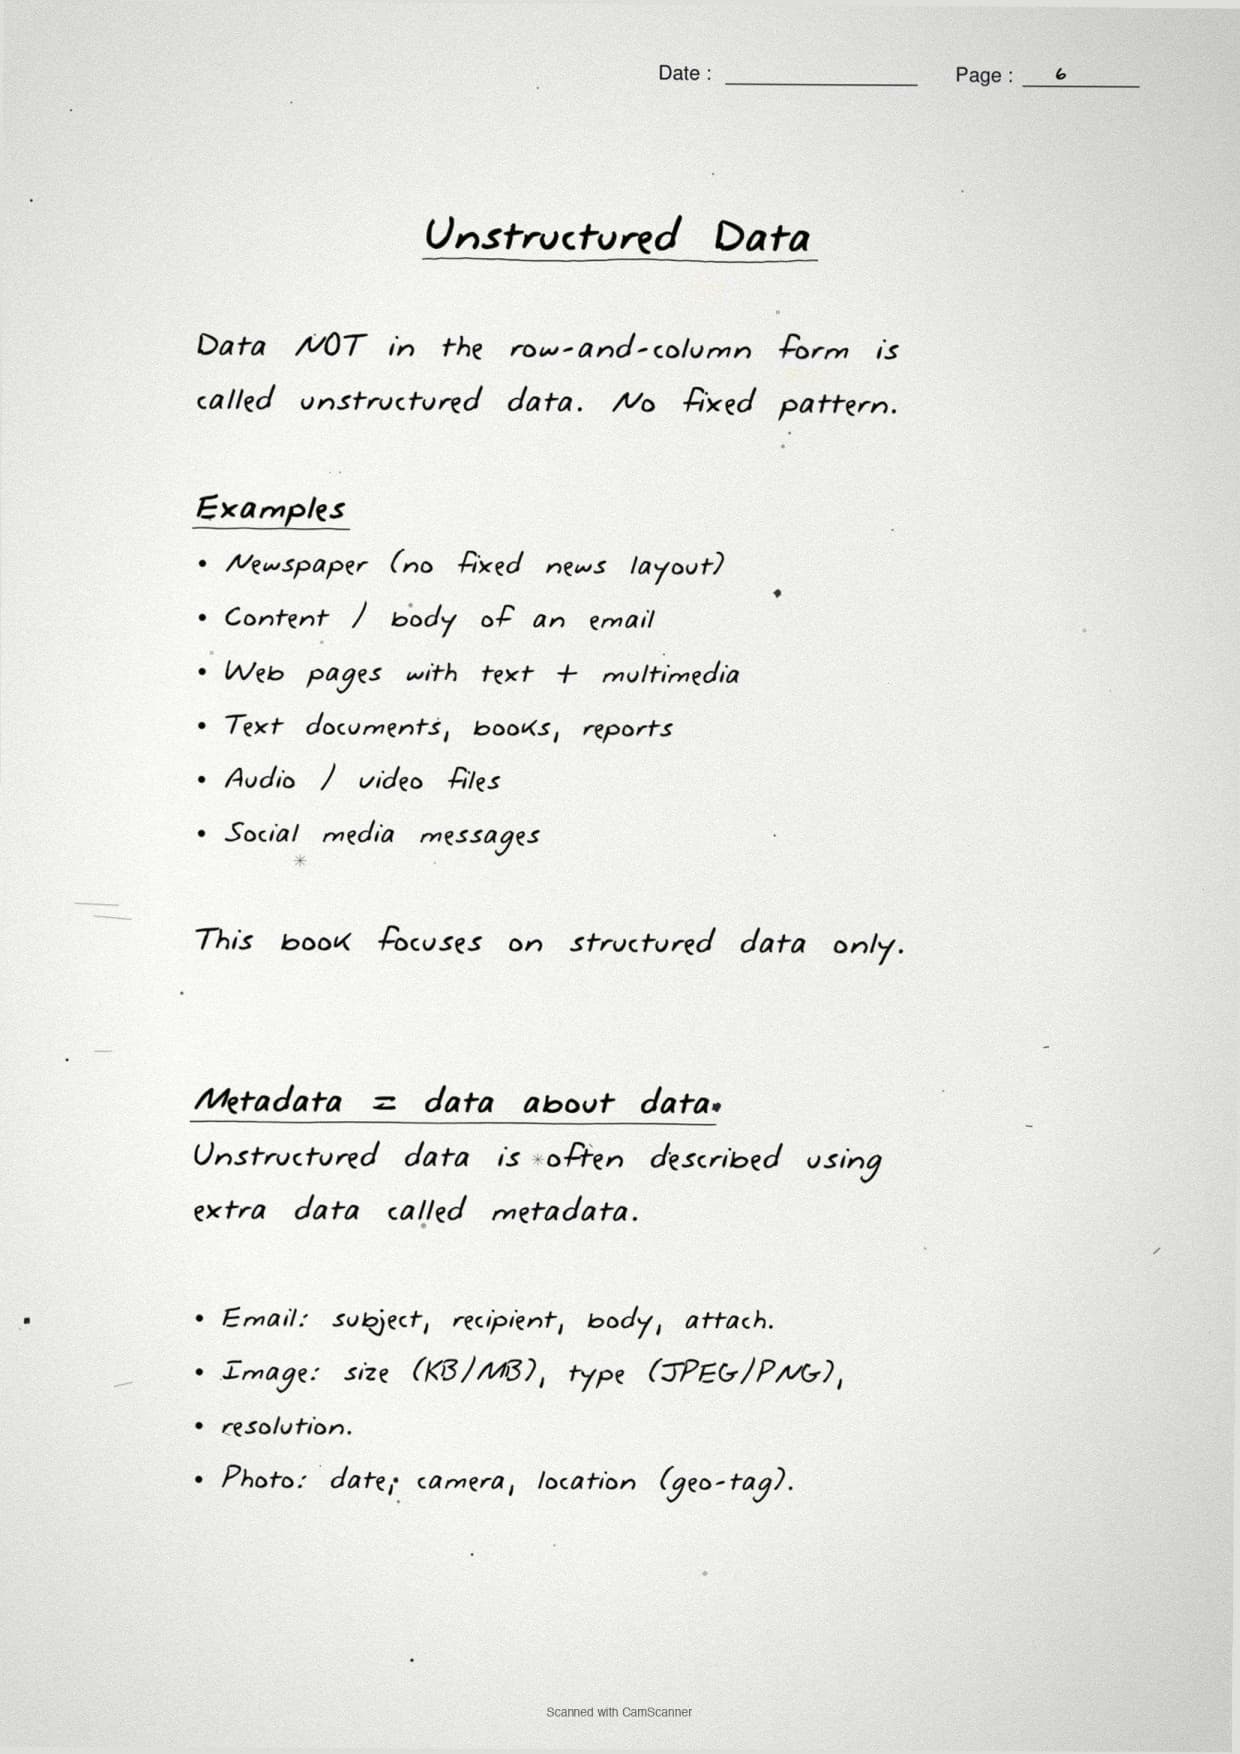
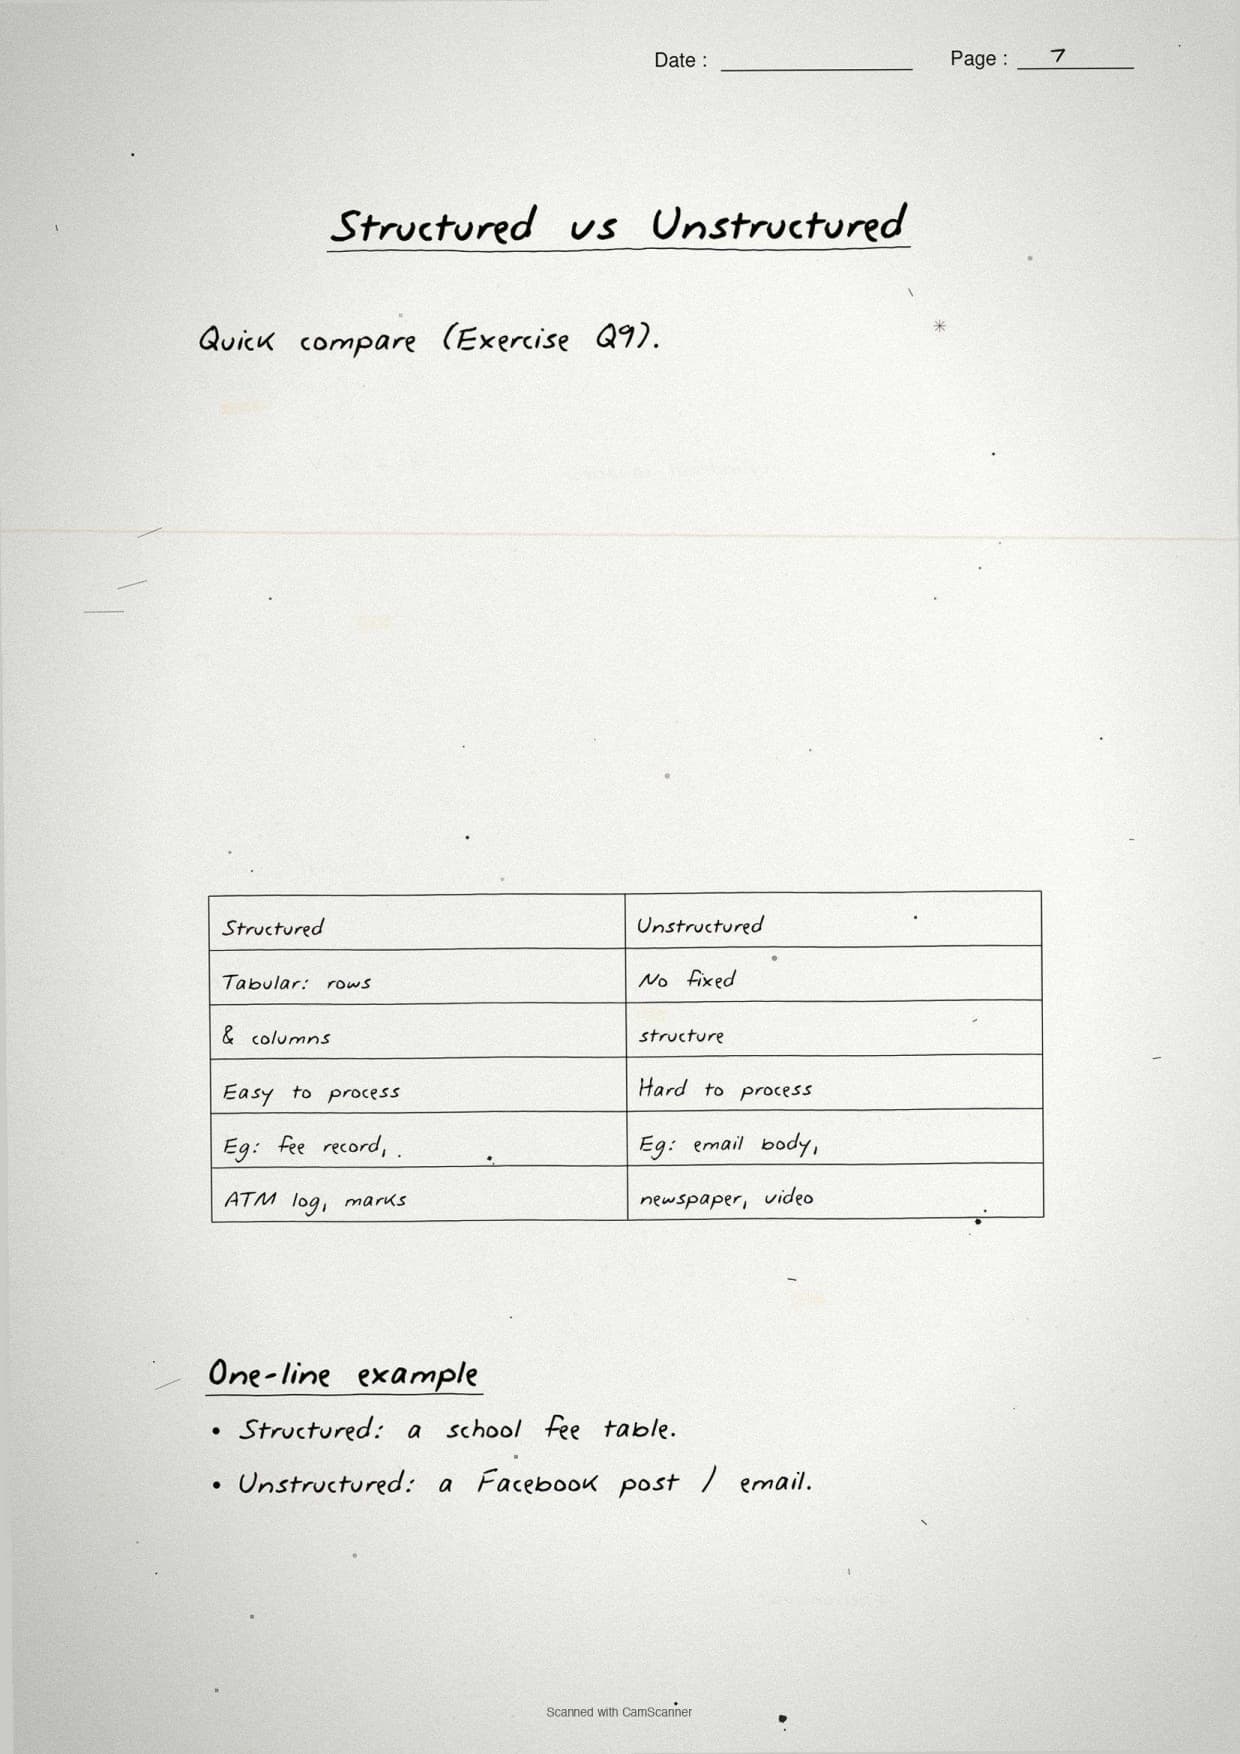
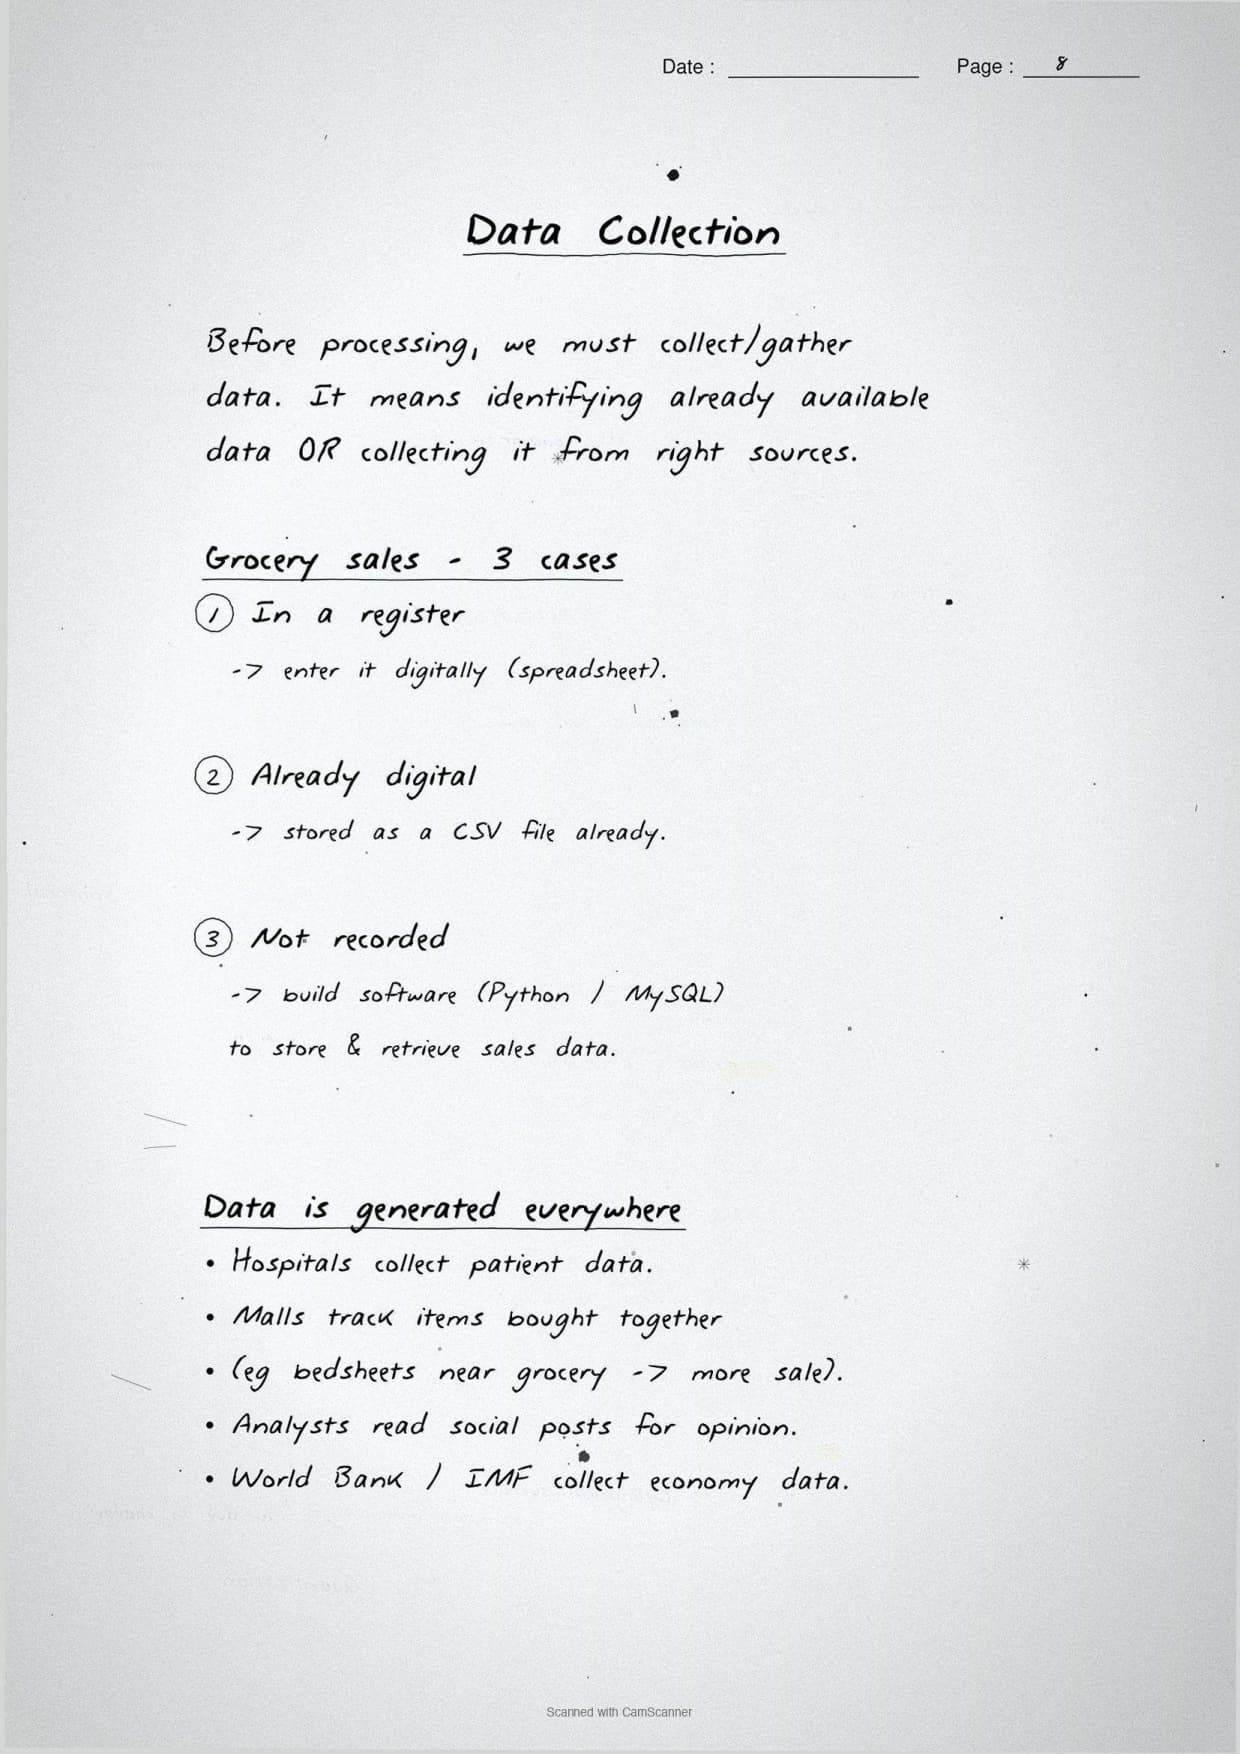
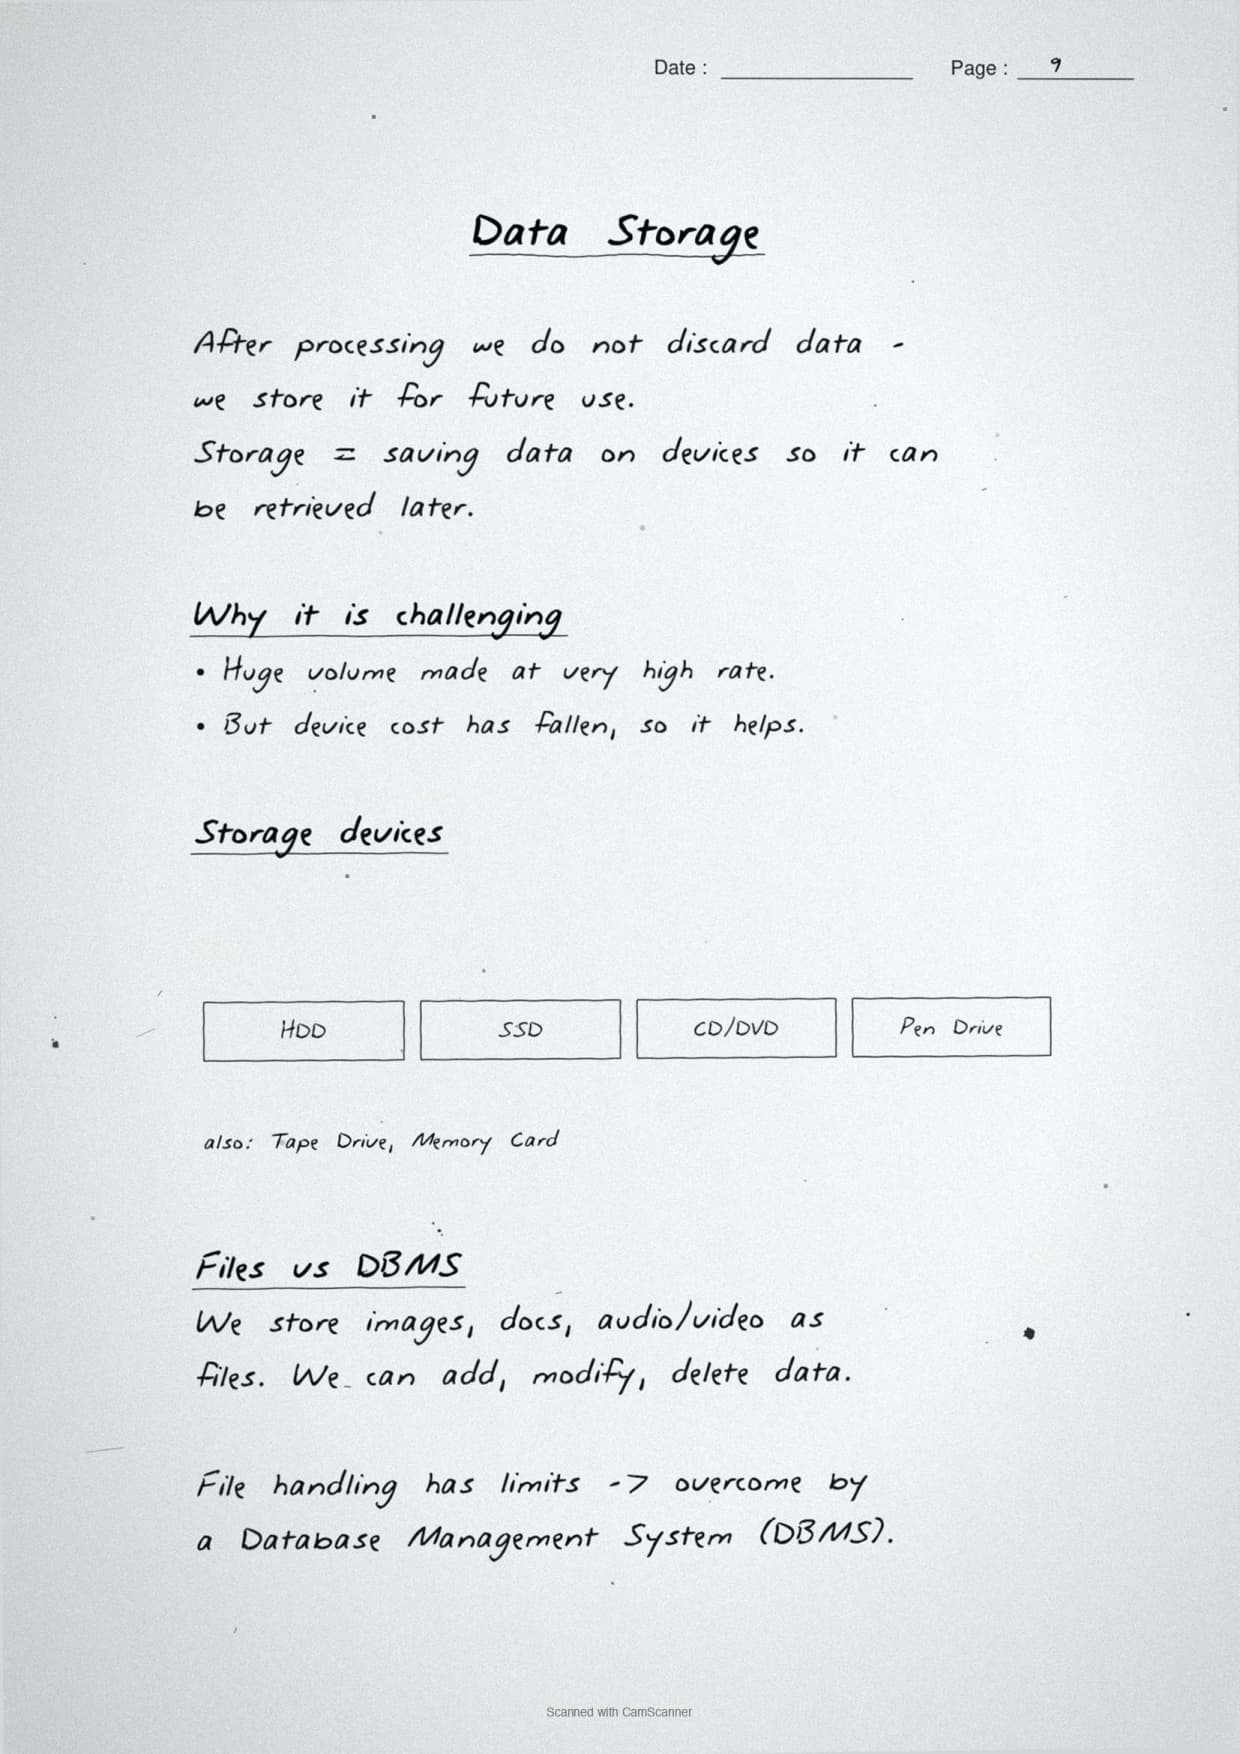
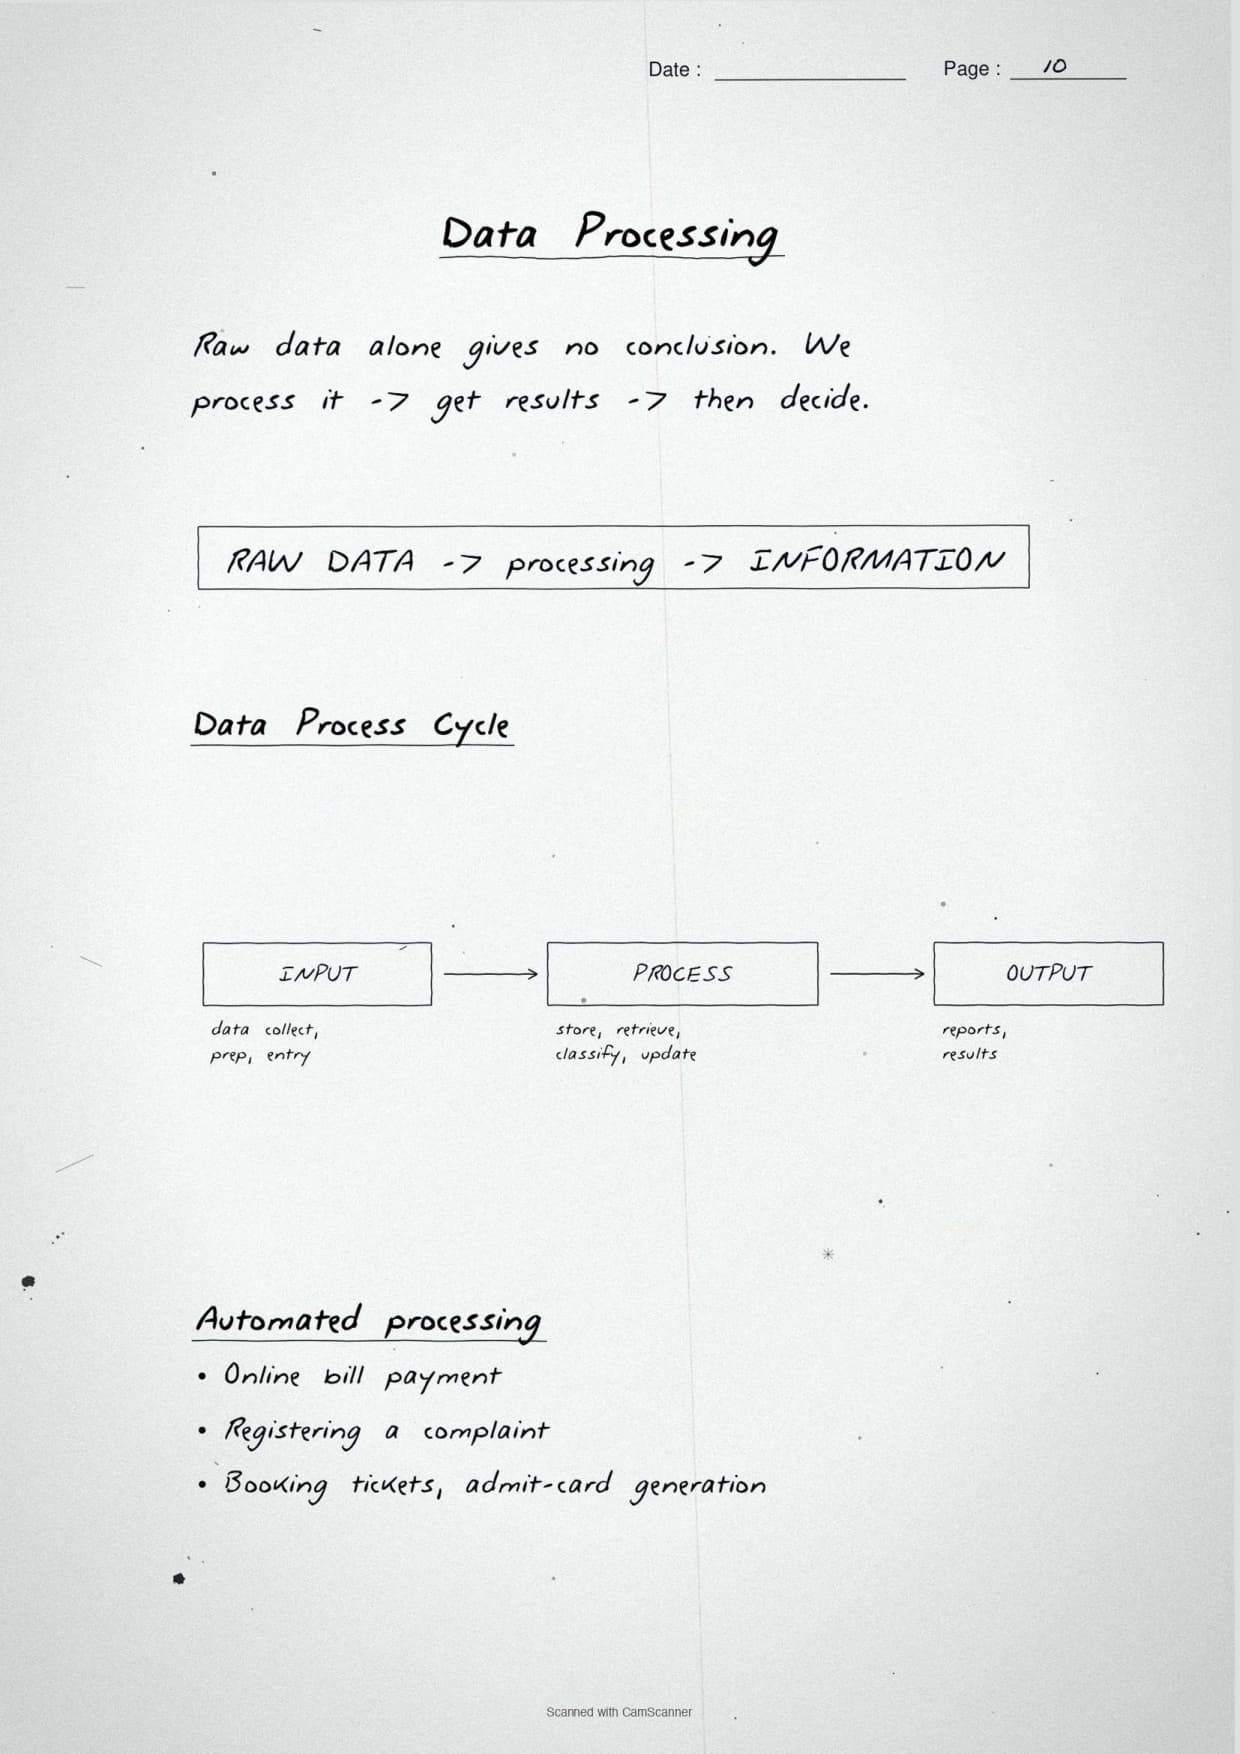
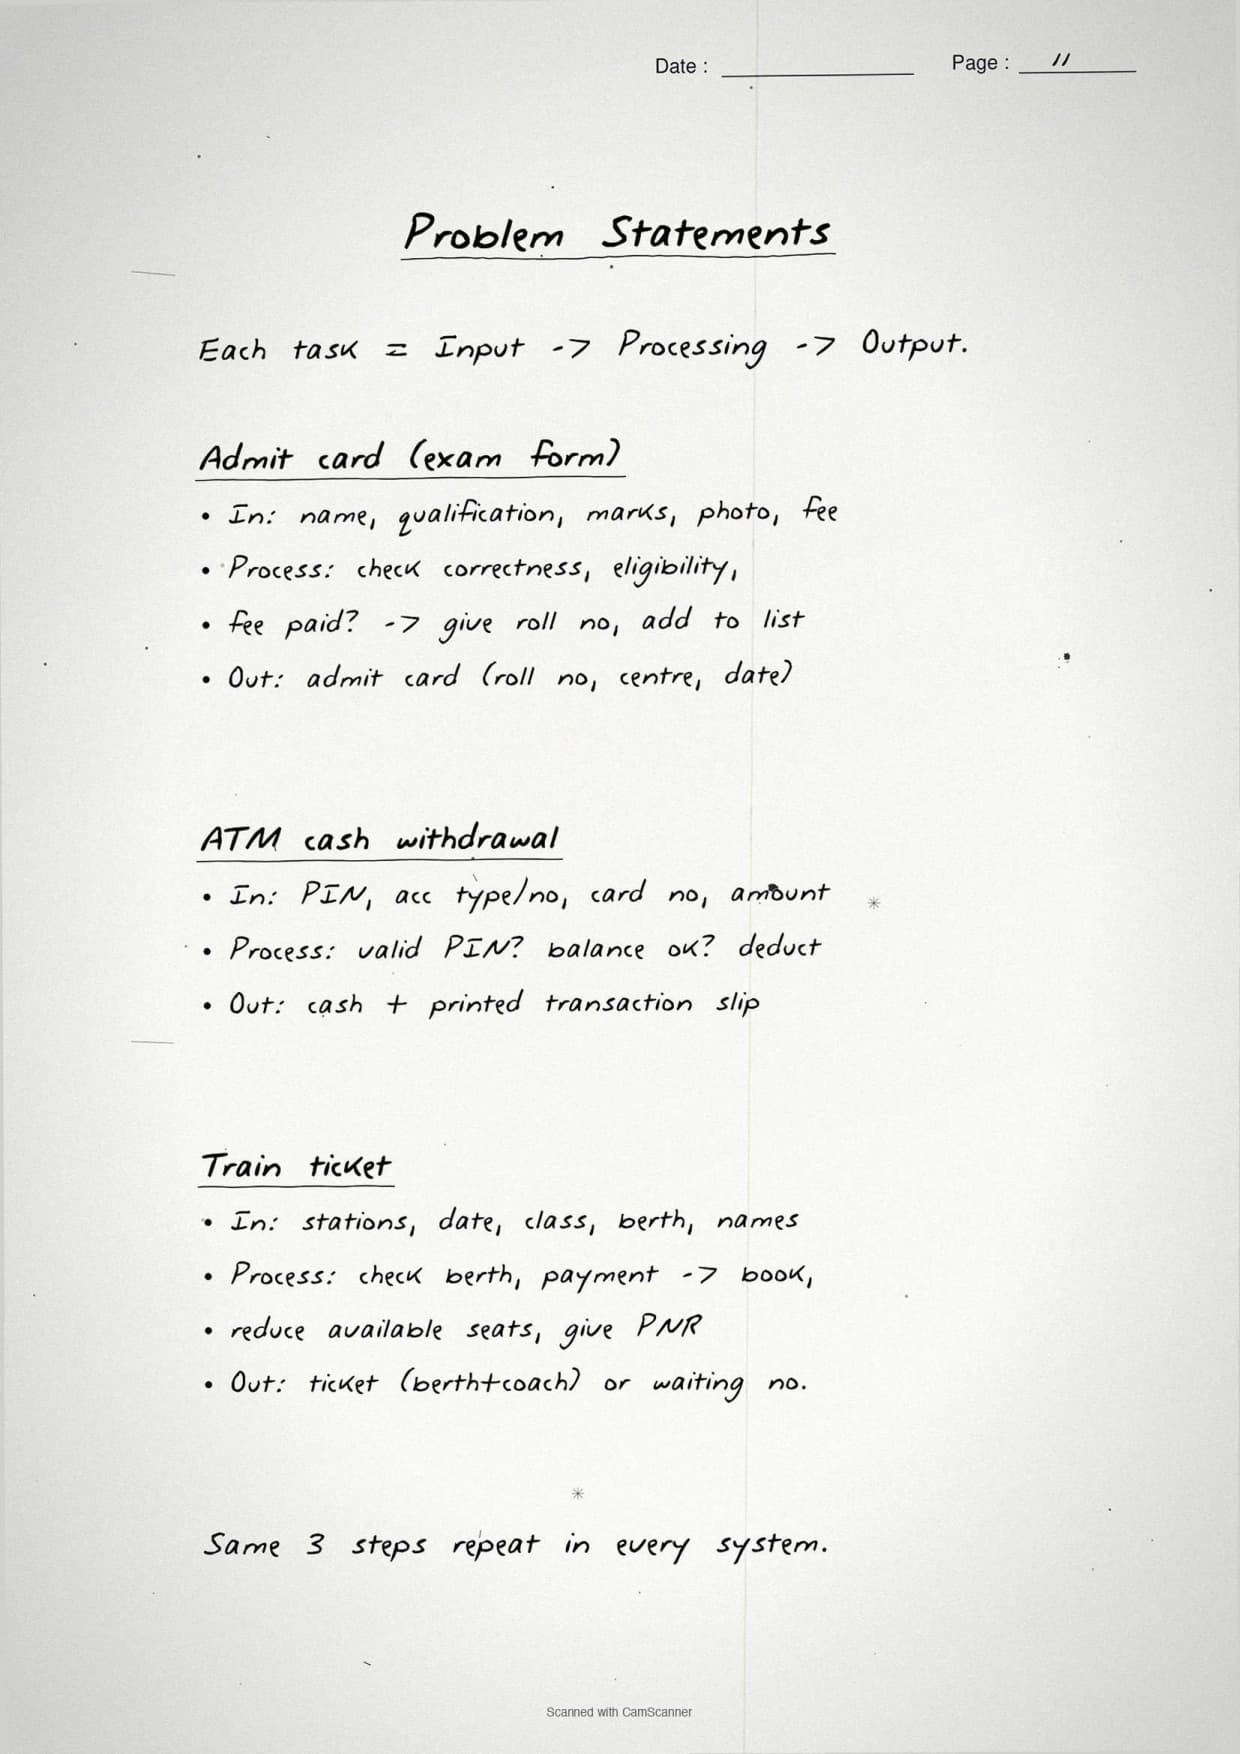
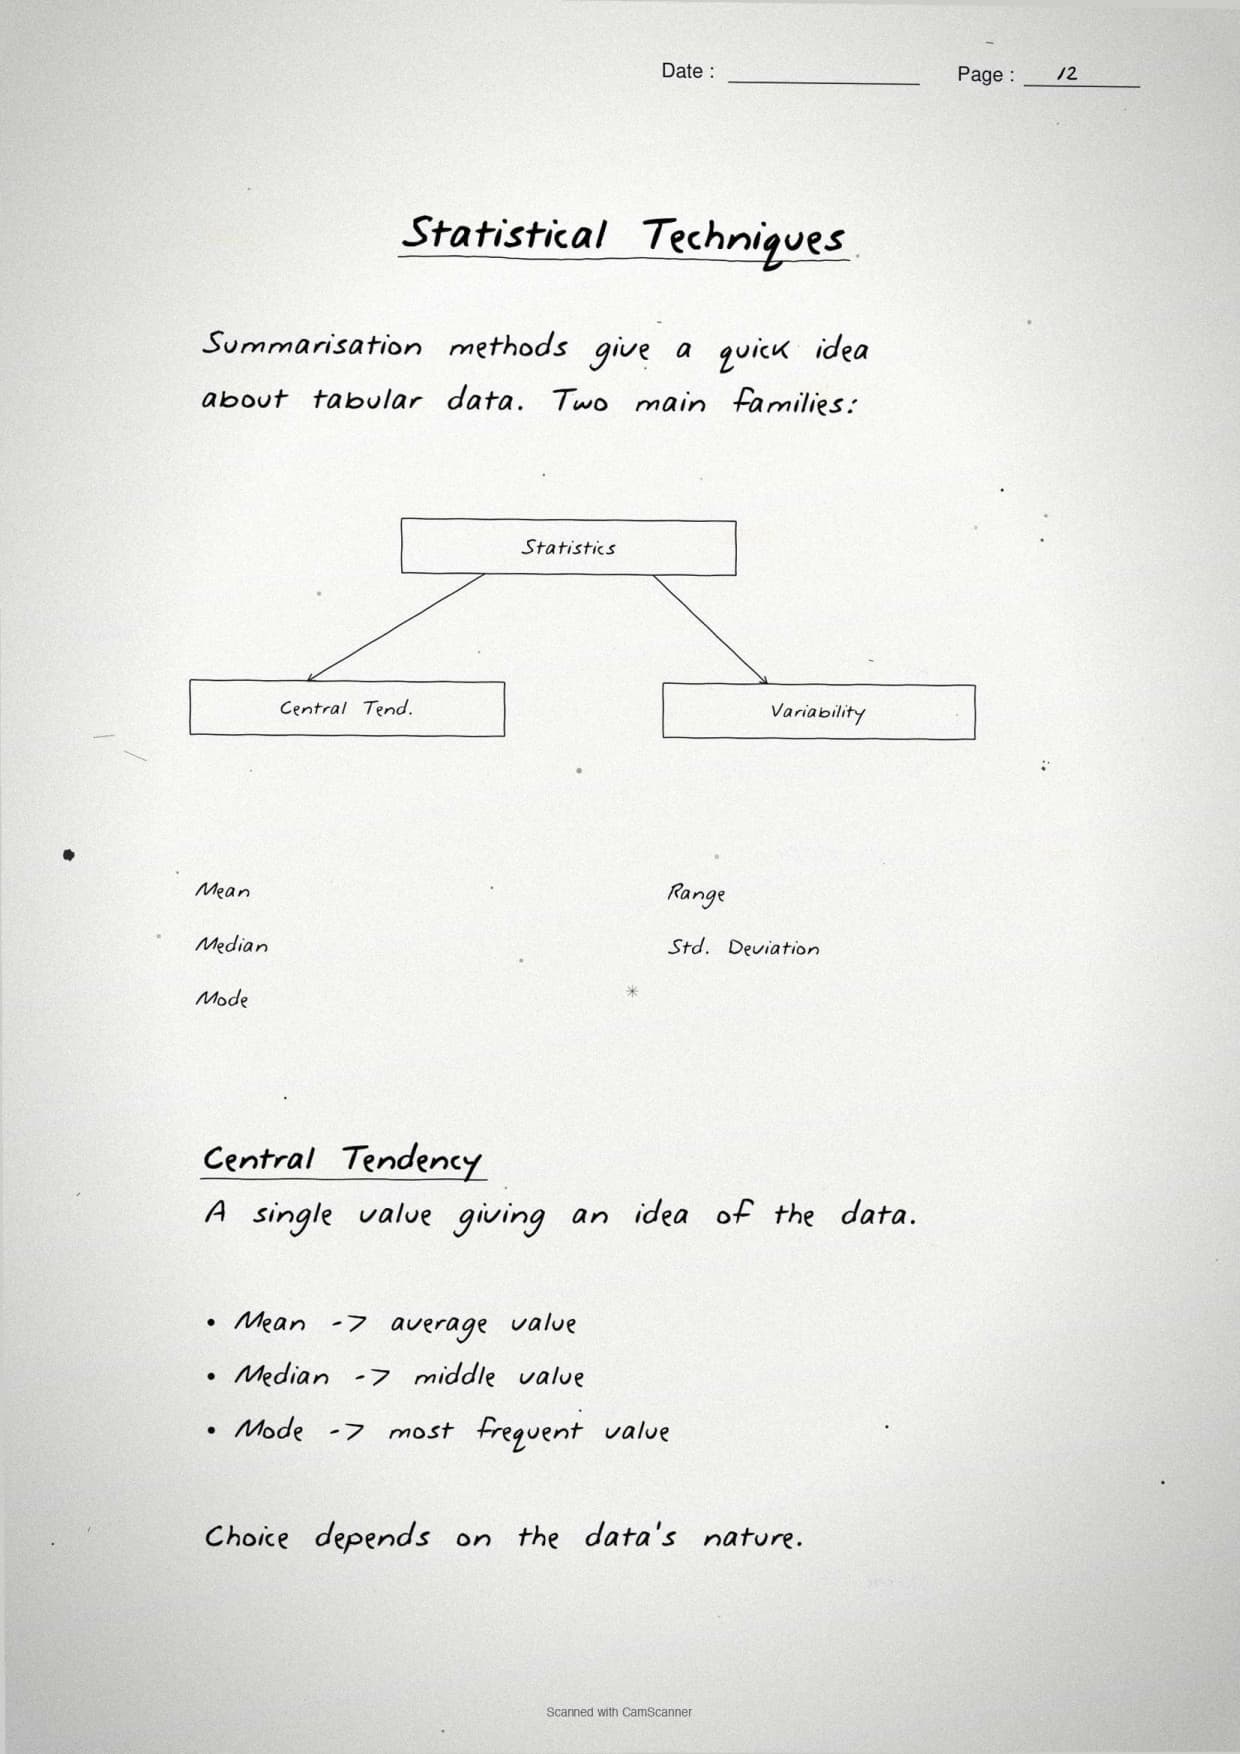
- 24 ruled pages of pen-style notes covering every Understanding Data topic the CBSE board paper tests, from data types to statistics.
- Hand-drawn boxes for the structured vs unstructured compare, the data processing cycle, and the five statistical measures.
- 2026-27 syllabus aligned, useful for CBSE boards, JEE programming rounds, and CUET Computer Science.
These handwritten notes are prepared by Computer Science subject experts, according to the 2026-27 NCERT textbook, and refined against the last five years of CBSE Class 12 Computer Science board papers.
Student Feedback: What 10,200 students told us about this chapter
68% of Class 12 students said they confuse structured and unstructured data in the 1-mark question. 3 out of 5 students told us they lose a mark by mixing up range and standard deviation when the question asks how spread out the data is.
Toppers reported that one quick look at a handwritten chart of mean, median, mode, range, and standard deviation before the exam fixed the formulas in memory, and the average student spent 2 to 3 hours revising this chapter from these notes.
Source: 2026-27 Class 12 Computer Science student poll. Sample of 10,200 students from CBSE schools across 14 states, conducted before the 2026 boards.
How These Class 12 Computer Science Chapter 7 Understanding Data Handwritten Notes Help You
Typed notes read like a textbook. Handwritten notes read like a friend's revision book, so the brain finds the page faster on exam day. These Understanding Data handwritten notes keep every data type, processing step, and statistical formula on ruled paper, so you can flip through the whole chapter in under 30 minutes the night before the exam.
- Pen-style headings make each sub-topic stand out, so finding a definition during last-week revision takes seconds.
- A boxed structured vs unstructured compare sits next to a short note on the "column test", removing the most common board-exam slip.
- The statistics page draws the mean, median, mode, range, and standard deviation formulas in one frame, so they are easy to picture.
- Small margin tips match how toppers compress this theory chapter for revision.
Source: Magnet Brains on YouTube
Topics Covered in the Understanding Data Handwritten Notes
The 24-page handwritten PDF walks through the chapter in the same order as the NCERT book, so it sits next to your textbook without confusion. The table below maps each topic to the page idea you will see in the notes and the typical mark weight in the CBSE board paper.
| Topic | What the handwritten page shows | Typical marks |
|---|---|---|
| Structured vs unstructured data | Two-column compare box with the "fits in a table?" column test | 1 to 2 marks |
| Data processing cycle | Input to process to output to storage drawn as a loop | 2 to 3 marks |
| Primary vs secondary data | Compare box plus the survey, interview, and observation methods | 2 to 3 marks |
| Mean, median, mode | One worked example using the same data set for all three | 2 to 3 marks |
| Range and standard deviation | Spread measures with the standard deviation formula boxed | 2 to 3 marks |
| Statistics module in Python | mean(), median(), mode(), stdev() with a sample run | 2 to 3 marks |
Each page is written by hand in blue ballpoint ink on horizontally ruled paper with a faded red margin, just like a topper's own revision notebook.
Structured vs Unstructured Data in the Handwritten Notes
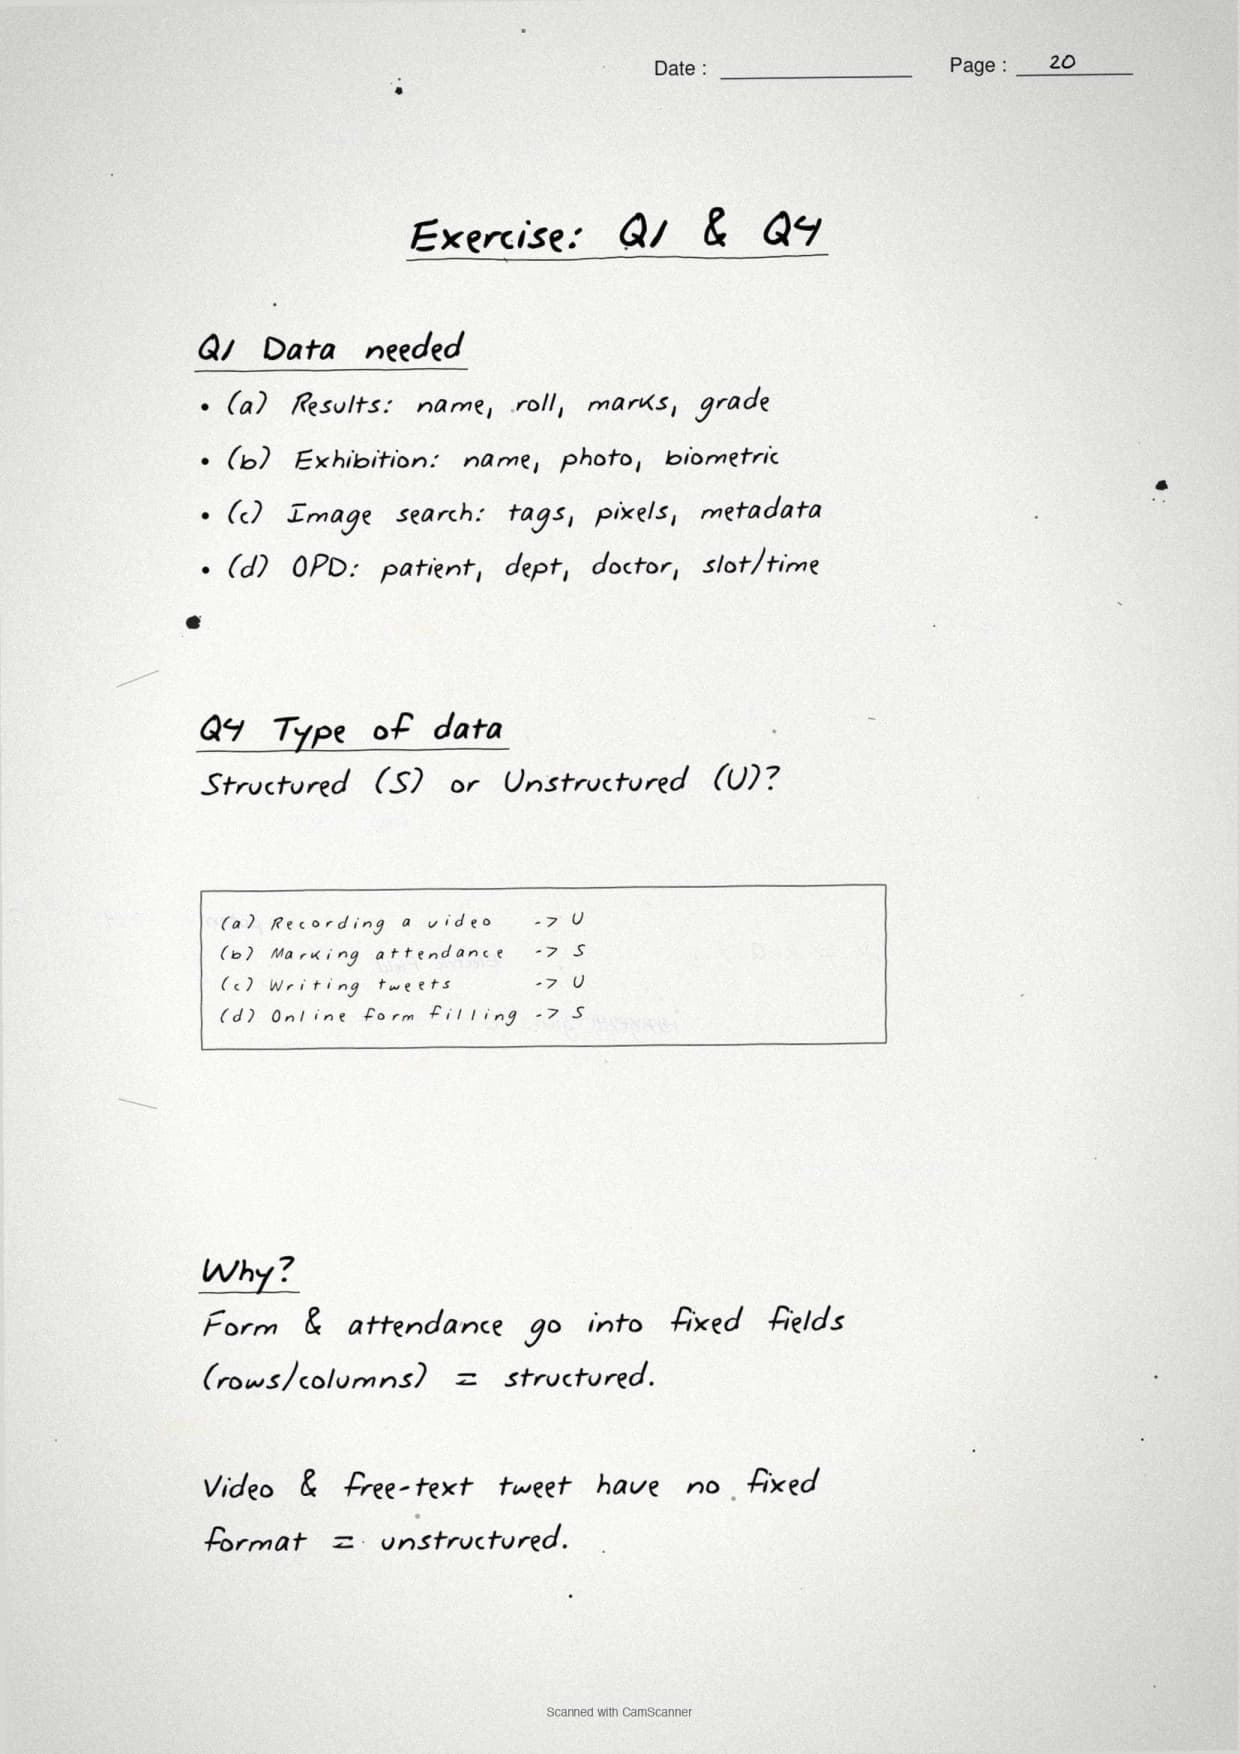
The first content page draws a clean two-column box that compares structured data and unstructured data, because this difference is a near-certain 1-mark or 2-mark question. Structured data fits neatly into rows and columns with a fixed format, while unstructured data has no fixed shape and cannot be stored in a simple table.
- Structured data: stored in tables with rows and columns; easy to search and sort; examples are marks sheets, bank records, and timetables.
- Unstructured data: no fixed format; hard to store in a table; examples are images, audio, video, emails, and tweets.
- Semi-structured data: has some tags or markers but no strict table form; examples are XML files and JSON data.
- The column test: ask "can this fit into a fixed set of columns?". If yes, it is structured; if no, it is unstructured.
The Data Processing Cycle: Input, Process, Output and Storage
The next page draws the data processing cycle as a loop, because the steps appear in many board questions that ask how raw data becomes useful information. Data on its own has no meaning; processing turns it into information that can answer a question or support a decision.
- Input (data collection): raw data is gathered from forms, sensors, surveys, or files.
- Process: the data is cleaned, sorted, grouped, and analysed, often with statistical techniques.
- Output: the result is shown as a report, table, chart, or list of beneficiaries.
- Storage: both the raw data and the result are saved so they can be reused later.
The notes mark the cycle as repeating, because the output of one round often becomes the input of the next. This loop is the answer pattern examiners want when a question asks you to "describe the data processing steps" for a school, a bank, or a hospital scenario.
Data Collection: Primary, Secondary and the Observation Method
This page lines up the two sources of data so the difference between them is impossible to forget. The trap is that students name only one source in the exam, while the board answer usually wants the source plus the method used to collect it.
Primary vs secondary data
- Primary data: collected first-hand for the current purpose; fresh, reliable, but slower and costlier; examples are a class survey or a sensor reading.
- Secondary data: already collected by someone else; faster and cheaper, but may be old or not exactly fit; examples are census reports and published records.
Common methods of collecting primary data
- Survey or questionnaire: a set of questions answered by many people; good for opinions and large groups.
- Interview: direct questions asked one-on-one; good for detailed answers from a few people.
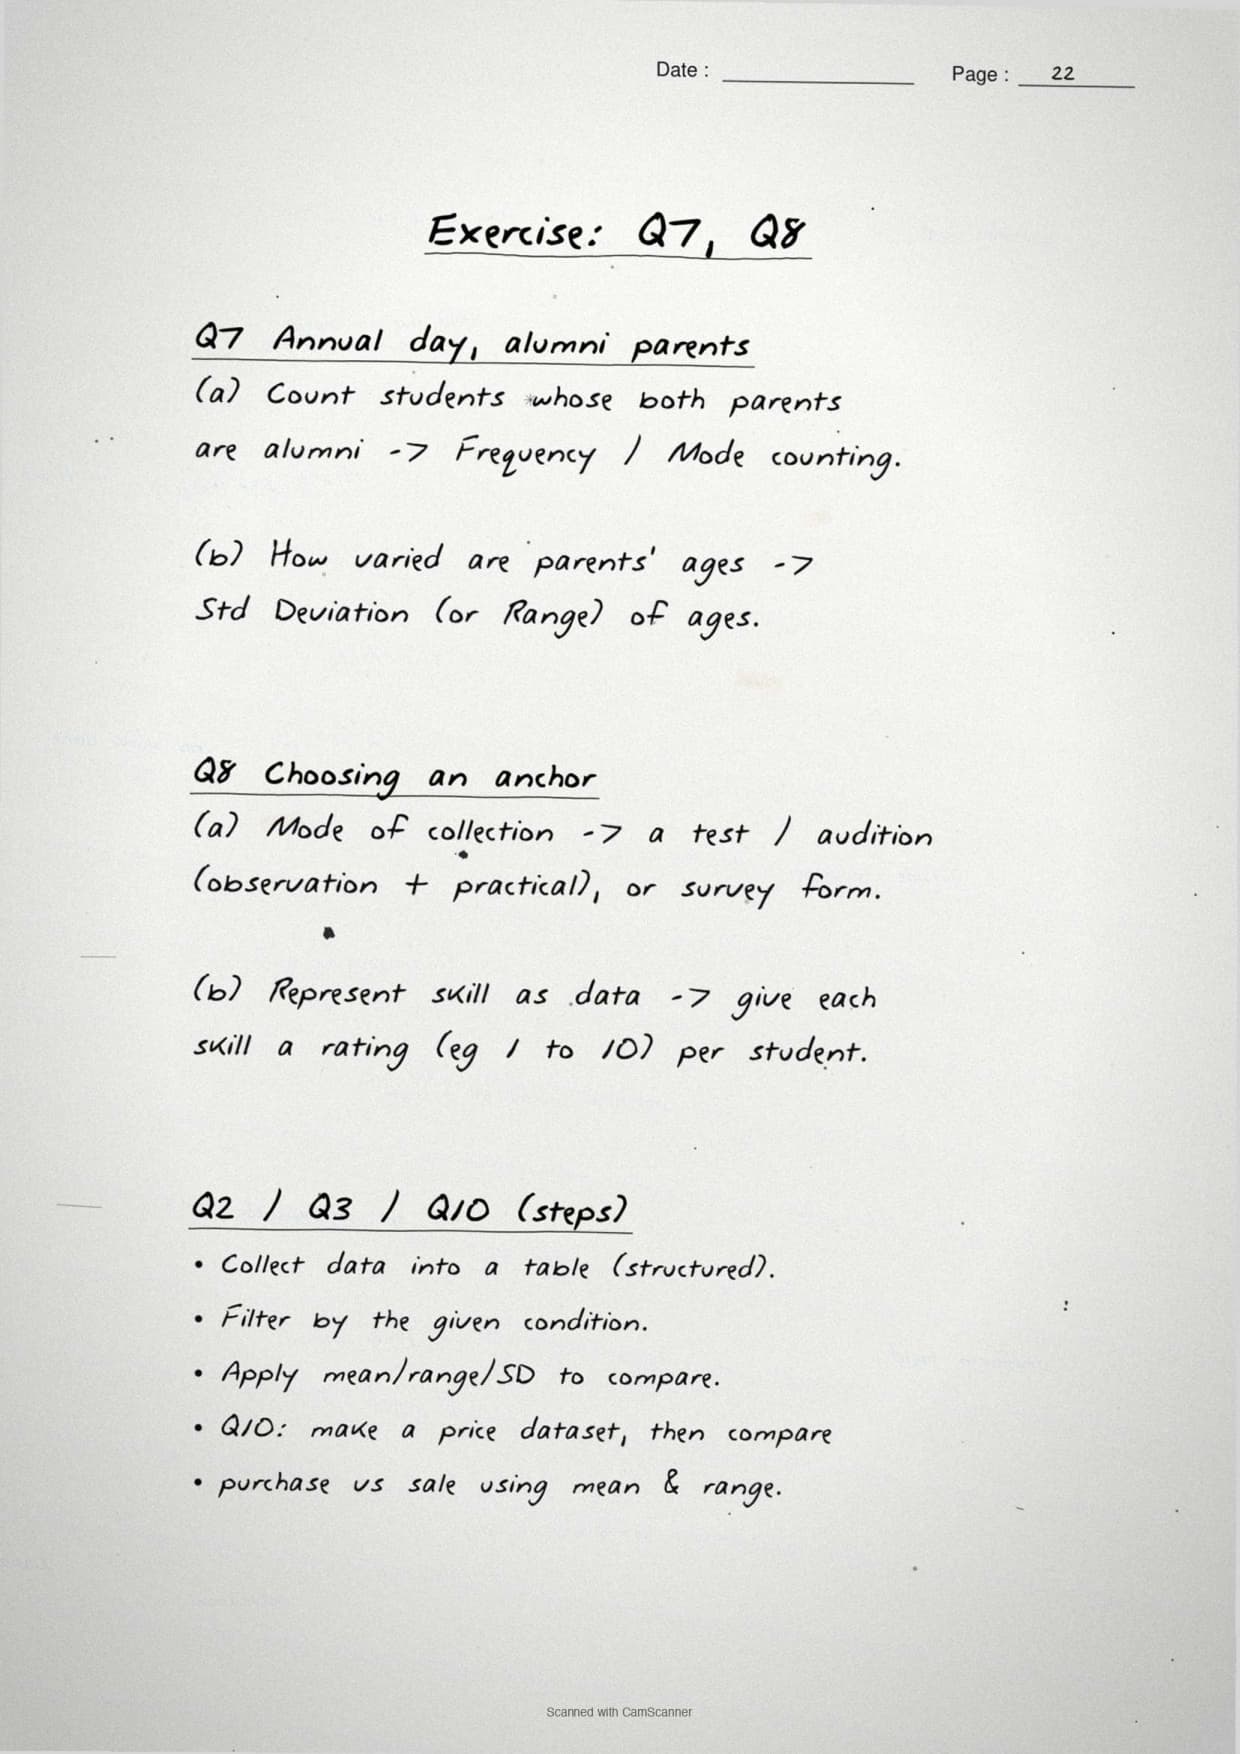
- Observation: watching and recording behaviour or events without asking; good for skills that cannot be self-reported, such as singing or monitoring skill.
Statistical Techniques: Mean, Median, Mode, Range and Standard Deviation
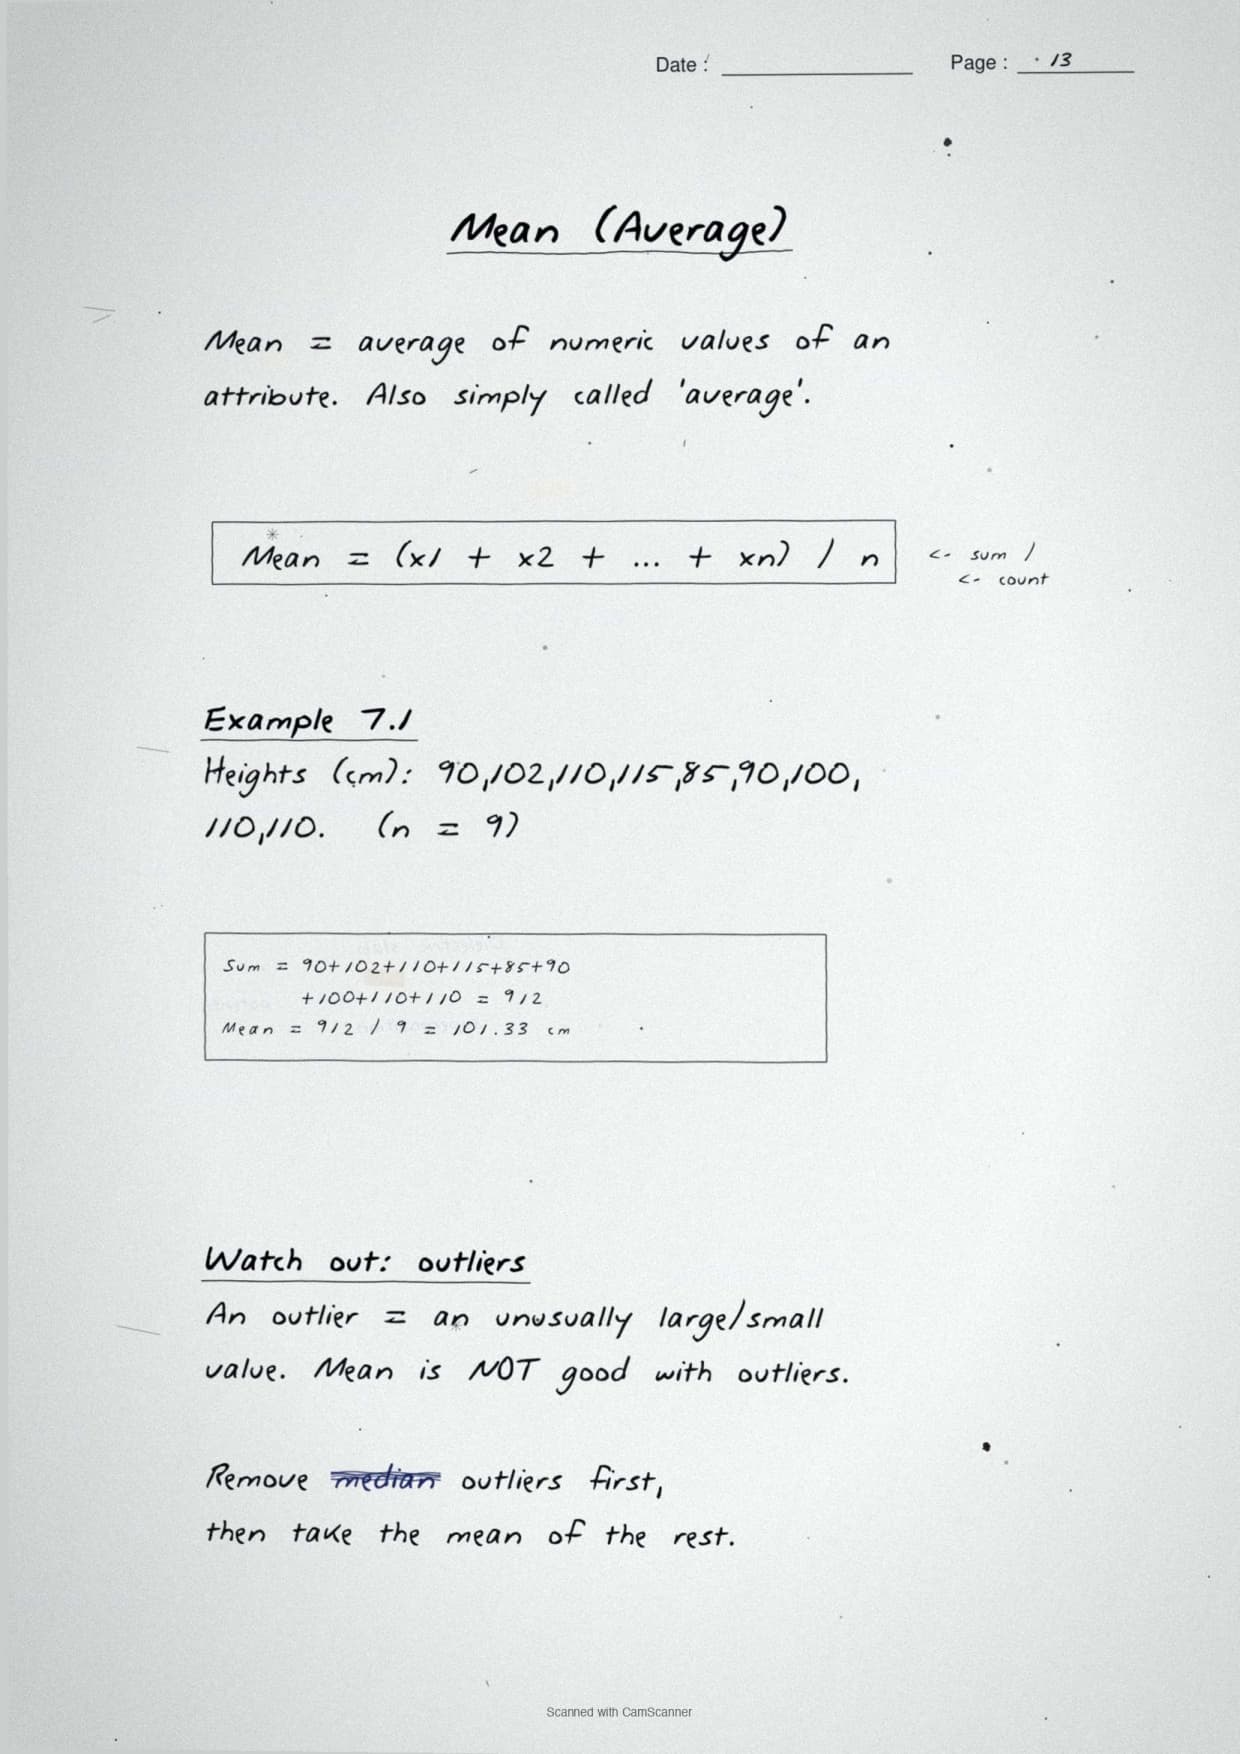
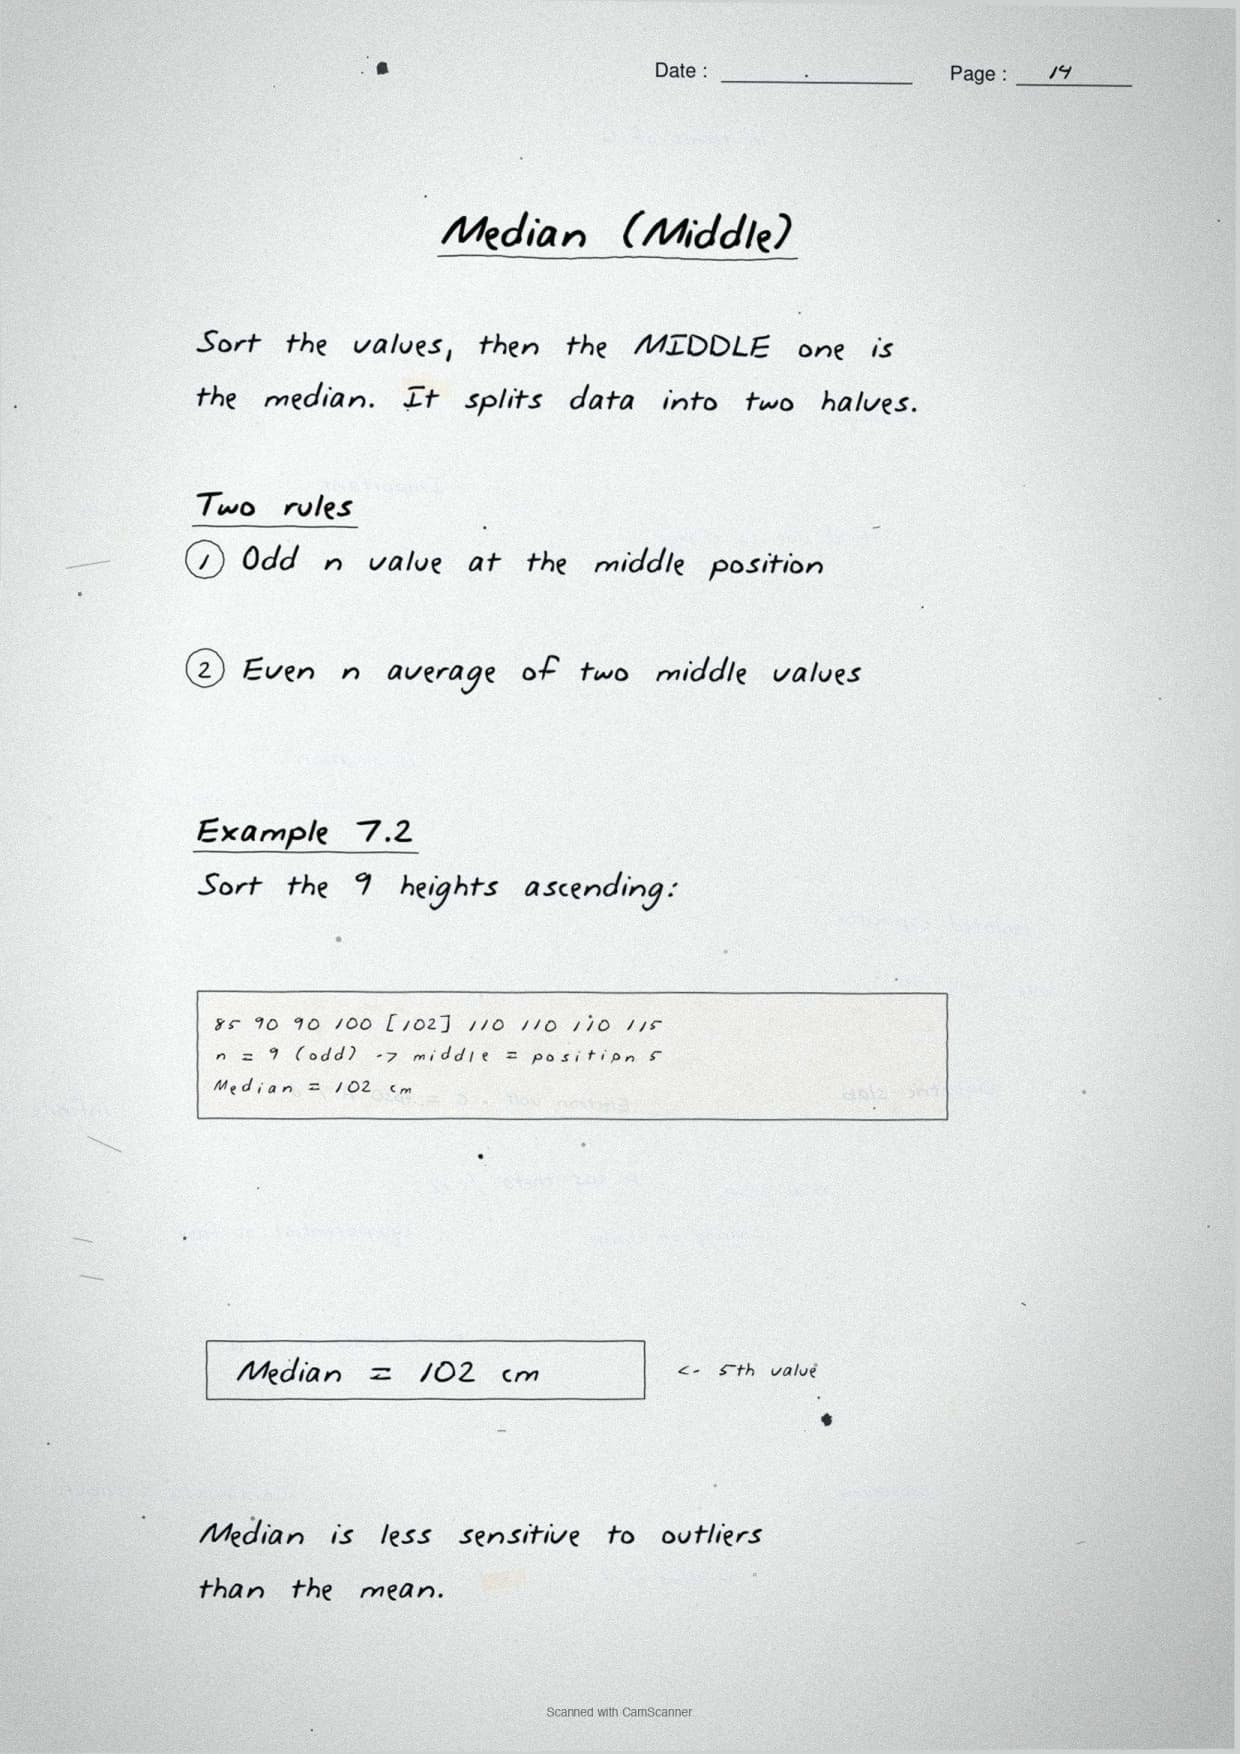
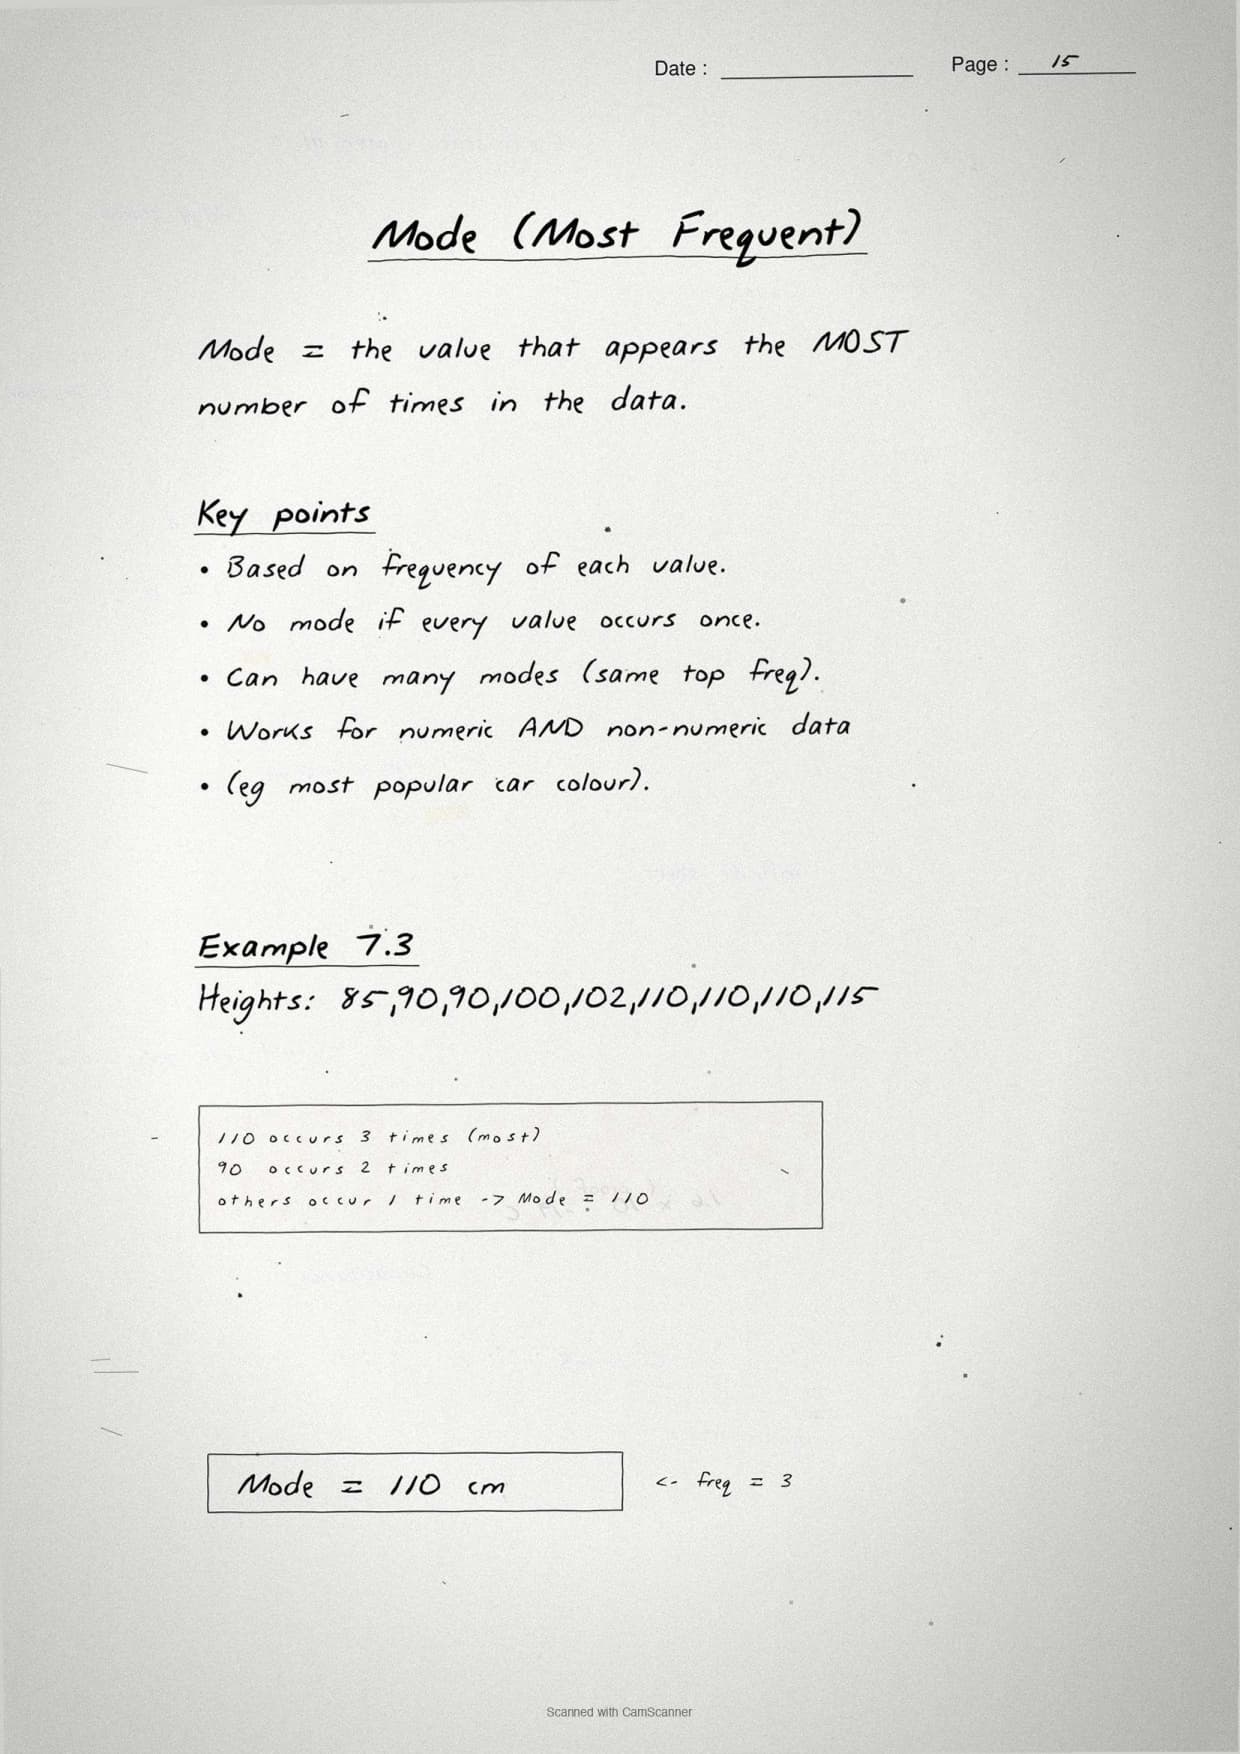
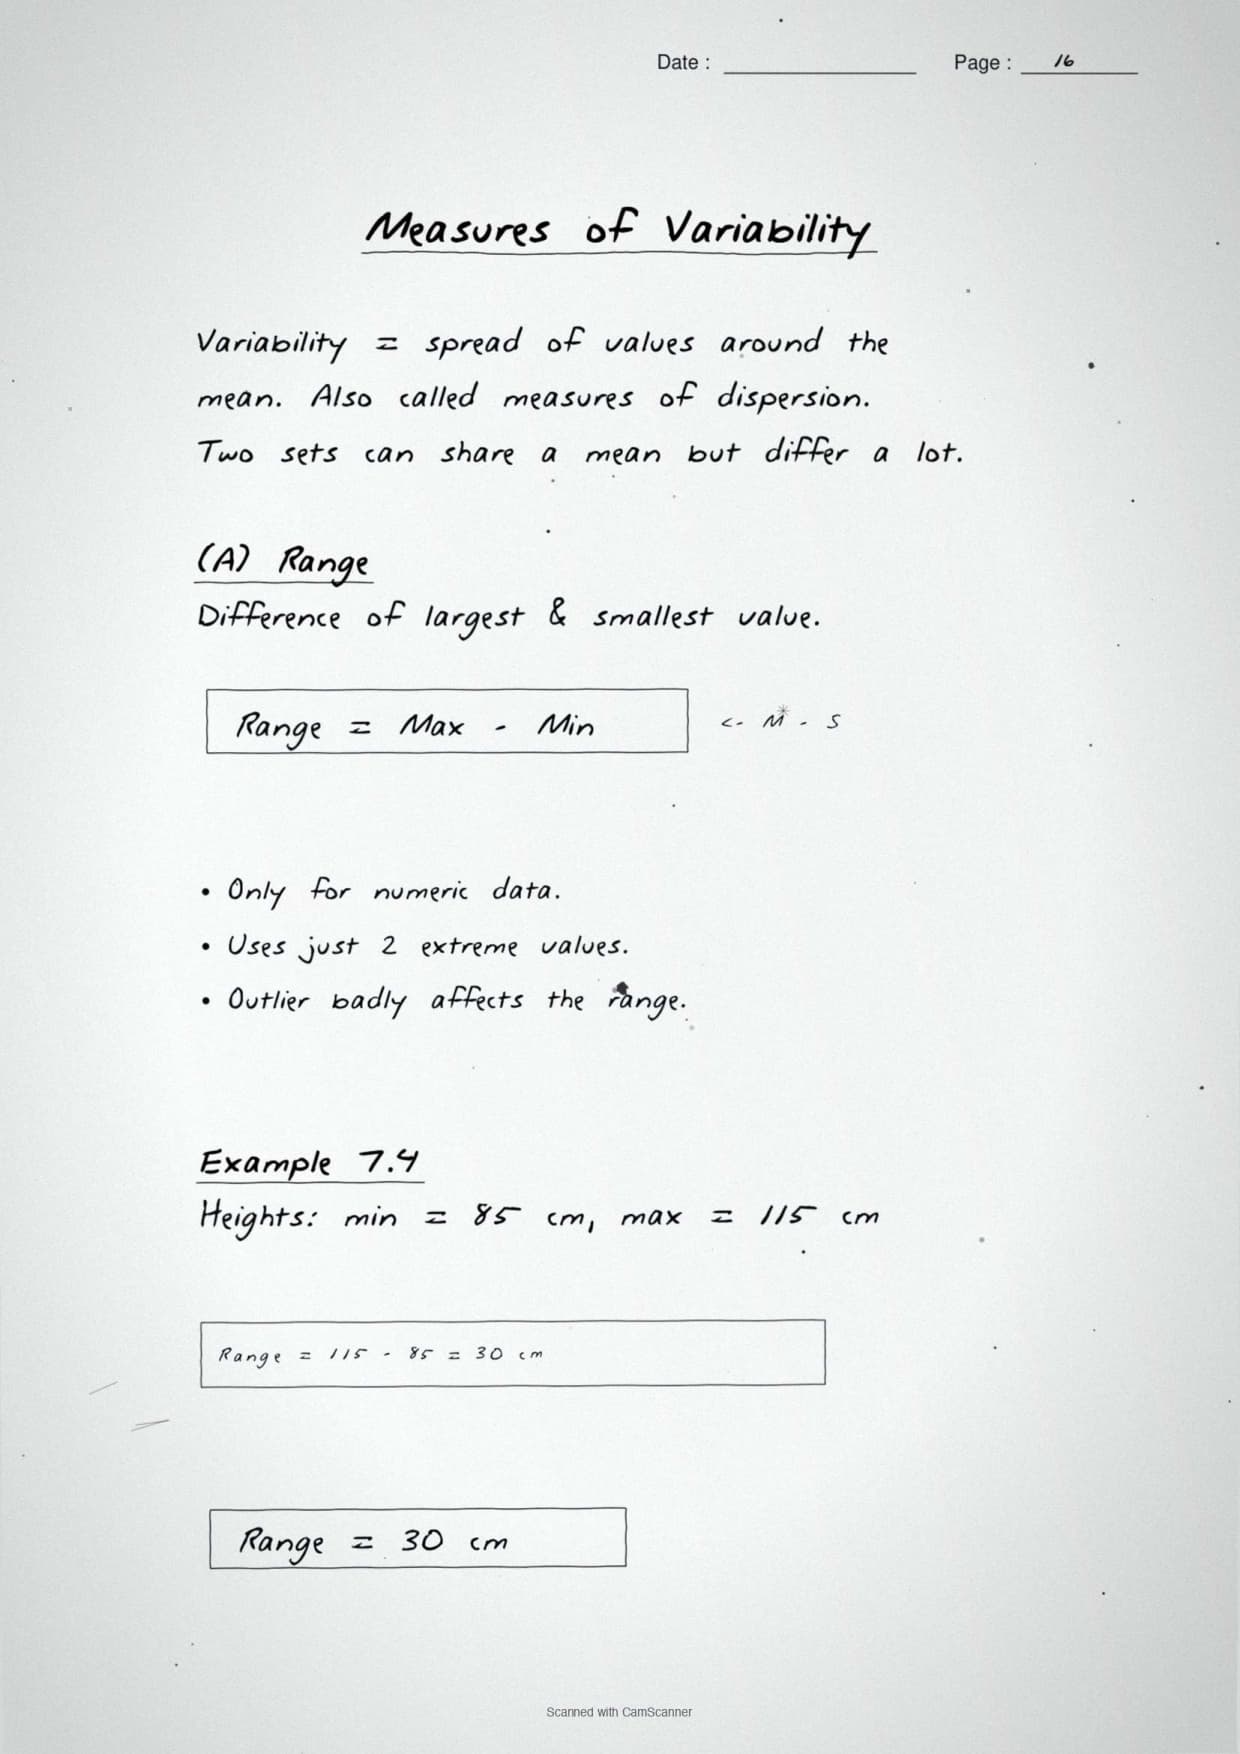
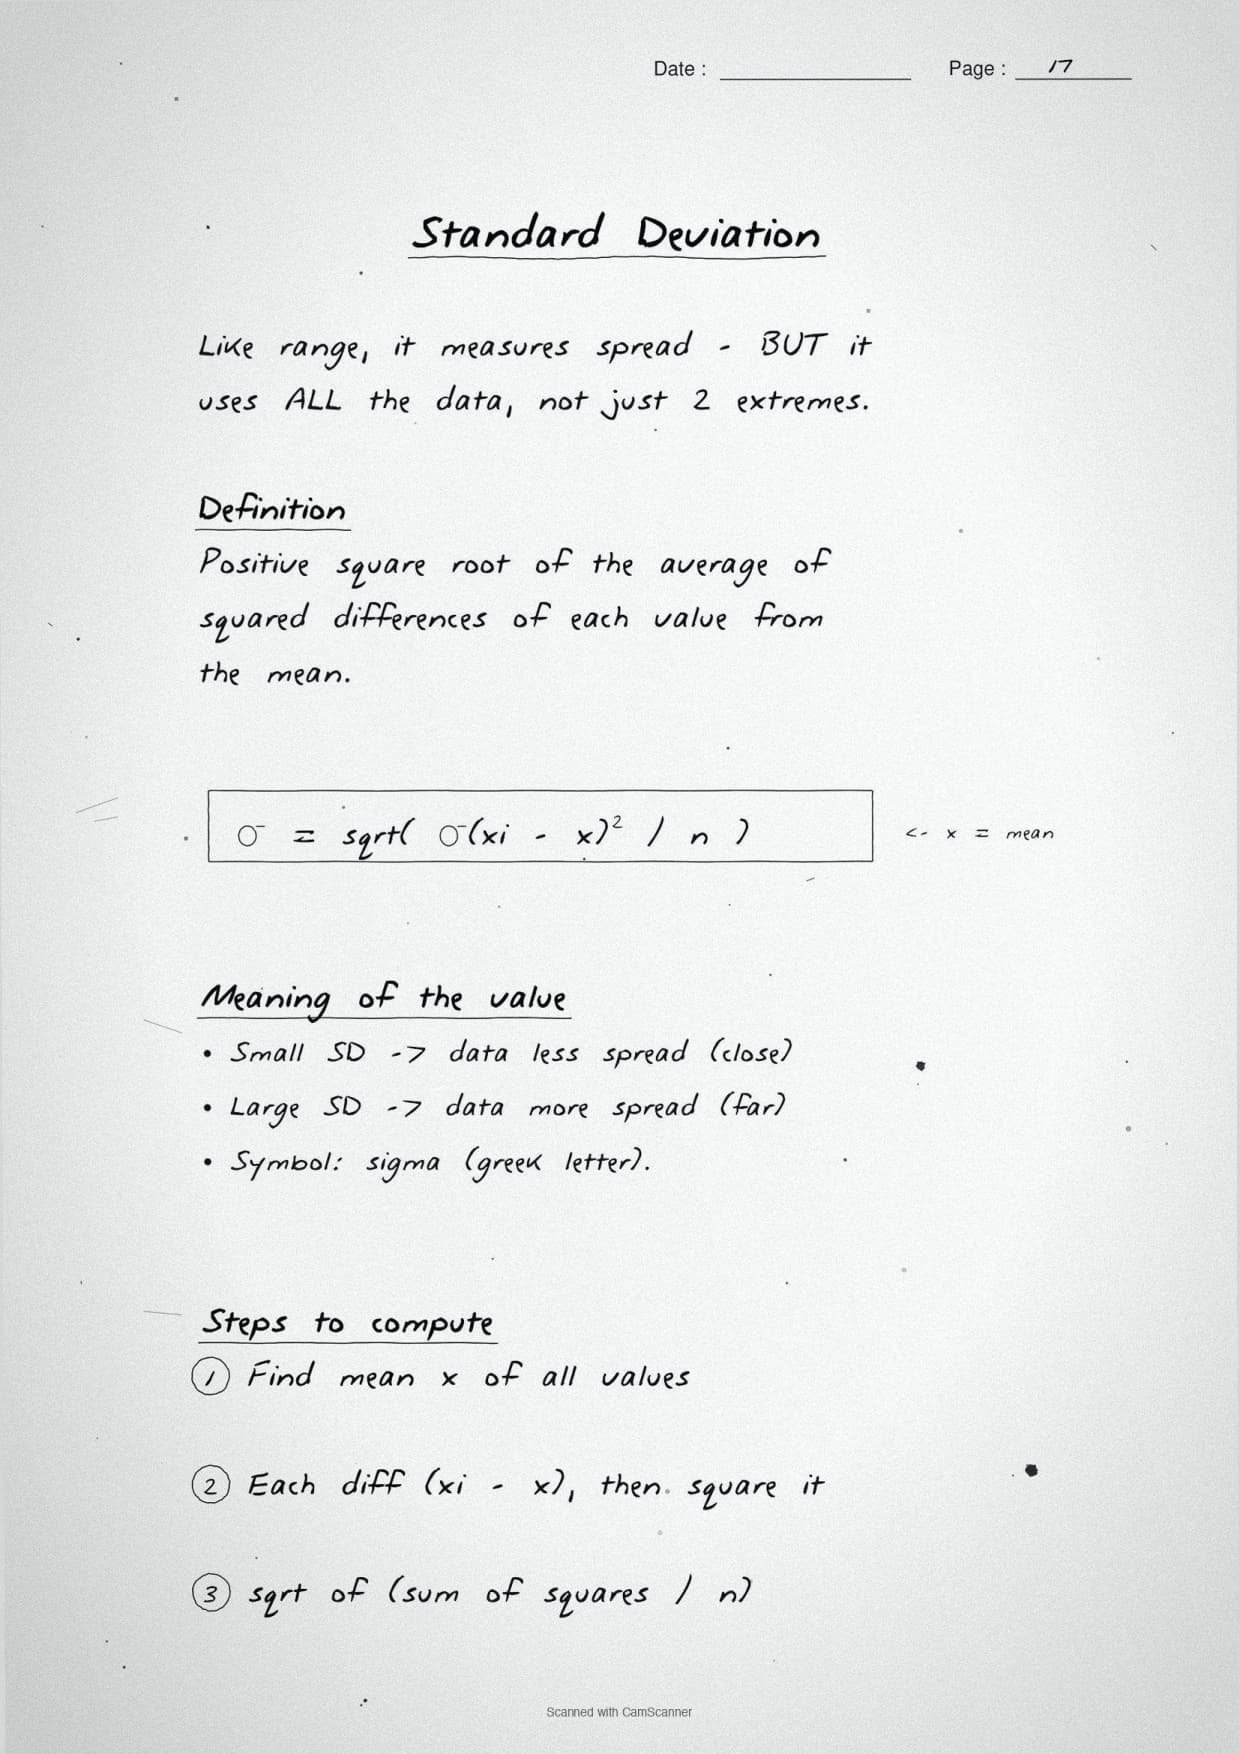
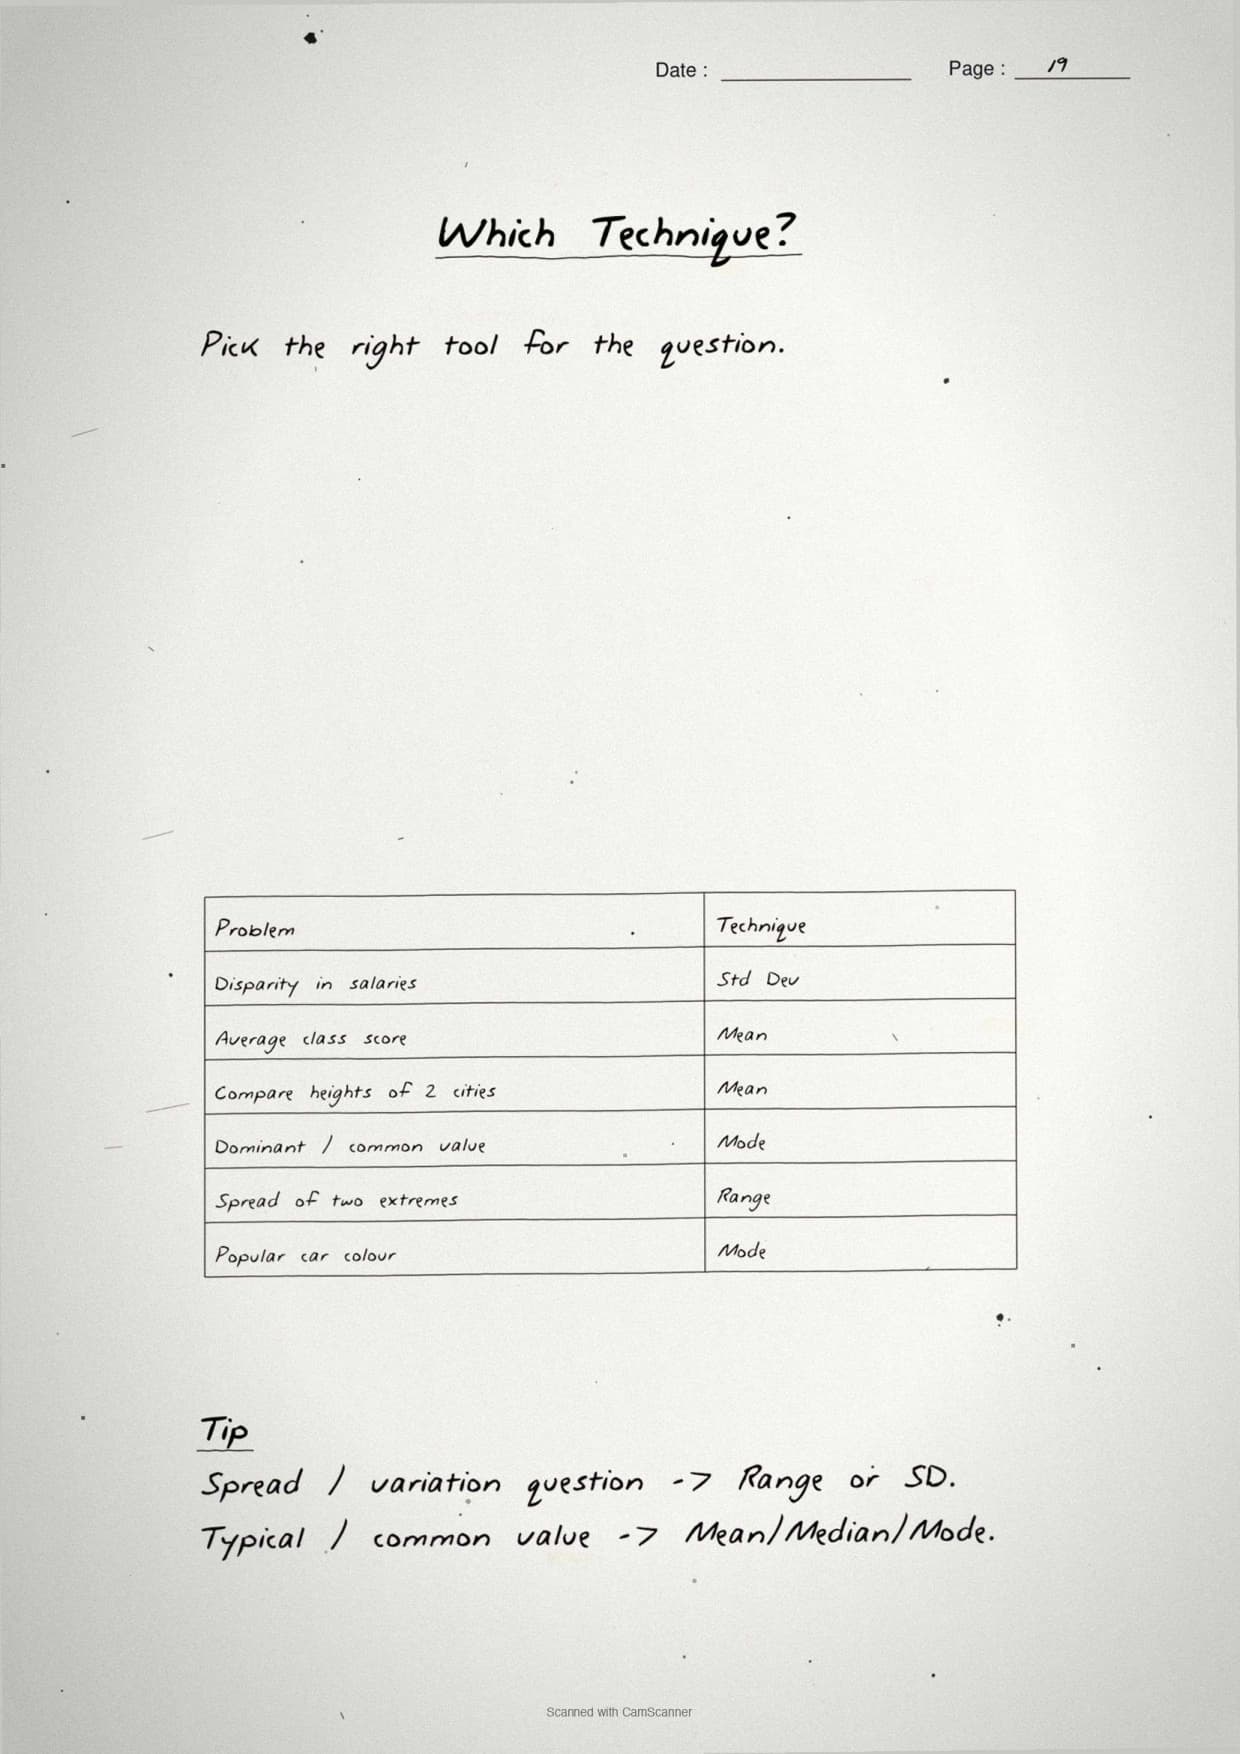
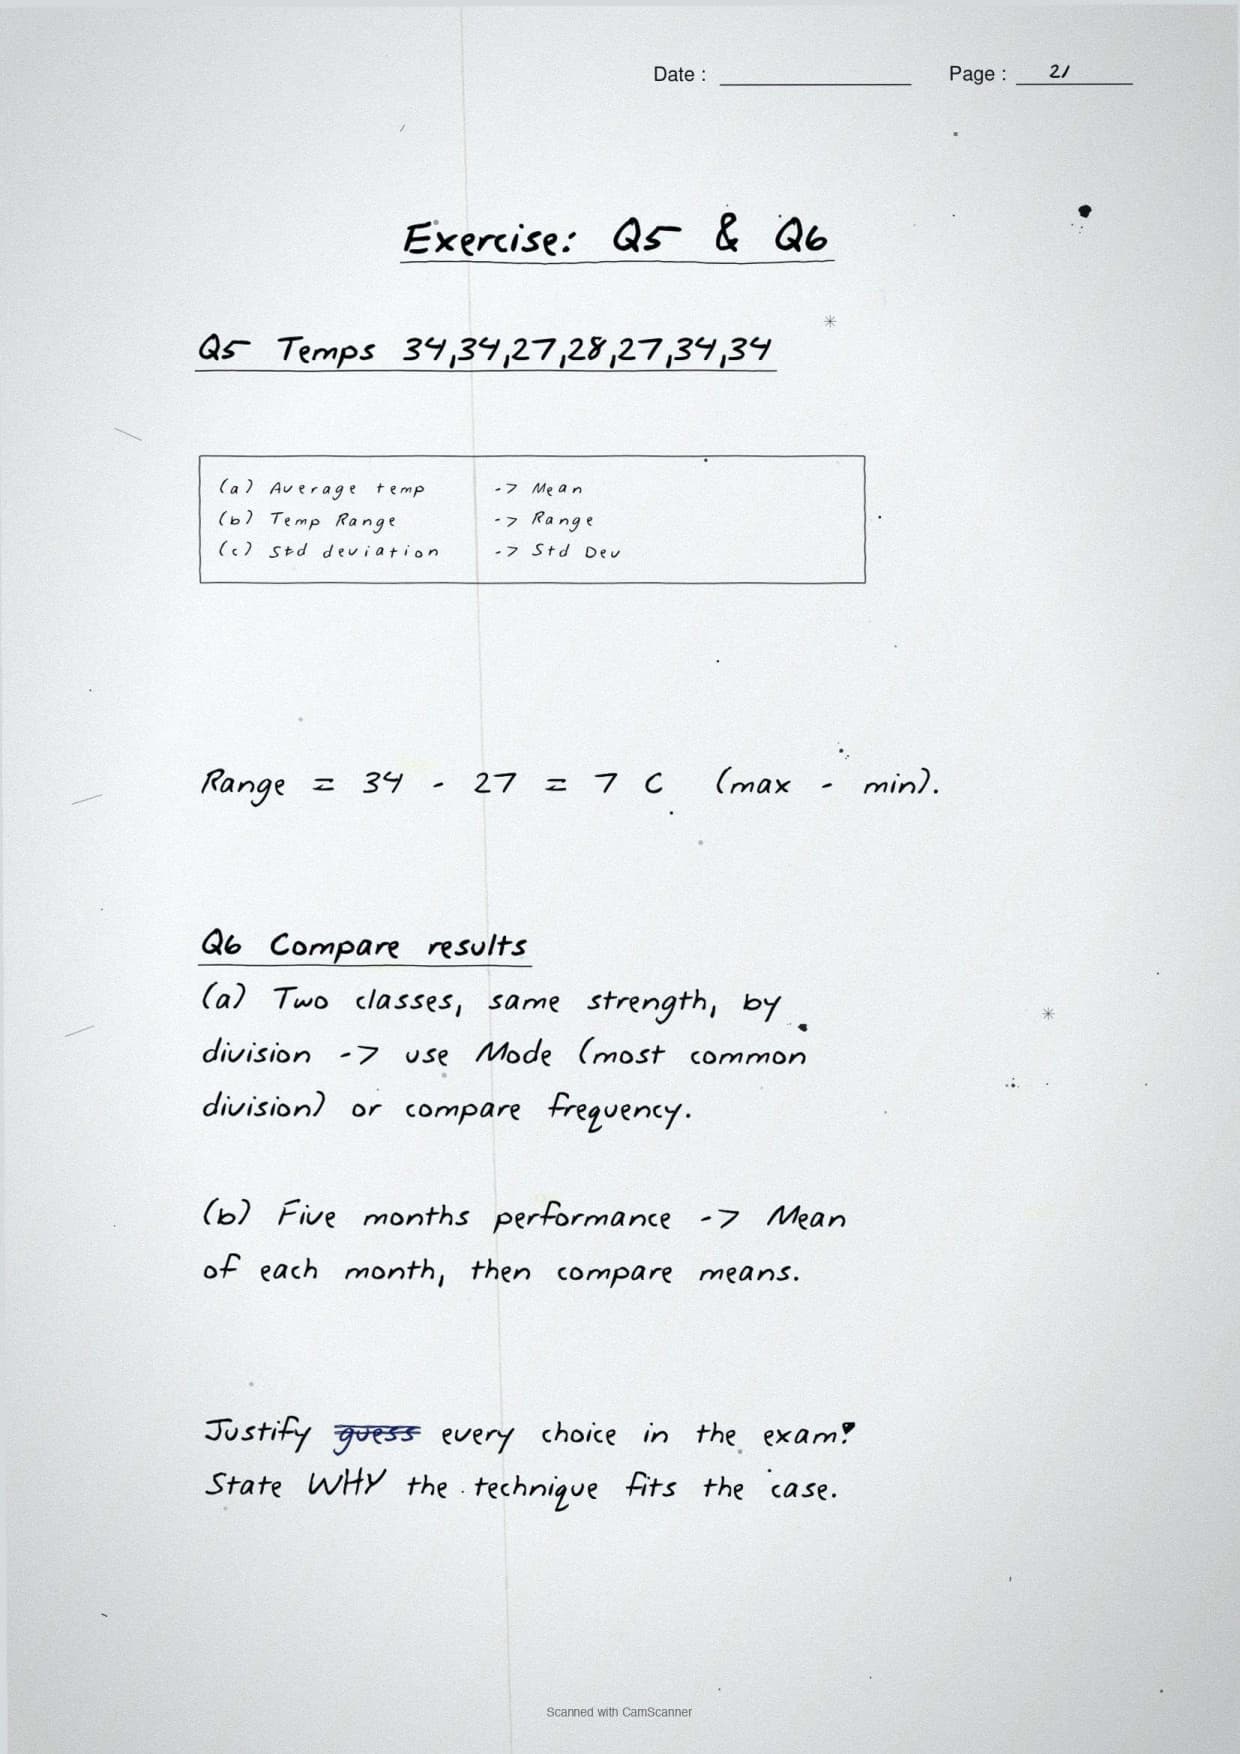
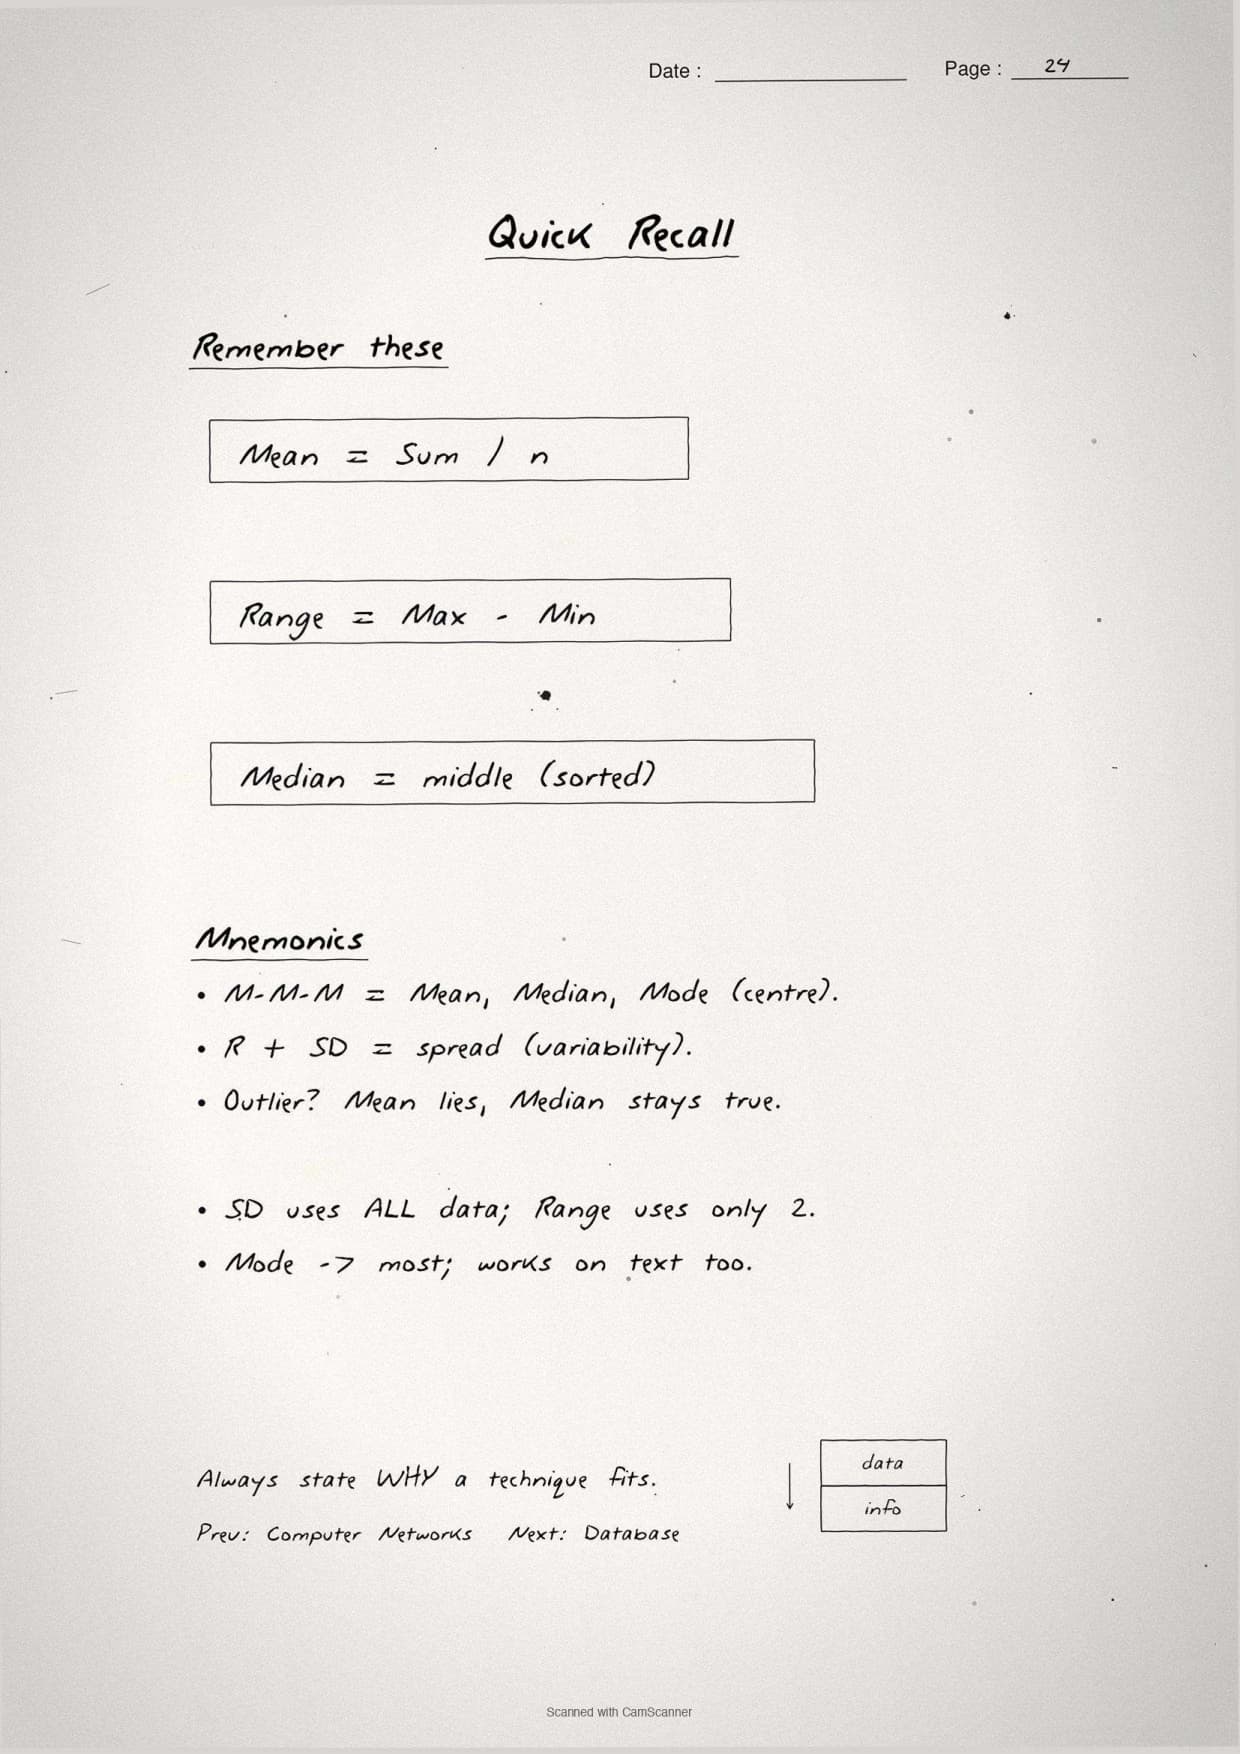
The statistics page is where the heavier marks live, so the notes box every formula and work one example through all of them. These five measures split into two groups: measures of central tendency that find a typical value, and measures of spread that show how varied the data is.
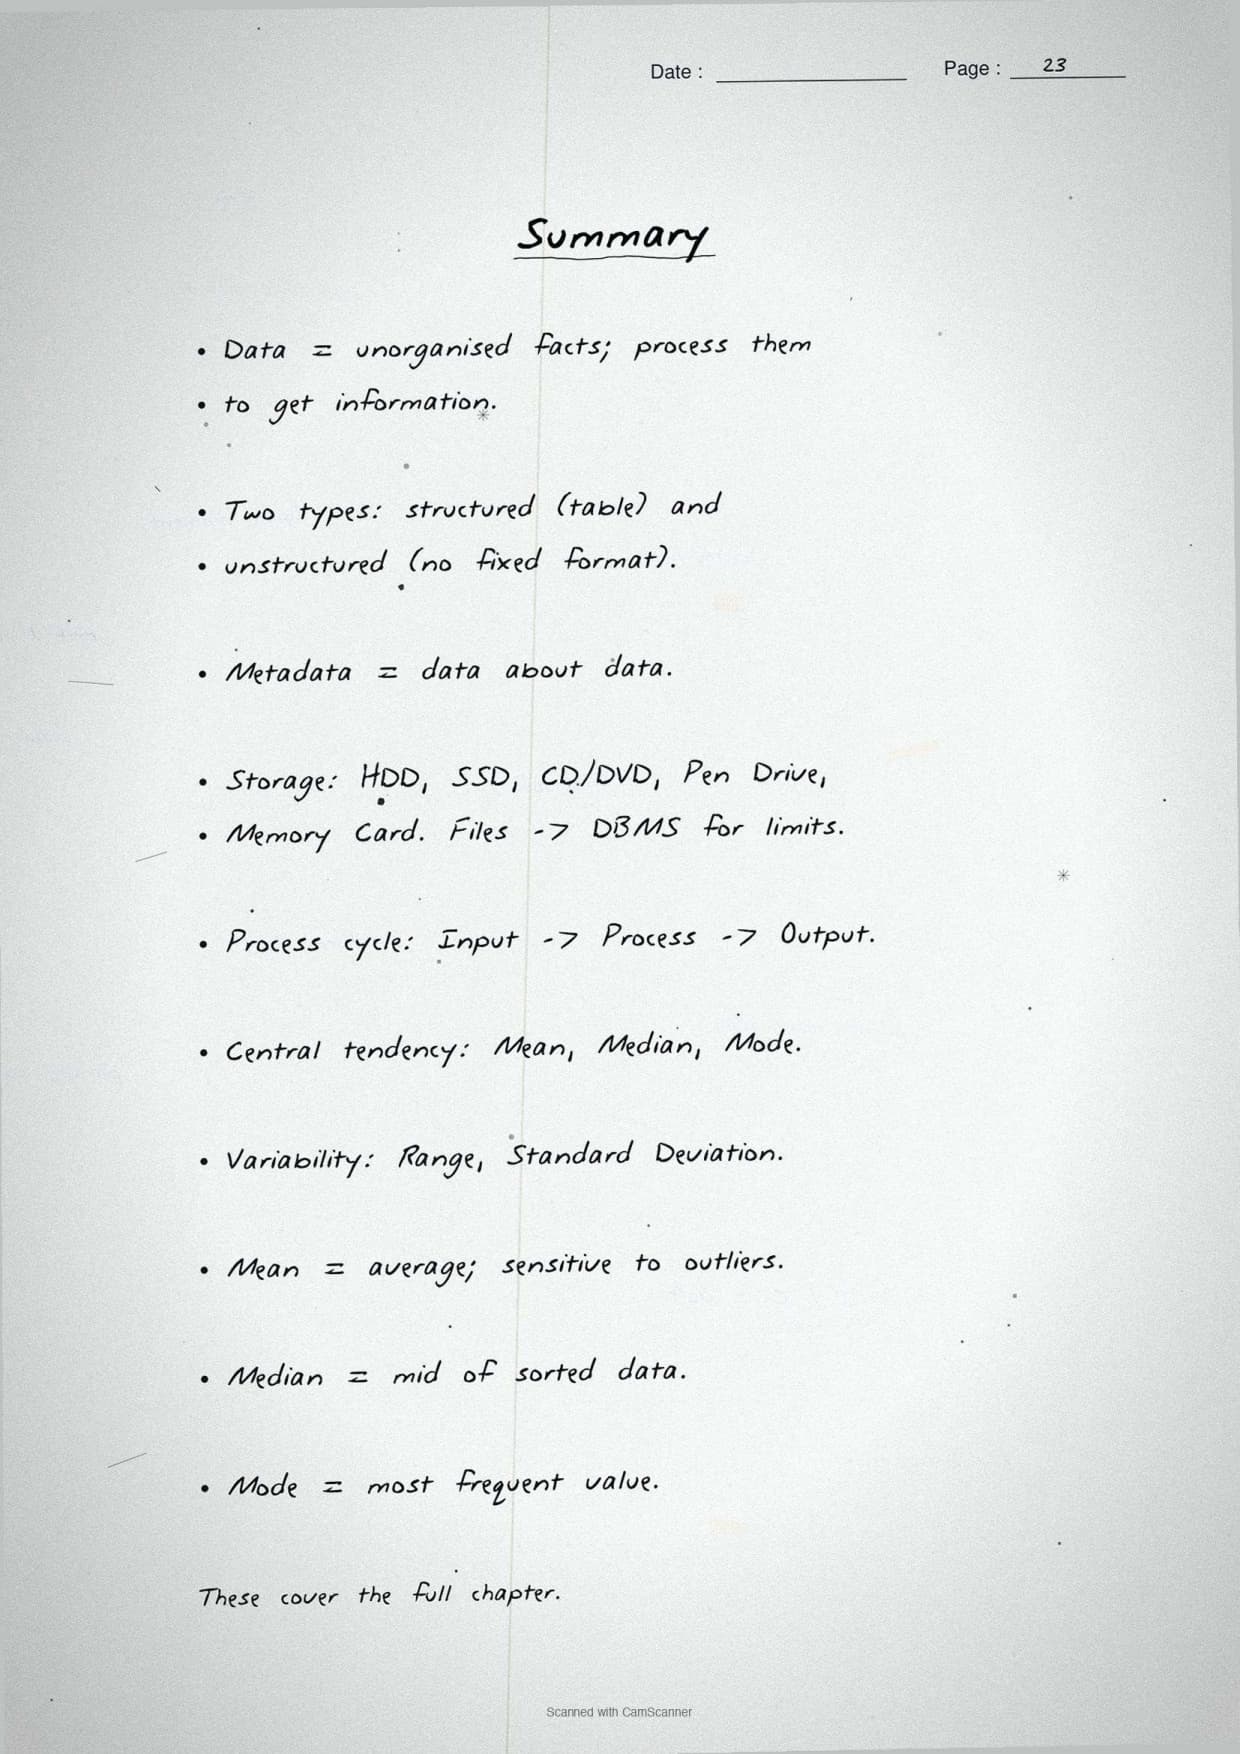
Measures of central tendency
- Mean: the average, found by adding all values and dividing by the count. Best when the data has no extreme outliers.
- Median: the middle value when the data is sorted. Best when a few extreme values would distort the mean.
- Mode: the value that appears most often. Best for counting how many times a category repeats, such as how many students chose a subject.
Measures of spread
- Range: the largest value minus the smallest value. A quick, rough measure of how wide the data is.
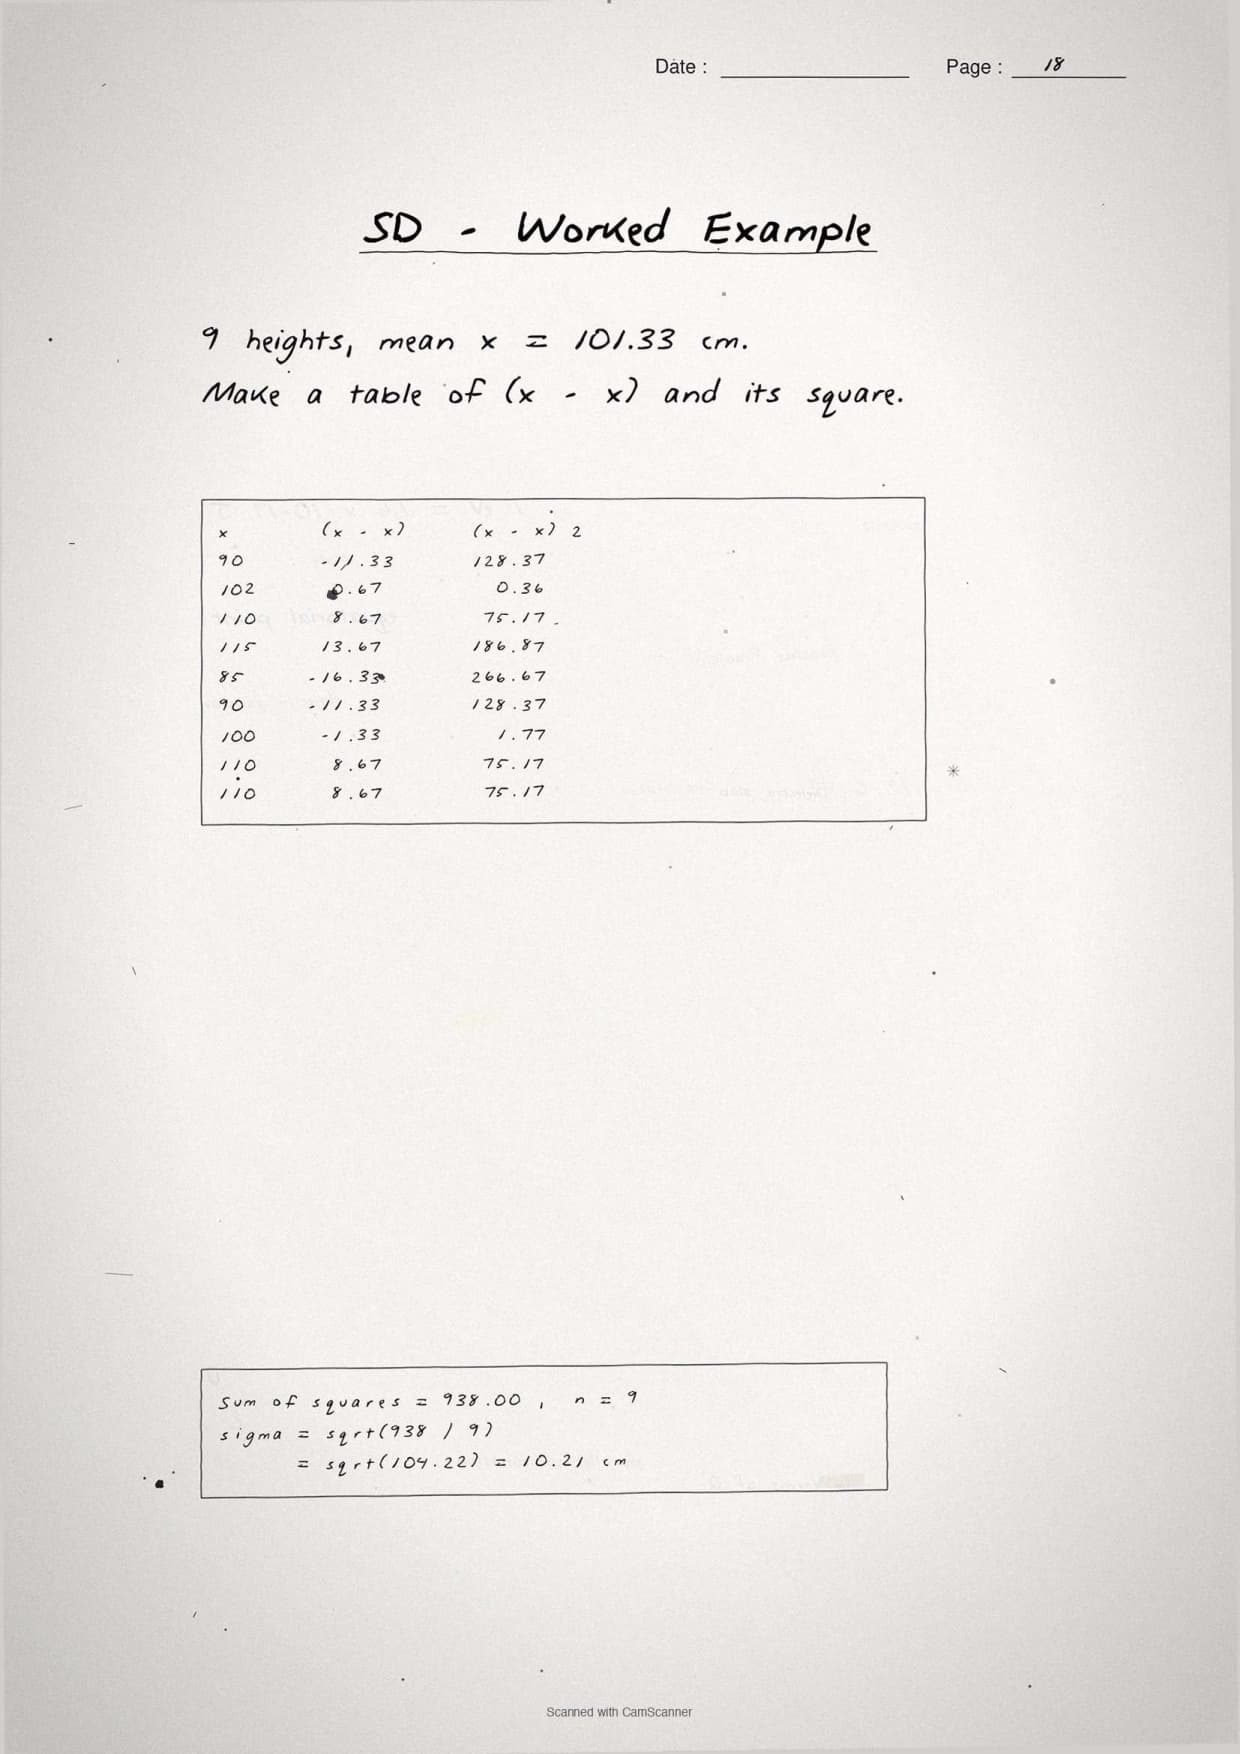
- Standard deviation: shows how far the values sit from the mean on average. A small value means the data is tightly grouped; a large value means it is widely spread.
For the week of temperatures 34, 34, 27, 28, 27, 34, 34, the notes show that the mean answers "what is the average temperature", the range (34 minus 27, which is 7) answers "how wide is the week", and the standard deviation answers "how varied is the week". Choosing the right measure for the question is the exact skill the board tests.
Statistics in Python: mean(), median(), mode() and stdev()
The last content page shows how Python's built-in statistics module computes these measures in one line each, since the board can ask you to name the function for a given calculation. You import the module first, then call the function on a list of numbers.
import statistics

temps = [34, 34, 27, 28, 27, 34, 34]

print(statistics.mean(temps))    # average temperature
print(statistics.median(temps))  # middle value when sorted
print(statistics.mode(temps))    # most frequent value (34)
print(statistics.stdev(temps))   # standard deviation (spread)
print(max(temps) - min(temps)) # range = largest - smalleststatistics.mean()returns the average; use it for the typical value.statistics.median()returns the middle value; use it when outliers would skew the mean.statistics.mode()returns the most common value; use it to count repeats.statistics.stdev()returns the standard deviation; use it for how spread out the data is.
The notes underline the one rule examiners check: import the statistics module before calling any of these functions, and remember that the range has no dedicated function, so you compute it as max(data) - min(data).
Common Mistakes Students Make in the Understanding Data Chapter
The repeat-offender mistakes in Understanding Data board answers:
- Calling an image or audio file structured data: anything that cannot fit into fixed columns is unstructured.
- Confusing range and standard deviation: range is just largest minus smallest, while standard deviation uses every value.
- Mixing data and information: raw facts are data; processed, meaningful results are information.
- Naming a source but not a method: for primary data, also state survey, interview, or observation.
- Forgetting to import the module:
statistics.mean()fails withoutimport statisticsat the top.
Other Resources for Class 12 Computer Science Chapter 7 Understanding Data
Pair these handwritten notes with the matching typed revision notes, the NCERT Solutions, and the official NCERT book chapter. All resources for Class 12 Computer Science Chapter 7 Understanding Data are linked in the table below.
| Resource | What it covers | Open |
|---|---|---|
| Handwritten Notes | Handwritten 24-page revision notebook for last-minute board prep. | You are here |
| Notes | Concept-first typed revision notes on data types, the processing cycle, and statistics. | Understanding Data Class 12 Notes |
| NCERT Solutions | Step-by-step answers to all 10 exercise questions with data sets and statistics. | Understanding Data Class 12 NCERT Solutions |
| NCERT Book PDF | Official NCERT Computer Science Chapter 7 Understanding Data textbook in PDF form. | Understanding Data Class 12 NCERT Book PDF |
NCERT Handwritten Notes for Class 12 Computer Science: All Chapters
Related Links: Use the table below to open the handwritten notes for the other chapters of Class 12 Computer Science. Every chapter comes as genuine handwritten notes with a free PDF download.
| Chapter | Handwritten Notes link |
|---|---|
| Chapter 1 | Exception Handling in Python Handwritten Notes |
| Chapter 2 | File Handling in Python Handwritten Notes |
| Chapter 3 | Stack Handwritten Notes |
| Chapter 4 | Queue Handwritten Notes |
| Chapter 5 | Sorting Handwritten Notes |
| Chapter 6 | Searching Handwritten Notes |
| Chapter 7 | Understanding Data Handwritten Notes (You are here) |
| Chapter 8 | Database Concepts Handwritten Notes |
| Chapter 9 | Structured Query Language (SQL) Handwritten Notes |
| Chapter 10 | Computer Networks Handwritten Notes |
| Chapter 11 | Data Communication Handwritten Notes |
| Chapter 12 | Security Aspects Handwritten Notes |
Understanding Data Class 12 Handwritten Notes FAQs
Ques. Are the Class 12 Computer Science Chapter 7 Understanding Data handwritten notes free to download?
Ans. Yes. The entire 24-page handwritten PDF on Understanding Data is free to download from this Collegedunia page, with no sign-up needed.
Ques. Do the handwritten notes cover the full Understanding Data chapter?
Ans. Yes. The notes cover structured, unstructured and semi-structured data, the data processing cycle, primary and secondary data collection, the survey, interview and observation methods, and the statistics of mean, median, mode, range and standard deviation.
Ques. What is the difference between structured and unstructured data in these notes?
Ans. Structured data fits into a table of rows and columns, such as marks or bank records. Unstructured data has no fixed format, such as images, audio, video and tweets. The notes use a quick column test to tell them apart.
Ques. Which statistical measures are explained in the Understanding Data handwritten notes?
Ans. The notes box the mean, median and mode as measures of central tendency, and the range and standard deviation as measures of spread, with one worked temperature example and the matching Python statistics functions.
Ques. Are these notes aligned to the 2026-27 CBSE syllabus?
Ans. Yes. Every data type, processing step and statistical formula matches the current 2026-27 NCERT print and the latest CBSE Class 12 Computer Science marking scheme.



Comments