



Education Journalist | Study Abroad Lead
Have you ever looked at the aggregate percentage on your report card and wondered what does it mean? Or have you ever wondered why the run rate is given importance in cricket? These quantities help in representing the data in single terms through statistics which further makes the analysis easier. The three types of most popular averages in statistics are mean, median, and mode. There are a variety of additional "averages" specified in statistics, but these three are the most popular. A data is often represented through a value that defines the whole of the data approximately. This representative value is known as the central tendency. The values around which all the data is centered, the central tendency, are mean, median, and mode. In this article, we will discuss the explanation and formula for mean, median, and mode and look at some related sample questions.
Read Also: Degree of Polynomial
What is Mean?
Mean can simply be defined as the sum of all the observations divided by the total number of observations. This definition is specifically for Arithmetic Mean, which is one of many forms of Mean.
Mean, Median and Mode Video Lecture
The several types of means are explained in-depth below:
Arithmetic mean
The average of all the observations recorded is called the arithmetic mean. When a mean is mentioned without an adjective, it is usually presumed to be Arithmetic Mean.
For example, we have a collection of observations with the following values: x=1,3,5,7,9. The Arithmetic Mean is calculated using the formula
Mean = x/n
where n is the number of observations = 5 and
x is the sum of all observations, x=25
Hence, mean = 25/5
= 5
\(Mean = \frac{\text{Sum of all observations}} {\text{Number of observations}}\)

Statistical Mean
Check Important Difference Between Variance and Standard Deviation
Harmonic mean
The Harmonic Mean is calculated by multiplying the total number of observations by each observation's reciprocal. It's quite useful in physics and has a lot of other uses (example- average speed when the duration of several trips is known). The formula is as follows:
For an observation x1, x2, x3…………..xn
\(HM = \frac{n}{[(\frac{1}{X1}) + (\frac{1}{X2} + (\frac{1}{X3}) +.....+ (\frac{1}{Xn})]}\)
Geometric mean
The Geometric Mean calculates the central tendency by multiplying the observations rather than adding them together (which is used in calculating Arithmetic Mean). It's commonly utilized in finance and social sciences. It is used to compute average growth rates in finance. When the observations are interdependent or have considerable fluctuations, the Geometric Mean is the best option.
Consider the case where x1, x2, x3.......xn are the observations for which the Geometric Mean is to be calculated. The following is the formula for calculating the geometric mean:
GM = n√x1.x2.…xn
or
GM = (x1.x2. x3…xn)1/n
Also Check:
What is Median?
The median is the point in any dataset of observations that is in the middle. Half of the recorded observations are larger than this, while the other half are smaller. Median can be referred to as the 50th percentile. The outliers (datapoints with extreme values) have less impact on the Median. Median is often a better indication of central tendency than the Mean.
Median = (n+1/2)th term if given data set has odd number of values
= average of (n/2)th and ((n/2)+1)th observation if data set is even.
Also Read:
Calculating the Median: A Step-by-Step Guide
Step 1: Sort your observations into ascending or descending order.
Step 2: The median is the middle observation if the number of observations is odd, and the average of the two middle observations if the number of observations is even.
For example:
We have a dataset x=10,40,30,20.
Step 1: Sort the data into ascending order (x=10,20,30,40).
Step 2: Because there is an even number of observations, the median is (30+20)/2, which is 25.

Calculation of Median
Read Difference Between Sequence and Series
What is Mode?
The most common or frequent observation in a dataset is known as the mode. A dataset can have zero, one, or several modes. The advantage of Mode over Mean and Median is that it can be applied to any type of dataset, whereas Mean and Median cannot be used with nominal data. Outliers do not affect it either. Its drawback is that it can't be used for in-depth analysis.
For example:
For an observation- 1,2, 4 ,5, 7, 4, 8, 4,0,4 find the mode.
As 4 is the most frequent, therefore mode for the observation is 4.

Mode
Relationship between mean, median, and mode
The formula for the relationship between mean, median, and mode which are the three measures of central tendency for a moderately skewed distribution, is:
Mode = 3 Median – 2 Mean
This is also known as an empirical relationship. When the other two measures are known for given data, this is utilized to find one of the measures. By swapping the LHS and RHS, this connection can be recast in a variety of ways.
For example, if we are want to discover the mean, median, and mode of continuous grouped data, we can use the formulas mentioned in the preceding sections to obtain the mean and median, and then use the empirical relation to find the mode.
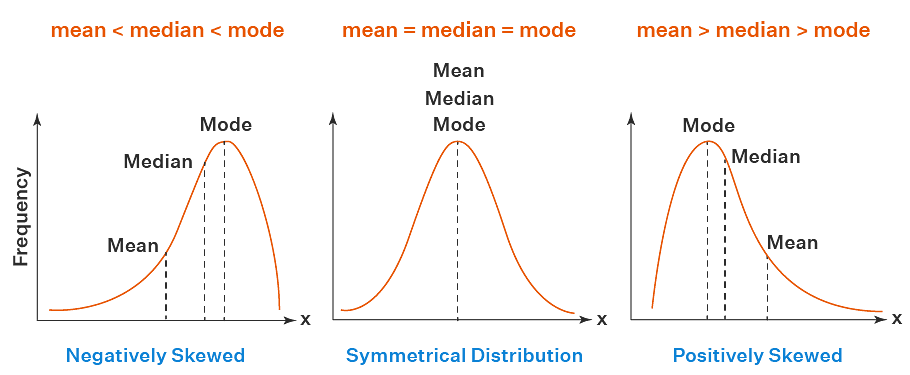
Relation between Mean, Median, and Mode
Difference between mean and average
In everyday life, the term average is frequently used to imply a value that is typical of a group of quantities. The average amount of rain in a month or the average age of an organization's personnel are two examples.
We might come across statements such as "People spend an average of 2 hours every day on social media,". We may deduce, from the use of the phrase "average" that not everyone spends 2 hours per day on social media; some spend more, while others spend less.
However, we can deduce from the term average that 2 hours a day is a good estimate of how much time is spent on social media. Even though average and mean are not the same, most people use them interchangeably.
With the values of the observations organized in ascending order of magnitude, an average tends to lie in the middle. As a result, we call an average measure of the data's central tendency. There are various types of averages. The arithmetic mean, sometimes known as the mean, is one of the averages. The mathematical average is known as the mean, but the positional averages are known as the median and mode.
Also Read:
Things to remember
- The three types of most popular averages in statistics are mean, median, and mode.
- The sum of all the observations divided by the total number of observations is the definition of Mean in simple words.
- The median is the point in any dataset of observations that lies in the middle. Half of the observations are larger than this, while the other half are smaller.
- The most common or frequent observation in a dataset is known as the mode. A dataset can have zero, one, or several modes.
- The formula for the relationship between mean, median, and mode, which are the three measures of central tendency for a moderately skewed distribution, is
Mode = 3 Median – 2 Mean
Also Read Further:
Sample Questions
Ques. How many types of mean are there? (3 marks)
Ans. The most common metric of central tendency is the mean.
- Arithmetic mean,
- Weighted mean,
- Geometric mean (GM), and
- Harmonic mean
are examples of several types of means. It usually refers to the arithmetic mean when given without an adjective (as mean).
Ques. How will you define the term central tendency? (2 marks)
Ans. A central tendency is a central or typical value for a probability distribution in statistics. It is also known as a distribution center or location. Averages are a common term for measures of central tendency. The phrase "central tendency" was coined in the late 1920s.
Ques. What is the relationship between mean, median, and mode? (3 marks)
Ans. The formula for the relationship between mean, median, and mode, which are the three measures of central tendency for a moderately skewed distribution, is:
Mode = 3 Median – 2 Mean
This is also known as an empirical relationship. When the other two measures are known for given data, this is utilized to find one of the measures. By swapping the LHS and RHS, this connection can be recast in a variety of ways.
Ques. The average of the five integers is 18. If one of the numbers is left out, the mean is 16. Find the number that isn't included. (5 marks)
Ans- Given, n = 5, \(\bar{X}\) = 18
\(\bar{X}\)= (∑xi)/n
∑xi= 5 × 18 = 90
Thus, the sum of 5 observations = 90
Let "a" be the excluded number
Total of 4 numbers = 90 - a
Mean of 4 numbers = (90 - a)/4
16 = (90 - a)/4
90 - a = 64
a = 26
⇒ The missing number is 26.
Check Important Difference Between Relation and Function
Ques. Consider the following numbers: 56, 67, 54, 34, 78, 43, 23. What is the median? (3 marks)
Ans. In increasing order, the numbers are 23, 34, 43, 54, 56, 67, and 78.
n (number of observations) = 7 in this case.
average of (n/2)th and (n/2+1)th observation is median if the data set is even.
As a result, (7 + 1)/2 = 4
4th observation = median
54 is the median.
Ques. What is harmonic mean? (3 marks)
Ans. The Harmonic Mean is calculated by multiplying the total number of observations by each observation's reciprocal. It's quite useful in physics and has a lot of other uses (example- average speed when the duration of several trips is known). The formula is as follows:
For an observation x1, x2, x3…………..xn
\(HM = \frac{n}{[(\frac{1}{X1}) + (\frac{1}{X2} + (\frac{1}{X3}) +.....+ (\frac{1}{Xn})]}\)
Ques. Find the mode for 8, 5, 7, 10, 15, 21, 5, 7, 2, 5. (1 mark)
Ans. The mode is 5 as it occurs 3 times in the observation.
Ques. 142 cm, 150 cm, 149 cm, 156 cm, and 153 cm are the heights of five persons, find the mean height. (3 marks)
Ans. x = (142 + 150 + 149 + 156 + 153)/5 = 750/5 = 150 = mean height
x =150 cm on average
As a result, the mean height is 150 cm.
Mathematics Related Links:



Comments