



Content Writer
Frequency Distribution Table in Statistics involves collecting, documenting, and responsibly storing information in our daily lives. Statistics is an important component of mathematics.
- Frequency Distribution Table in Statistics tell about what a dataset tells about a given phenomenon using statistics.
- Statistics refers to the structure, distribution, gathering, and interpretation of a set of observations.
- It is a representation of facts or a piece of information that can be further processed.
- All outcomes in the first column of the table depend upon the size of the dataset.
- Pie charts, bar graphs, tables, histograms, and frequency polygons are different ways to show statistical data.
- Frequency Distribution Tables in Statistics help analyze the data using central tendency and variance.
- Data can be collected and recorded using a frequency distribution table.
- Profit reports made in different phases of years are examples of a frequency table.
Key Terms: Frequency Distribution Tables in Statistics, Frequency Distribution Table, Statistics, Variance, Central Tendency, Dataset, Relative Frequency, Grouped Data, Ungrouped Data, Range, Set
What is Frequency Distribution Table in Statistics?
[Click Here for Sample Questions]
Frequency Distribution Table in Statistics is a table consisting of values and frequencies of different objects. It is quite useful since it organizes a vast data set into a table.
- Frequency Distribution Table in Statistics makes interpretation and analysis quicker and more convenient.
- It creates a visual representation of the dataset based on the frequency.
- The table gives the correct number of observations in the graphical or tabular display format.
- It mainly consists of two columns, namely the variables or categories column and another for frequencies.
- In special cases, a third column is created for calculating frequency count.
- We may use statistics to forecast the nature of data by researching huge volumes of data and trends.
- It will result in the evaluation of results.
Example of What is Frequency Distribution Table in Statistics?Example: Consider the following example to gain a better understanding of the frequency distribution. Assume we have the following results from a unit test given to ten students out of a class of 25: 12, 24, 22, 9, 19, 15, 23, 25, 17, and 8.
|
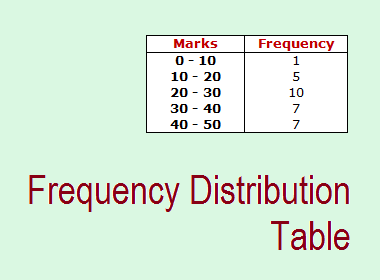
Frequency Distribution Table
How to make a Frequency Distribution Table?
[Click Here for Sample Questions]
There are two ways of creating a frequency distribution table which are as follows:
Ungrouped Data
Ungrouped Data is a form of representation which deals with smaller data set. The process become complicated as the number of observations grows, and the computations based on it can become quite difficult.
- The depiction of data in tabular form is more convenient because statistics is about presenting data in an orderly fashion.
- Number of observations are equal to value of a variable.
- The frequency of data refers to the number of times data appears in a data set.
Example of Ungrouped DataExample: Considering a situation : In a quiz, the marks obtained by 20 students out of 30 are given as: 12, 15, 15, 29, 30, 21, 30, 30, 15, 17, 19, 15, 20, 20, 16, 21, 23, 24, 23, 21. We can represent this data in tabular form as follows:
The number of students who scored various marks as recorded in the preceding example is referred to as frequency. The term "ungrouped frequency table" refers to this sort of tabular data collection.
|
Read More:
| Chapter Related Concept | ||
|---|---|---|
| Empirical Probability | Applications of Integral | Rolle’s Theorem |
Grouped Data
Grouped Data is a form of data when we are dealing with large set of dataset. In this data is grouped into intervals or ranges instead of single values. Each interval has specific value of width.
- The "Lower Limit" is the class interval's lowest number.
- "Highest Limit" is the class interval's highest number.
- When using continuous class intervals, the extreme values are included in the class interval where they are the lower limit.
Example of Grouped DataExample: Let us consider another situation in which we have scores of 200 students instead of 20 students out of 25 in their mathematics unit test. Take a look at the table below, which is based on the dataset from the previous part, for a better understanding of a grouped frequency distribution table.
|
Read More
| Class 11 Mathematics Related Concepts | ||
|---|---|---|
| Relation and Function | Bayes Theorem | Measures of Dispersion |
| Relation Between Mean Median and Mode | Mode Formula | Remainder Theorem |
Steps for Constructing a Frequency Distribution Table in Statistics
[Click Here for Sample Questions]
The steps used for constructing a frequency distribution table in statistics are as follows:
- First, create a table consisting of two columns where one value represents data and the other represents frequency.
- Examine the values in the dataset to determine whether they are grouped or ungrouped dataset.
- If there are different sets of values, try to use group data.
- Fill the first column of the table with the values of the dataset.
- Determine the frequency of each data by counting.
- Fill in the frequency of each item or observation in the second column of the table.
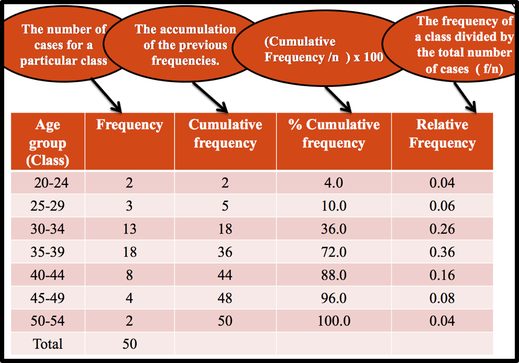
Frequency Distribution Table
Key Terms Related to Frequency Distribution Table
[Click Here for Sample Questions]
The key terms related to frequency distribution table are as follows:
Frequency
Frequency refers to number of time a particular set of value occur in the data set. It is recorded in the second column of the table.
Tally Marks
Tally Marks refers to precise visual representation of marks that are used to represent frequency of the variable.
Variables
Variables refers to different set of group values that are recorded in the first column of the table. It is also known as categories.
Total Frequency
Total Frequency refers to sum of all the frequency noted in the frequency distribution table.
Things to Remember
- A frequency distribution table in statistics is a method of organising large datasets into a more concise, understandable format
- The biggest advantage involves analysis and understanding of the data becomes easier.
- Frequency distribution table formula can be of two types: grouped and ungrouped
- In grouped frequency distribution tables, the data is represented graphically using histograms.
- In ungrouped frequency distribution tables, data is represented graphically using bar graphs.
Sample Questions
Ques. Consider the frequency distribution table below, which corresponds to the marks students received on their science unit test out of a possible total of 20, and then respond to the questions that follow. (4 marks)
| MARKS | NUMBER OF STUDENTS (FREQUENCY) |
|---|---|
| 0-5 | 25 |
| 5-10 | 15 |
| 10-15 | 40 |
| 15-20 | 20 |
(B) What is the size of the class.
(C) What is the class mark for the range of 10-15.
(D) What are the second interval's class limits.
Ans: (A) The second class interval's the lower limit, that is, 5-10, is 5.
(B) The difference between the top and lower class boundaries, which are 5-0 = 5 or 10-15 = 5, is referred to as the class size (the answer is 5 in all the cases).
(C) The average of the upper and lower bounds is the classmark. As a result, the classmark for the interval 10-15 is (10+15)/2 = 25/2 = 12.5.
(D) The class limits for the second interval, 5-10, are 5 (lower limit) and 10 (upper limit) (upper limit).
Ques. Create a frequency distribution table where marks of 20 students in english exam as: 68, 72, 75, 78, 80, 82, 85, 88, 90, 92, 68, 72, 75, 78, 80, 82, 85, 88, 90, 92. (4 marks)
Ans. The process is as follows:
Step 1: First arrange the given data into ascending order as: 68, 68, 72, 72, 75, 75, 78, 78, 80, 80, 82, 82, 85, 85, 88, 88, 90, 90, 92, 92
Step 2: Create a frequency distribution table
| Marks | Frequency |
|---|---|
| 68 | 2 |
| 72 | 2 |
| 75 | 2 |
| 78 | 2 |
| 80 | 2 |
| 82 | 2 |
| 85 | 2 |
| 88 | 2 |
| 90 | 2 |
| 92 | 2 |
Step 3: Add the adjacent frequency in the cumulative frequency column
| Marks | Frequency | Cumulative Frequency |
|---|---|---|
| 68 | 2 | 2 |
| 72 | 2 | 4 |
| 75 | 2 | 6 |
| 78 | 2 | 8 |
| 80 | 2 | 10 |
| 82 | 2 | 12 |
| 85 | 2 | 14 |
| 88 | 2 | 16 |
| 90 | 2 | 18 |
| 92 | 2 | 20 |
Ques. Consider you have a dataset of exam scores: {62, 72, 83, 90, 78, 91, 88, 76, 82, 95, 68, 74, 80}. Create a grouped frequency distribution table with class intervals of width 10 starting from 60. (4 marks)
Ans. The process is as follows:
| Class intervals | Frequency |
|---|---|
| 60-70 | 2 |
| 70-80 | 4 |
| 80-90 | 5 |
| 90-100 | 2 |
- The first class interval (60-70) includes scores 62 and 68.
- The second class interval (70-80) includes scores 72, 78, 76, and 74.
- The third class interval (80-90) includes scores 82, 90, 88, 82, and 80.
- The fourth class interval (90-100) includes scores 92 and 95.
Ques. Represent data regarding the pocket allowances of students through a Frequency Distribution Table. (2 marks)
Ans. The process is as follows:
| Monthly Pocket Allowances (in Rs.) | Number of Students |
|---|---|
| 1000-1300 | 5 |
| 1600-1900 | 4 |
| 2000-2400 | 1 |
| Total | 10 |
Ques. On new york street, a survey was conducted. In each of the 20 homes, people were asked how many cars were registered to their households. The following are the results:
2, 1, 4, 0, 2, 1, 5, 2, 1, 5, 4, 2, 3, 2, 0, 2, 1, 0, 4, 3.
This data should be displayed in a Frequency Distribution Table.
Determine how many vehicles each household has registered.
Divide the number of cars (x) into intervals and count the number of outcomes in each interval (frequency). (3 Marks)
Ans. The Frequency Distribution Table is as folllows:
| Number of Cars | Frequency |
|---|---|
| 0 | 3 |
| 1 | 4 |
| 2 | 6 |
| 3 | 2 |
| 4 | 3 |
| 5 | 2 |
| Total | 20 |
Ques. Find the mean deviation about the mean for the following data. (3 Marks)
Ans. The process is as follows:
| Marks obtained | 10-20 | 20-30 | 30-40 | 40-50 | 50-60 | 60-70 | 70-80 |
|---|---|---|---|---|---|---|---|
| Number of students | 5 | 30 | 10 | 15 | 10 | 10 | 20 |
The following data is represented in the table:
| Marks Obtained | Number of students | Mid-points | f i x i | |Xi-x| | Fi|xi-x| |
|---|---|---|---|---|---|
| 10-20 | 5 | 15 | 75 | 30 | 60 |
| 20-30 | 30 | 25 | 750 | 20 | 60 |
| 30-40 | 10 | 35 | 350 | 10 | 80 |
| 40-50 | 15 | 45 | 675 | 0 | 0 |
| 50-60 | 10 | 55 | 550 | 10 | 80 |
| 60-70 | 10 | 65 | 650 | 20 | 60 |
| 70-80 | 20 | 75 | 1500 | 30 | 60 |
| Total | 100 | - | 1800 | - | 400 |
M.D. = 1/100*400=4
Ques. In a survey, participants were asked to rate a product on a scale of 1 to 5. The data collected is as follows: {2, 4, 5, 2, 3, 4, 5, 1, 3, 4, 5, 2, 4, 4, 1}. Create a relative frequency distribution table to represent the proportion of each rating in the dataset. (3 Marks)
Ans. The process is as follows:
Step 1: Identify unique values and their frequencies.
| Rating | Frequency |
|---|---|
| 1 | 2 |
| 2 | 3 |
| 3 | 3 |
| 4 | 5 |
| 5 | 4 |
Step 2: Calculate the relative frequency for each rating.
Relative Frequency = (Frequency of Rating) / (Total Number of Ratings)
| Rating | Frequency | Relative Frequency |
|---|---|---|
| 1 | 2 | 2/15 |
| 2 | 3 | 3/15 |
| 3 | 3 | 3/15 |
| 4 | 5 | 5/15 |
| 5 | 4 | 4/15 |
Step 3: Represent the relative frequency as a percentage.
Relative Frequency (Percentage) = Relative Frequency × 100
| Rating | Frequency | Relative Frequency | Relative Frequency (%) |
|---|---|---|---|
| 1 | 2 | 2/15 | 13.33 |
| 2 | 3 | 3/15 | 20 |
| 3 | 3 | 3/15 | 20 |
| 4 | 5 | 5/15 | 33.33 |
| 5 | 4 | 4/15 | 26.67 |
Ques. Consider you have a dataset of exam scores: {66, 79, 83, 94, 78, 91, 86, 76, 82, 95, 68, 74, 80}. Create a grouped frequency distribution table with class intervals of width 10 starting from 60. (4 marks)
Ans. The process is as follows:
| Class intervals | Frequency |
|---|---|
| 60-70 | 2 |
| 70-80 | 4 |
| 80-90 | 4 |
| 90-100 | 3 |
- The first class interval (60-70) includes scores 66 and 68.
- The second class interval (70-80) includes scores 79, 78, 76, and 74.
- The third class interval (80-90) includes scores 83, 86, 82, and 80.
- The fourth class interval (90-100) includes scores 91, 92 and 95.
Ques. Represent data regarding the pocket allowances of students through a Frequency Distribution Table. (2 marks)
Ans. The process is as follows:
| Monthly Pocket Allowances (in Rs.) | Number of Students |
|---|---|
| 1100-1300 | 5 |
| 1600-1800 | 4 |
| 2000-2200 | 1 |
| Total | 10 |
Ques. On avenue, a survey was conducted. In each of the 20 homes, people were asked how many cars were registered to their households. The following are the results:
2, 1, 4, 0, 2, 1, 3, 2, 1, 1, 4, 2, 3, 2, 0, 2, 1, 0, 4, 3.
This data should be displayed in a Frequency Distribution Table.
Determine how many vehicles each household has registered.
Divide the number of cars (x) into intervals and count the number of outcomes in each interval (frequency). (3 Marks)
Ans. The Frequency Distribution Table is as folllows:
| Number of Cars | Frequency |
|---|---|
| 0 | 3 |
| 1 | 5 |
| 2 | 6 |
| 3 | 3 |
| 4 | 3 |
| 5 | 0 |
| Total | 20 |
Ques. The weekly pocket expenses (in dollars) of a group of 25 students chosen at random are shown below.
37, 41, 39, 34, 41, 26, 45, 31, 48, 32, 44, 39, 35, 39, 30, 49, 27, 36, 33, 38, 49, 45, 40, 37, 35
Make a grouped frequency distribution table with class intervals of equal width beginning with 25 - 30, 30 - 35, and so on. Determine your weekly out-of-pocket expenses as well. (3 Marks)
Ans. The following data is represented in the table:
| Weekly Expenses | Number of Students |
|---|---|
| 25-30 | 2 |
| 30-35 | 6 |
| 35-40 | 8 |
| 40-45 | 5 |
| 45-50 | 4 |
| Total | 25 |
The smallest value in the given data is 26 and the largest value is 49. So, the weekly pocket expense range = 49 - 26 = $23.
Ques: Sonu and Ashu have a deck of one-to-ten number cards. They take out a number card and record the number that appears on it. They go through the process at least 12 times. They have the following values assigned to them:
5, 8, 9, 2, 3, 7, 3, 1, 5, 9, 3, 2
Create a frequency table to better organise the data. (3 Marks)
Ans: The following data is represented in the table:
| Values | Frequency |
|---|---|
| 1 | 1 |
| 2 | 1 |
| 3 | 3 |
| 4 | 0 |
| 5 | 2 |
| 6 | 0 |
| 7 | 1 |
| 8 | 1 |
| 9 | 2 |
| 10 | 0 |
| Total | 12 |
Read Also:



Comments