



Content Curator
Normal Distribution Formula is a part of statistics which helps from the measurement of IQ to the measurement of blood pressure and forms a highly diverse group of probability, Normal Distribution formula helps determine several different groups of statistical data. Normal Distribution Formula is also often known as “Gaussian distribution and the bell curve.”
| Table of Content |
Key Takeaways: Normal Distribution, Probability, Lognormal, Gaussian Distribution, data
Normal Distribution Formula
[Click Here for Sample Questions]
In the normal distribution formula, the data received is implied by means of systematic distribution without a slew. Most of the values found in the data clump around the central point, making a bell shape, and become plainly distant once farther away from the central region.
Normal Distribution Formula is one of the most important areas of probability distribution. The use of Normal Distribution Formula is that it helps determine how the values of a variable are distributed by means of a graph. In simple words, the smaller the value associated with a standard deviation, the more concentrated the data is likely to be.
The Normal Distribution Formula can be given by: \(f(x) = \frac{1}{\sigma\sqrt{2 \pi}} e^{\frac{-(x-\mu)^2}{2 \sigma^2}}\)
Wherein, μ is signified as the mean of the data.
σ is signified as the standard deviation of data.
x is dignified as the normal random variable.
A normal distribution can be shown only if (μ) = 0 and the standard normal deviation is equal to 1.

Probability Distribution Formula
[Click Here for Sample Questions]
Typically, the value placed to a probable outcome in several random experiments is commonly considered as a probability distribution equation. It can be dissected into two major areas:
The Normal Probability Distribution Formula
The Normal Probability Distribution, otherwise also known as Gaussian distribution typically signifies the plotting of a graph that forms a bell shape.
It can be signified by the following formula: \(f(x) = \frac{1}{\sigma\sqrt{2 \pi}} e^{\frac{-(x-\mu)^2}{2 \sigma^2}}\)
Where, μ is signified as the mean of the data.
σ is signified as the standard deviation of data.
x is dignified as the normal random variable.
The Binomial probability Distribution Formula
It can be denoted simply as the probability of two possible events, either successful or failure, of a randomly executed experiment or survey which can be multiple times.
The binomial probability distribution formula can be represented by the following equation,
P (x:n, p) = nCx px (1-p)n-x
Or
It can be also mentioned as, P(x:n,p) = nCx px (q)n-x
Wherein, n is the sum total of all the events.
p signifies the total successful events out of the experiment.
q denotes the probability of failure calculated per trial.
It can be denoted by, nCr = n! / r! (n - r)!
Therefore, 1 - p (which is the probability of failure of the event)
Also Read:
Lognormal Formula
[Click Here for Sample Questions]
In the group of probability theory, a lognormal distribution can be defined as a series of probability distributions, especially of a randomly decided variable that has a uniformly distributed logarithm. Assuming that a random variable, say X, has been found lognormally distributed, then the value of Y = ln (X) is normally distributed.
In other words, the lognormal distribution formula for mean can be denoted by, m = eμ + σ2/2.
Gaussian Distribution Formula
[Click Here for Sample Questions]
Gaussian Distribution can be used when the total number of events collectively are extremely large. It helps signify physical events. In other words, the Gaussian distribution formula can be defined as a continuous function which aids the approximation of the accurately represented binomial distribution of events. The formula of Gaussian Distribution is represented below,
\(f_g(x) = \frac{1}{\sigma\sqrt{2 \pi}} e^{\frac{-(x-\mu)^2}{2 \sigma^2}}\)
Standard Distribution Formula
[Click Here for Sample Questions]
Standard Normal Distribution can be defined when a normal random variable has been assigned a mean value usually equal to 0, while the value of the standard deviation has been found equal to 1. In standard normal distribution, the random variable is generally considered z-score or standard score.
z = (X − μ) / σ (wherein, X denotes normal random variable, μ denotes mean of the data, and σ denotes standard deviation of the data.
Points to Remember
Following are some important points:
- The Normal Distribution Formula commonly helps determine how the values of a variable are distributed on a graph. The formula of normal distribution is
- Probability Distribution formula can be classified into two groups: The Normal Probability distribution Formula and The Binomial Probability Distribution Formula.
\(f(x) = \frac{1}{\sigma\sqrt{2 \pi}} e^{\frac{-(x-\mu)^2}{2 \sigma^2}}\)
- A lognormal distribution is a continuous series of probability distributions, especially of a randomly decided variable which has uniformly distributed logarithm.
- The Gaussian distribution formula is also a continuous function which assists the approximation of the accurately represented binomial distribution of random experiments.
- In standard normal distribution, the random variable is considered z-score or standard score: z = (X − μ) / σ.
Sample Questions
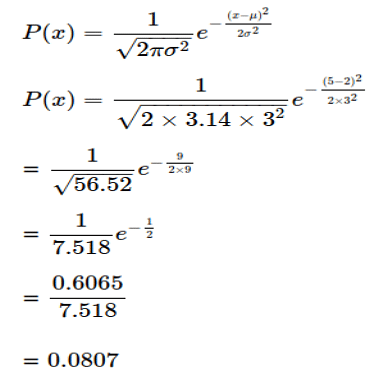
Ques: Determine the normal probability distribution which has a population mean of 2, standard deviation of 3 and also a random variable of 5. (3 Marks)
Considering the random variable, x = 5
The Population Mean, μ = 2
And the Standard Deviation, as per the question, σ = 3
It can be said that the equation can be solved by means of normal probability distribution,
Ques: Assuming, on an average, that a light bulb has a lifespan of 300 days, with a standard deviation of 50 days. Now, it is found that the life span of the bulb is normally distributed. Establish the probability of the light bulb lasting about 365 days. (3 Marks)
Now, we require determining the probability that the average lifespan of the light bulb is more or less equal to 365 days (normal random variable).
Therefore, the probability distribution formula is = \(f(x) = \frac{1}{\sigma\sqrt{2 \pi}} e^{\frac{-(x-\mu)^2}{2 \sigma^2}}\)
Now, after replacing the values, we get,
= 0.90 (which can be obtained from the already provided normal distribution table).
Hence, there is a 90 percent chance that the light bulb will stop working within about 365 days.
Ques: Assuming that X∼N (4, 9), determine the value of P (X > 6) by means of the normal distribution formula. (3 Marks)
Ans: Considering that a variable X follows the path of normal distribution, and has mean μ and variance σ2, it can then be signified by: X∼N (π, σ2)
Hence, P (X > 6) = 1 - P (X <6)
\(= 1 - \varphi(\frac{6-4}{3})\)
\(= 1 - \varphi(0.67)\)
= 1 - 0.74857
= 0.25143
Thus, the answer is P (X > 6) = 0.25143
Ques: The life span set for an electric light bulb is defined by a distribution with mean of 1,200 hours, alongside standard deviation of about 200 hours. Determine the probability of the electric light bulb lasting over 1,500 hours in total by means of normal distribution formula. (3 Marks)
X∼N (1200, 2002)
Therefore, it can be said that = P (X > 1150) = 1 − P (X < 1150)
\(= 1 - \varphi(\frac{1150-1200}{200})??\)
\(= 1 - \varphi(-0.25)\)
= 0.59871
Which is to say, the probability of the electric light bulb to last over 1,500 hours is 0.5981.
Ques: Determine the value of probability density function of normal distribution for the data mentioned below; x=3, μ= 4 and σ=2? (3 Marks)
The variable of the value, x = 3
The mean of the value = 4
And the Standard Deviation = 2
Now, by the help of the probability density formula of the normal distribution, we can determine value,
\(f(3,4,2) = \frac{1}{2\sqrt{2 \pi}} e^{\frac{-(3-2)^2}{2 \times2^2}}\)
Which is to say, the answer is f (3, 4, 2) = 1.106.
Ques: With the given values: mean = 4, the standard deviation = 2, and x = 3’ determine the probability density function for the normal distribution. (3 Marks)
The mean is denoted by, μ = 4
The Standard deviation is denoted by, σ = 2
The Random variable is denoted by, x = 3.
Now, as we already know the normal distribution formula, we can say,
\(f(x) = \frac{1}{\sigma\sqrt{2 \pi}} e^{\frac{-(x-\mu)^2}{2 \sigma^2}}\)
Now, after we replace the values in the formula, we will obtain the following results,

Thus, the probability density function for the normal distribution is 0.17603.
Ques: What should be the GMAT score of a person if they want to appear in the highest 5%? (the mean is, μ = 527, while the standard deviation is, σ = 112) (3 Marks)
The standard deviation is, σ = 112
After applying Normal Distribution, we will get,
\(f(x) = \frac{1}{\sigma\sqrt{2 \pi}} e^{\frac{-(x-\mu)^2}{2 \sigma^2}}\)
Therefore, it can be said, P(X > ?) = 0.05 ⇒ P(Z > ?) = 0.05
P(Z < ?) = 1 - 0.05 (substituting each side)
= 0.95
⇒ Z = 1.645
Now, after Z is determined,
X = 527 + 1.645 (112)
X = 527 + 184.24
Hence, X = 711.24
The answer is 711.24.
Ques: After taking a test, a bunch of students were notified that the final grades have a mean of 70, with a standard deviation of 10. Now, assuming that you can approximate the total distribution of the grades the students acquired, determine the percentage of students who secured scores higher than 80? And what percent should fail the test, having grades < 60? (3 Marks)

(i) Considering the following data, we get,
As per the equation, let’s assume, x = 80, z = 1
Since the area to right (higher than) is, z = 1, then it is equal to 0.1586, which is = 15.87%
Thus, about 15.87 per cent scored more that 80 in the test.
(ii) As per the question, it can be said that,
=> Let’s assume, x = 60, and z = -1
Now, considering the equation, the area to the right of z = -1 can be found equal to 0.8413 = 84.13%
Thus, about 84.13 percent should pass the test in total.
Ques: Forest fires burn an average of 4,300 acres per year in a country, with a standard deviation of 750 acres. Assuming that the number of acres burned is distributed normally, how likely is it that between 2,500 and 4,200 acres of land will be burned each year? (3 Marks)
And, the mean is, μ = 4300
Now, z can be determined by,
For, 2500 acres =>
Z = 2500 - 4300 / 750
= - 2.40
For 4200 acres =>
Z = 4200 - 4300 / 750
= - 0.13333
Thus, P(2500 < X < 4200)
= P (-2.40 < Z < - 0.13) P (-2.40 < Z < -0.13) (which gives a value stated below)
= P(Z < -0.13) - P(Z < -2.40)
Therefore, P(-2.40 < Z < -0.13)
= 0.4483 - 0.0082
= 0.4401
Thus, the answer is 0.4401.
Ques: Assuming that X is a variable belonging to a normal distribution which has the given values: mean, μ = 30 and standard deviation, σ = 4. Determine the value of P(x < 40). Consider the standard under the normal distribution curve, (3 Marks)
Ans: Considering the variable X, we get the given values from the equation,
The mean, μ = 30
And standard deviation, σ = 4
Thus, it can be said, x = 40,
And the z-value,
Thus z = (40 - 30) / 4
= 2.5
That being said, P (x < 40)
= P(z < 2.5) = [which can be plotted on the left side of 2.5]
= 0.9938
Therefore, the answer is 0.9938.
Also Read:



Comments