



Content Curator
Sample size is used in market research for defining the number of individuals considered to conduct a research. Statistics is a study of the process of collecting, organizing, analyzing, summarizing data and drawing inferences from the data to work on. Population data and sample data are two main types of data. Population data is a large amount of data that consists of all elements that is required for research. Sample data is a part of population. It is difficult to compute the large population; therefore, samples are selected from the population which helps in conducting research.
| Table of Content |
Key Terms: sample size, statistics, sampling, sample size formula, mathematics, research, research methodology, collection of data
Also read: Isosceles Triangle Theorems
What is Sample Size?
[Click Here for Sample Questions]
The sample size is defined by the number of observations considered during an experiment or a research. Sample size is a group of subjects that are selected from the large population and is considered as representative of the real population for that specific research. Sample size is denoted by n, NN or SS.
Researchers choose the samples based on demographics such as age, gender, location etc. It can be indefinite or specific. For example, you may want to know the review of your product from only people aged 18 to 25. Or, you may want your sample to consider from the whole state which provides you a wide range of population.
To predict how the population of a specific age group will react to a new product, first test it on a simple size that represents the targeted population. In that case, the sample size will be the number of people in that age group that will be surveyed.
Also read: Differential Equation
Importance of Sample Size
[Click Here for Sample Questions]
The purpose of any survey or research is to understand the target audience and derive better conclusions. Survey on the whole population is not possible as it is time consuming and expensive. A good sample is smaller than the population and is capable of providing accurate information about the population in a short time and at a much lower cost.
Knowing how to determine a sample size is not enough to conduct a variable as there are many factors that can affect the result of the survey. If the sample size is too big, then it can waste resources, time and money. If the sample size is too small it cannot gain maximum insights, leading to inaccurate results. Therefore determining the accurate sample size is very important in research methodology.
Also read: Difference between Sequence and Series
Factors Used in Sample Size
[Click Here for Sample Questions]
There are some factors that are taken under consideration before determining the sample size of a particular experiment or research.
- Size of the population: population size is the entire number of individuals from the population. For the small populations, we use a finite population correction formula. Population size doesn’t always have to be big. Smaller population size can also give you accurate results as long as you know the target audience.
- Standard Deviation: if the survey is already conducted, how much variance do expect in the responses? That variation in the response is called standard deviation. It is the measure of the dispersion of a data set from its mean and it measures the absolute variability of a distribution. As the value of dispersion or variability increases, the value of standard deviation also increases.
- Confidence level: confidence level tells the accuracy of data. It tells you how sure you can be that your data is accurate. It is aligned to the confidence interval and expressed as a percentage. For example, if your confidence level is 95%, your result will likely be 95% accurate.
- Z value: Z value is determined based on the confidence level. Confidence levels are all standardized. Here the Z- value for commonly used confidence levels.
| Confidence level | Z-value |
|---|---|
| 80% | 1.28 |
| 85% | 1.44 |
| 90% | 1.65 |
| 95% | 1.96 |
| 99% | 2.58 |
- The margin of error or confidence interval: No survey guarantees 100% accuracy. It describes how close you can reasonably expect a survey result to fall relative to the value of real population. The margin of error is defined as a small amount of error that is allowed in case of miscalculations or change of circumstances. It is the plus or minus number that is reported with an estimated percentage (e.g., ± 2 percent).
Sample Size Formula
[Click Here for Sample Questions]
There is no specific rule to select a sample size but, some researchers support a rule of thumb while using the sample size. For example, in regression analysis it is said to have at least 10 observations per variable. Therefore, for three independent variables, minimum sample size is 30. Some researchers follow the formula to find out the sample size.
Formula:
The sample size for an infinite population is given by,
SS1 = Z2p(1-p)C2
The sample size for finite population is given by,
SS = SS11+ SS1pop
Where, Z = Z – value
p = percentage of population (assumed as 50% or 0.5)
C = confidence level
Pop = population
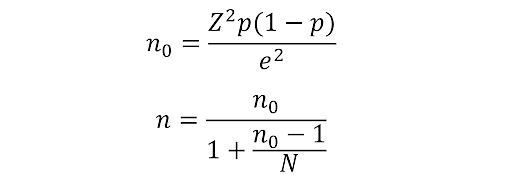
The standard formula for sample size (Cochran’s formula) is given by,
Important Terms To Consider Before Determining Sample Sizes
[Click Here for Sample Questions]
- Goals and objectives: the sample size will be critical if you’re going to do the survey on a large population. So it has to be balanced and should reflect the community as whole. Researchers should know the goal or target audience before conducting the survey.
- Precision level: The sample size determination should be exact if you’re going to spend millions based on the survey results. You need to be more accurate, have larger samples and have to represent the overall population.
- Confidence level: your confidence level numbers are important from the perspective of risk. The confidence percentage you choose has a big impact on the number of completions you need for accuracy. It can increase the survey's length and responses you need which means increase in cost of the survey. You have to determine if the increase in accuracy is more important than the cost.
- Population variability: if you’re surveying customers on a broad topic, it may have a lot of variations and you need a larger sample size to get a more accurate picture of population. More variability means more samples and less variability means less samples. If you are not sure then you can start with 50% variability.
- Response rate: your sample size is the number of responses you must have for a successful survey. Response rate depends on the engagement of the population with your organization or brand.
- Considering actual audience: in addition to the variability of population, you have to consider the actual audience that gets benefited from the results of the survey.
Things to Remember
- The sample size in research can help to find much information about a specific target market or a certain type of customer.
- A good maximum sample size is usually 10% of the population as long as it does not exceed 1000.
- You can obtain more accurate answers with a smaller margin of error, but it requires a larger sample.
- When a larger confidence level is chosen, it shows that the good accuracy provided that the sample size is larger.
- Since the value of standard deviation is difficult to be calculated in an actual survey, it is usually chosen 50% (0.5) as the value which is actually the worst-case scenario.
Also read: First Order Differential Equation
Sample Questions
Ques. What is the sample size in statistics? (1 Mark)
Ans: In statistics, sample size means the number of observations or participants included in a study which helps in determining the characteristics of the whole population.
Ques. What is the effect of increasing the sample size on the sampling error? (1 Mark)
Ans: as the sample size increases, the margin of error gets reduced. This relation between sample size and margin of error is called an inverse because the two move in an opposite direction.
Ques. A study was conducted in a village of 200 farms to find out the cropping pattern. Out of the 50 farms surveyed, 50% farms grew only wheat. Identify the population and the sample in this scenario. (1 Mark)
Ans: population refers to the total items to be studied for a survey. So, the population is 200 farms.
Sample is the representative of the population that is used for statistical study. Only 50 farms are selected for survey out of 200 farms; therefore, the sample size is 50 farms.
Ques. What are the limitations of the calculated sample size? (2 Mark)
Ans: the limitations in calculating the sample size are,
- The sample size always has to be calculated first before conducting any study because it is very important to know the target audience before any survey otherwise it would be of no use.
- Sample size cannot be changed throughout the study as it will give errors in the results.
- Practical issues like cost and administrative issues may change the sample size calculation.
Ques. Explain the thumb rule for sample size. (2 Marks)
Ans: when you don’t have information about population, the sample size is selected according to the thumb rule. The popular thumb rule is taking the sample size 30 which means 30% of the population as a sample size.
For unknown population size, sample size 30 is considered as appropriate. If the sample size ≥ 30 then the distribution will be approximately normal and the sample size will be large enough.
Ques. If the confidence level is 90%, standard deviation is 0.6 and a margin of error is ± 4%, then find out the sample size. (2 Marks)
Ans: Z- value for the 90% population is 1.64
Formula for sample size is N= Z2×StdDev ×(1-StdDev)(margin of error)2
N= (1.64)2×0.6 ×(1-0.6)(0.04)2
N= 0.96480.0016
N= 603
Therefore, the sample size for the given population is 603.
Ques. What is standard deviation? (2 Marks)
Ans: standard deviation is the measure of the amount of variation of a set of values. It can be thought of as the average distance of the observed data from the expected values. A low standard deviation indicates that most of the numbers are close to average and a high standard deviation indicates that the numbers are more spread out.
Ques. Which method gives better results: Census or Sample? Explain in detail. (3 Marks)
Ans: Sample method gives better result than census method due to following reasons.
- Accuracy: Although the census method provides more accurate and reliable results, in the sample method the errors can be easily located and rectified in the sampling methods due to the smaller number of items. Hence, the sample method is more efficient.
- Less time and energy: As the sample method involves study of fewer items of the population, it saves time and energy of the researcher.
- Cost Efficient: in sample the cost of approaching all individuals and collection of data is lower compared to census due to small size sample.
- Lesser Non-sampling errors: the probability of non-sampling errors is low in sampling method.
- More efficient: As the sample size is small, the small teams of enumerators can be formed and the team can work more efficiently than the team engaged in the census method.
Ques. Find out the sample size for a population of 100000. Where, confidence level is 95% and margin of error is 5%. (3 Marks)
Ans: we will calculate the sample size for infinite size first and then will adjust it to the required size.
Z value for the 95% of confidence level is 1.96 in the Z-table.
Margin error is given as C = 0.05
Let’s assume percentage of population p = 0.5
Pop=100000
Formula for infinite sample size is SS1 = Z2p(1-p)C2
SS1 = 1.962(0.5)(1-0.5)(0.05)2
SS1 = (3.8416)(0.25)0.0025
SS1 = 384.16
By aggregating the value to the nearest integer we have a sample size of 385.
Ques. Find the sample size for a finite and infinite population when the percentage of 4300 population is given as 0.05. Take confidence level as 99 and confidence interval as 0.01. (3 Marks)
Ans: Z value for the 99% of confidence level is 2.58 in the Z-table.
P=0.05
C=0.01
Pop=4300
Formula for infinite sample size is SS1 = Z2p(1-p)C2
SS1 = 2.582(0.05)(1-0.05)(0.01)2
SS1 = 3161.8
Now, formula for finite sample size is SS = SS11+ SS1pop
SS = 3161.81+ 3161.84300
SS = 852
Therefore infinite sample size for the given population is 3161.8 and finite sample size for given population is 852.
Also Read:



Comments