



The NCERT Notes for Class 11 Informatics Practices Chapter 5 Understanding Data help students revise data collection, storage, processing and basic statistics for the 2026-27 CBSE session. The PDF covers structured data, unstructured data, metadata, mean, median, mode, range and standard deviation.
- PDF included: 20 plus pages with diagrams, examples, tables and revision checks.
- Best for: school tests, practical data-analysis basics and quick statistics revision.
- Chapter focus: converting raw facts into useful information for decisions.
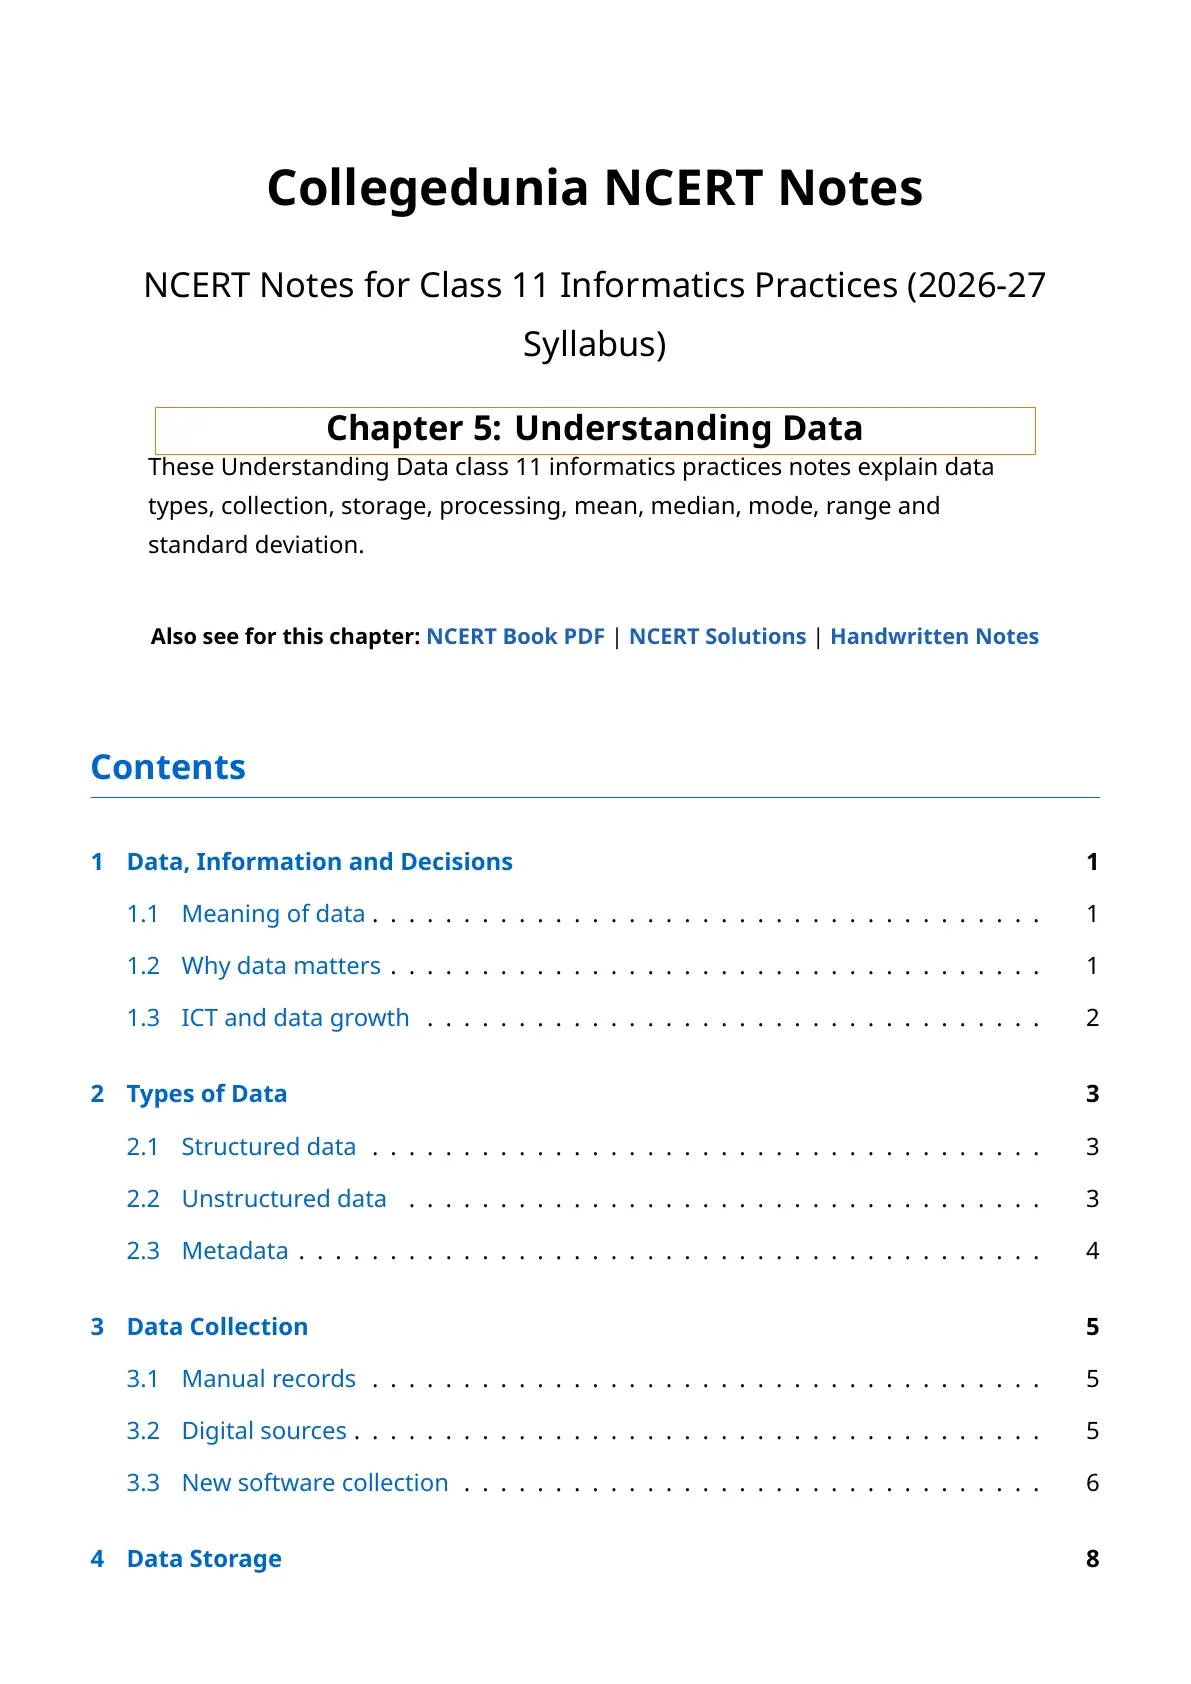
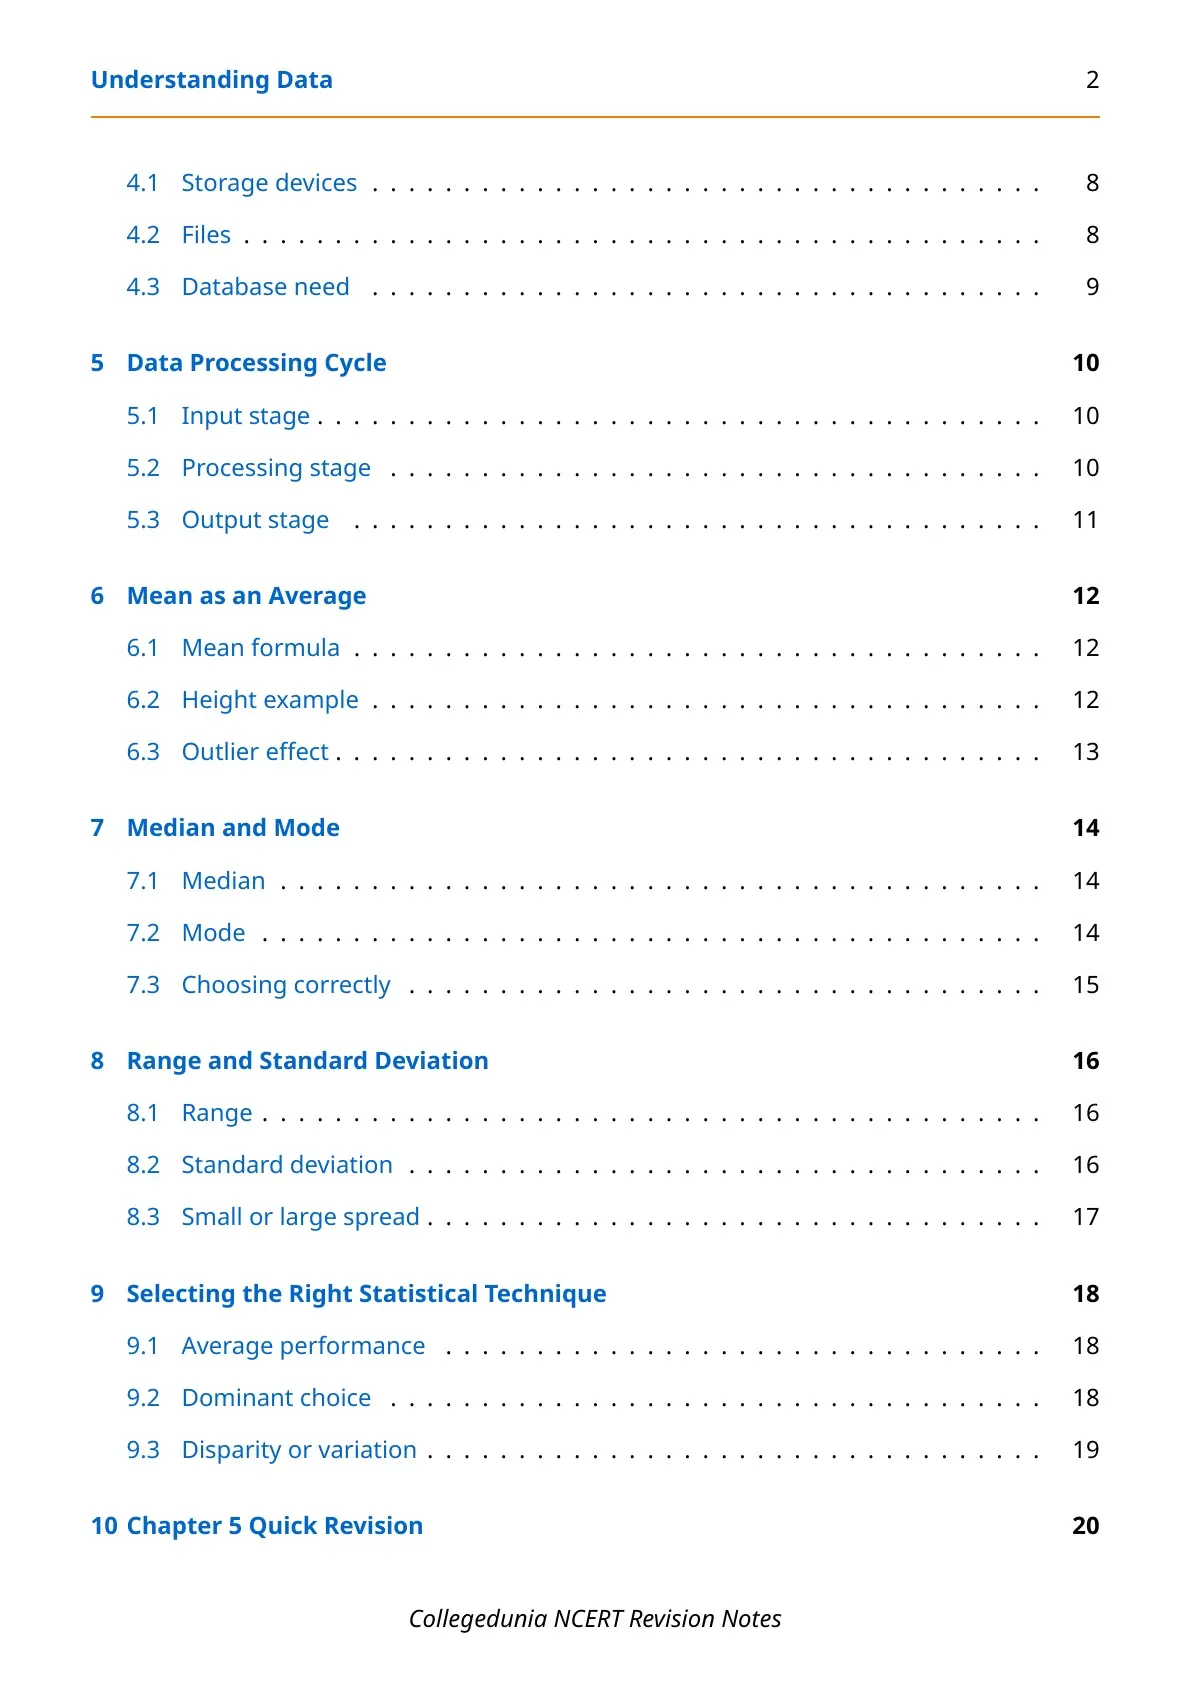
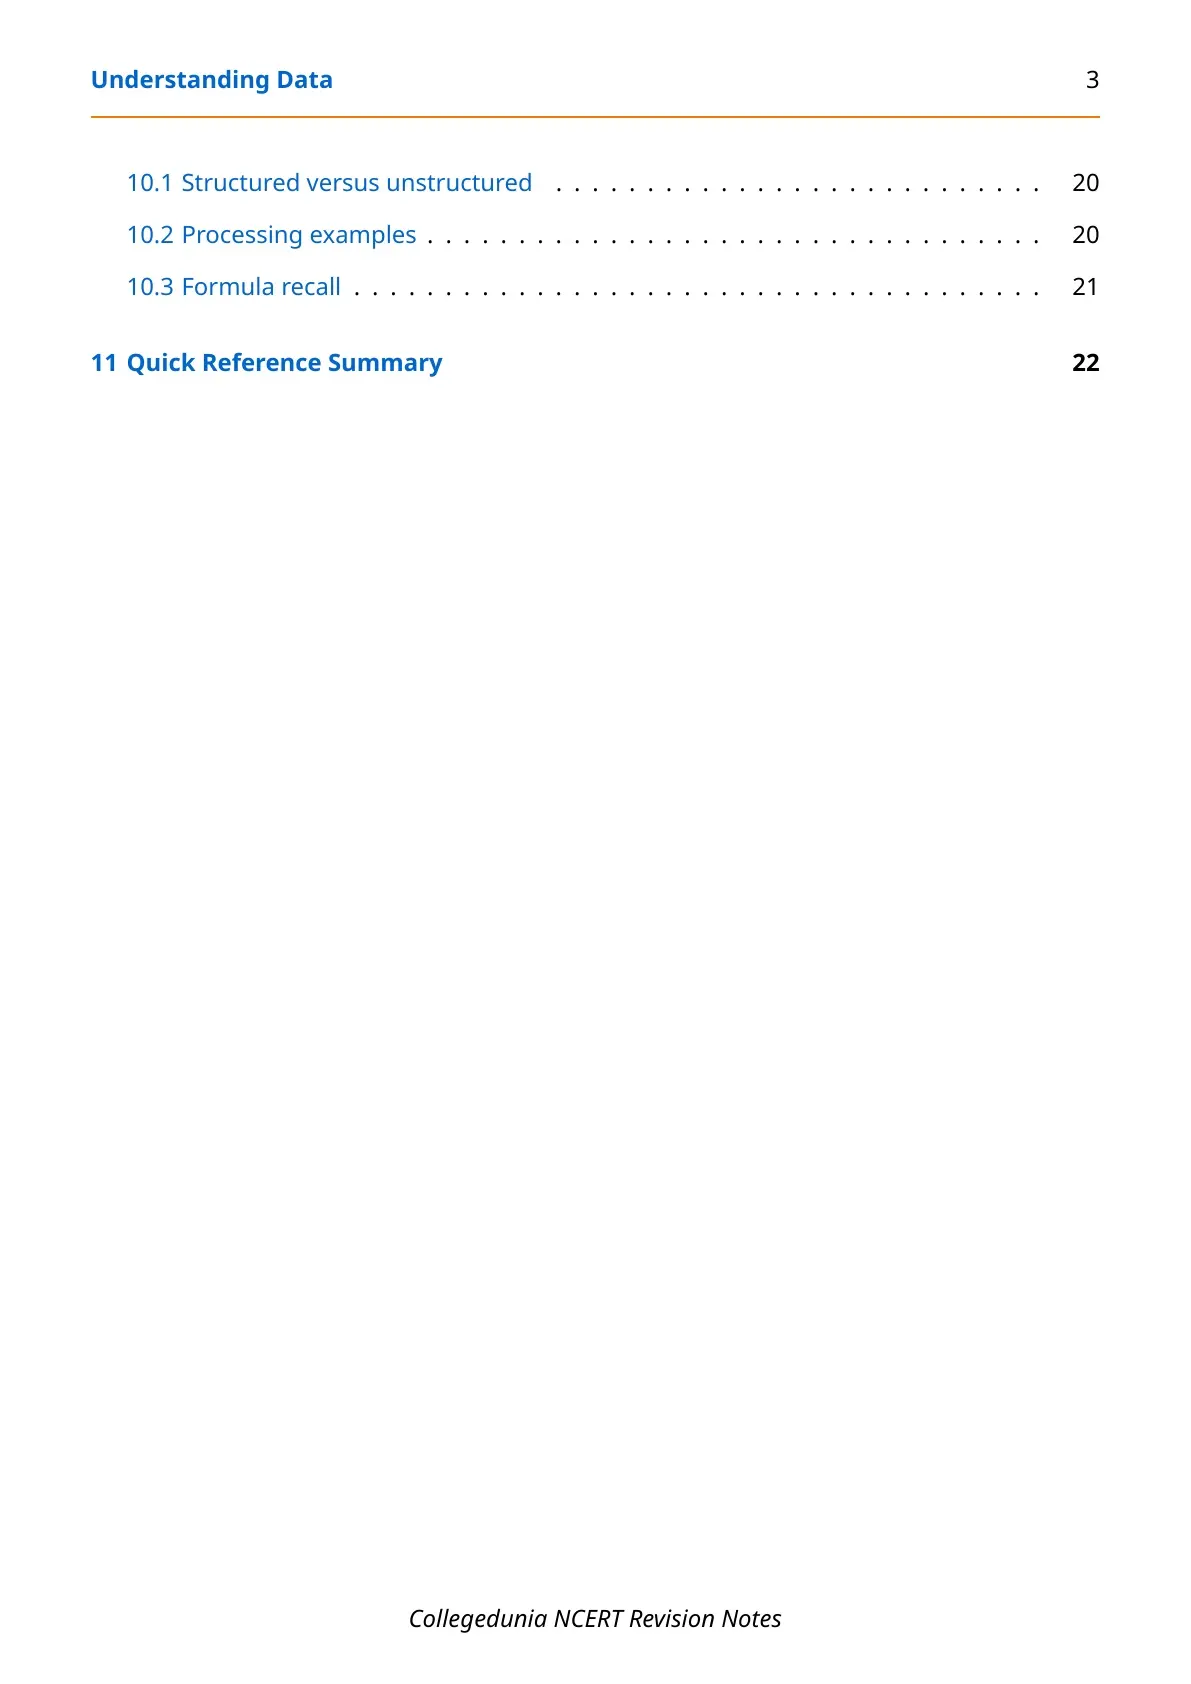
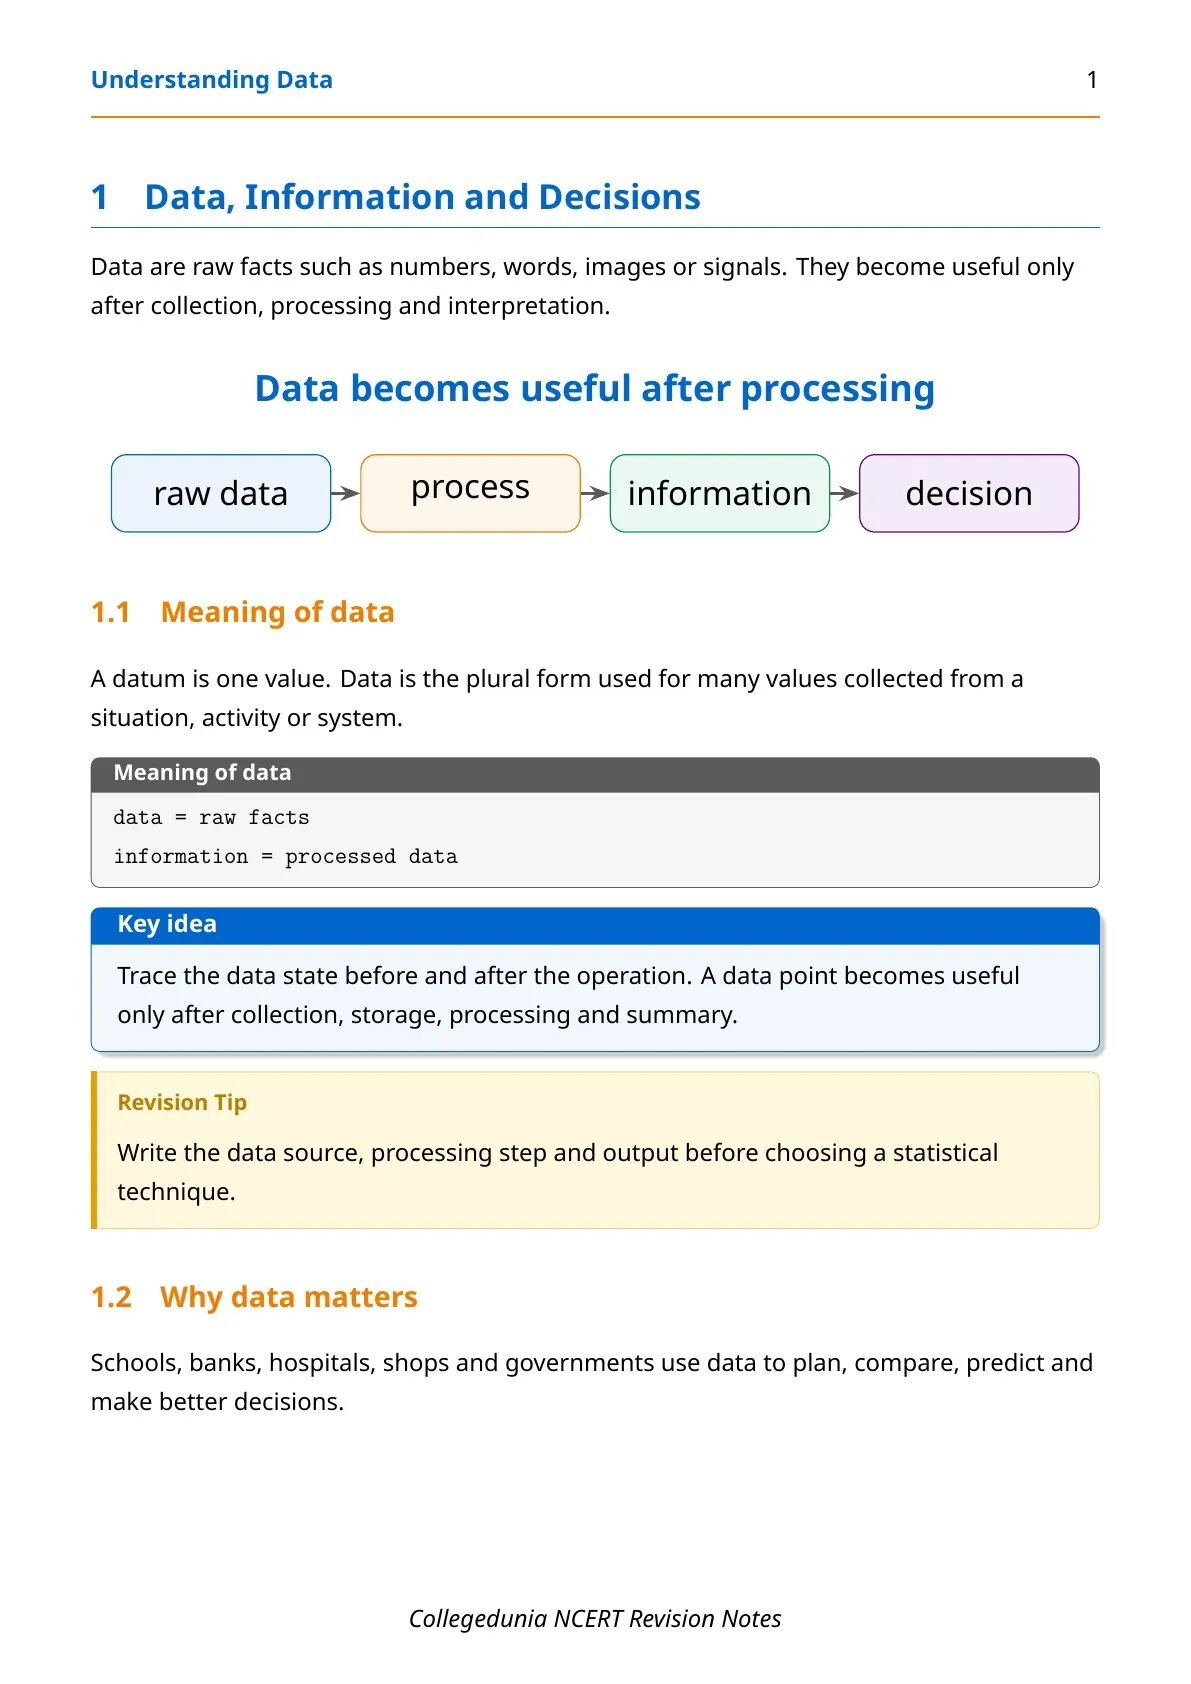
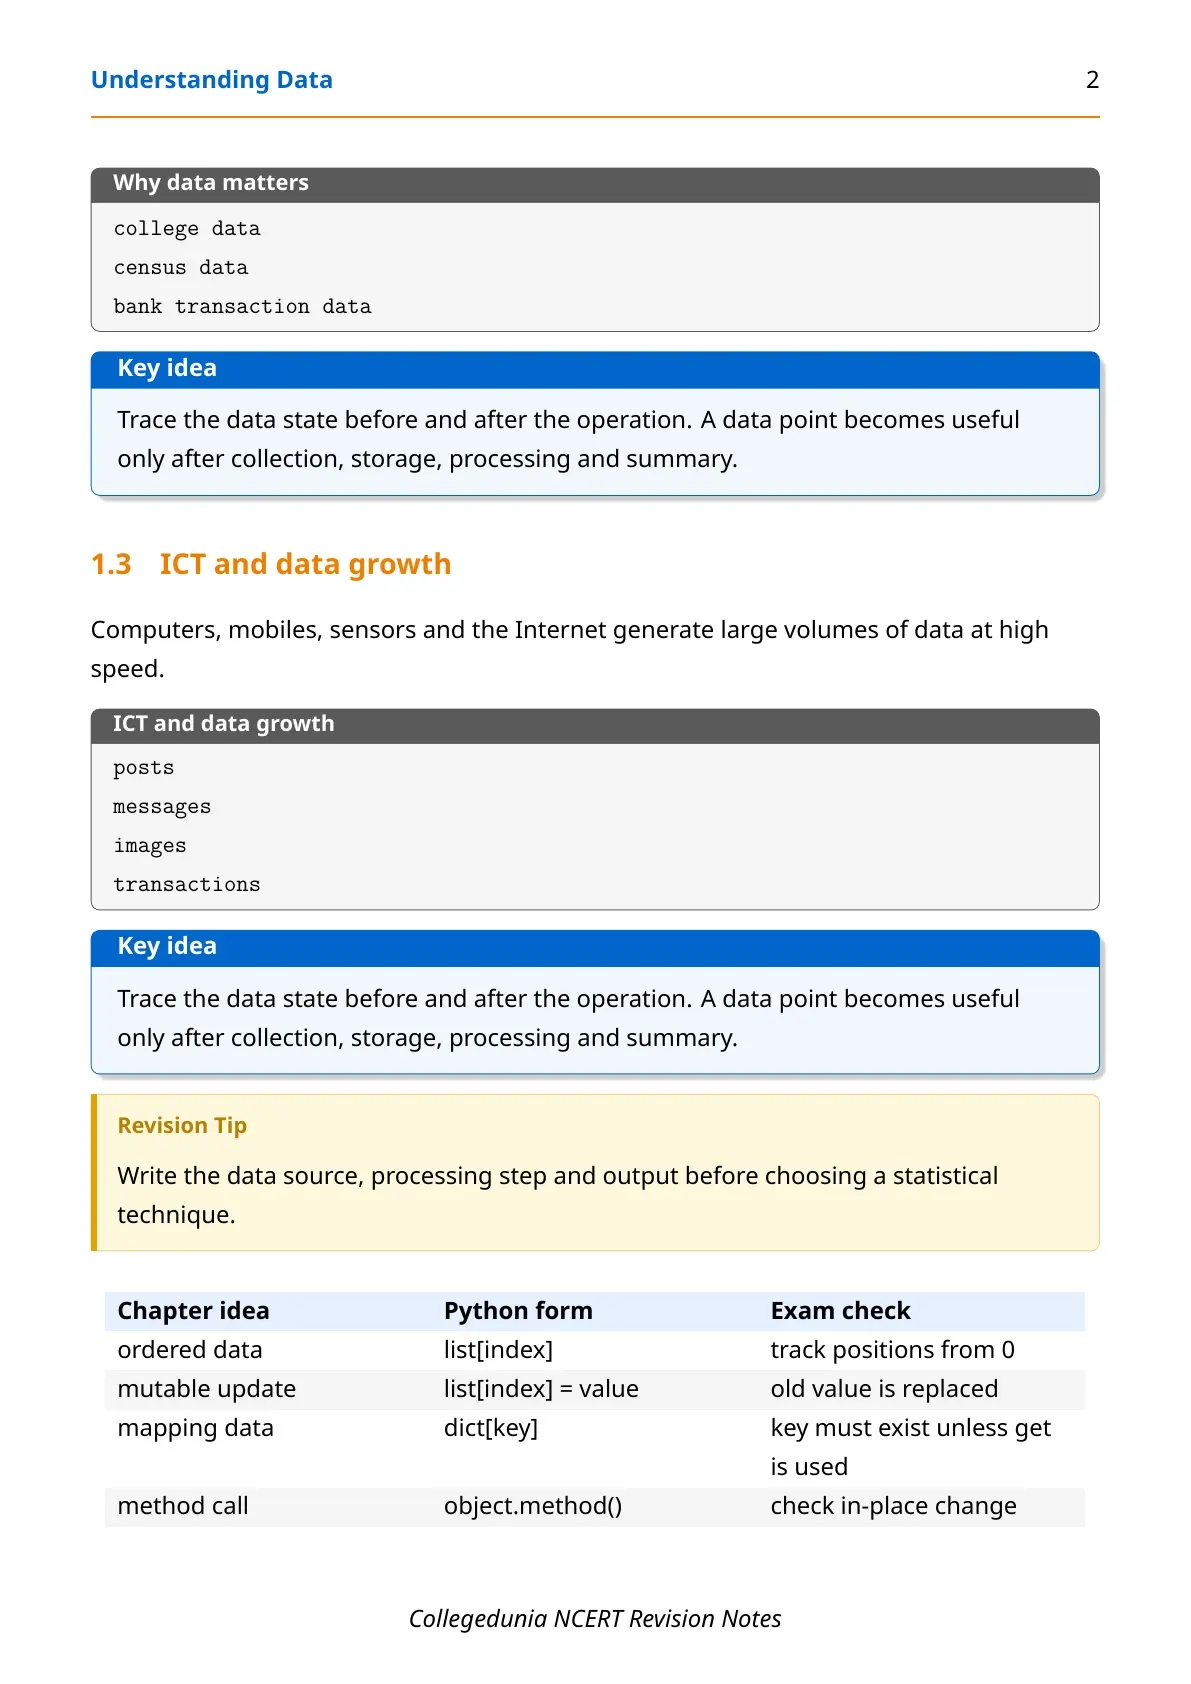
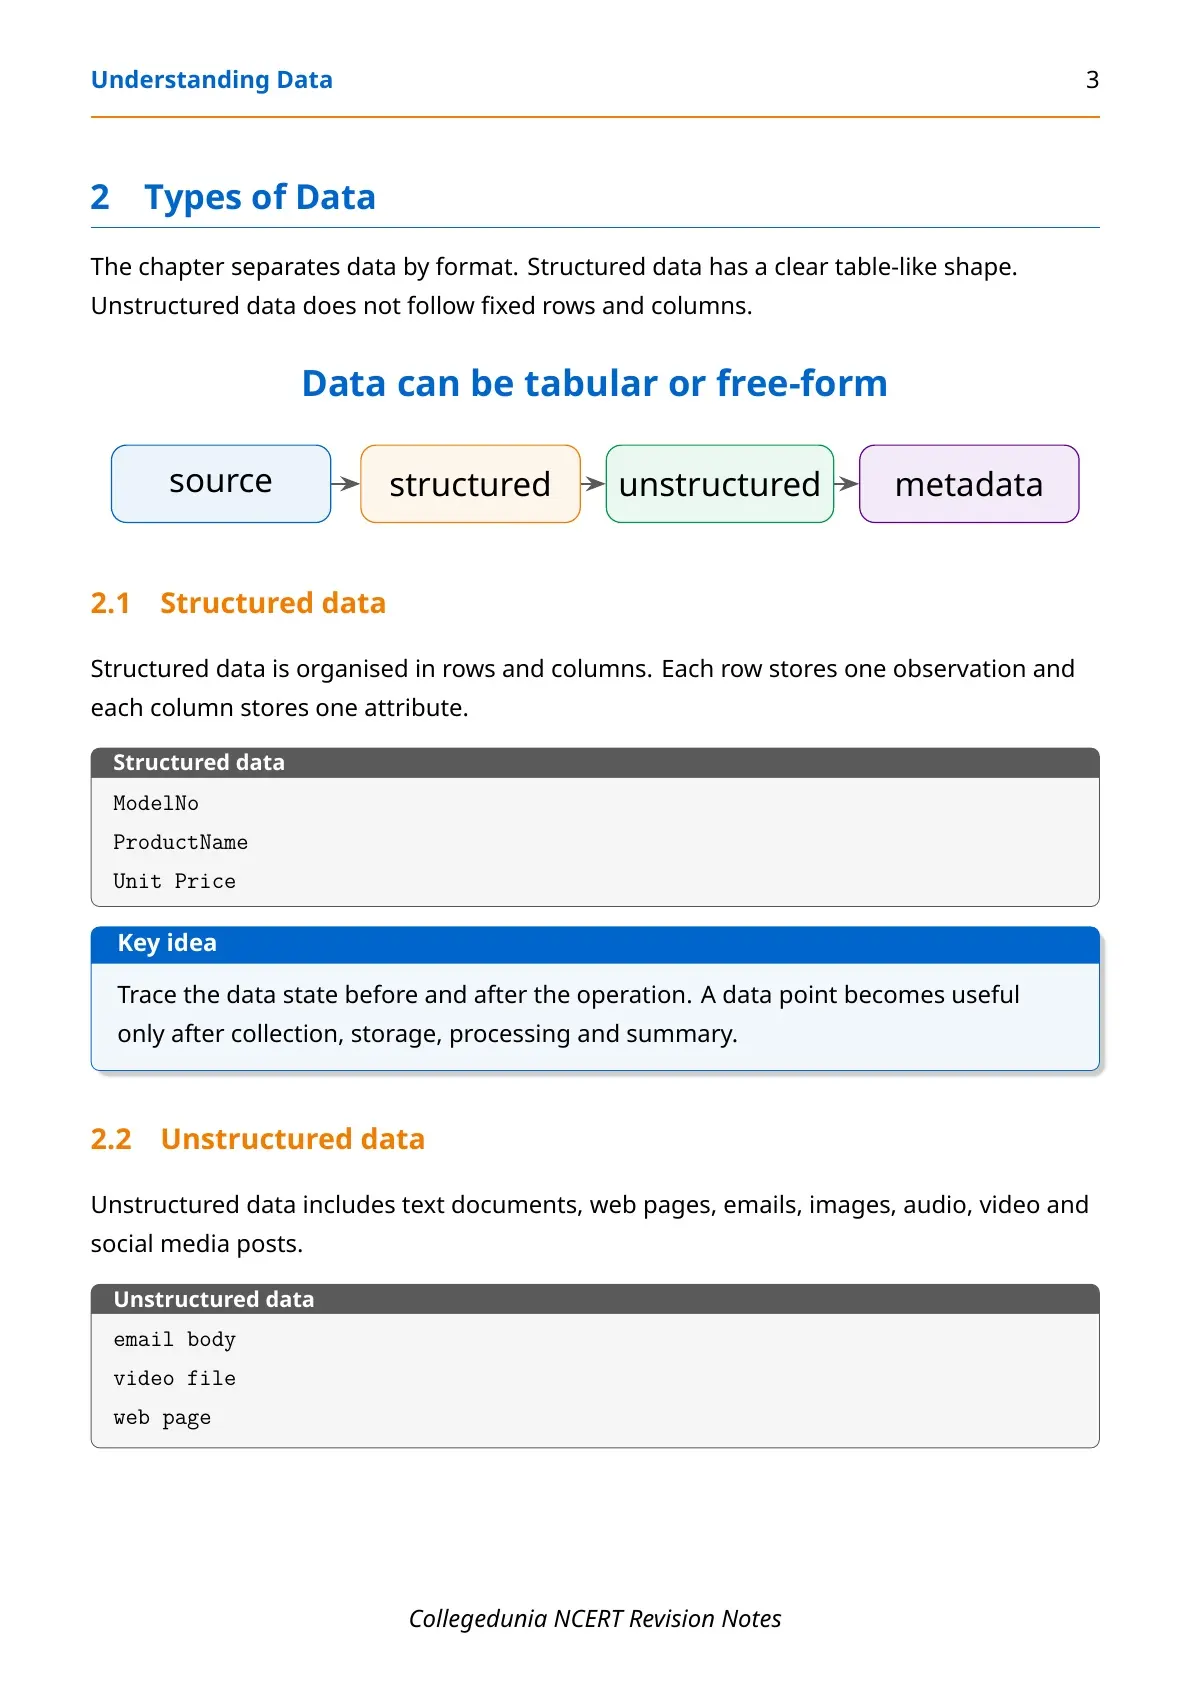
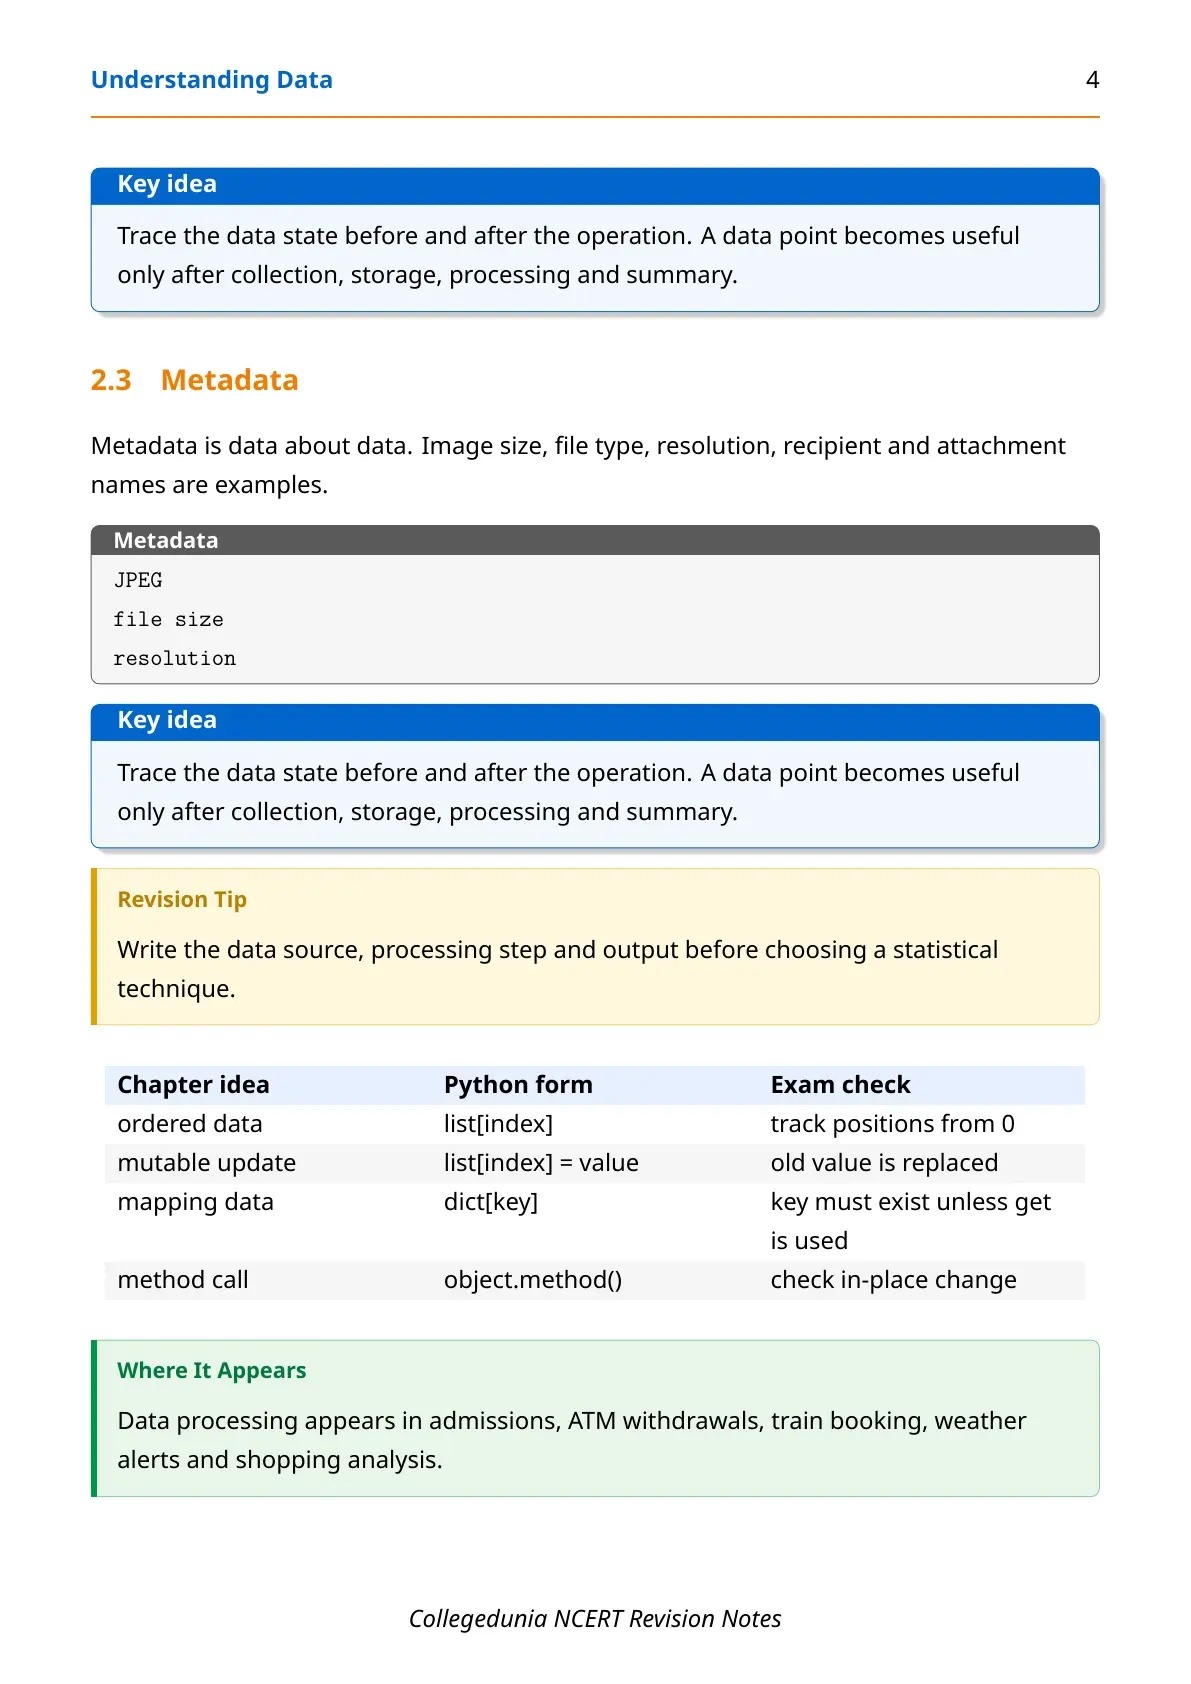
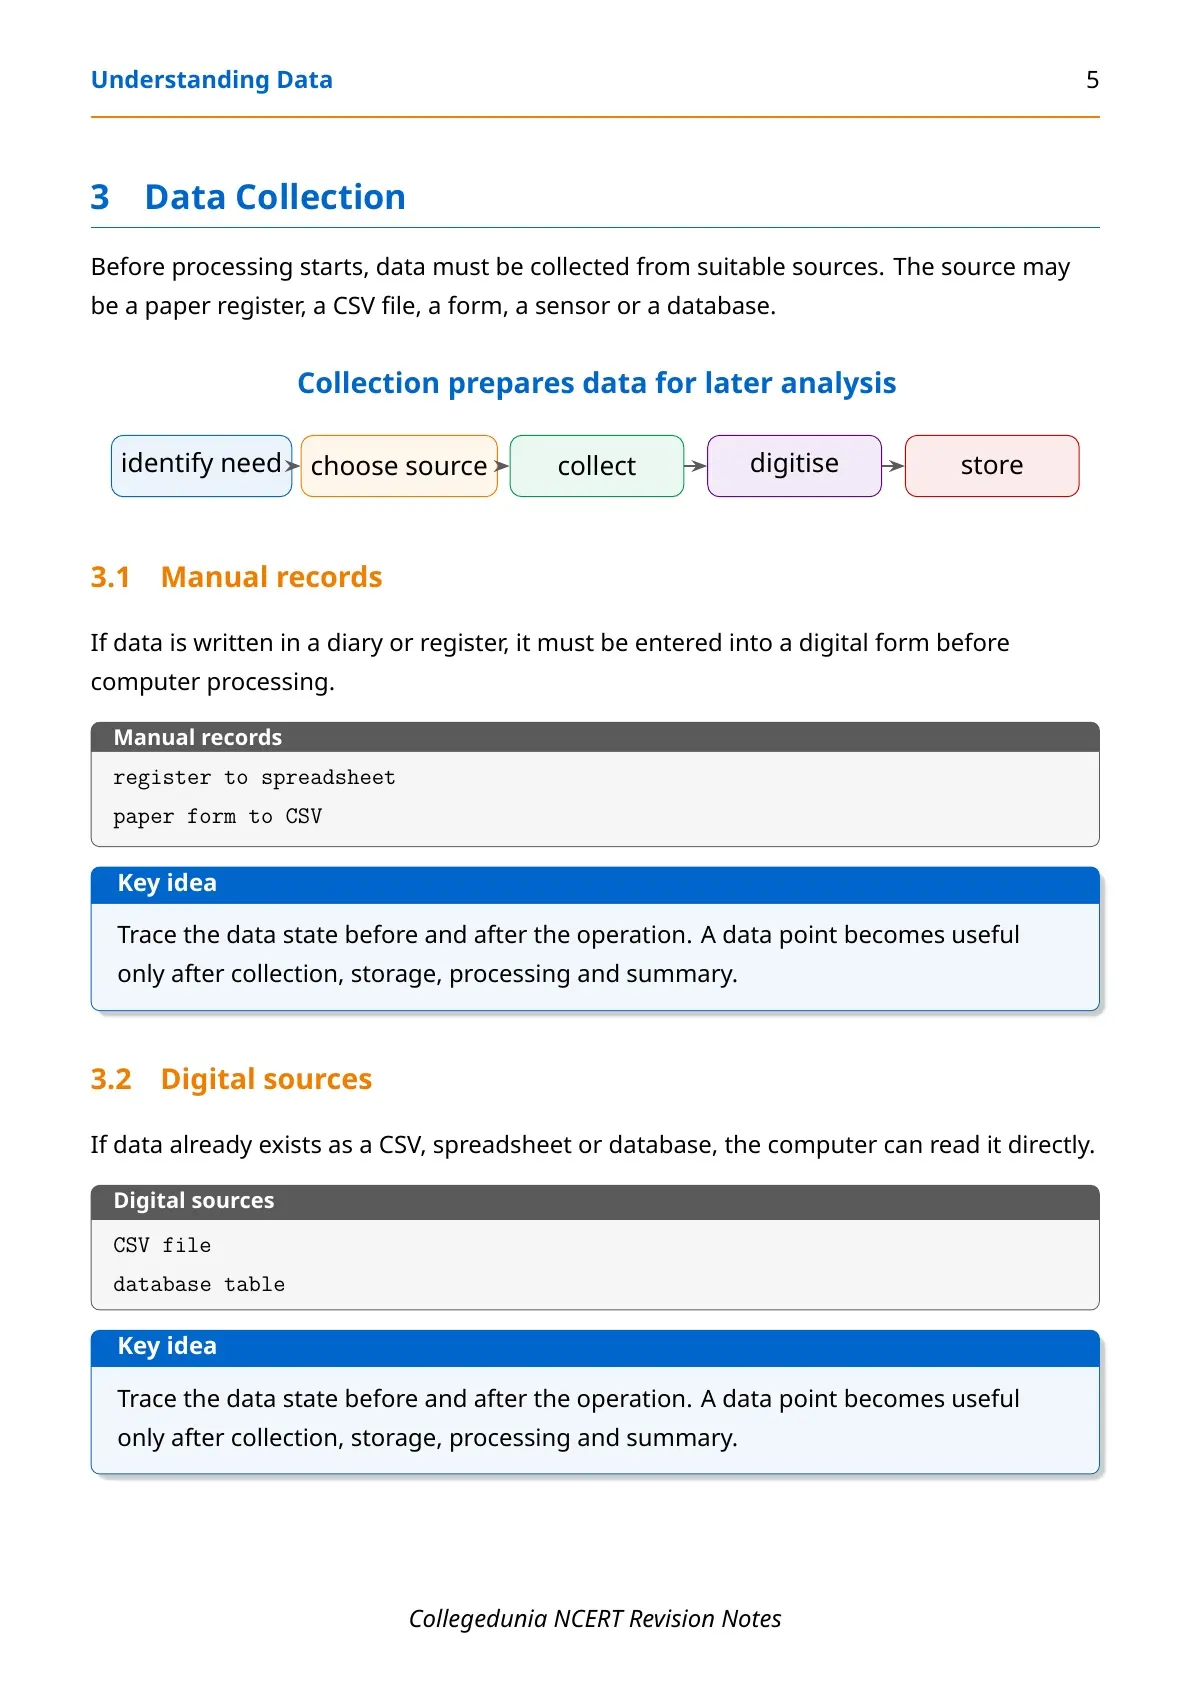
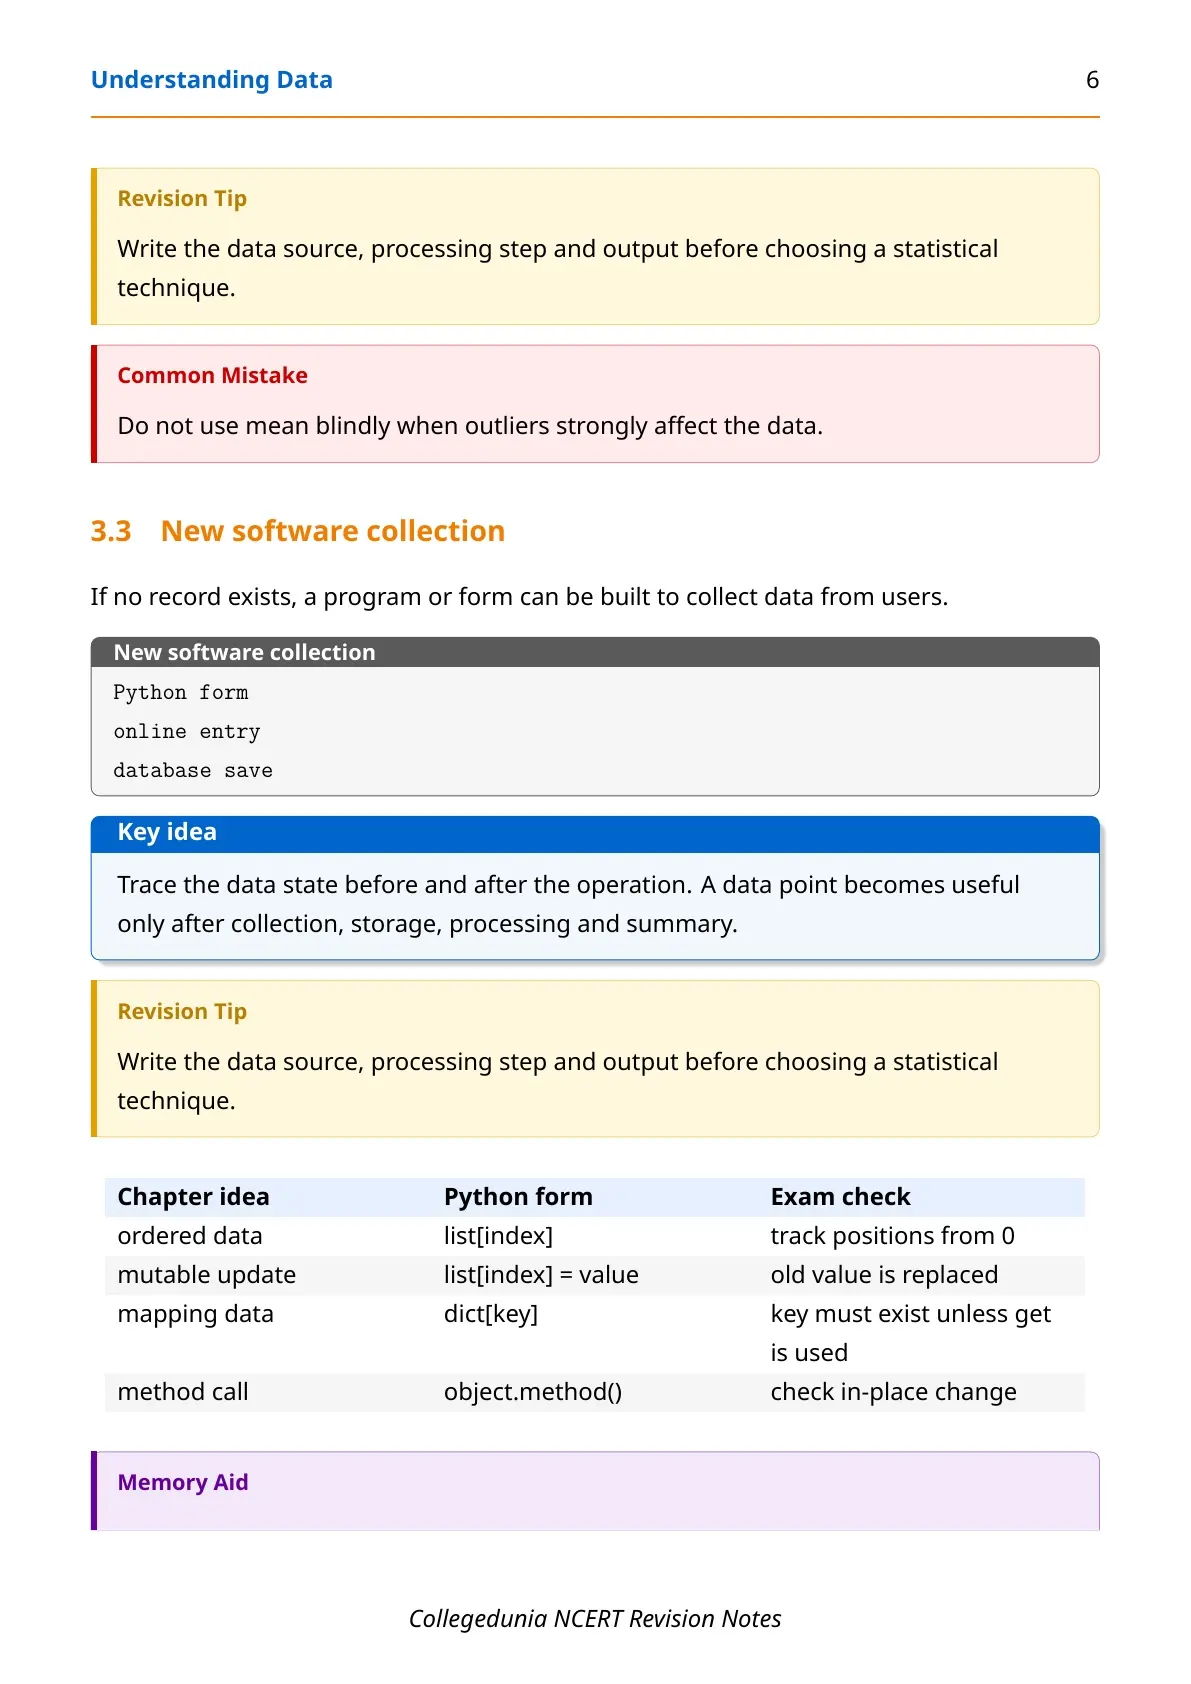
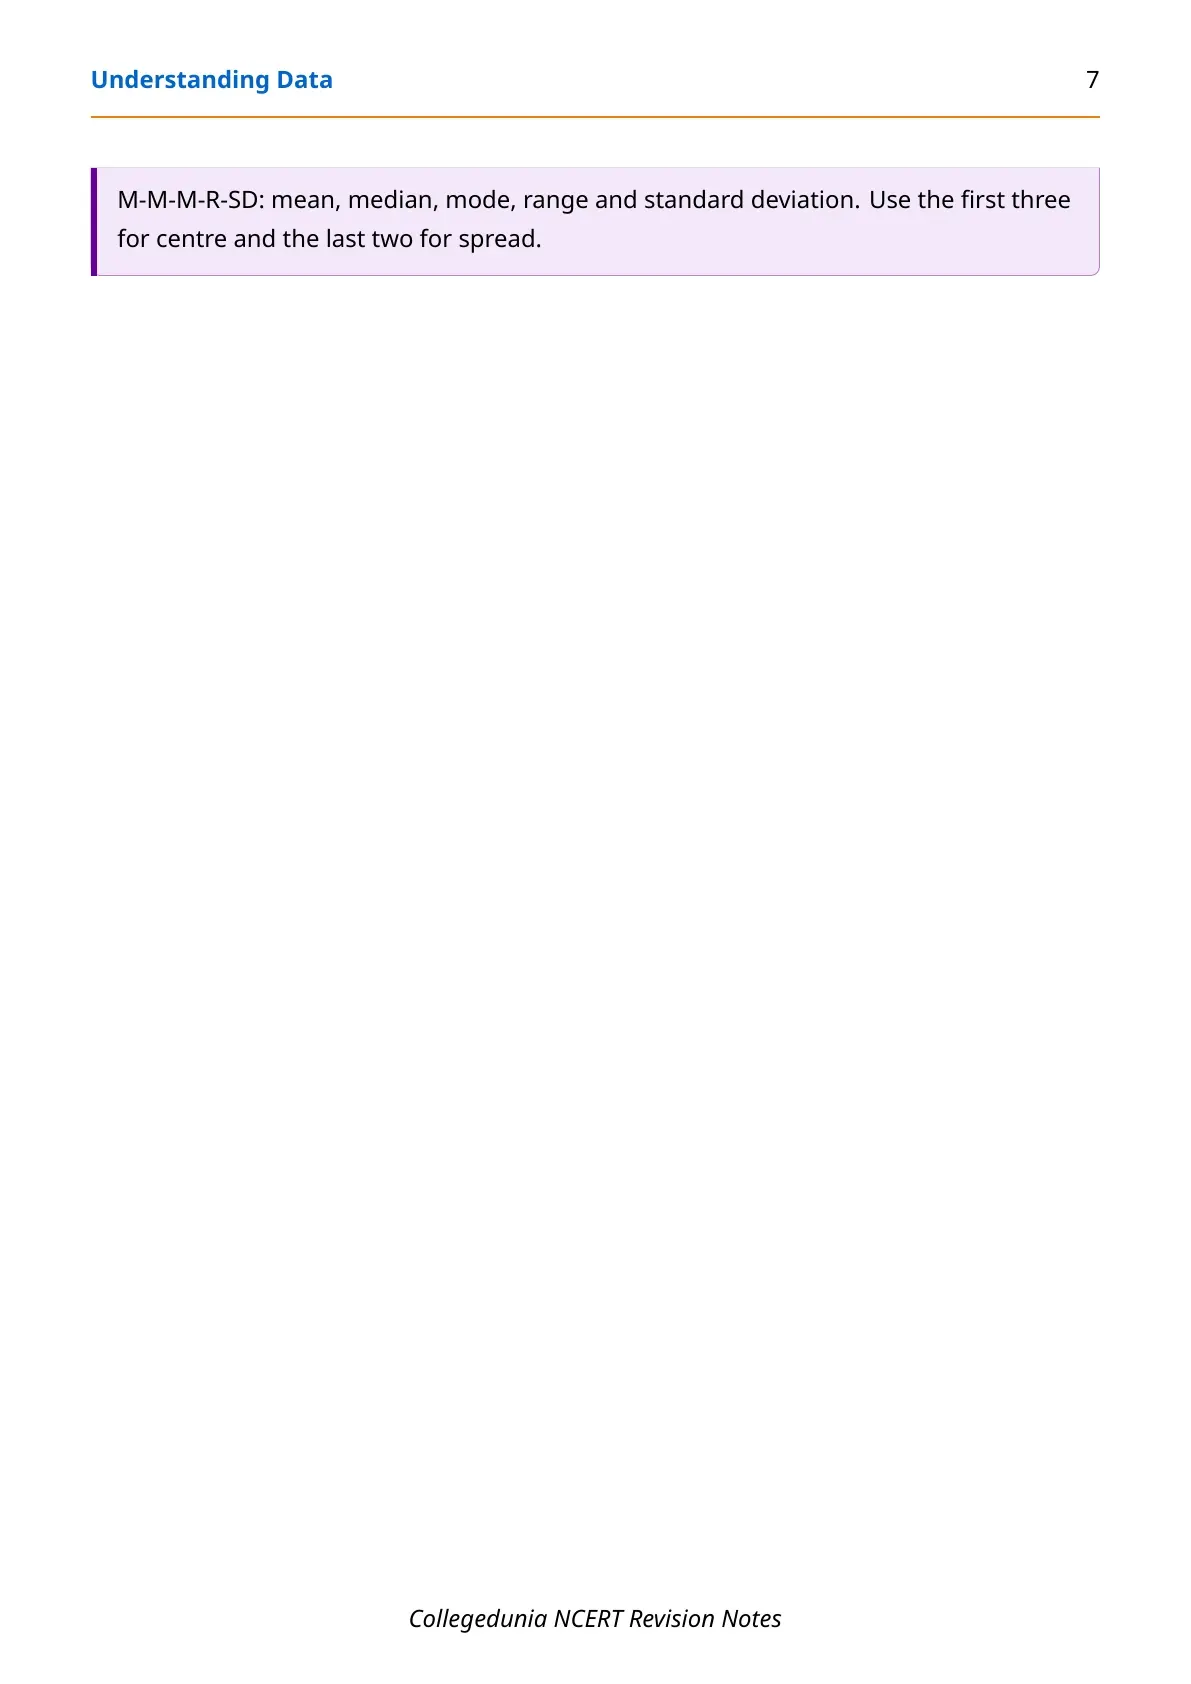
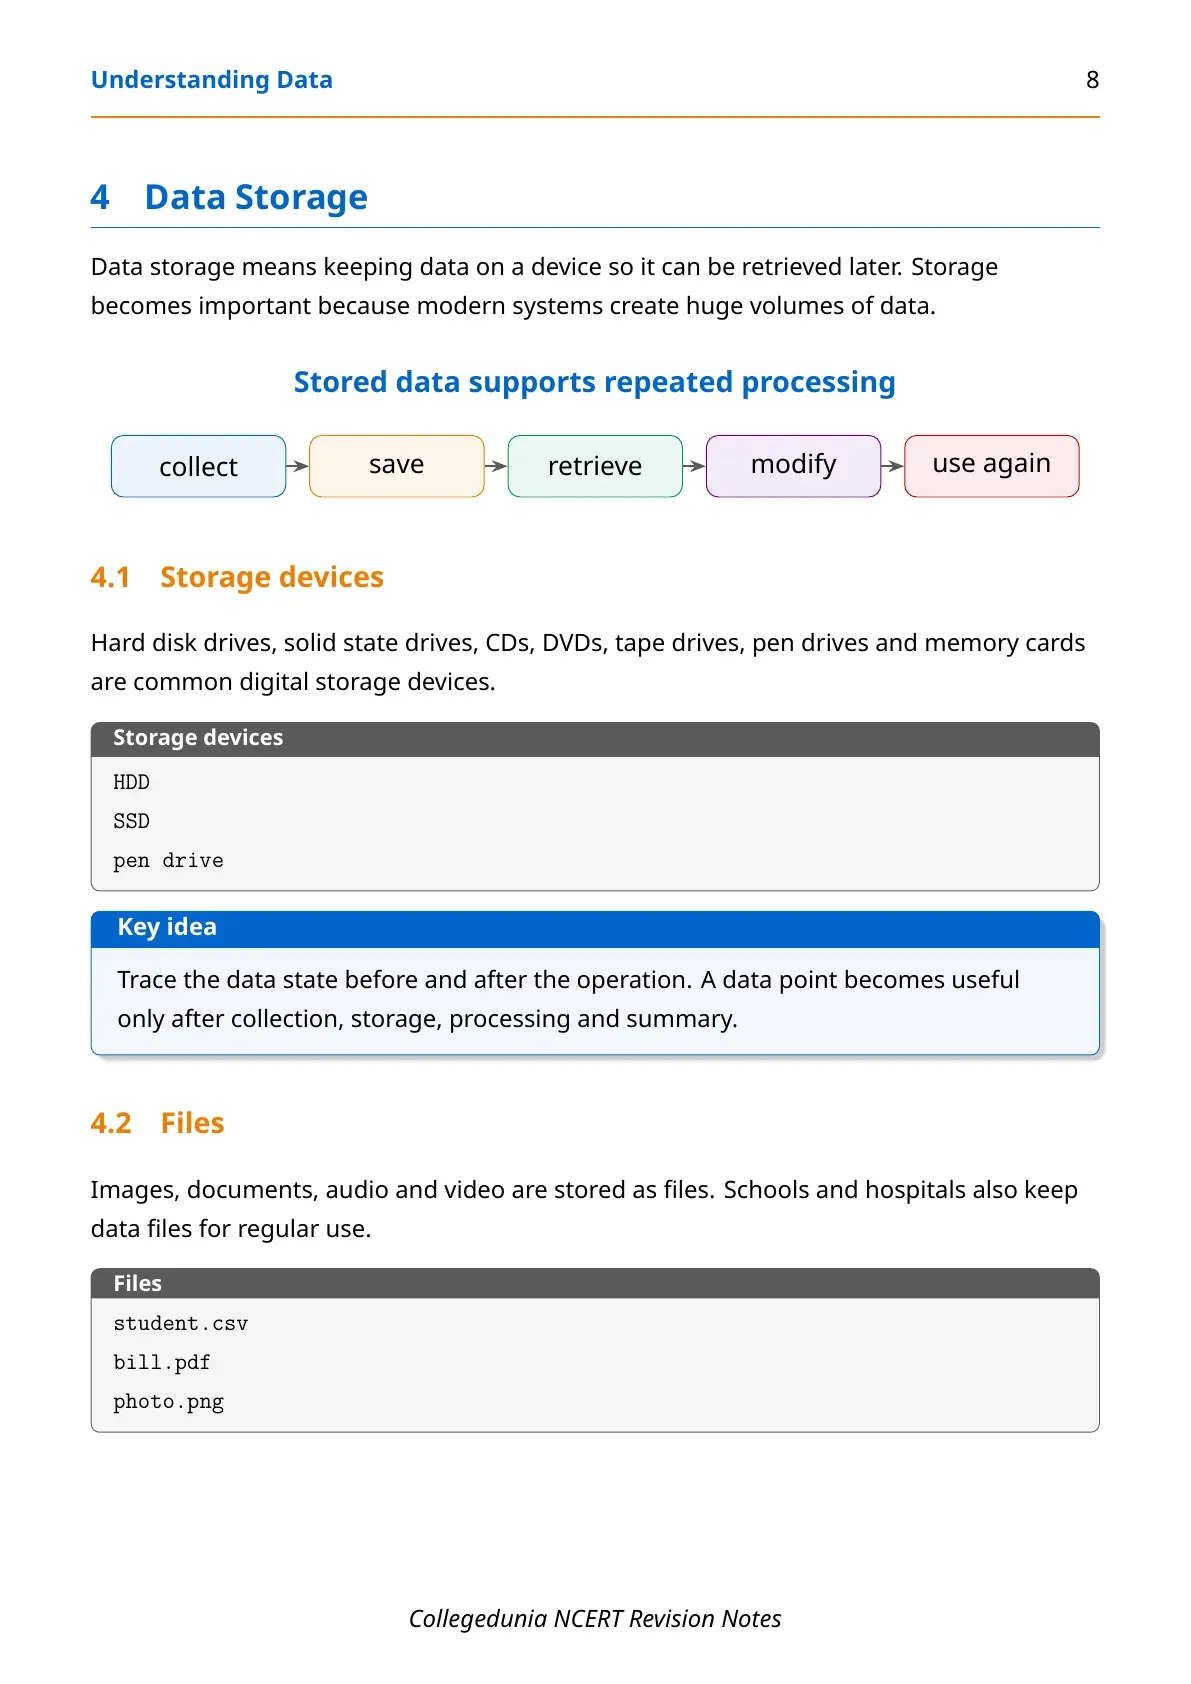
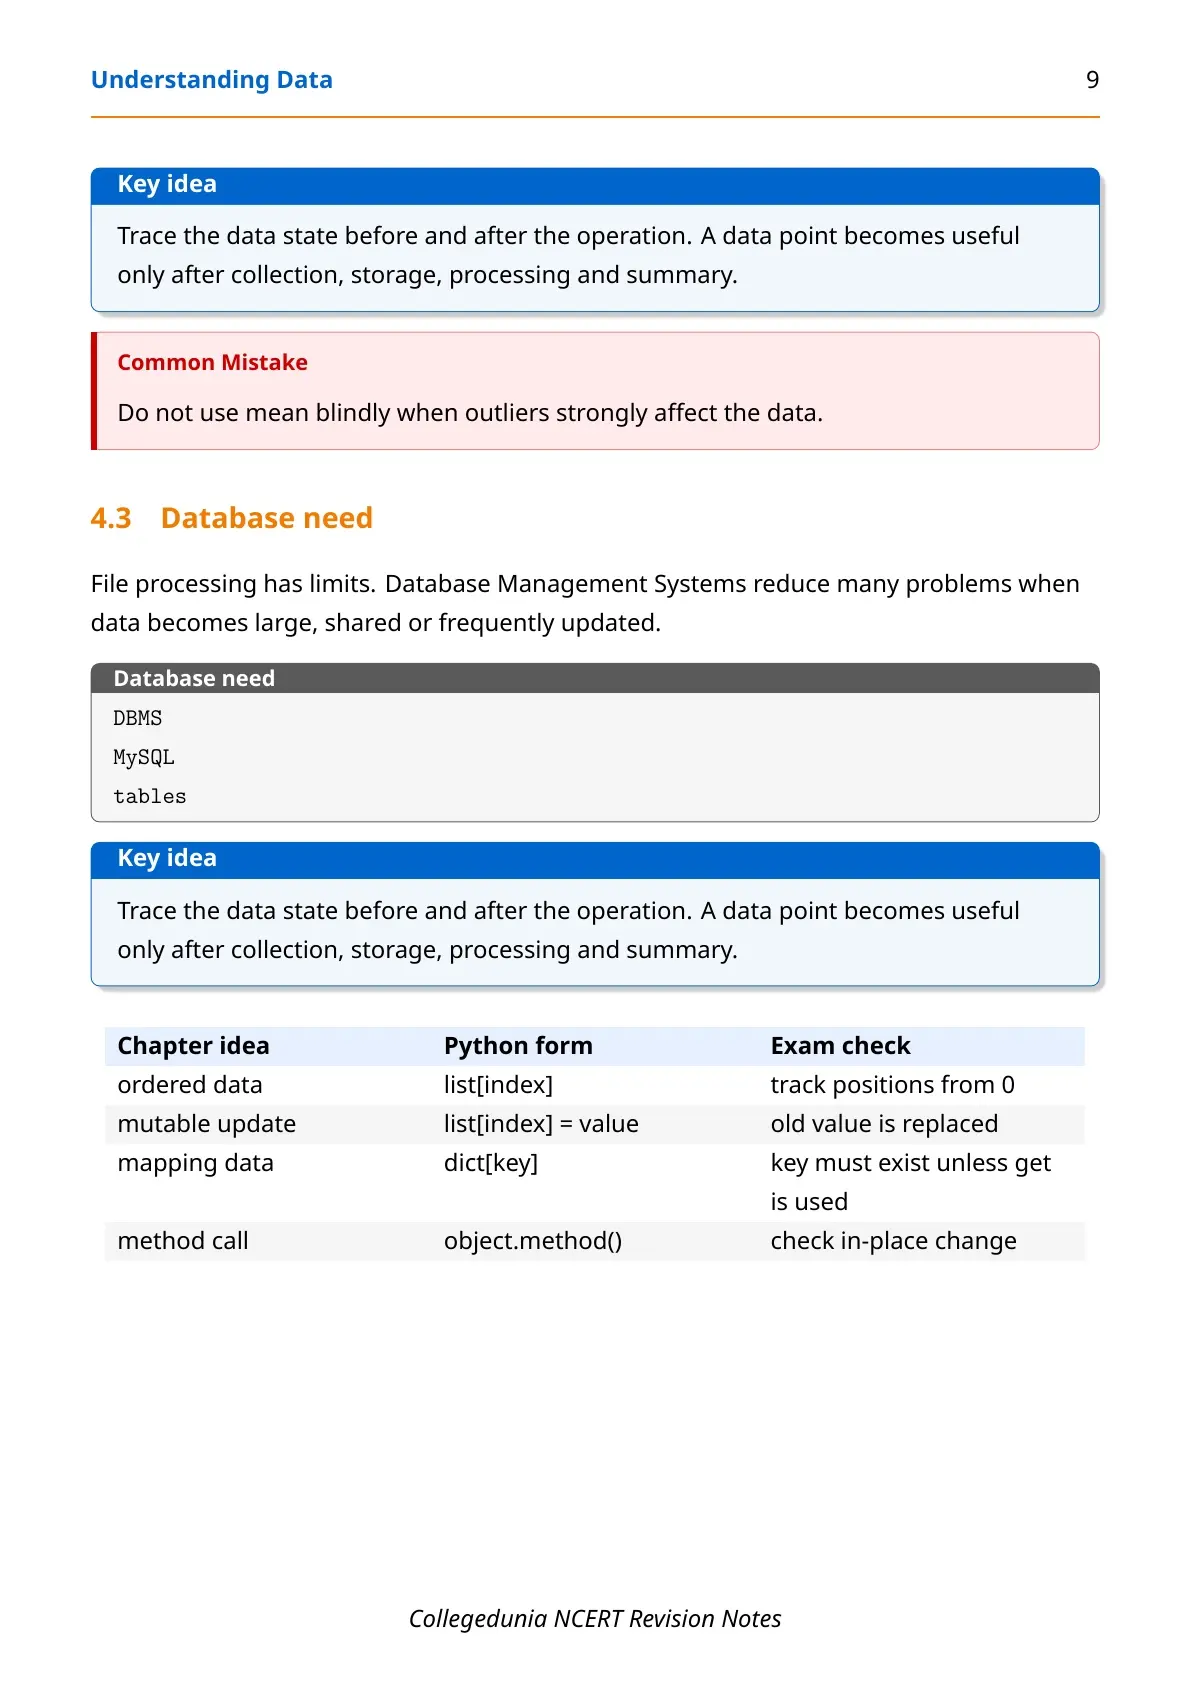
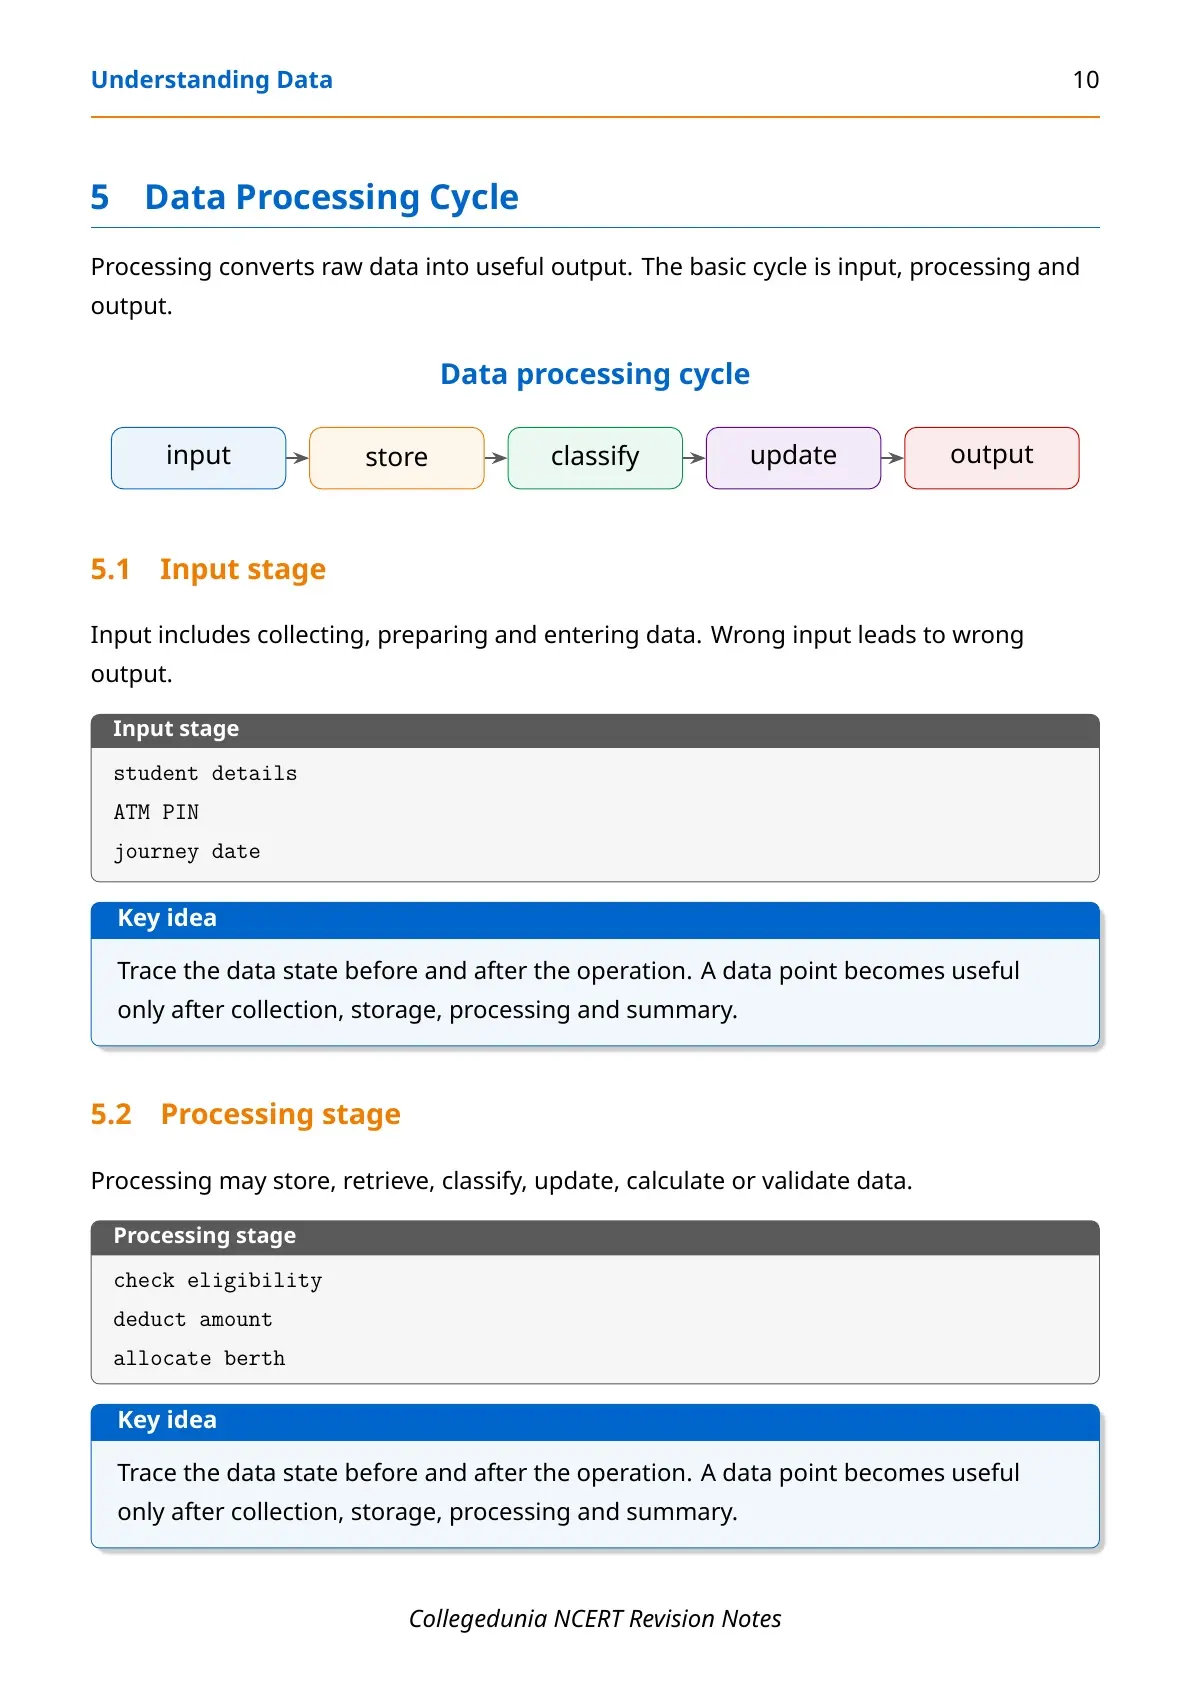
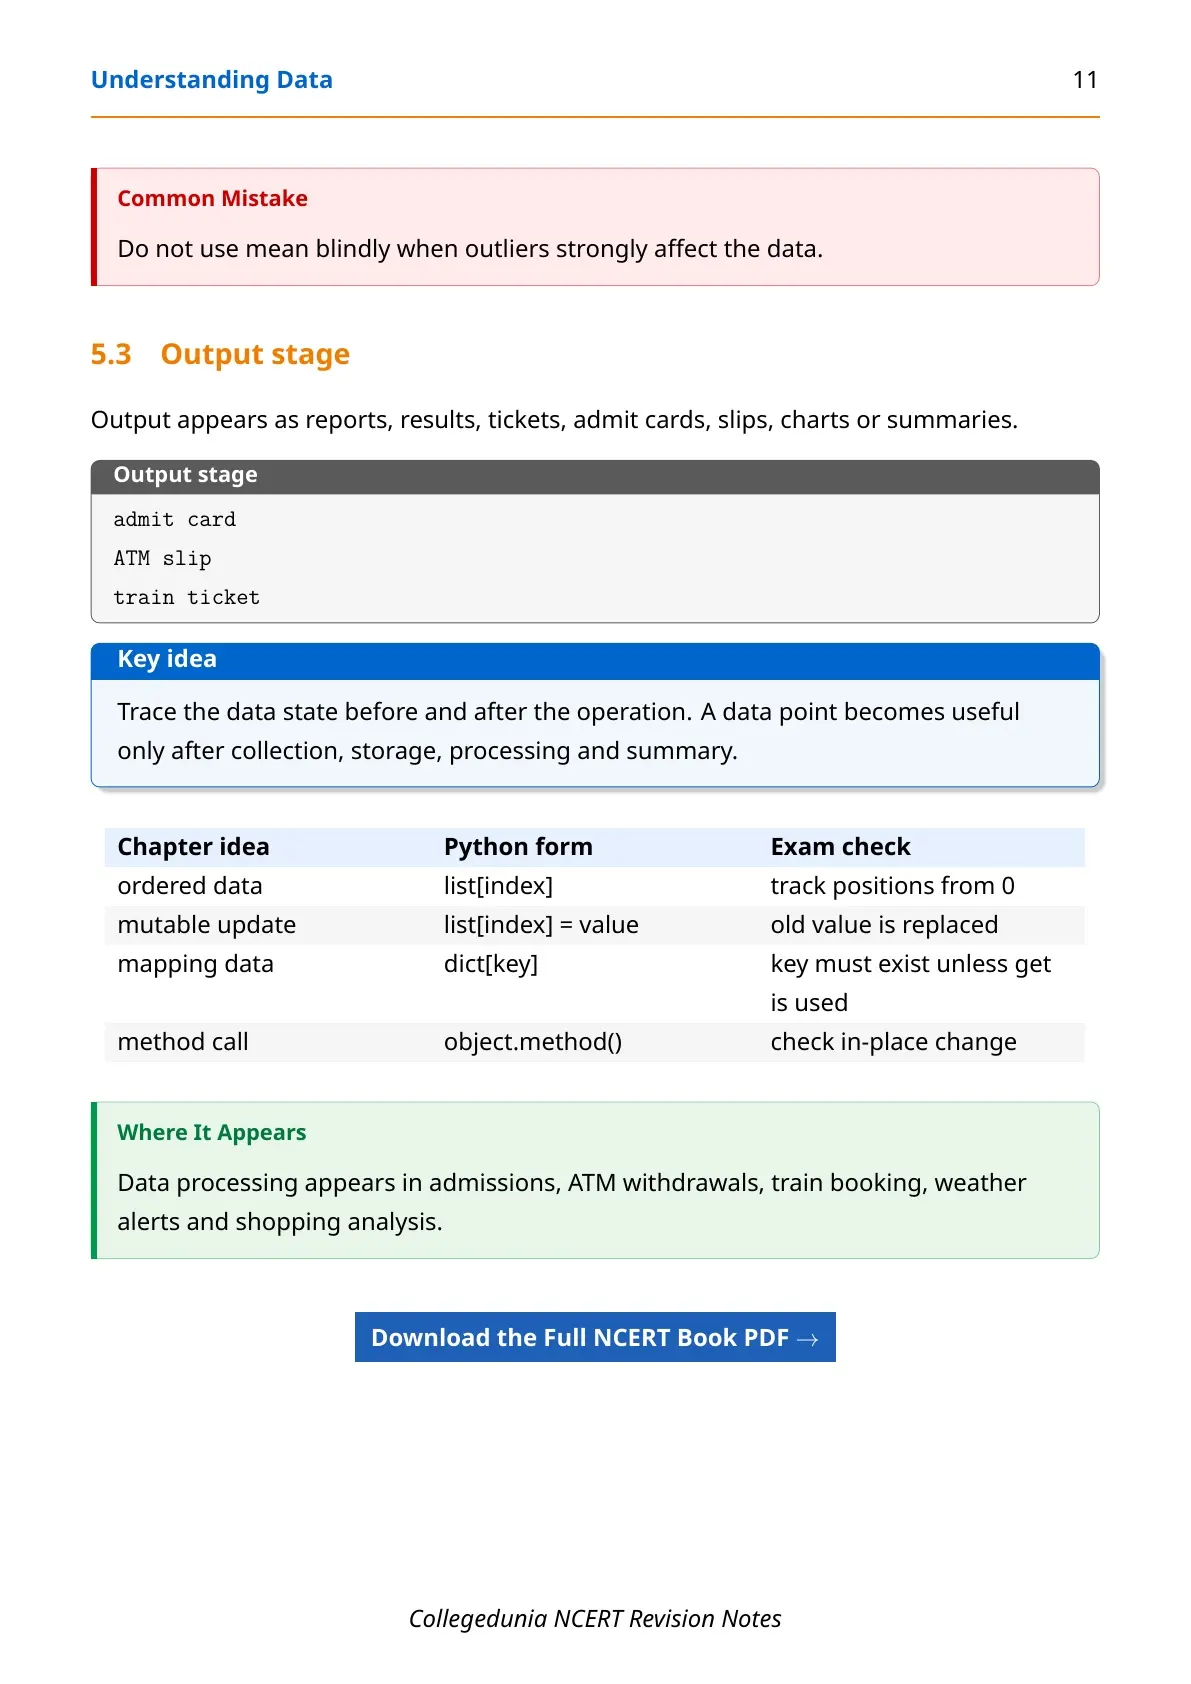
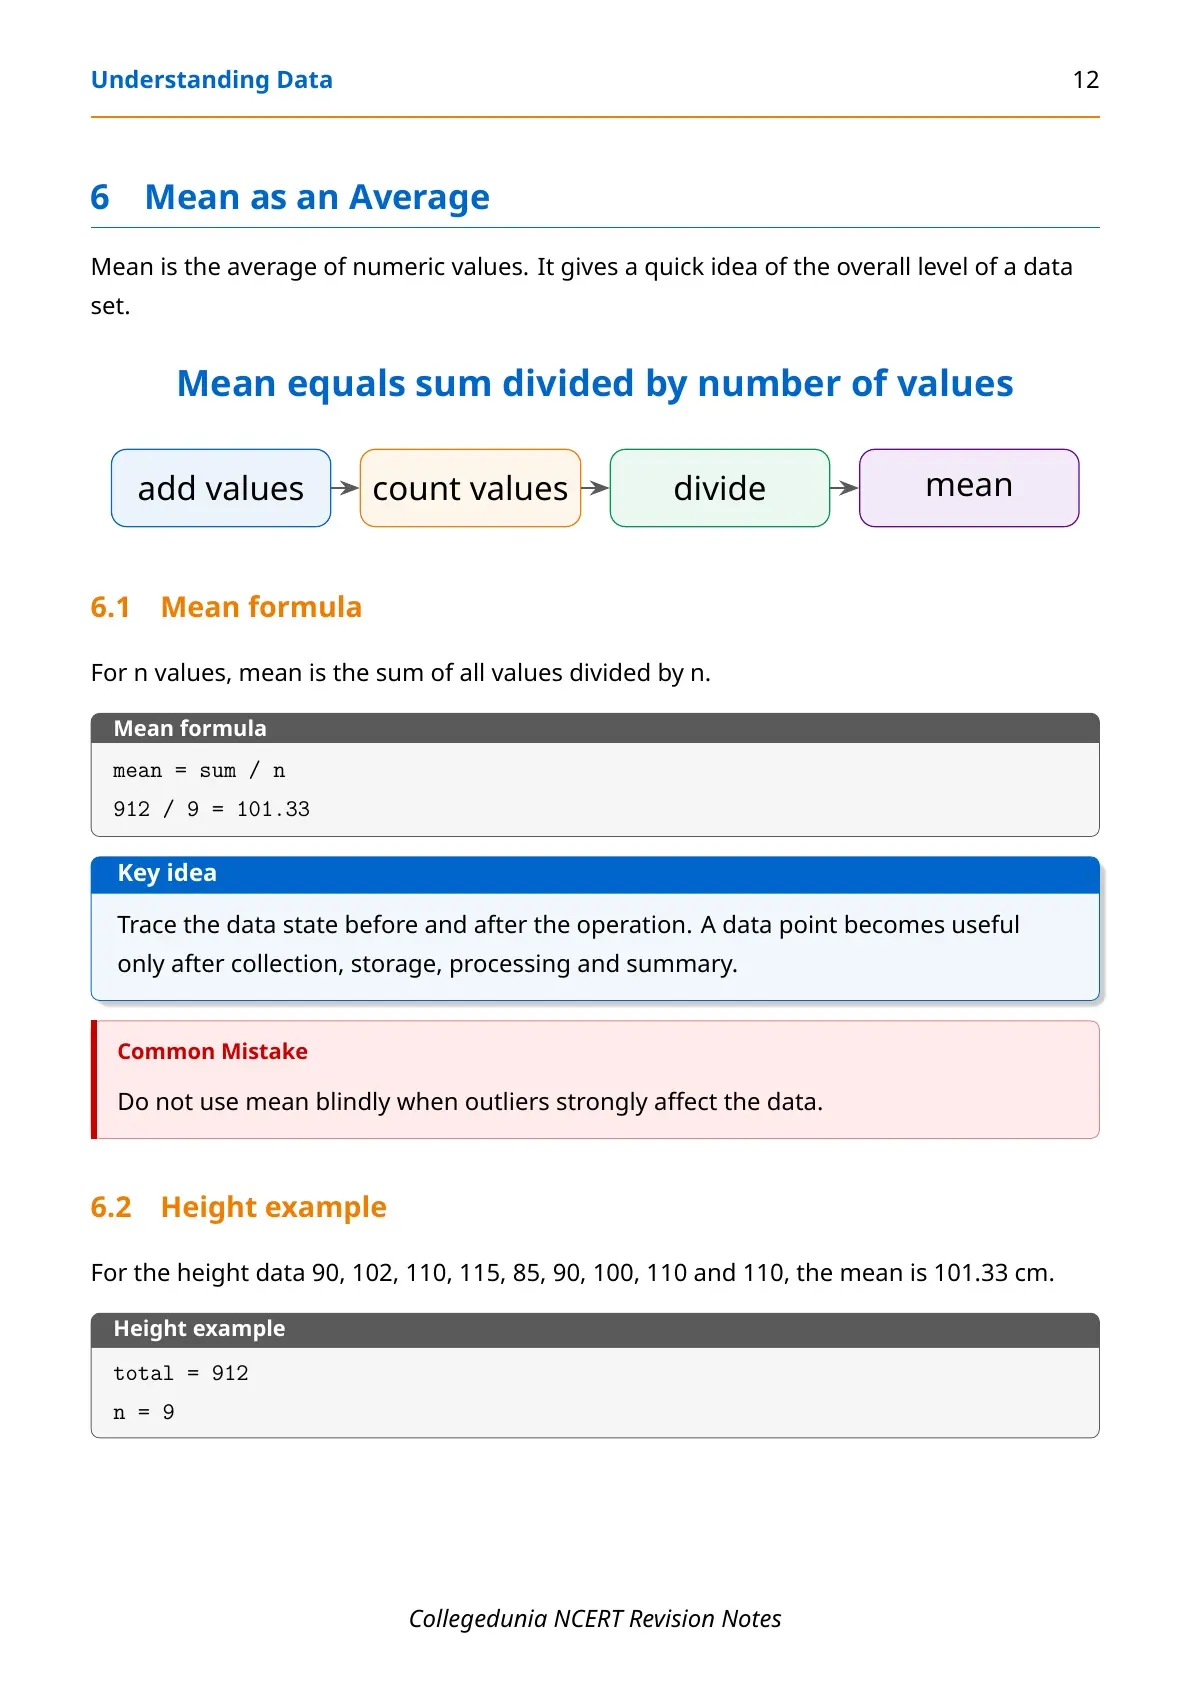
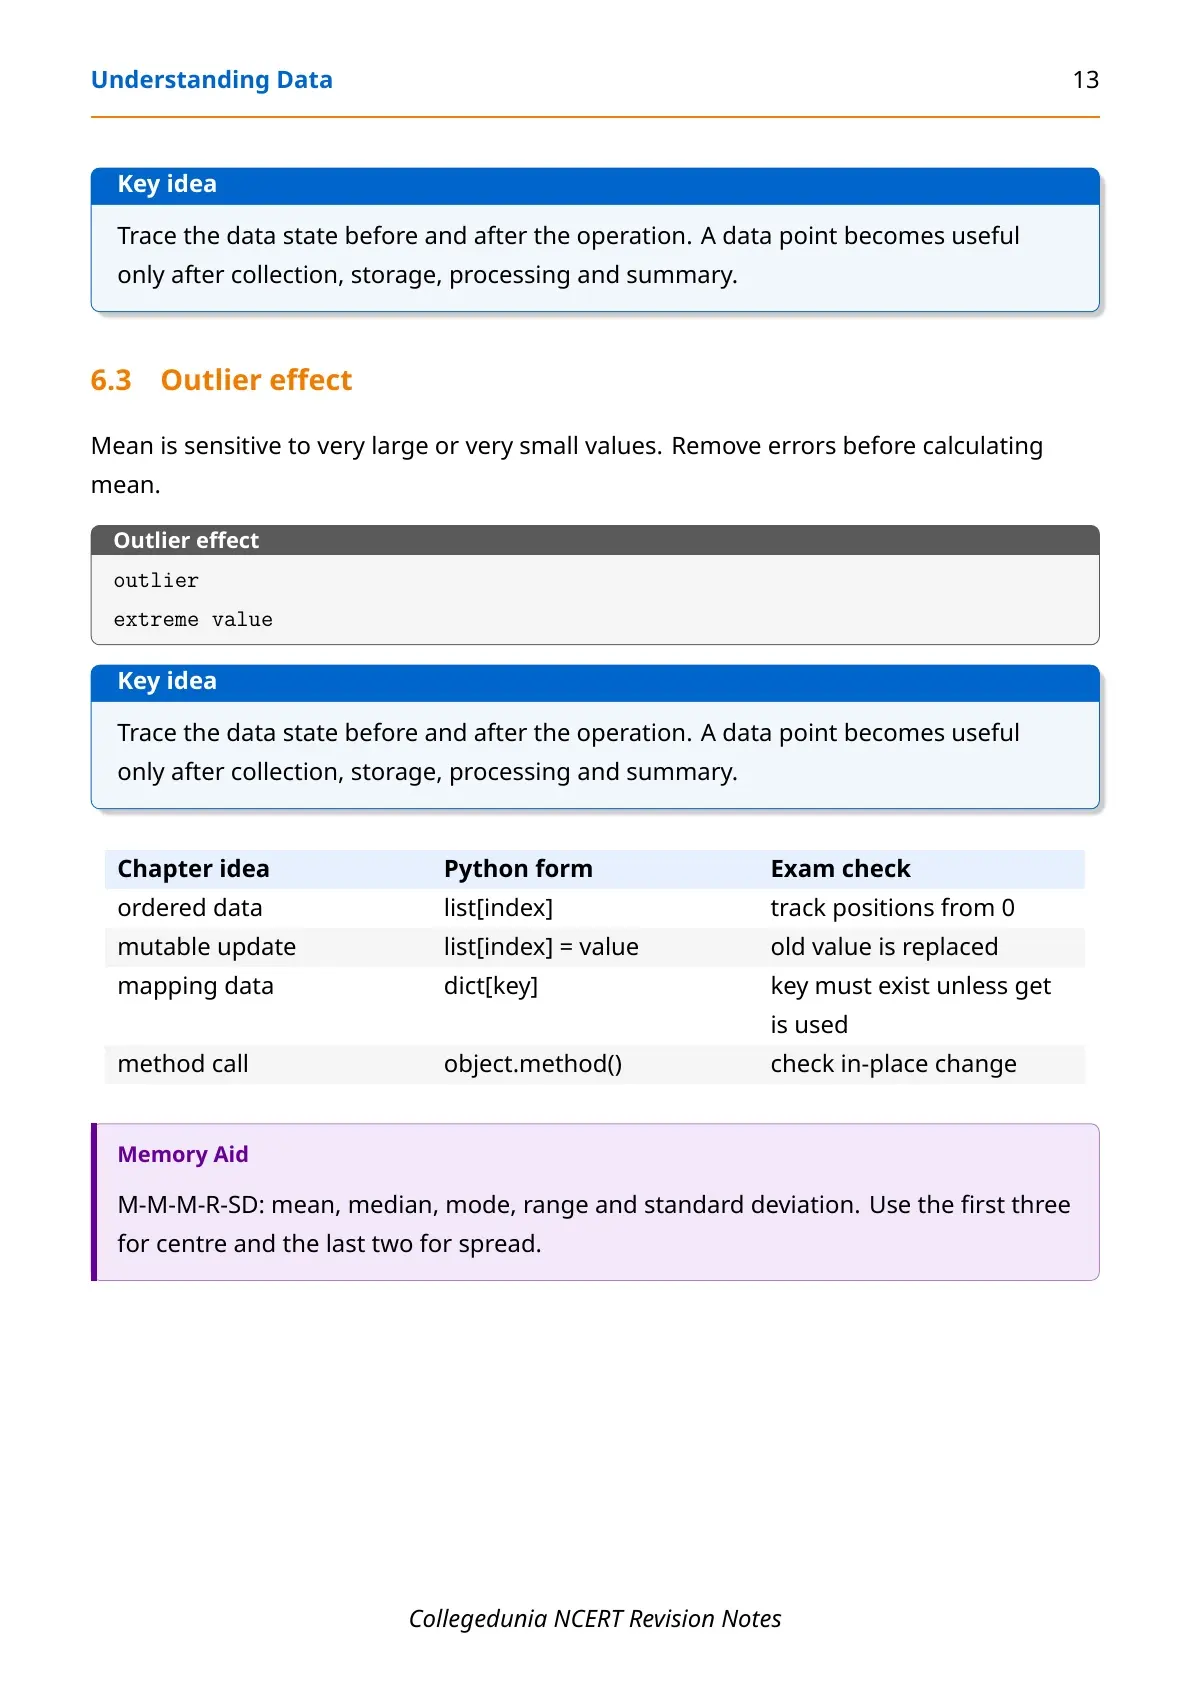
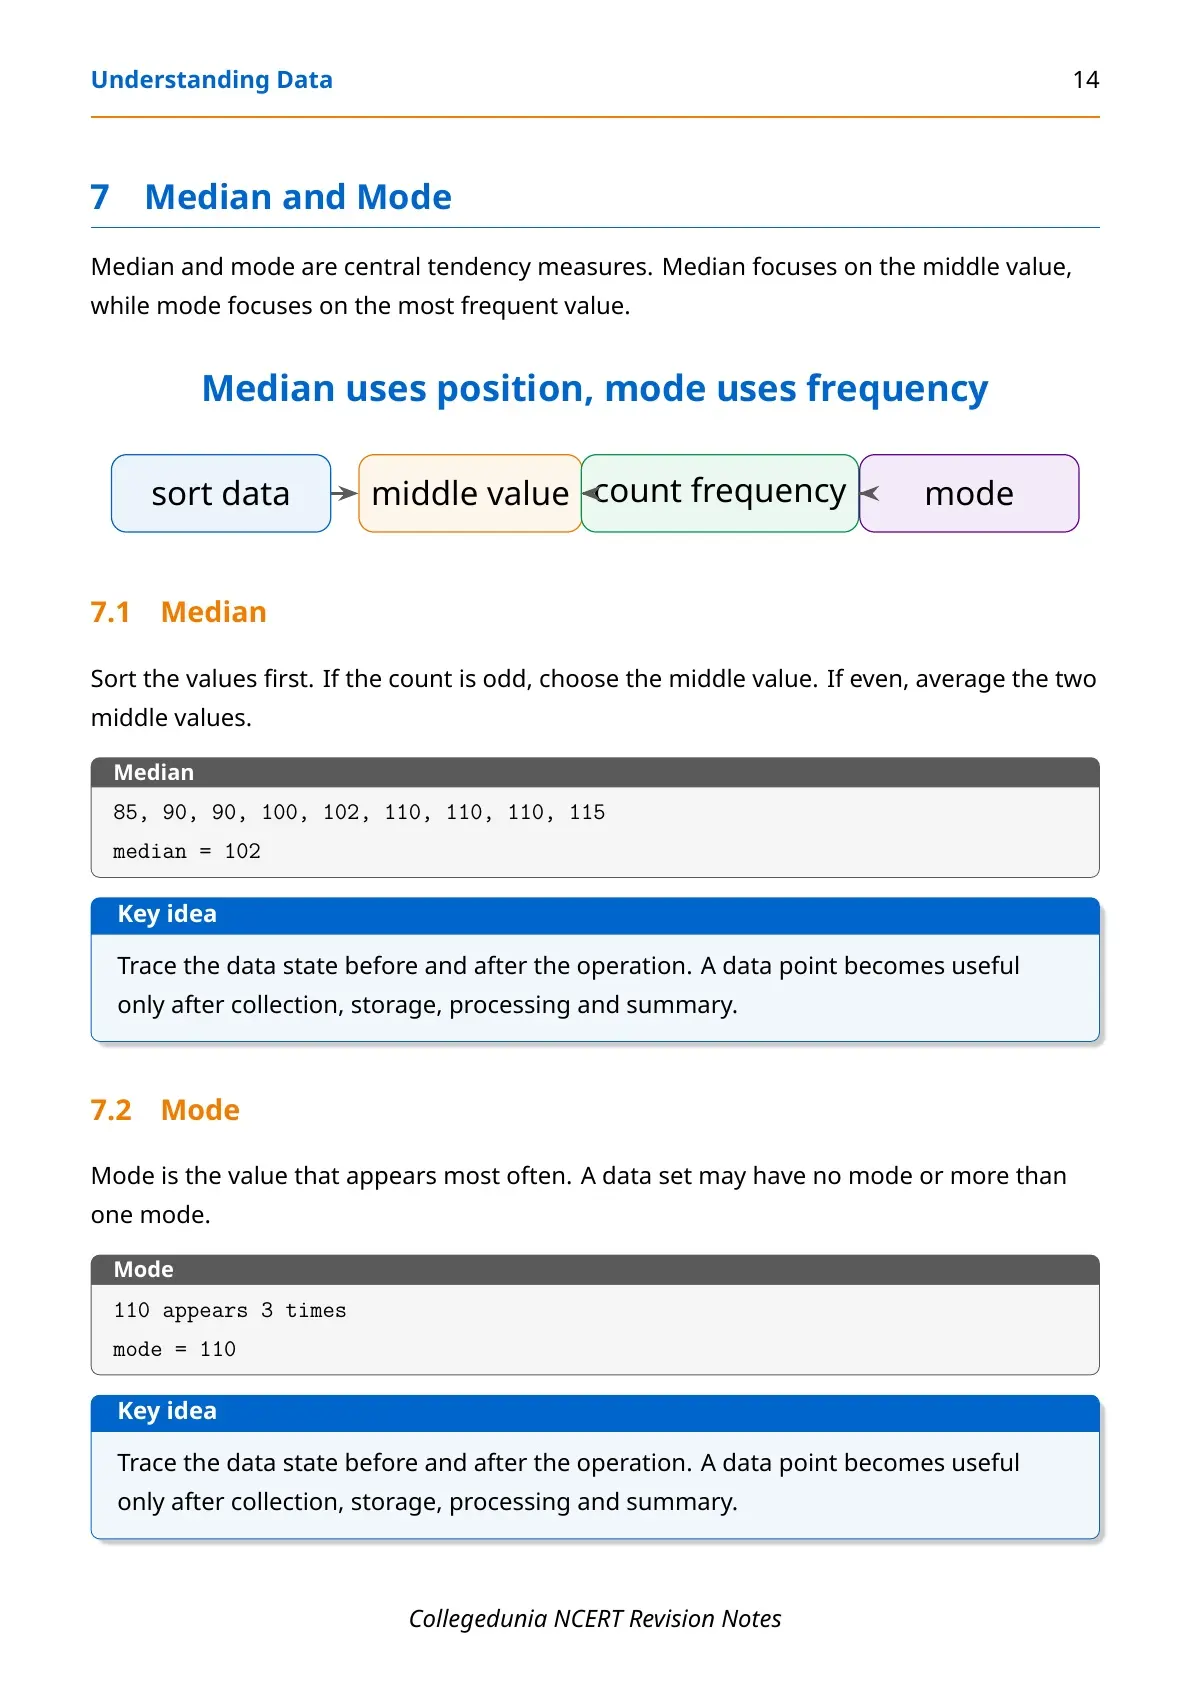
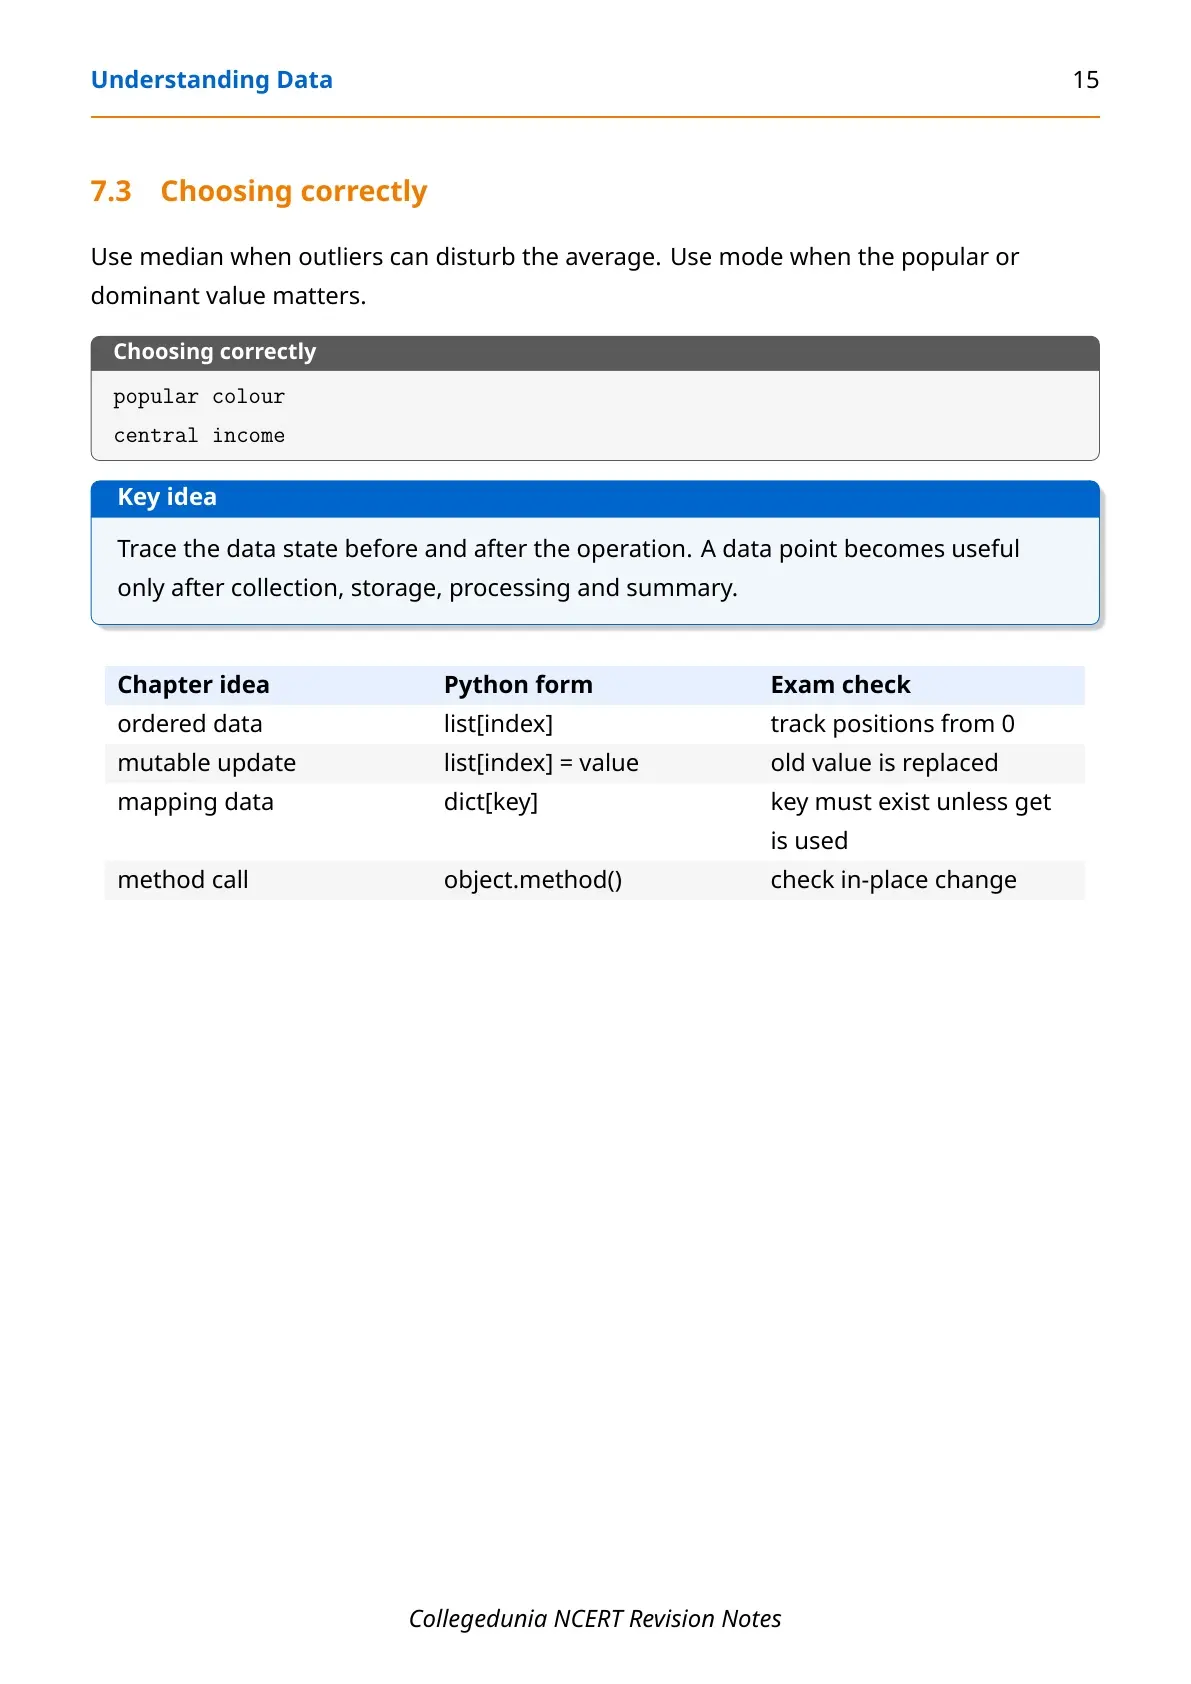
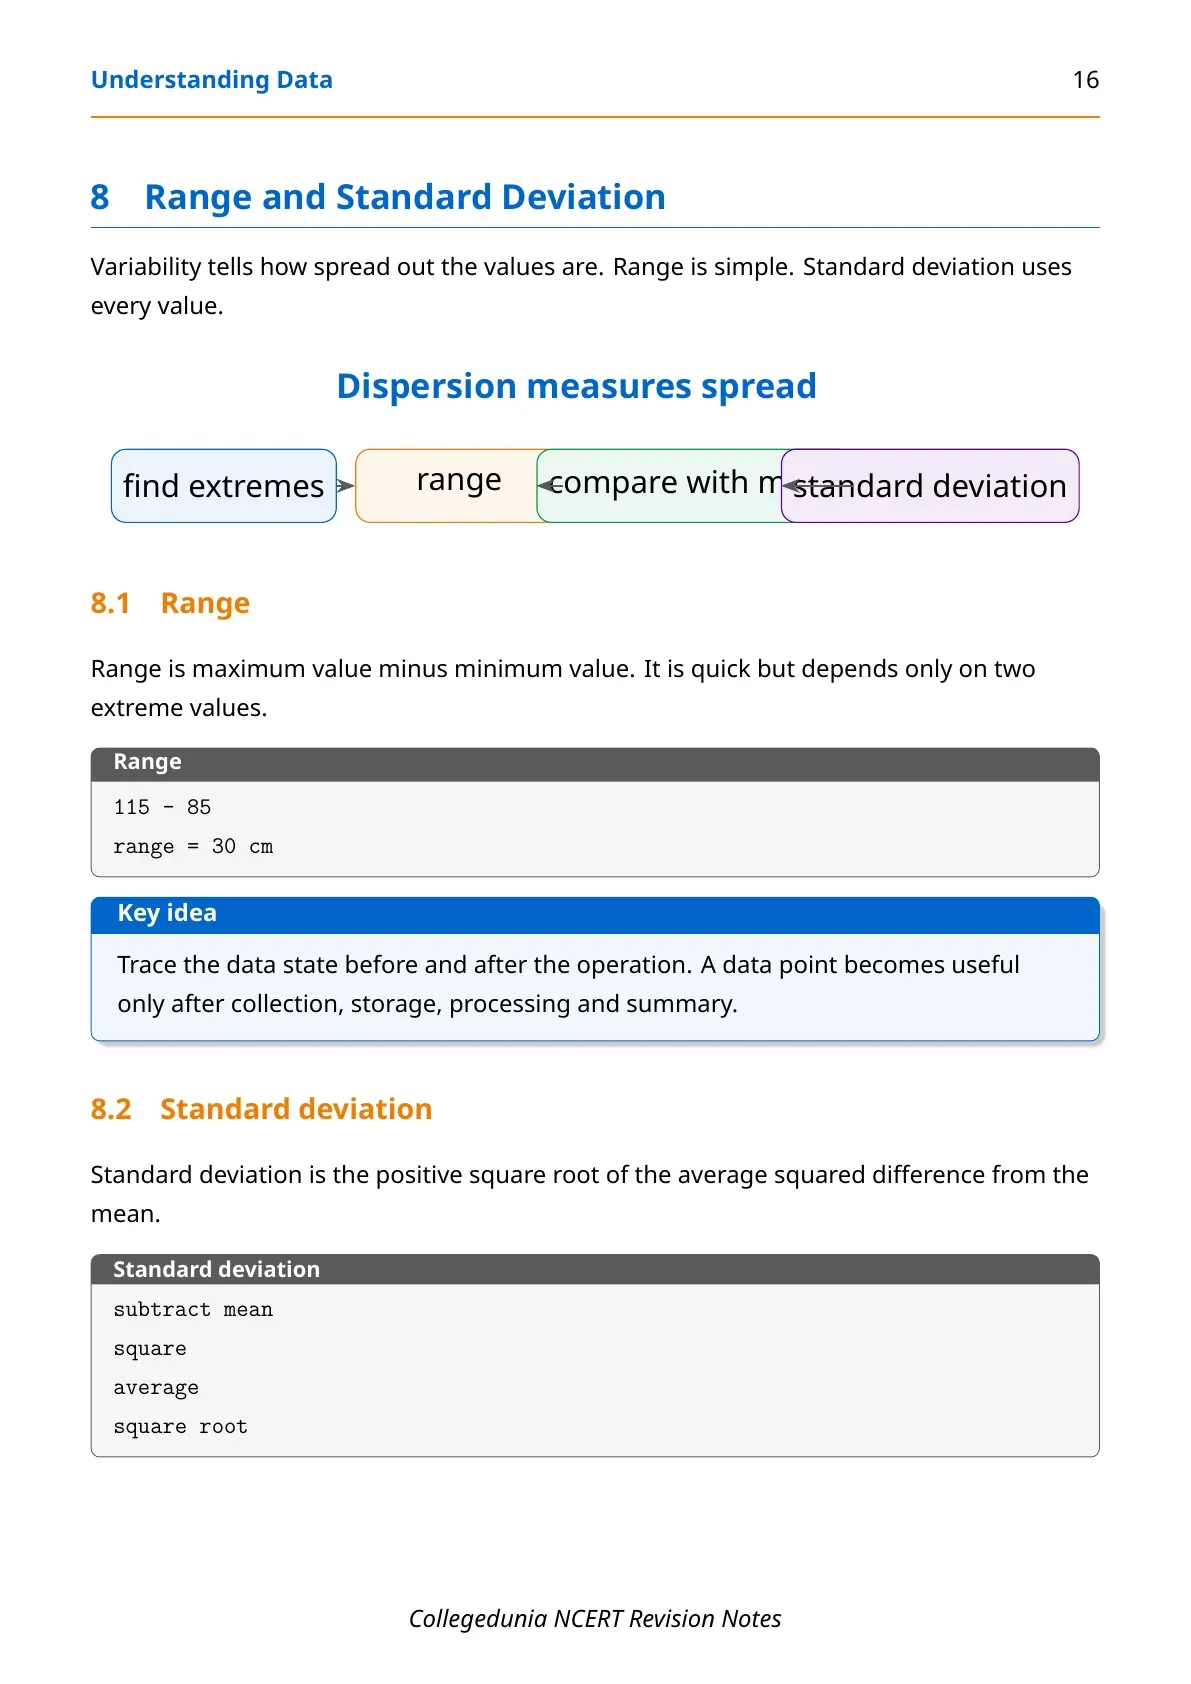
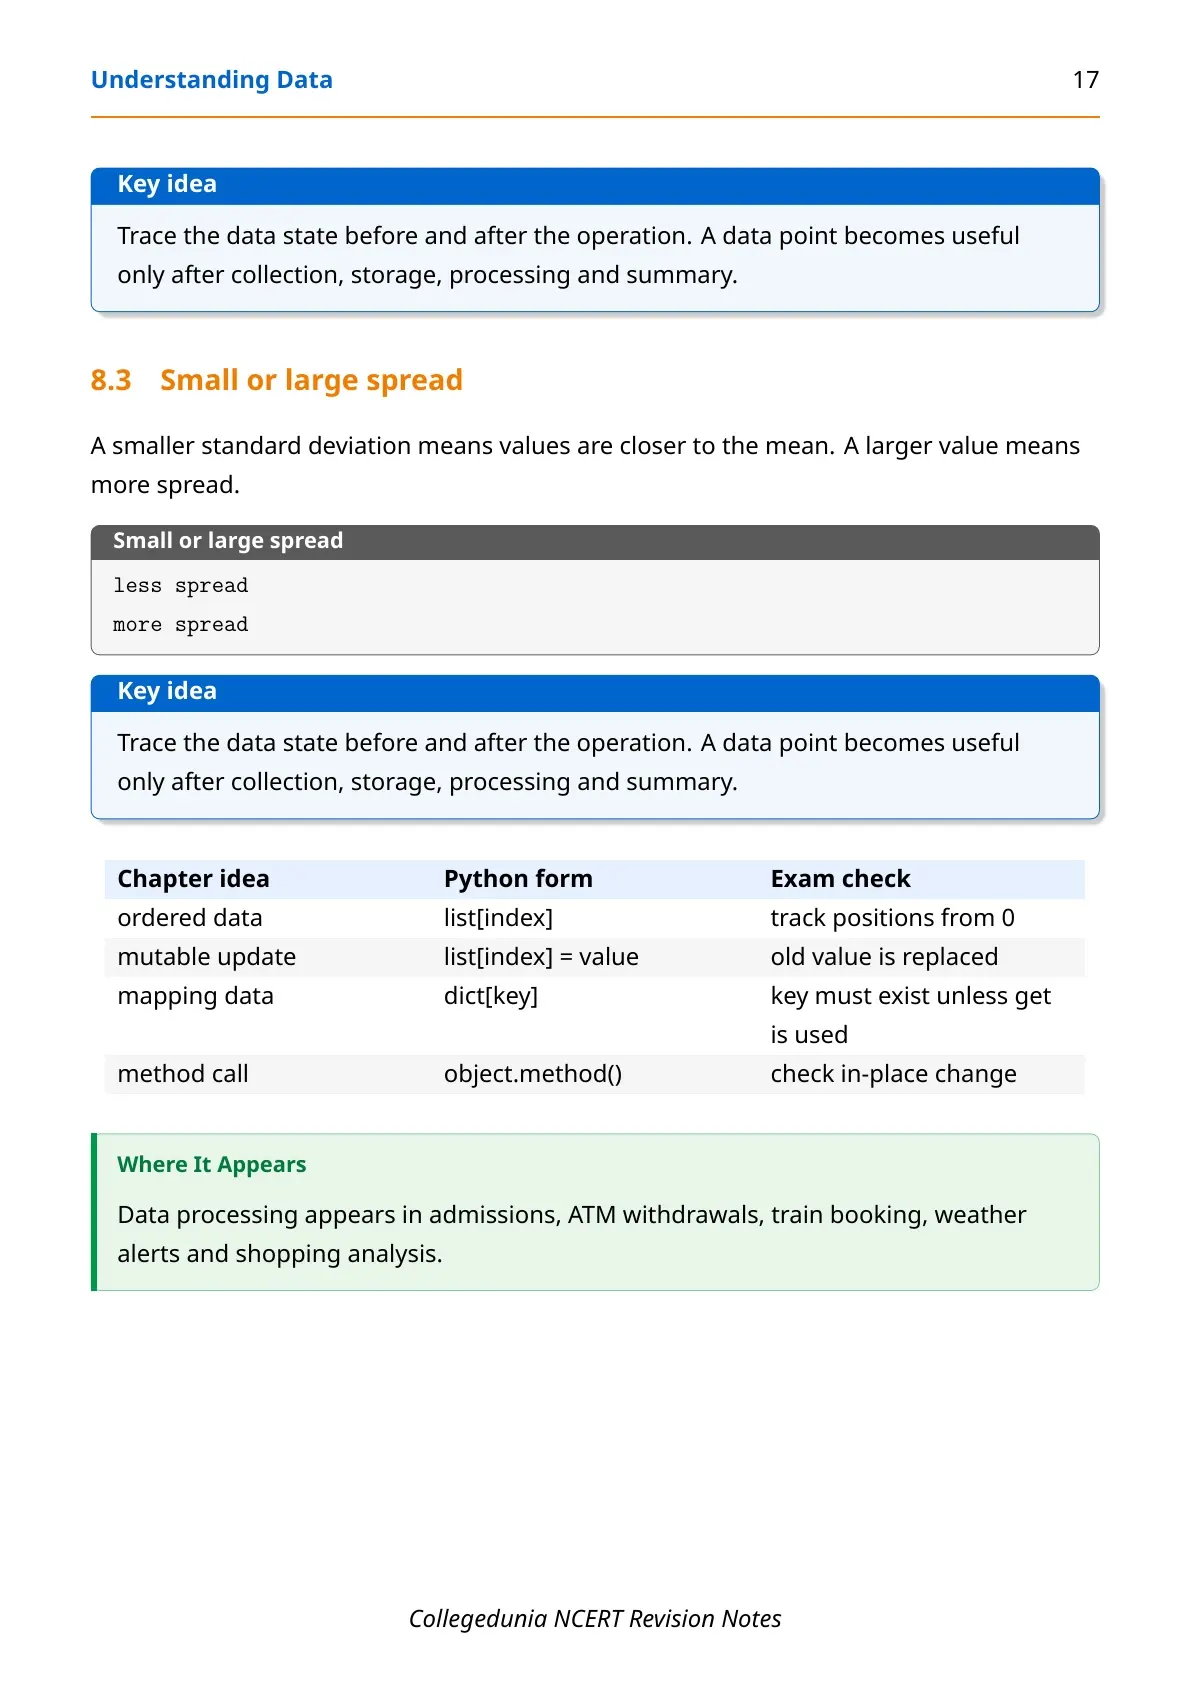
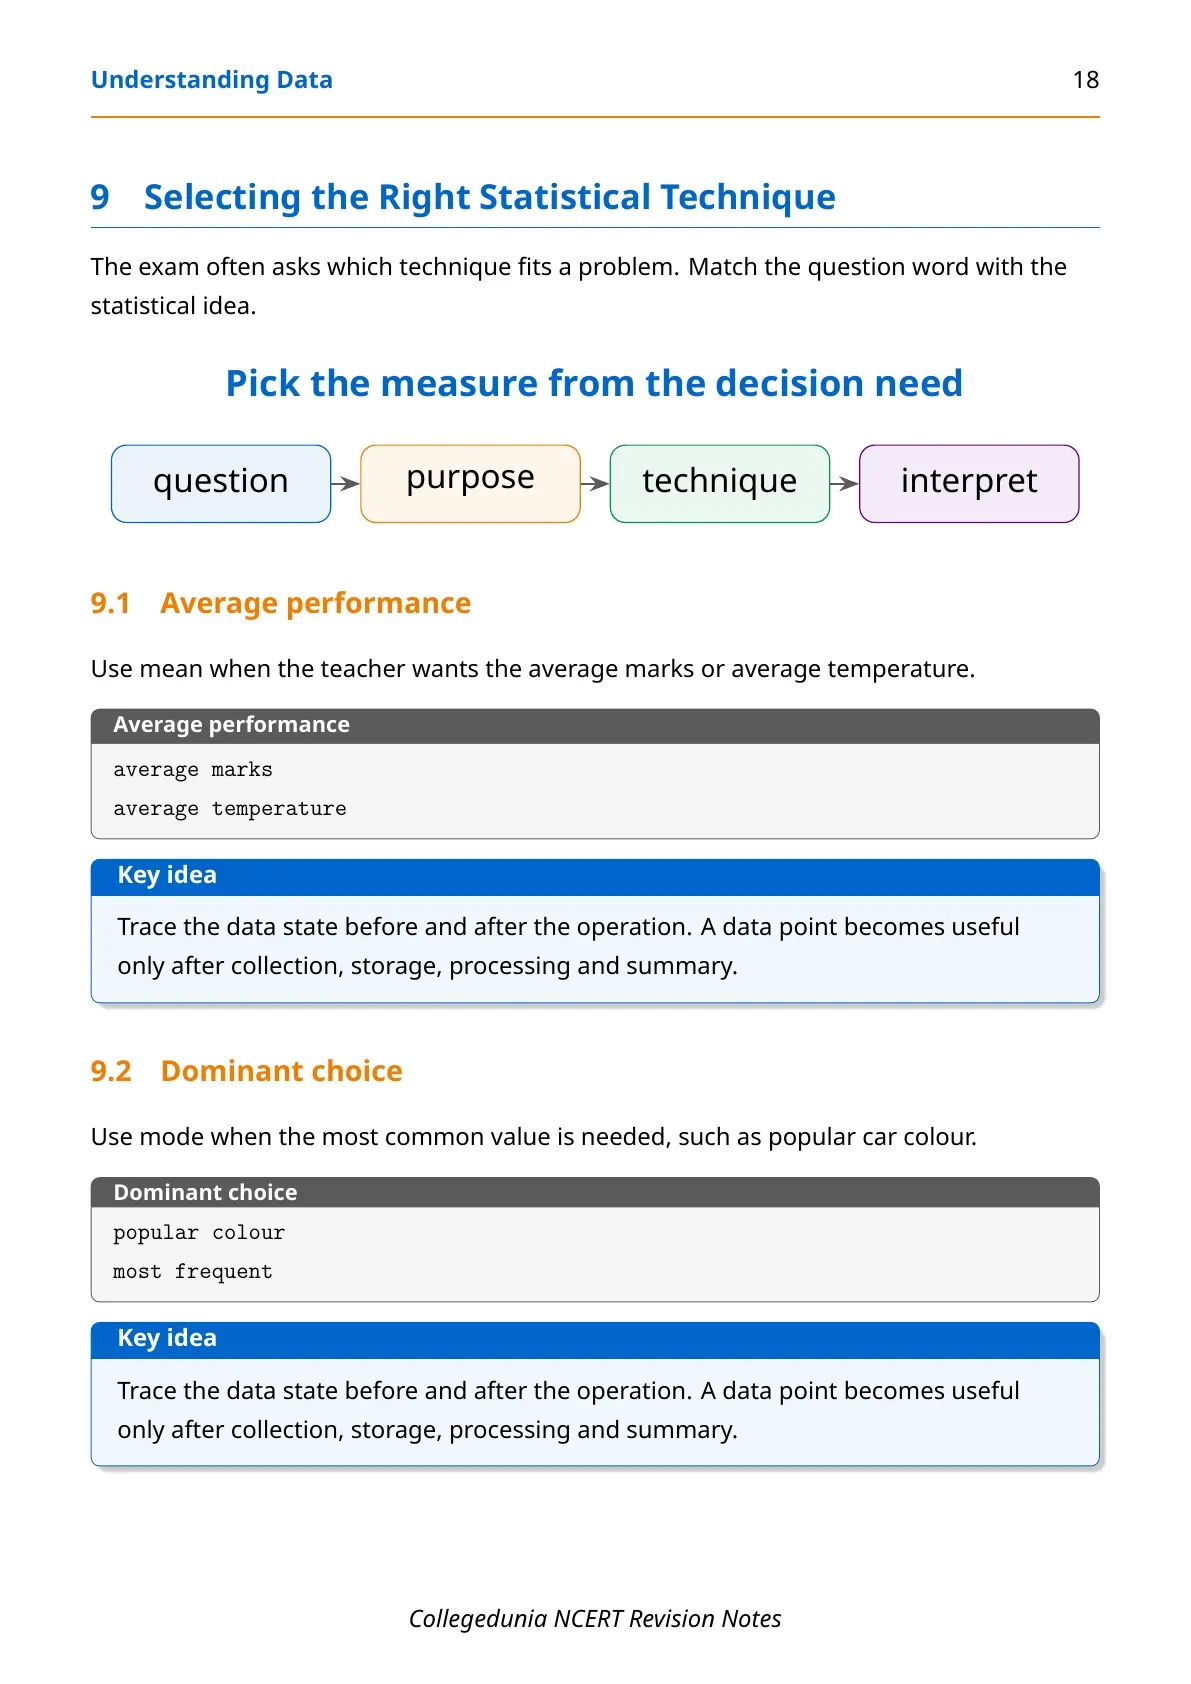
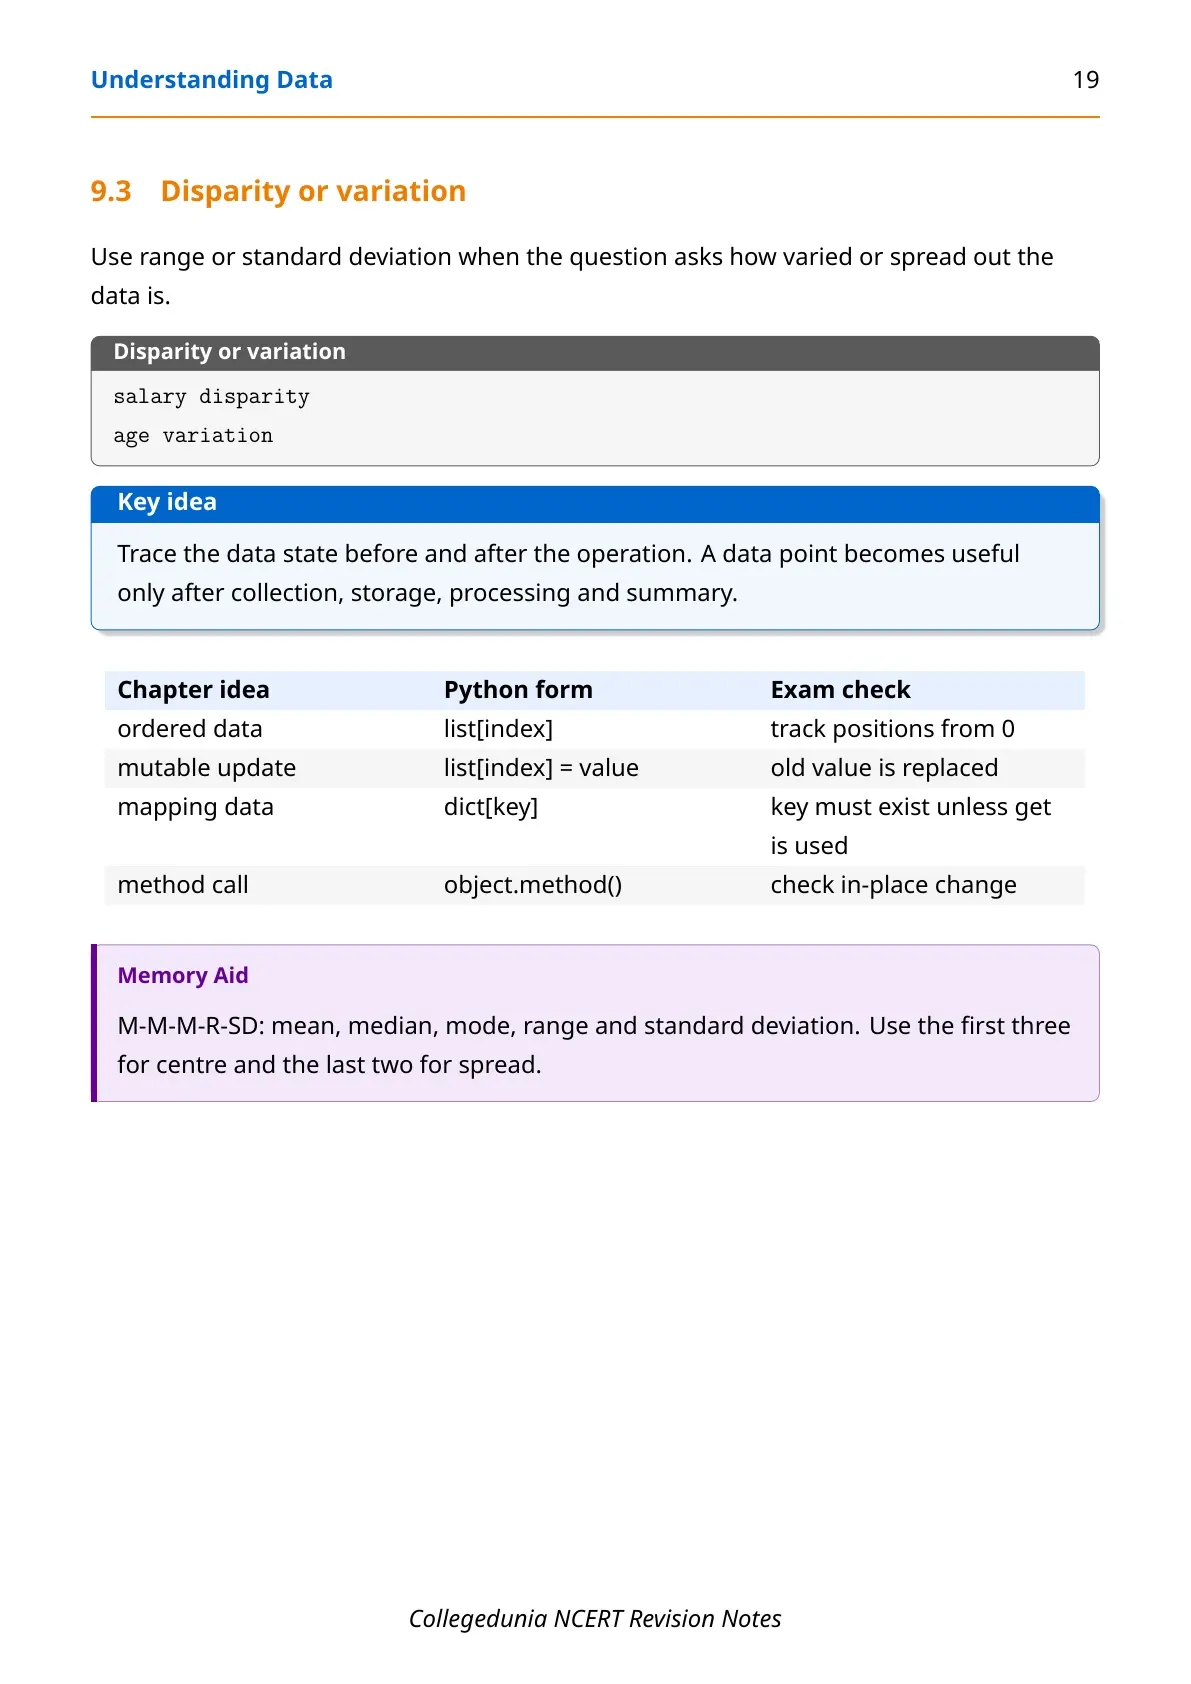
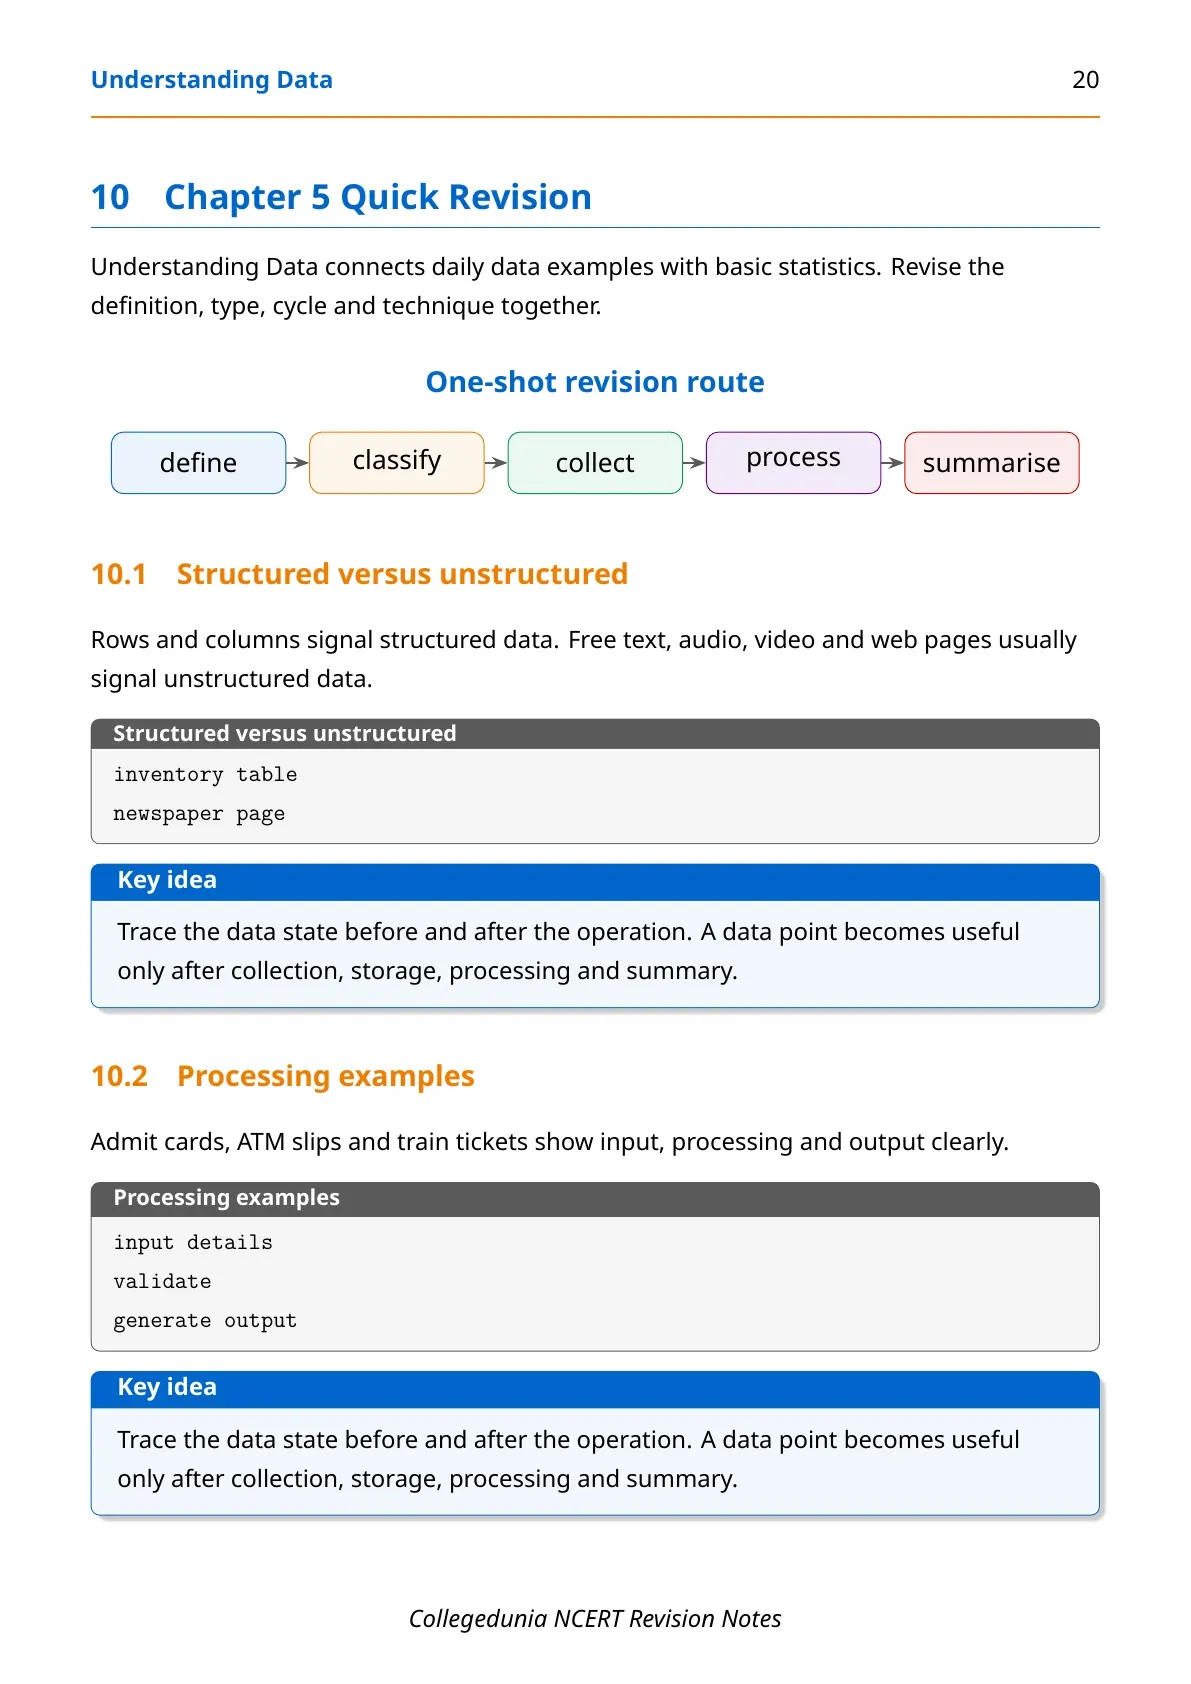
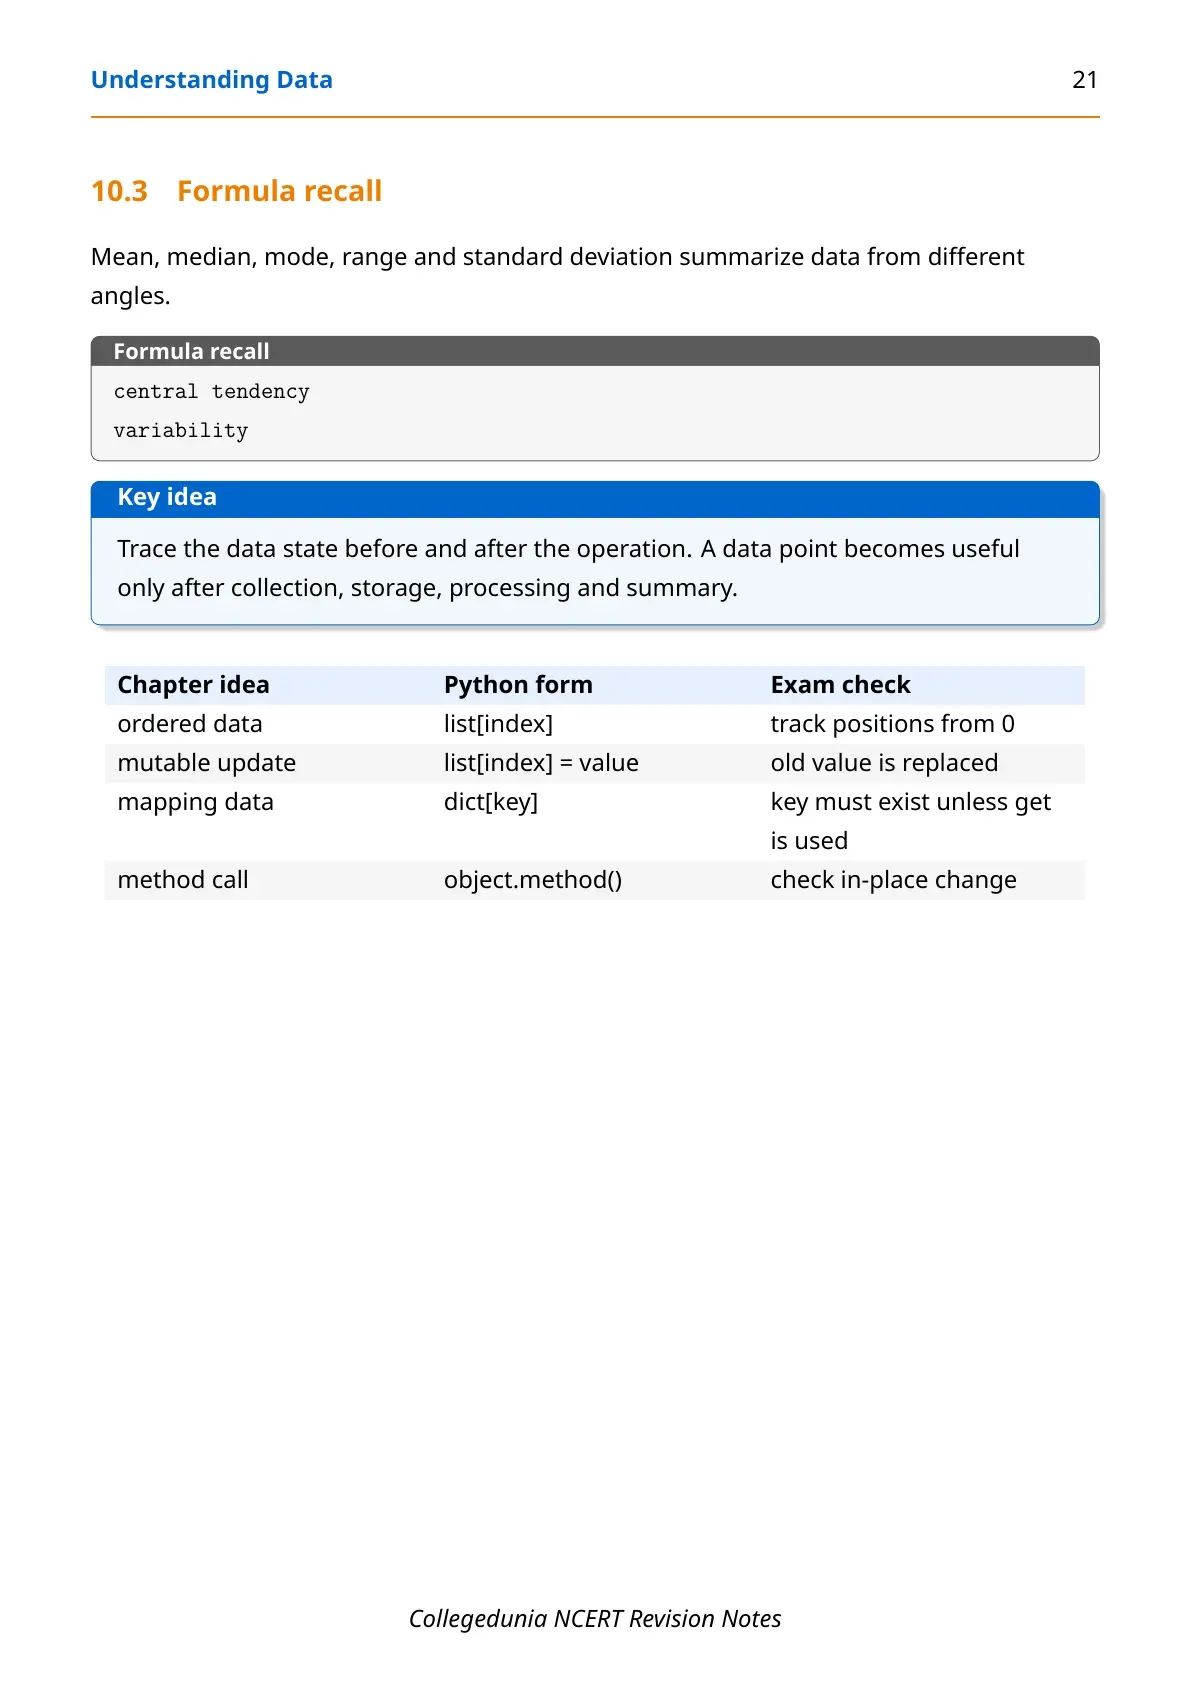
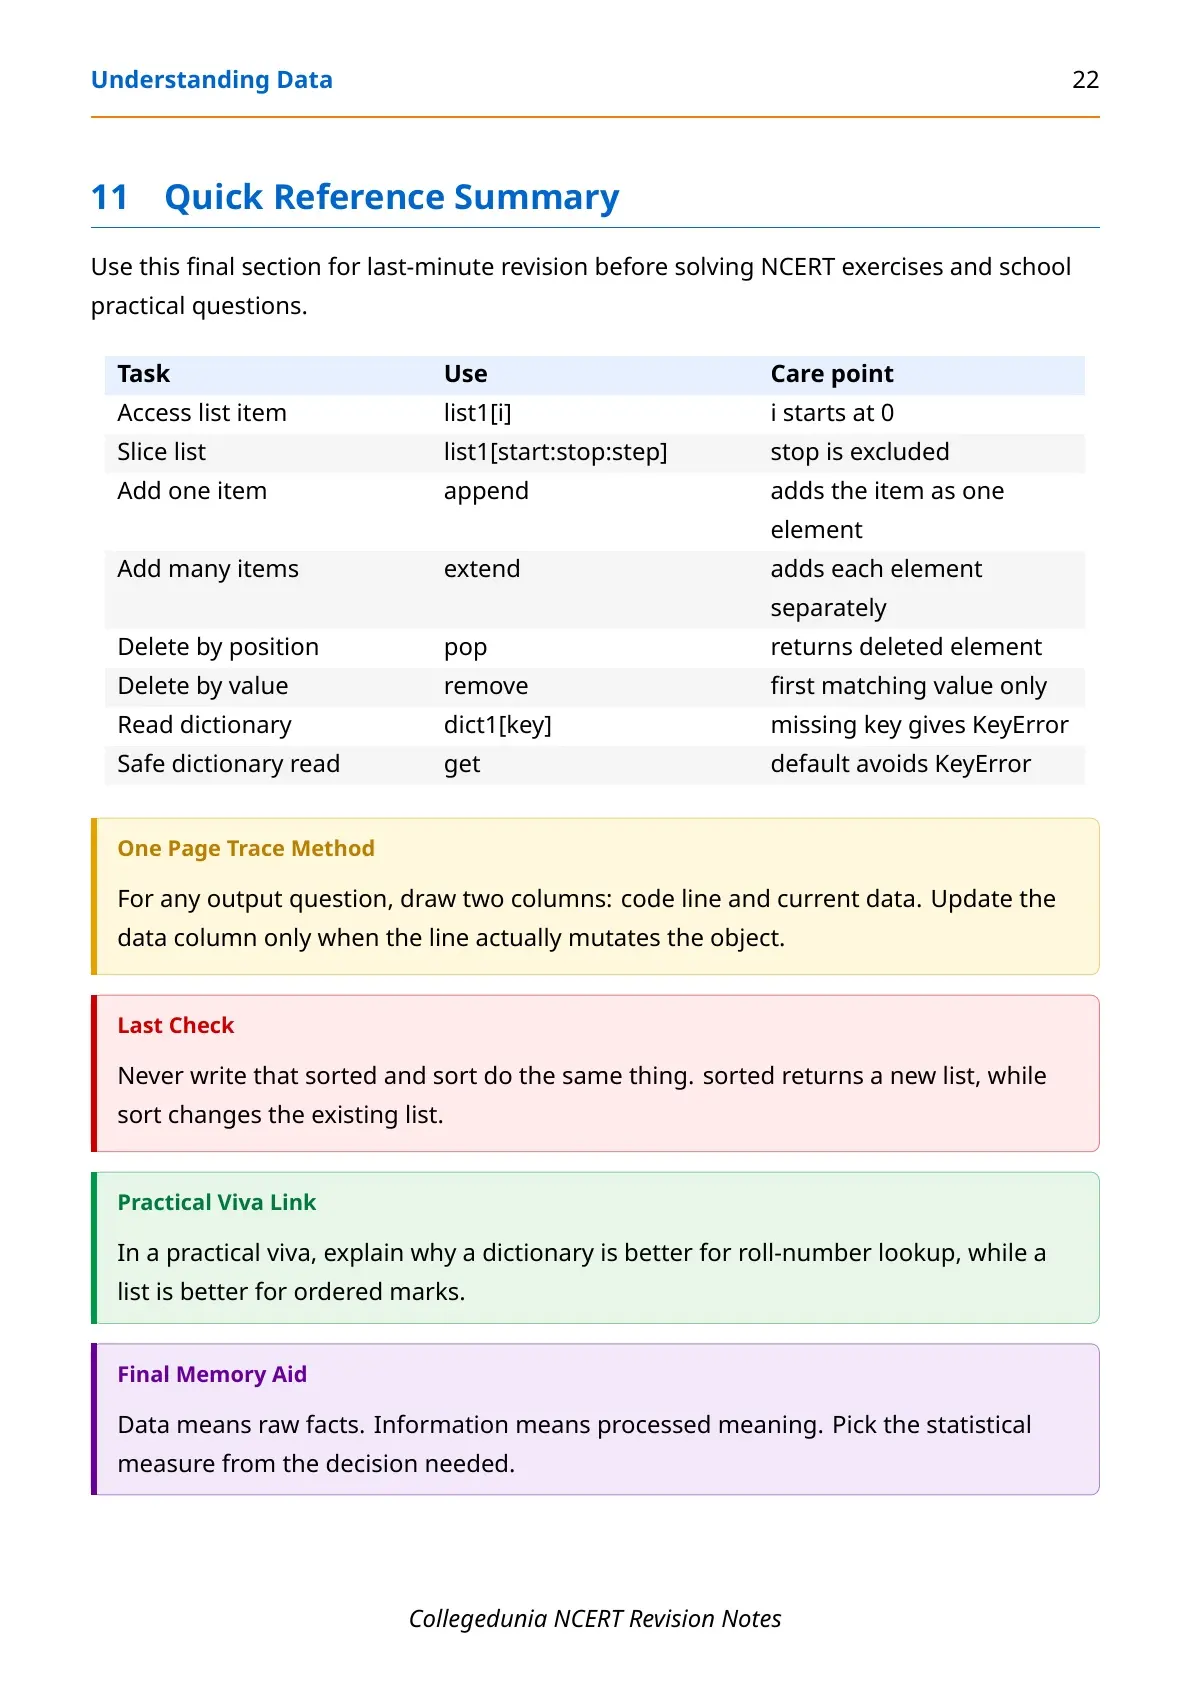
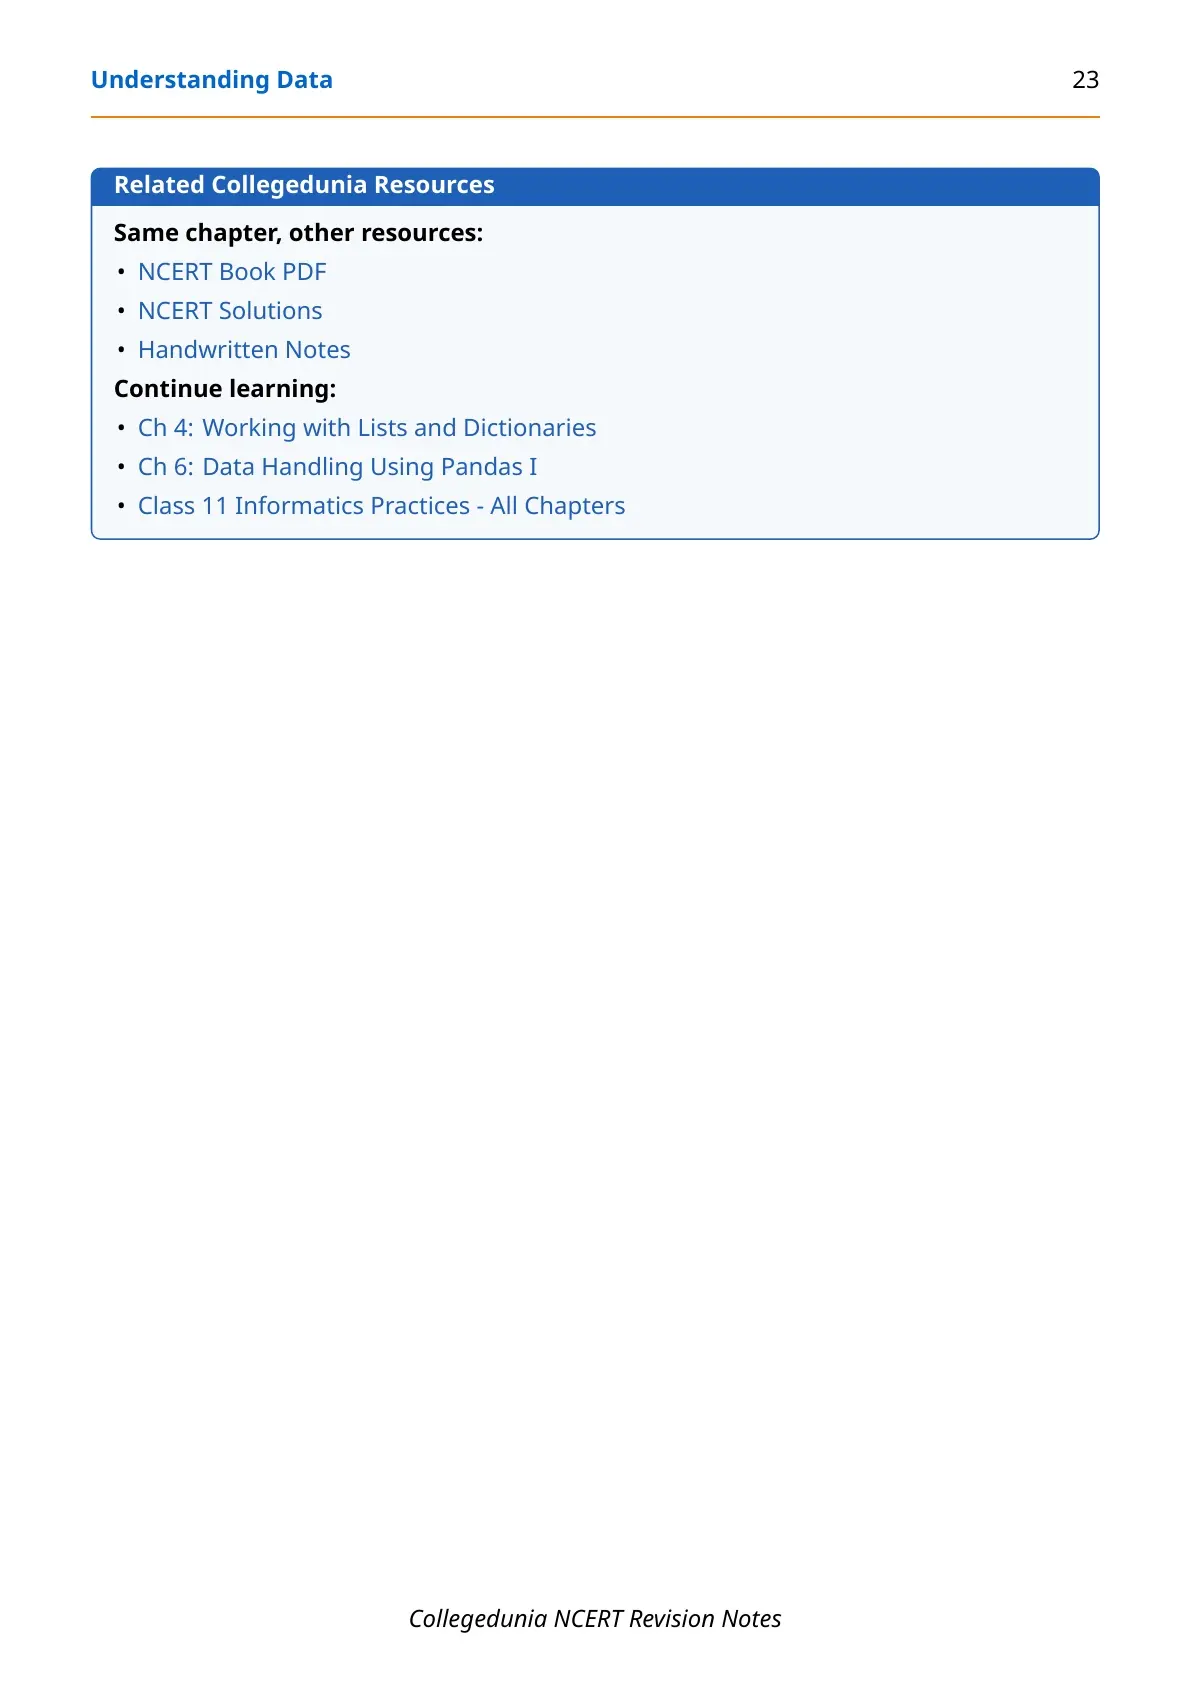
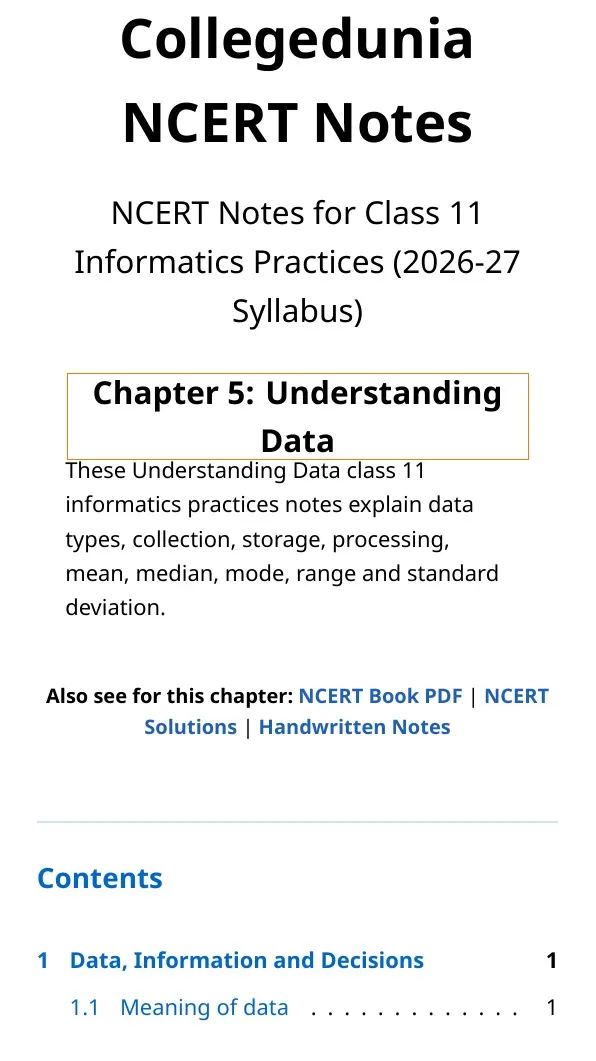
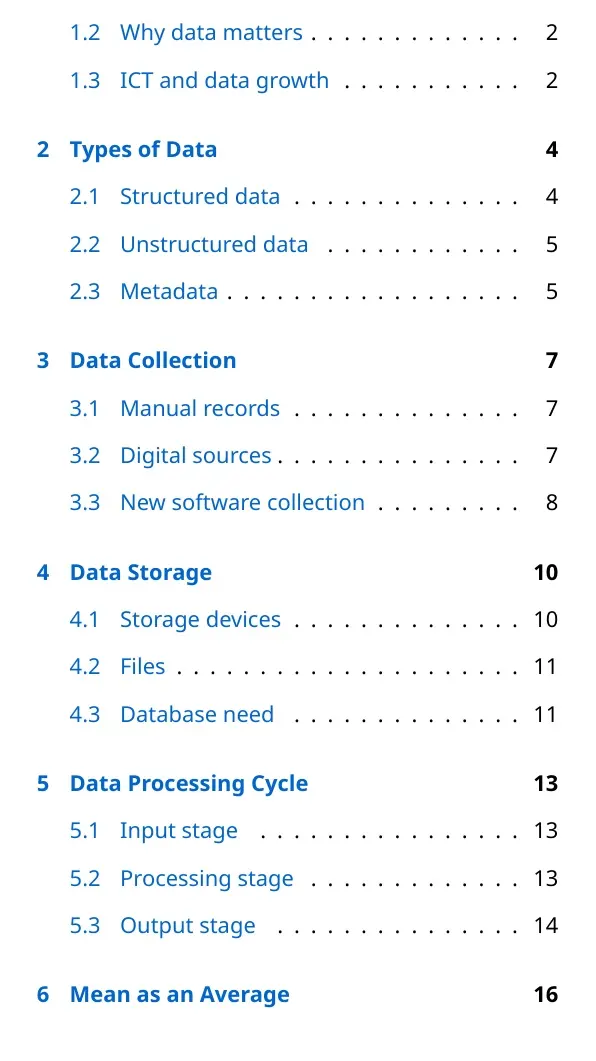
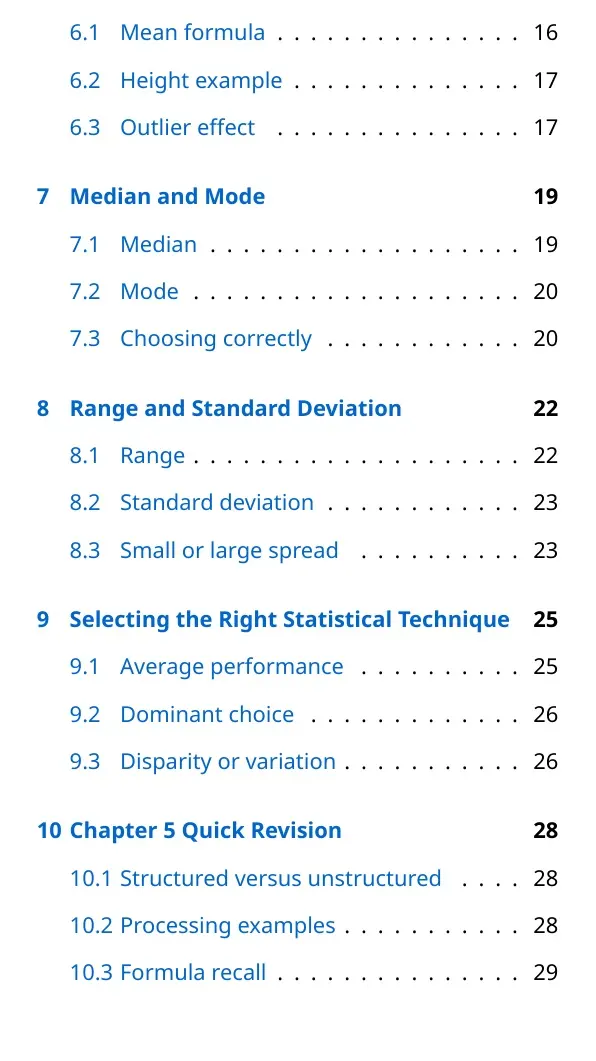
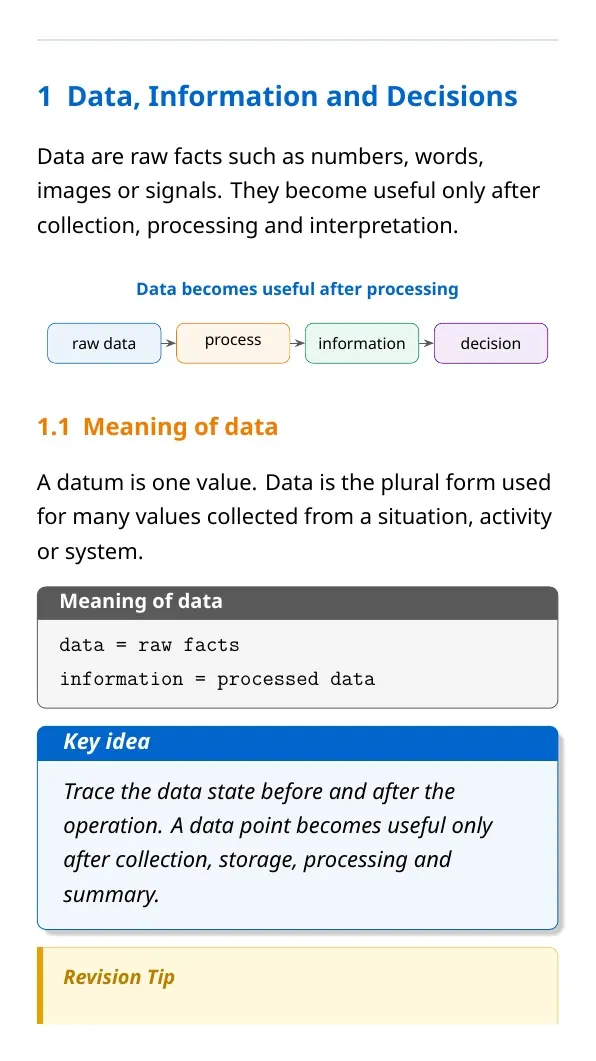
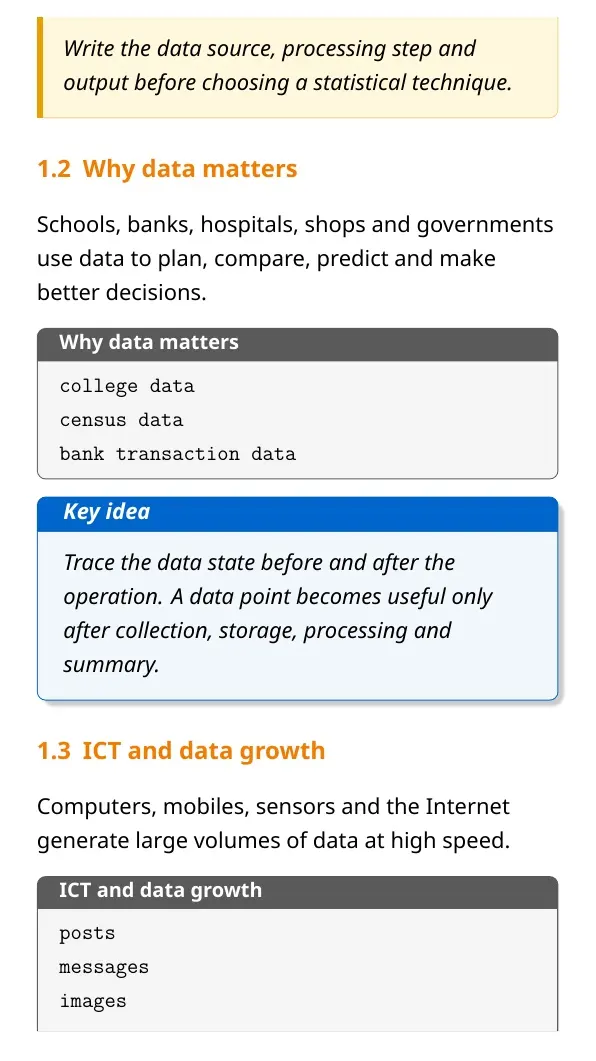
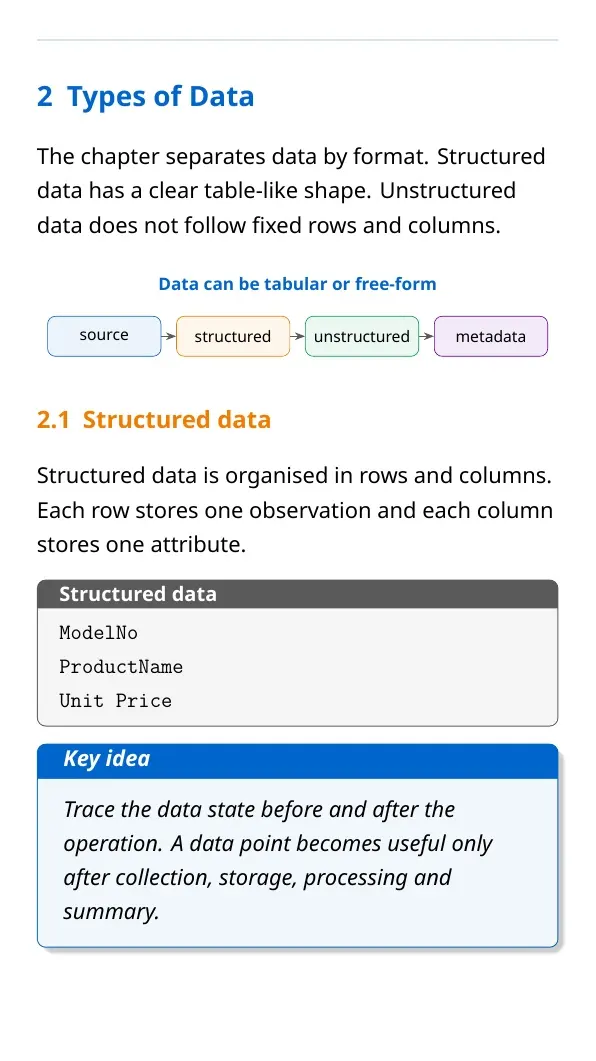
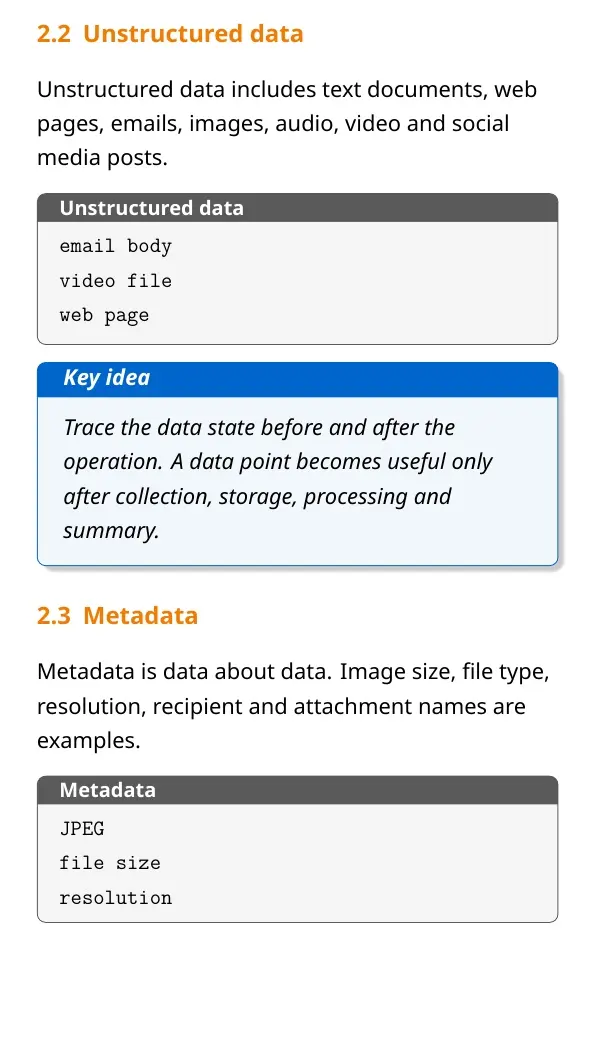
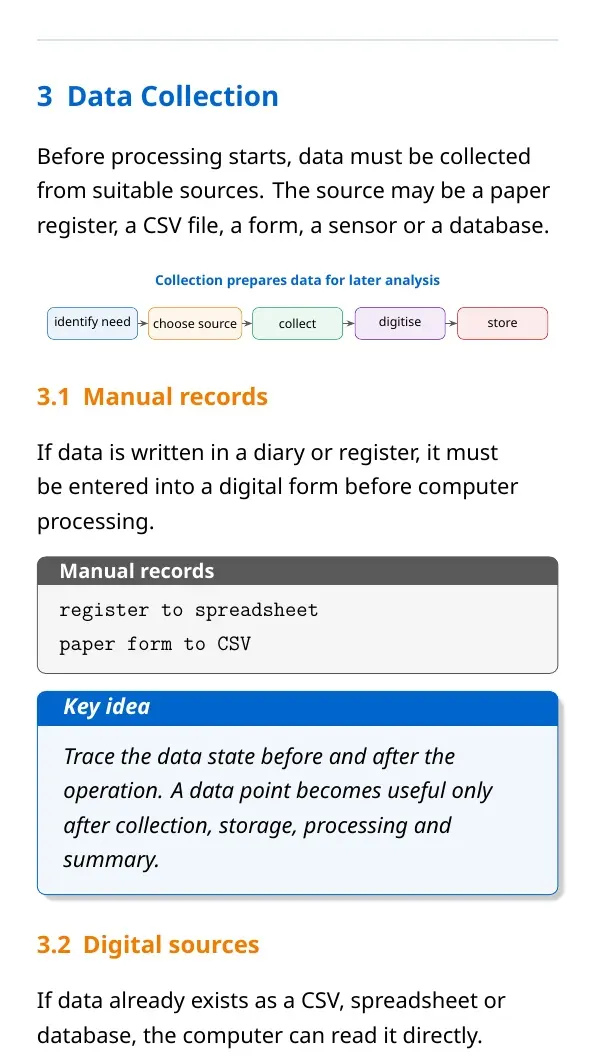
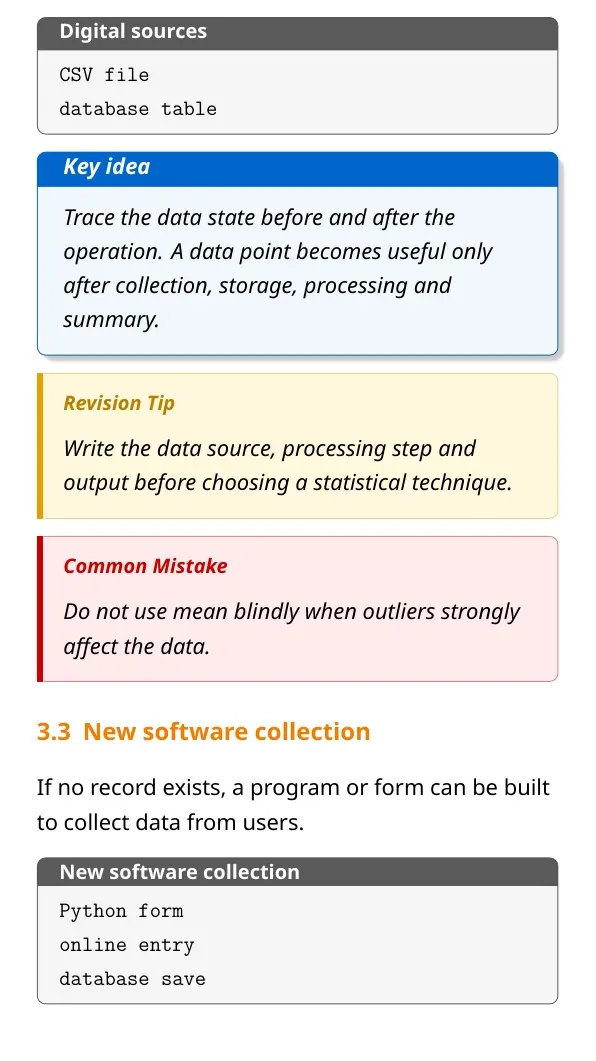
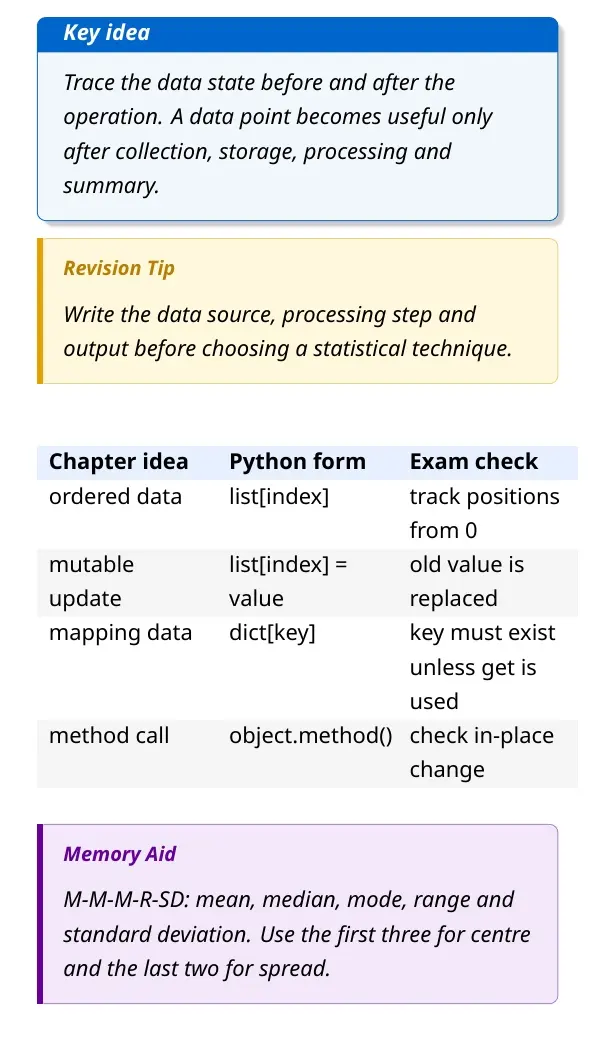
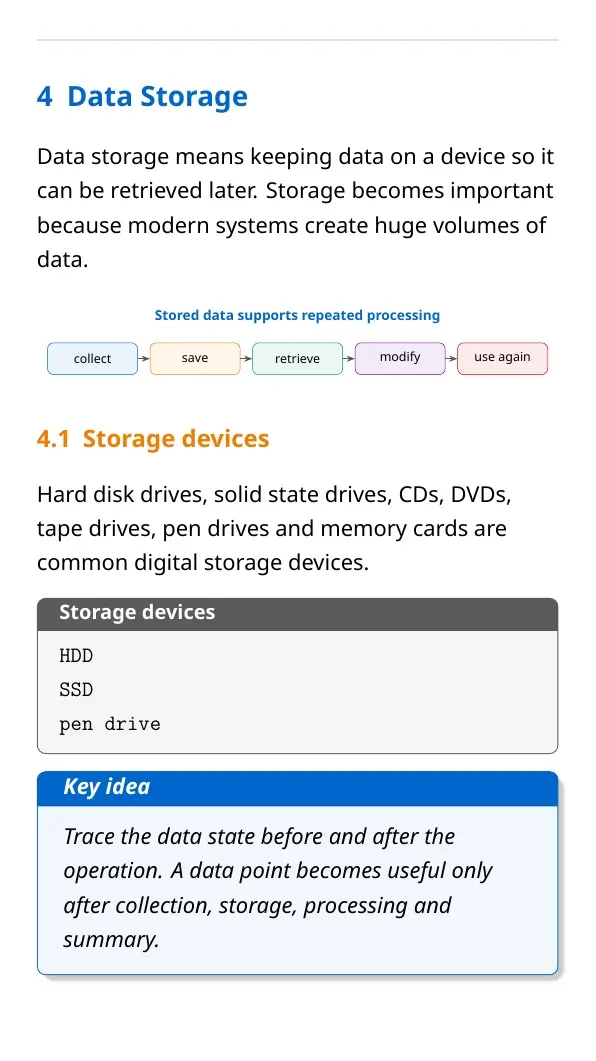
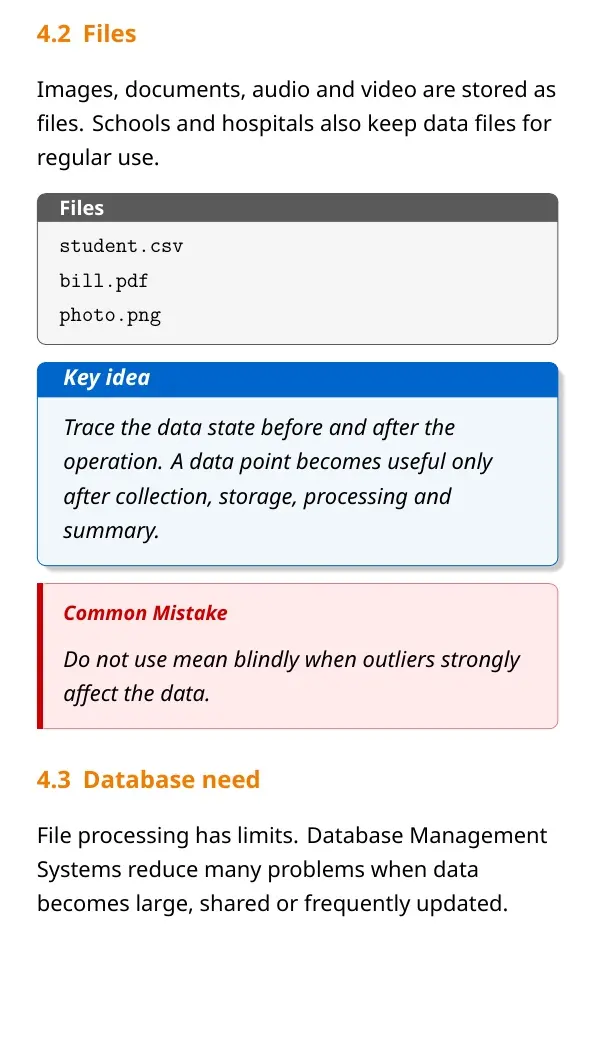
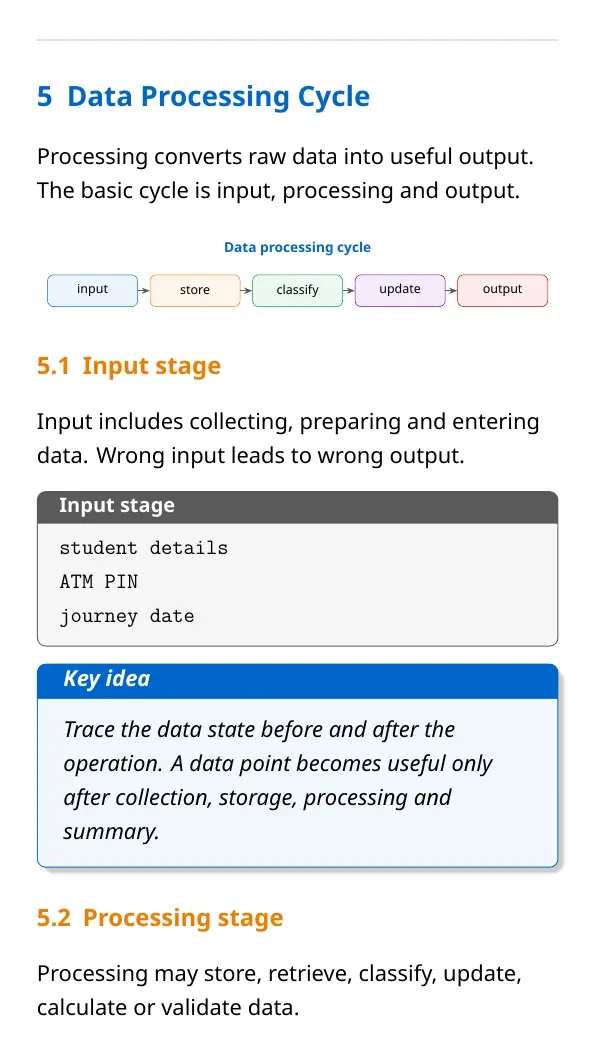
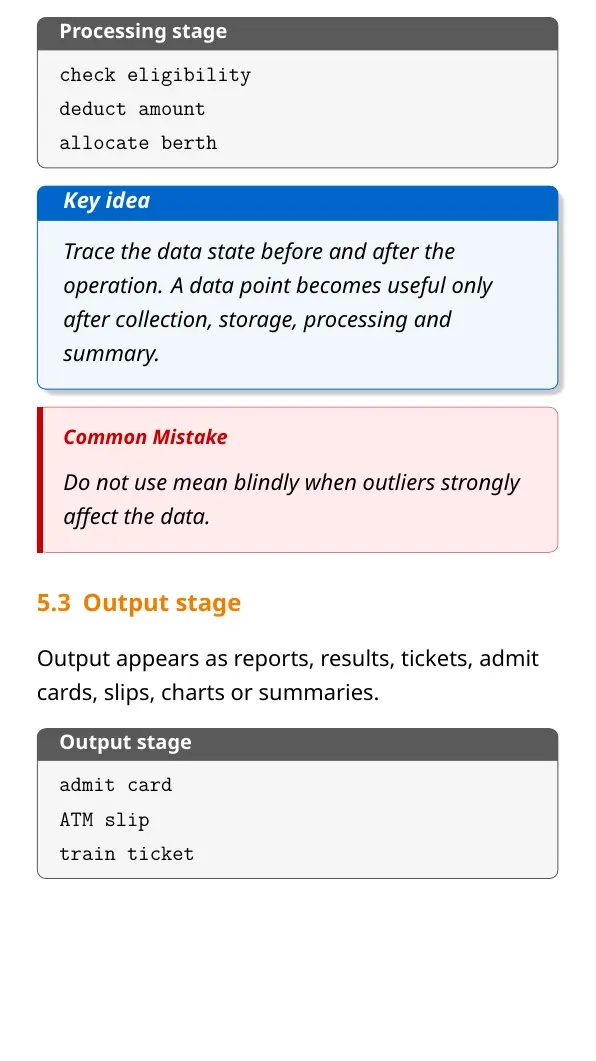
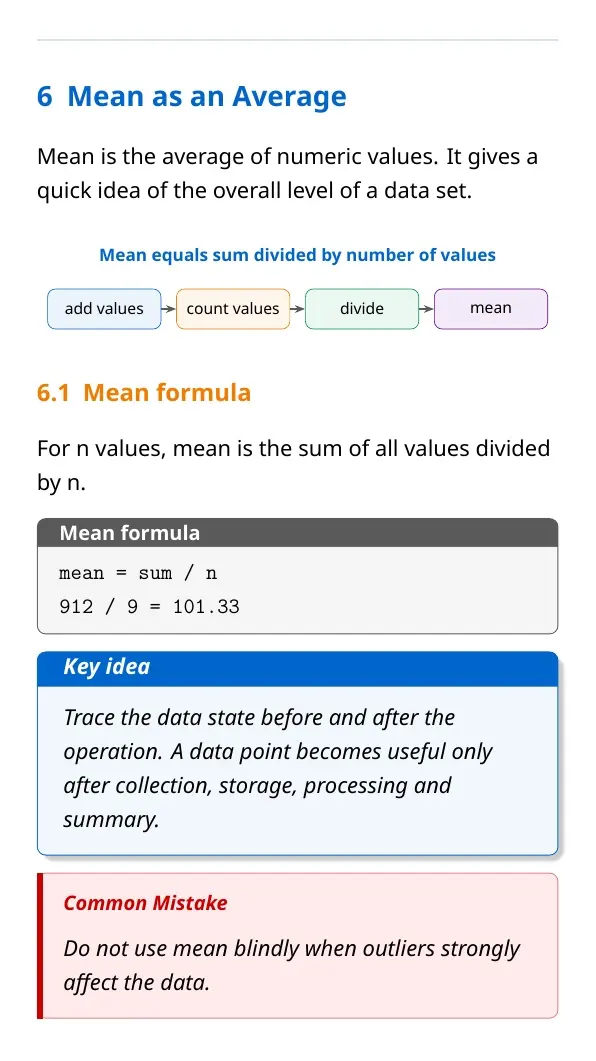
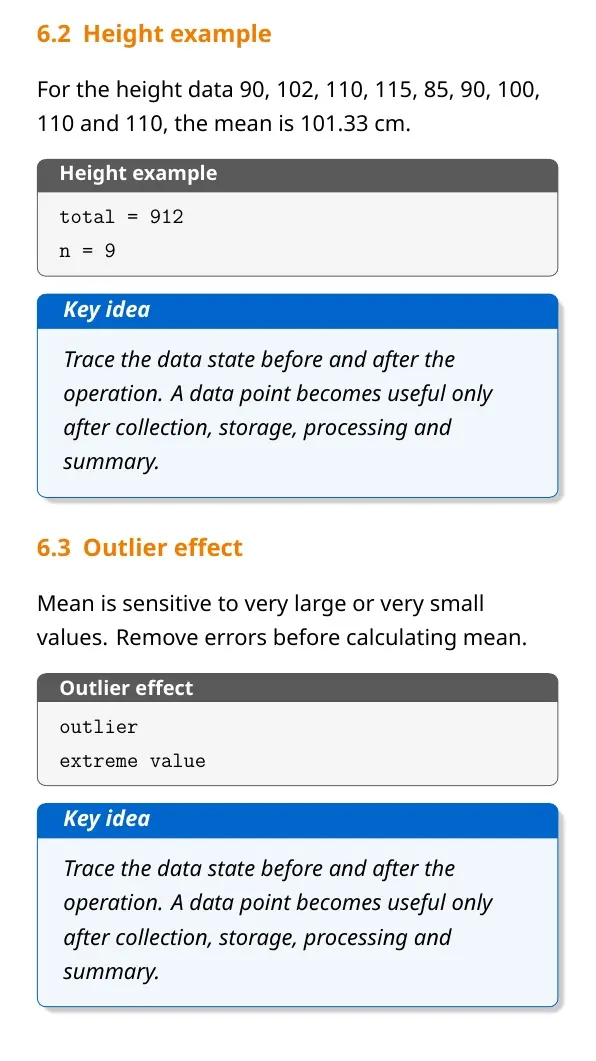
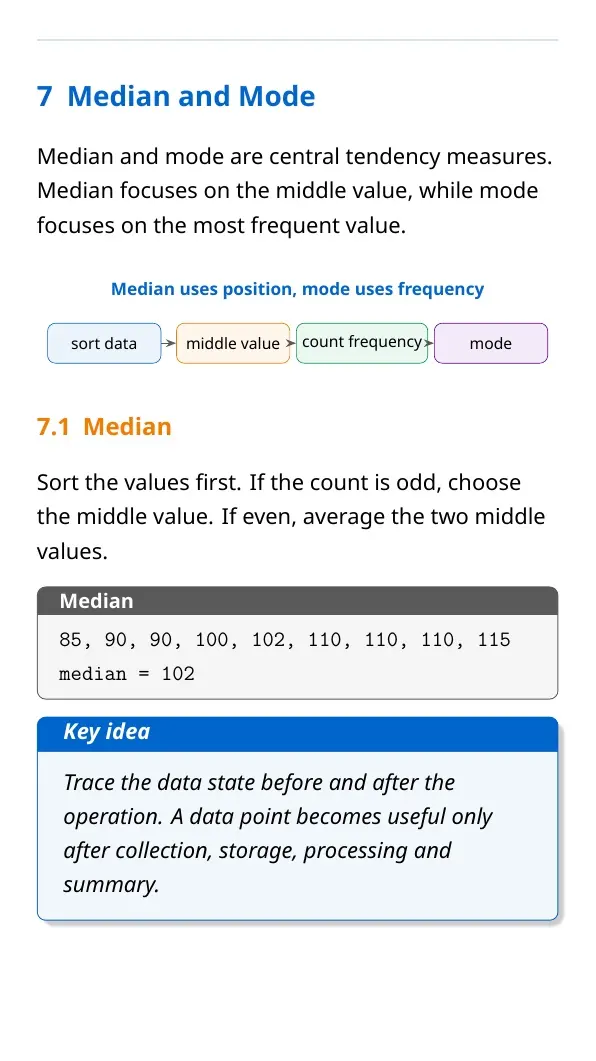
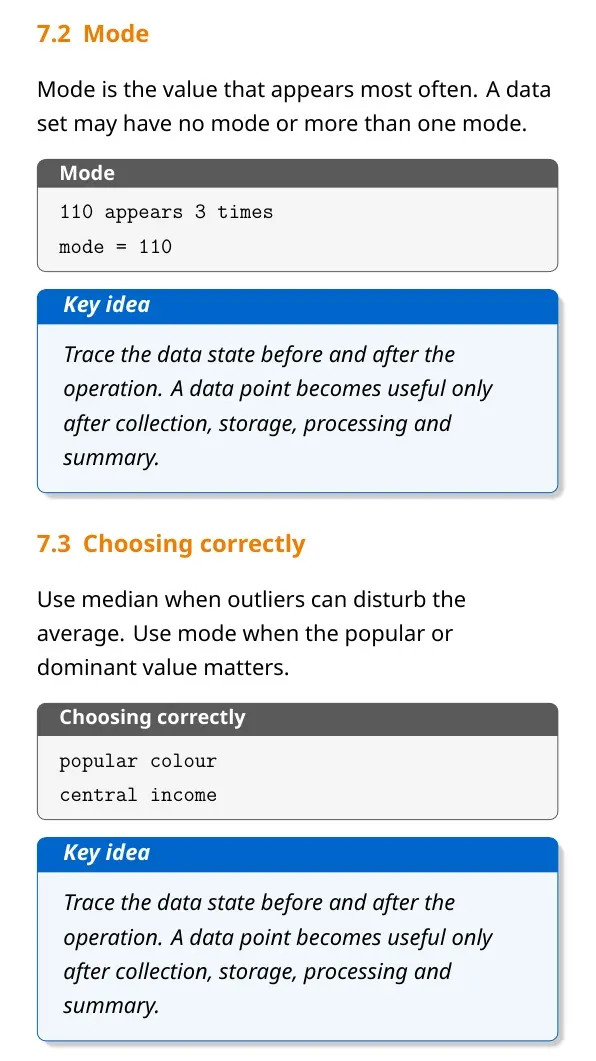
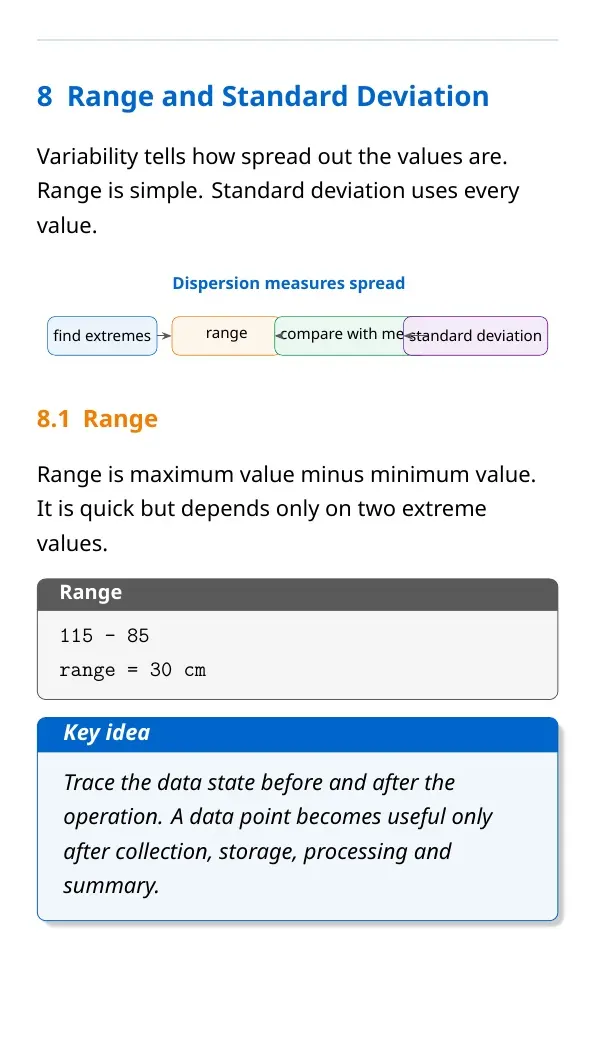
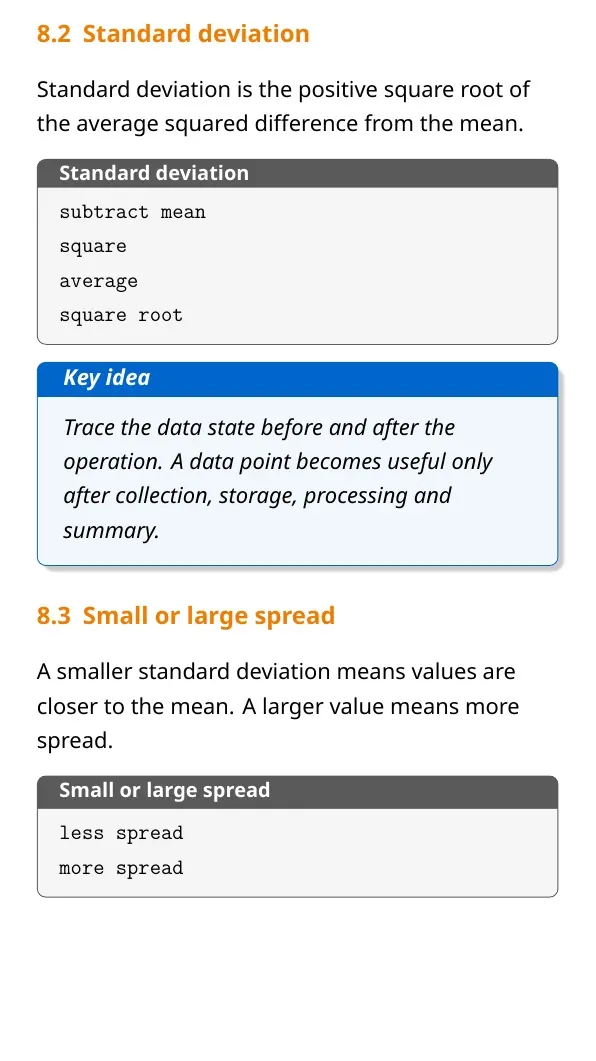
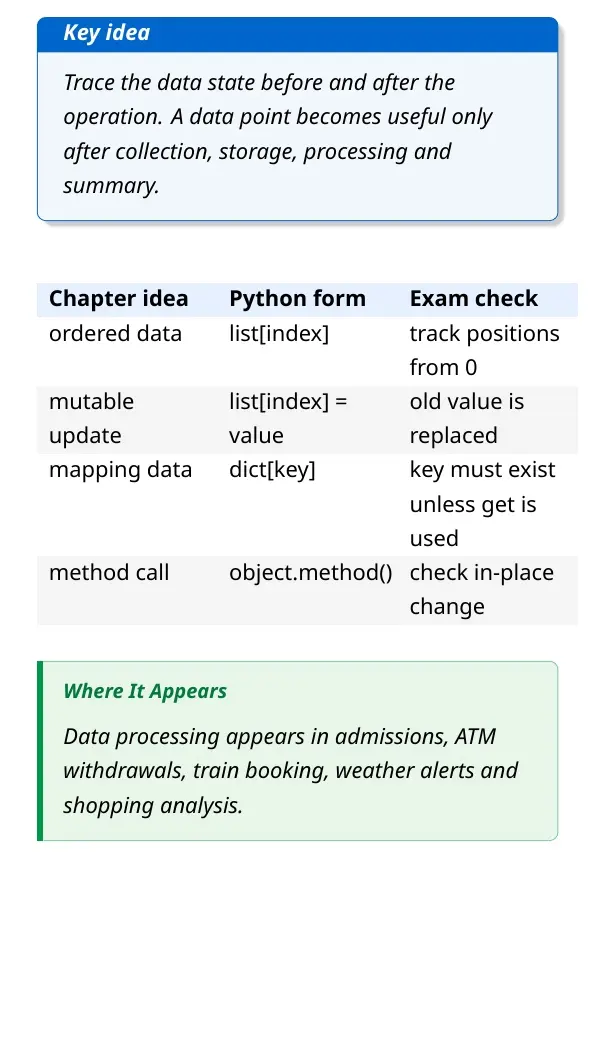
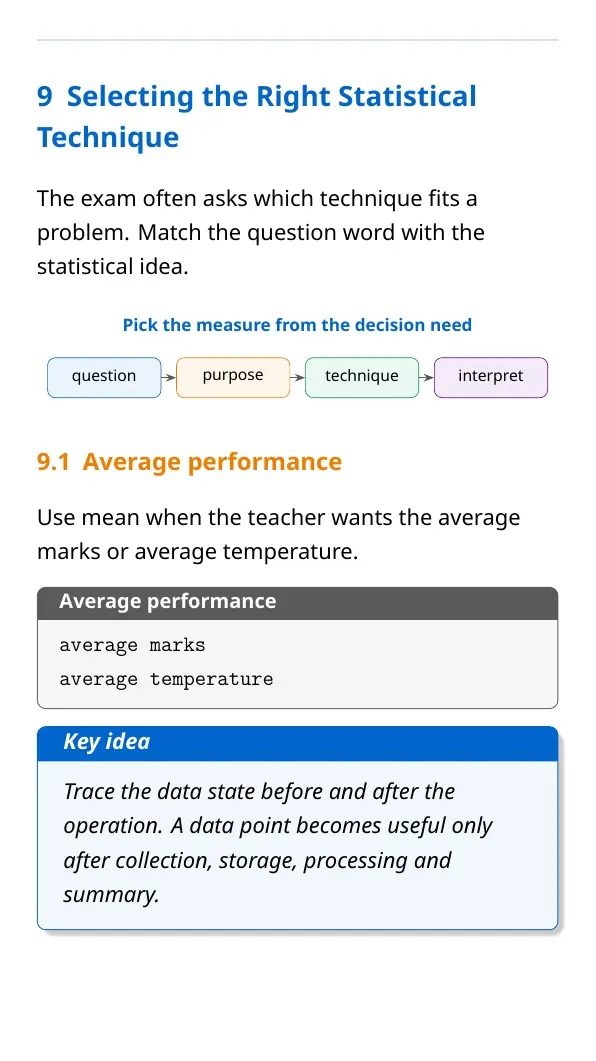
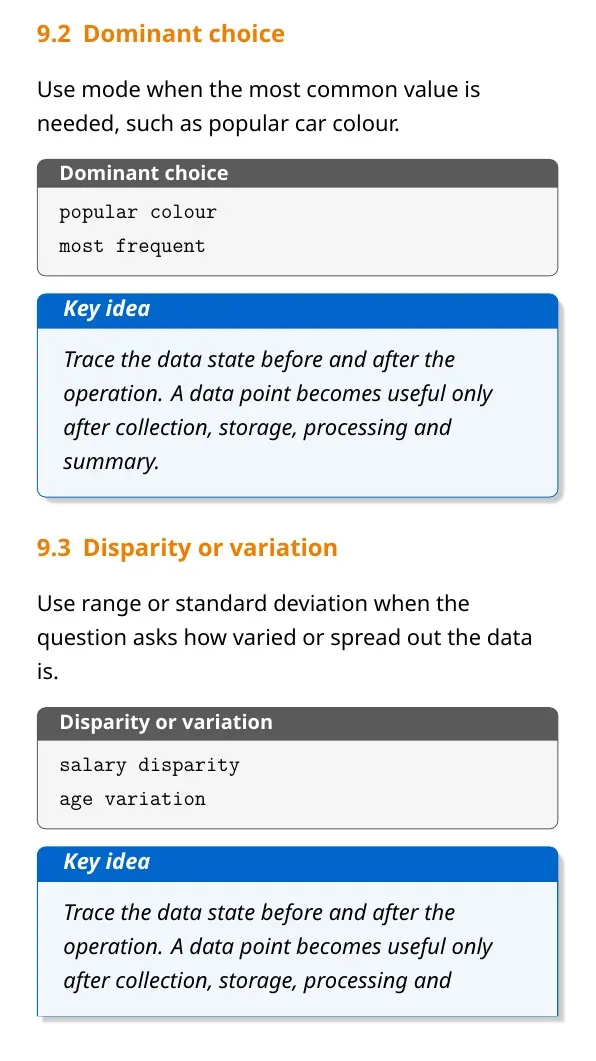
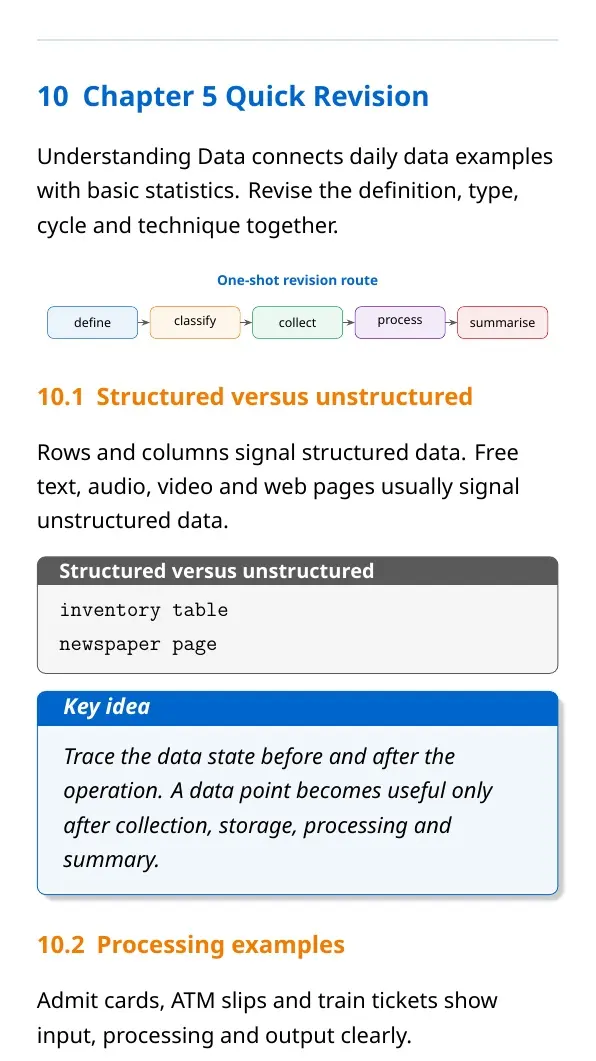
Table of Contents |
Understanding Data Notes PDF Highlights
Understanding Data introduces how raw facts become useful information. Students learn where data comes from, how it is stored and how simple statistics summarize it.
| Area | What to revise | Example |
|---|---|---|
| Data meaning | datum, data and information | census and bank transactions |
| Data type | structured, unstructured and metadata | inventory table and email |
| Processing | input, storage, processing and output | admit card or ATM slip |
| Statistics | mean, median, mode, range and SD | height data example |
Understanding Data Video Revision
Source: Magnet Brains on YouTube
Data Types, Collection and Storage
Data may be structured when it is stored in rows and columns. It may be unstructured when it is stored as text, image, audio, video, email or web content.
- Structured data: inventory, fee details and ATM records.
- Unstructured data: newspaper pages, emails, videos and web pages.
- Metadata: data about data, such as image size and file type.
- Storage: HDD, SSD, pen drive, memory card and database systems.
Data Processing Cycle
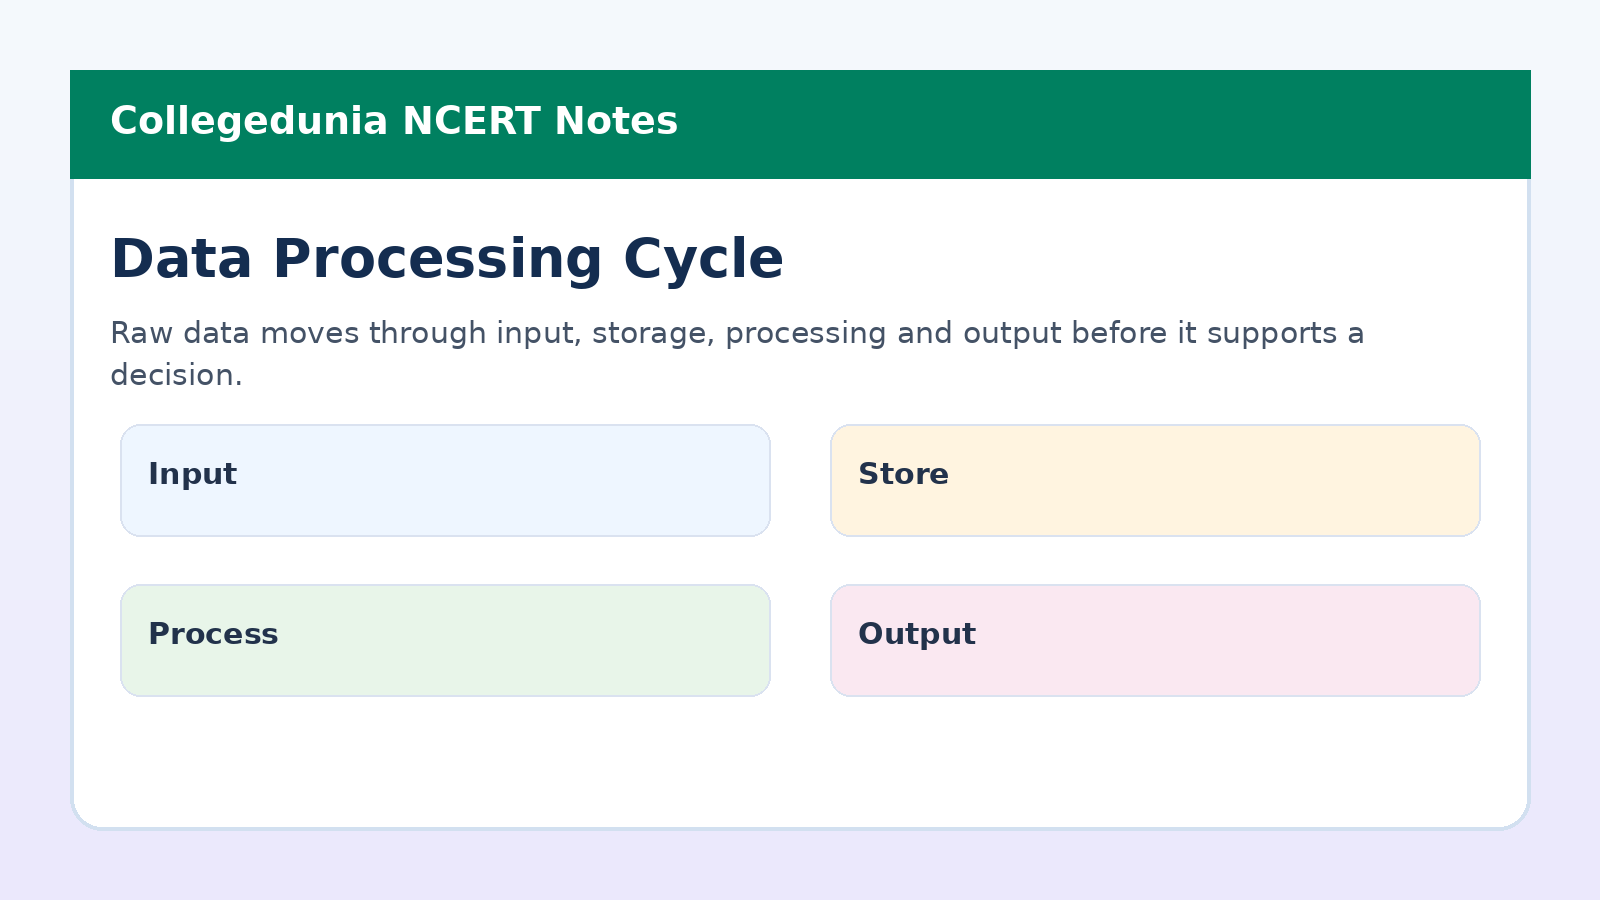
The data processing cycle starts with input and ends with useful output. The chapter uses admit cards, ATM withdrawals and train tickets to show this pattern.
| Stage | Meaning | Example |
|---|---|---|
| Input | collect and enter data | student details or ATM PIN |
| Processing | check, classify, update or calculate | check eligibility or balance |
| Output | generate result for the user | admit card, slip or ticket |
| Decision | use information for action | pricing, planning or alerts |
Mean, Median and Mode
Mean, median and mode are measures of central tendency. They summarize the centre of a data set in different ways.
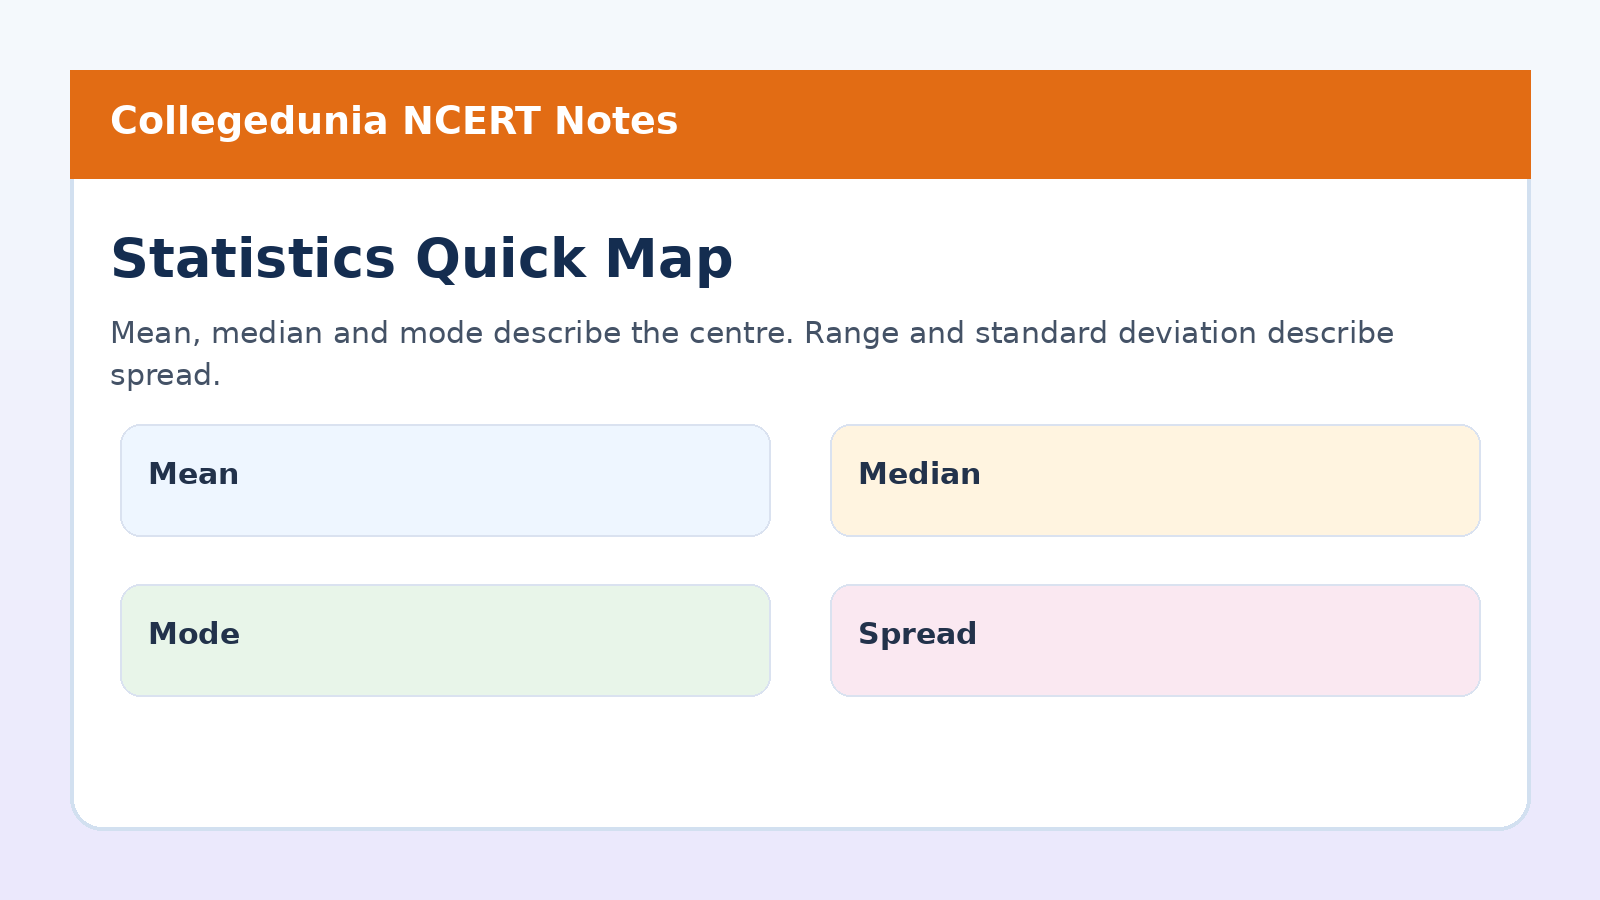
- Mean: sum of values divided by the number of values.
- Median: middle value after sorting the data.
- Mode: value that appears most often.
- Care point: mean is affected by outliers more than median.
Range and Standard Deviation
Range and standard deviation describe variability. Range uses only the largest and smallest values. Standard deviation uses every value and the mean.
| Measure | Formula idea | Use |
|---|---|---|
| Range | maximum minus minimum | quick spread check |
| Standard deviation | square root of average squared deviation | detailed spread check |
| Small SD | values close to mean | less variation |
| Large SD | values far from mean | more variation |
Other Class 11 Informatics Practices Understanding Data Resources
| Resource | Use it for | Link |
|---|---|---|
| NCERT Book PDF | Read the official chapter before revision | Understanding Data Book PDF |
| NCERT Solutions | Practise exercise answers and data questions | Understanding Data NCERT Solutions |
| Handwritten Notes | Revise quick definitions and formula checks | Understanding Data Handwritten Notes |
Class 11 Informatics Practices Notes All Chapters
| Chapter | Notes Link |
|---|---|
| Chapter 1 Computer System | Computer System Notes |
| Chapter 2 Emerging Trends | Emerging Trends Notes |
| Chapter 3 Brief Overview of Python | Brief Overview of Python Notes |
| Chapter 4 Working with Lists and Dictionaries | Working with Lists and Dictionaries Notes |
| Chapter 5 Understanding Data | Current chapter notes |
| Chapter 6 Data Handling Using Pandas I | Data Handling Using Pandas I Notes |
| Chapter 7 Data Handling Using Pandas II | Data Handling Using Pandas II Notes |
| Chapter 8 Plotting Data Using Matplotlib | Plotting Data Using Matplotlib Notes |
Understanding Data Class 11 Informatics Practices Notes FAQs
Ques. What is covered in Understanding Data Class 11 notes?
Ans. The notes cover data meaning, structured data, unstructured data, metadata, collection, storage, processing, mean, median, mode, range and standard deviation.
Ques. What is the difference between structured and unstructured data?
Ans. Structured data has a fixed row-column format. Unstructured data does not follow a fixed table format and may include text, images, audio or video.
Ques. When should students use median instead of mean?
Ans. Median is better when outliers can disturb the average, because it depends on the middle position after sorting.
Ques. What is range in data processing?
Ans. Range is the difference between the maximum and minimum values. It gives a quick idea of data spread.



Comments