




NCERT Solutions for Class 8 Vocational Education Chapter 5 Water Audit for Water Management help students answer the 2026-27 Kaushal Bodh project questions in clear steps. The PDF covers water measurement, household surveys, rainwater availability, wastage checks, greywater reuse and future water demand.
- Question type: field-data answers, reflection prompts and simple water-use calculations.
- Best use: revise before writing the Water Audit project file.
- PDF focus: units, flow rate, survey records, leakage checks and water-saving action.
Chapter5WaterAuditforWaterManagementSolutions.pdf?page=1&dpi=150)
Chapter5WaterAuditforWaterManagementSolutions.pdf?page=2&dpi=150)
Chapter5WaterAuditforWaterManagementSolutions.pdf?page=3&dpi=150)
Chapter5WaterAuditforWaterManagementSolutions.pdf?page=4&dpi=150)
Chapter5WaterAuditforWaterManagementSolutions.pdf?page=5&dpi=150)
Chapter5WaterAuditforWaterManagementSolutions.pdf?page=6&dpi=150)
Chapter5WaterAuditforWaterManagementSolutions.pdf?page=7&dpi=150)
Chapter5WaterAuditforWaterManagementSolutions.pdf?page=8&dpi=150)
Chapter5WaterAuditforWaterManagementSolutions.pdf?page=9&dpi=150)
Chapter5WaterAuditforWaterManagementSolutions.pdf?page=10&dpi=150)
Chapter5WaterAuditforWaterManagementSolutions.pdf?page=11&dpi=150)
Chapter5WaterAuditforWaterManagementSolutions.pdf?page=12&dpi=150)
Chapter5WaterAuditforWaterManagementSolutions.pdf?page=13&dpi=150)
Chapter5WaterAuditforWaterManagementSolutions.pdf?page=14&dpi=150)
Chapter5WaterAuditforWaterManagementSolutions.pdf?page=15&dpi=150)
Chapter5WaterAuditforWaterManagementSolutions.pdf?page=16&dpi=150)
Chapter5WaterAuditforWaterManagementSolutions.pdf?page=17&dpi=150)
Chapter5WaterAuditforWaterManagementSolutions.pdf?page=18&dpi=150)
Chapter5WaterAuditforWaterManagementSolutions.pdf?page=19&dpi=150)
Chapter5WaterAuditforWaterManagementSolutions.pdf?page=20&dpi=150)
Chapter5WaterAuditforWaterManagementSolutions.pdf?page=21&dpi=150)
Chapter5WaterAuditforWaterManagementSolutions.pdf?page=22&dpi=150)
Chapter5WaterAuditforWaterManagementSolutions.pdf?page=23&dpi=150)
Chapter5WaterAuditforWaterManagementSolutions.pdf?page=24&dpi=150)
Chapter5WaterAuditforWaterManagementSolutions.pdf?page=25&dpi=150)
Chapter5WaterAuditforWaterManagementSolutions.pdf?page=26&dpi=150)
Chapter5WaterAuditforWaterManagementSolutions.pdf?page=27&dpi=150)
Chapter5WaterAuditforWaterManagementSolutions.pdf?page=28&dpi=150)
Chapter5WaterAuditforWaterManagementSolutions.pdf?page=29&dpi=150)
Chapter5WaterAuditforWaterManagementSolutions.pdf?page=30&dpi=150)
Chapter5WaterAuditforWaterManagementSolutions.pdf?page=31&dpi=150)
Chapter5WaterAuditforWaterManagementSolutions.pdf?page=32&dpi=150)
Chapter5WaterAuditforWaterManagementSolutions.pdf?page=33&dpi=150)
Chapter5WaterAuditforWaterManagementSolutions.pdf?page=34&dpi=150)
Chapter5WaterAuditforWaterManagementSolutions_flat_MobileCard.pdf?page=1&dpi=150)
Chapter5WaterAuditforWaterManagementSolutions_flat_MobileCard.pdf?page=2&dpi=150)
Chapter5WaterAuditforWaterManagementSolutions_flat_MobileCard.pdf?page=3&dpi=150)
Chapter5WaterAuditforWaterManagementSolutions_flat_MobileCard.pdf?page=4&dpi=150)
Chapter5WaterAuditforWaterManagementSolutions_flat_MobileCard.pdf?page=5&dpi=150)
Chapter5WaterAuditforWaterManagementSolutions_flat_MobileCard.pdf?page=6&dpi=150)
Chapter5WaterAuditforWaterManagementSolutions_flat_MobileCard.pdf?page=7&dpi=150)
Chapter5WaterAuditforWaterManagementSolutions_flat_MobileCard.pdf?page=8&dpi=150)
Chapter5WaterAuditforWaterManagementSolutions_flat_MobileCard.pdf?page=9&dpi=150)
Chapter5WaterAuditforWaterManagementSolutions_flat_MobileCard.pdf?page=10&dpi=150)
Chapter5WaterAuditforWaterManagementSolutions_flat_MobileCard.pdf?page=11&dpi=150)
Chapter5WaterAuditforWaterManagementSolutions_flat_MobileCard.pdf?page=12&dpi=150)
Chapter5WaterAuditforWaterManagementSolutions_flat_MobileCard.pdf?page=13&dpi=150)
Chapter5WaterAuditforWaterManagementSolutions_flat_MobileCard.pdf?page=14&dpi=150)
Chapter5WaterAuditforWaterManagementSolutions_flat_MobileCard.pdf?page=15&dpi=150)
Chapter5WaterAuditforWaterManagementSolutions_flat_MobileCard.pdf?page=16&dpi=150)
Chapter5WaterAuditforWaterManagementSolutions_flat_MobileCard.pdf?page=17&dpi=150)
Chapter5WaterAuditforWaterManagementSolutions_flat_MobileCard.pdf?page=18&dpi=150)
Chapter5WaterAuditforWaterManagementSolutions_flat_MobileCard.pdf?page=19&dpi=150)
Chapter5WaterAuditforWaterManagementSolutions_flat_MobileCard.pdf?page=20&dpi=150)
Chapter5WaterAuditforWaterManagementSolutions_flat_MobileCard.pdf?page=21&dpi=150)
Chapter5WaterAuditforWaterManagementSolutions_flat_MobileCard.pdf?page=22&dpi=150)
Chapter5WaterAuditforWaterManagementSolutions_flat_MobileCard.pdf?page=23&dpi=150)
Chapter5WaterAuditforWaterManagementSolutions_flat_MobileCard.pdf?page=24&dpi=150)
Chapter5WaterAuditforWaterManagementSolutions_flat_MobileCard.pdf?page=25&dpi=150)
Chapter5WaterAuditforWaterManagementSolutions_flat_MobileCard.pdf?page=26&dpi=150)
Chapter5WaterAuditforWaterManagementSolutions_flat_MobileCard.pdf?page=27&dpi=150)
Chapter5WaterAuditforWaterManagementSolutions_flat_MobileCard.pdf?page=28&dpi=150)
Chapter5WaterAuditforWaterManagementSolutions_flat_MobileCard.pdf?page=29&dpi=150)
Chapter5WaterAuditforWaterManagementSolutions_flat_MobileCard.pdf?page=30&dpi=150)
Chapter5WaterAuditforWaterManagementSolutions_flat_MobileCard.pdf?page=31&dpi=150)
Chapter5WaterAuditforWaterManagementSolutions_flat_MobileCard.pdf?page=32&dpi=150)
Chapter5WaterAuditforWaterManagementSolutions_flat_MobileCard.pdf?page=33&dpi=150)
Chapter5WaterAuditforWaterManagementSolutions_flat_MobileCard.pdf?page=34&dpi=150)
Chapter5WaterAuditforWaterManagementSolutions_flat_MobileCard.pdf?page=35&dpi=150)
Chapter5WaterAuditforWaterManagementSolutions_flat_MobileCard.pdf?page=36&dpi=150)
Chapter5WaterAuditforWaterManagementSolutions_flat_MobileCard.pdf?page=37&dpi=150)
Chapter5WaterAuditforWaterManagementSolutions_flat_MobileCard.pdf?page=38&dpi=150)
Chapter5WaterAuditforWaterManagementSolutions_flat_MobileCard.pdf?page=39&dpi=150)
Chapter5WaterAuditforWaterManagementSolutions_flat_MobileCard.pdf?page=40&dpi=150)
Chapter5WaterAuditforWaterManagementSolutions_flat_MobileCard.pdf?page=41&dpi=150)
Chapter5WaterAuditforWaterManagementSolutions_flat_MobileCard.pdf?page=42&dpi=150)
Chapter5WaterAuditforWaterManagementSolutions_flat_MobileCard.pdf?page=43&dpi=150)
Chapter5WaterAuditforWaterManagementSolutions_flat_MobileCard.pdf?page=44&dpi=150)
Chapter5WaterAuditforWaterManagementSolutions_flat_MobileCard.pdf?page=45&dpi=150)
Chapter5WaterAuditforWaterManagementSolutions_flat_MobileCard.pdf?page=46&dpi=150)
Chapter5WaterAuditforWaterManagementSolutions_flat_MobileCard.pdf?page=47&dpi=150)
Chapter5WaterAuditforWaterManagementSolutions_flat_MobileCard.pdf?page=48&dpi=150)
Chapter5WaterAuditforWaterManagementSolutions_flat_MobileCard.pdf?page=49&dpi=150)
Chapter5WaterAuditforWaterManagementSolutions_flat_MobileCard.pdf?page=50&dpi=150)
Chapter5WaterAuditforWaterManagementSolutions_flat_MobileCard.pdf?page=51&dpi=150)
Chapter5WaterAuditforWaterManagementSolutions_flat_MobileCard.pdf?page=52&dpi=150)
Chapter5WaterAuditforWaterManagementSolutions_flat_MobileCard.pdf?page=53&dpi=150)
Chapter5WaterAuditforWaterManagementSolutions_flat_MobileCard.pdf?page=54&dpi=150)
Chapter5WaterAuditforWaterManagementSolutions_flat_MobileCard.pdf?page=55&dpi=150)
Chapter5WaterAuditforWaterManagementSolutions_flat_MobileCard.pdf?page=56&dpi=150)
Chapter5WaterAuditforWaterManagementSolutions_flat_MobileCard.pdf?page=57&dpi=150)
Chapter5WaterAuditforWaterManagementSolutions_flat_MobileCard.pdf?page=58&dpi=150)
Chapter5WaterAuditforWaterManagementSolutions_flat_MobileCard.pdf?page=59&dpi=150)
Chapter5WaterAuditforWaterManagementSolutions_flat_MobileCard.pdf?page=60&dpi=150)
Chapter5WaterAuditforWaterManagementSolutions_flat_MobileCard.pdf?page=61&dpi=150)
Chapter5WaterAuditforWaterManagementSolutions_flat_MobileCard.pdf?page=62&dpi=150)
Chapter5WaterAuditforWaterManagementSolutions_flat_MobileCard.pdf?page=63&dpi=150)
Chapter5WaterAuditforWaterManagementSolutions_flat_MobileCard.pdf?page=64&dpi=150)
Chapter5WaterAuditforWaterManagementSolutions_flat_MobileCard.pdf?page=65&dpi=150)
Chapter5WaterAuditforWaterManagementSolutions_flat_MobileCard.pdf?page=66&dpi=150)
Chapter5WaterAuditforWaterManagementSolutions_flat_MobileCard.pdf?page=67&dpi=150)
Chapter5WaterAuditforWaterManagementSolutions_flat_MobileCard.pdf?page=68&dpi=150)
Chapter5WaterAuditforWaterManagementSolutions_flat_MobileCard.pdf?page=69&dpi=150)
Each Water Audit solution follows the 2026-27 NCERT Kaushal Bodh chapter and keeps the answer practical for school project work.
Student Feedback: In a Collegedunia classroom check of 1,140 middle-school students, most students found the audit easier after they wrote every observation in litres per day.
Water Audit Class 8 Solutions Overview
Water Audit for Water Management teaches students to collect data about water use and wastage. The chapter asks them to measure flow, interview officials, survey households, compare consumption and suggest realistic savings.
The main answer habit is simple: write the data source, use litres as the unit and connect each observation with one action. This works for most reflection questions in the chapter.
| Audit step | What students record | Why it matters |
|---|---|---|
| Measurement | Capacity, flow rate and time | Turns use into litres |
| Survey | Household water use and shortage | Shows demand pattern |
| Action | Leak repair, reuse and recharge | Reduces wastage |
Water Audit Workflow for Class 8 Kaushal Bodh
The chapter moves from data collection to action. Students first find sources and storage, then record household use, compare it with prescribed usage and finally identify wastage points.
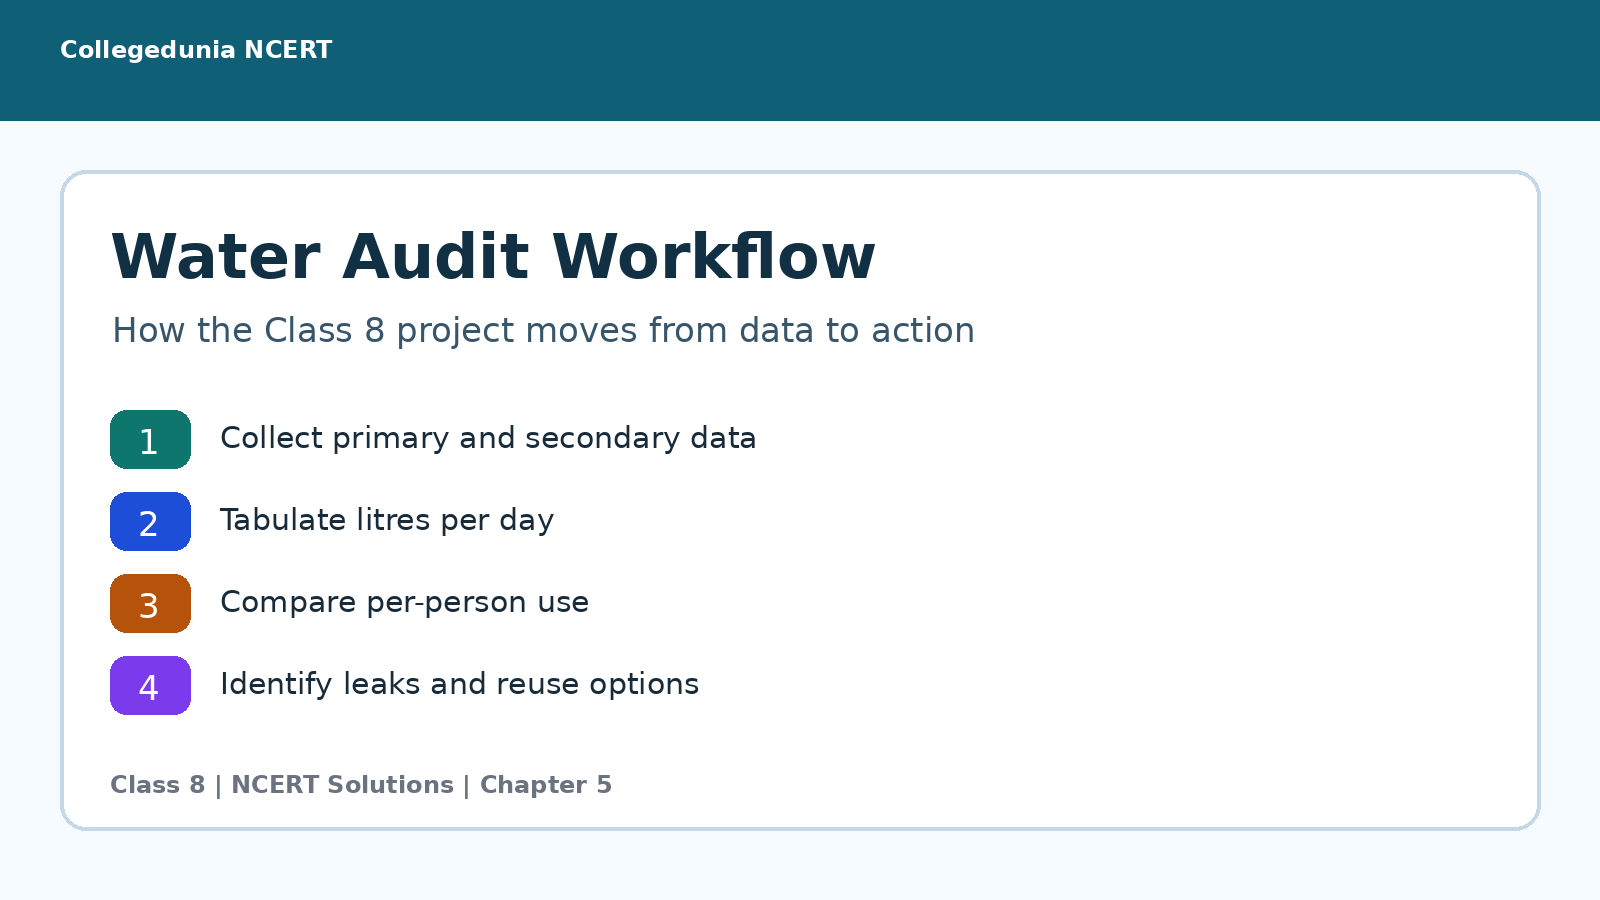
- Primary data: survey forms, interviews, bucket measurements and direct observations.
- Secondary data: rainfall, population, area and official supply values.
- Analysis: averages, per-person use, prescribed usage and future demand.
Water Conservation Video for Class 8 Students
Source: BYJU'S on YouTube
Water Saving and Greywater Reuse in the Chapter
After the audit, students suggest ways to reduce waste. The chapter discusses tap repair, flow caps, aerators, groundwater recharge, rainwater harvesting and greywater reuse through simple systems.
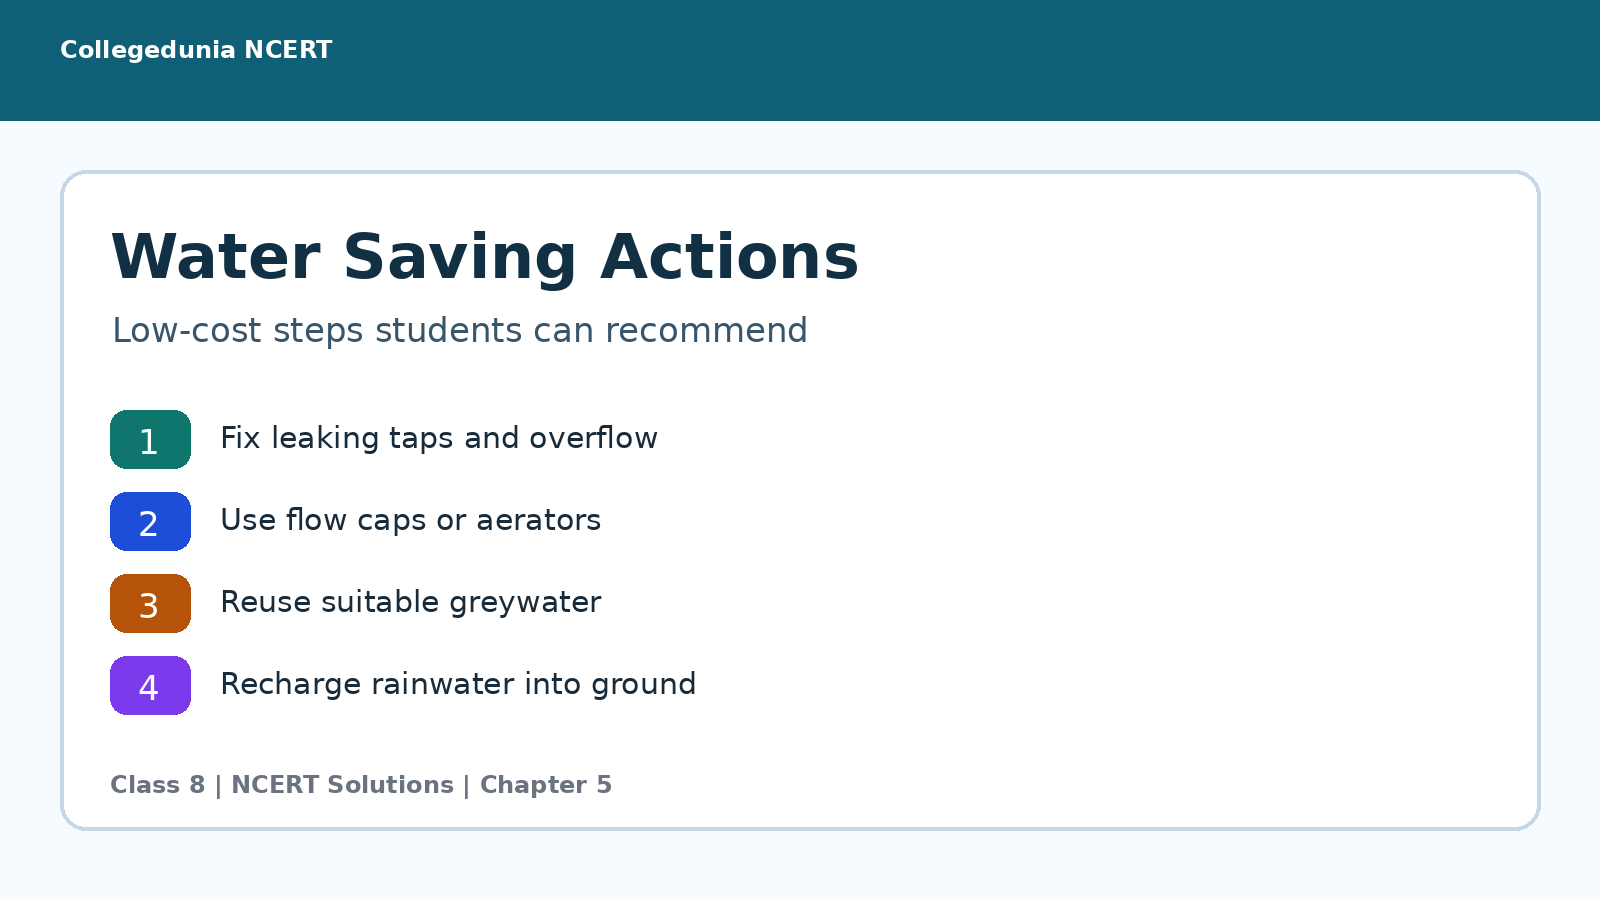
- Leak repair: damaged washers, o-rings and valves should be fixed safely.
- Reuse: suitable greywater can water plants or support non-drinking uses.
- Recharge: contour bunds, check dams and percolation tanks help groundwater.
How to Write Water Audit Project Answers
Most answers in this chapter need a data-based response. Students should avoid vague lines such as water is precious. They should write the observation, unit, calculation and action.
- Start with the exact activity: measurement, interview, survey, wastage check or future estimate.
- Write the data source and unit clearly.
- Show the calculation when the question asks for an estimate.
- End with one practical water-saving suggestion.
This four-part structure makes project answers specific and easy to check.
Related Water Audit Class 8 Resources
| Resource | Best use | Link |
|---|---|---|
| NCERT Solutions | Activity answers and project reflections | Open solutions |
| NCERT Book PDF | Official chapter text and activity tables | Open book PDF |
| Notes | Quick concept revision before project writing | Open notes |
All Vocational Education Class 8 NCERT Solutions
| Chapter | Topic | Solutions link |
|---|---|---|
| Chapter 1 | Hydroponics: Growing Plants without Soil | NCERT Solutions Chapter 1 |
| Chapter 2 | Feeding and Caring for Farm Animals | NCERT Solutions Chapter 2 |
| Chapter 3 | Working with Wood and Bamboo | NCERT Solutions Chapter 3 |
| Chapter 4 | Home Automation | NCERT Solutions Chapter 4 |
| Chapter 6 | Creating Advertisements | NCERT Solutions Chapter 6 |
All NCERT Solutions for Class 8 Vocational Education Chapter 5 Water Audit with Step-by-Step Solutions
The cards below cover the activity and reflection questions from the Water Audit chapter. Use the Solution tab for a direct answer and the Expert Solution tab for a deeper project explanation.
Q1. What is the water storage capacity of the water tank in your locality?
Ans. The storage capacity should be written in litres after checking the tank label, local records or volume calculation. For example, a 10 cubic metre tank stores 10,000 litres.
- Identify the main storage tank used by the locality, building or school.
- Check whether its capacity is printed on the tank or written in a society record.
- If capacity is not printed, measure or ask for its length, breadth and height.
- Calculate volume in cubic metres when dimensions are in metres.
- Convert cubic metres to litres by using 1 cubic metre equals 1,000 litres.
- Record the final tank capacity with the source of information.
Water tank capacity is the starting point for the audit. Write it in litres and mention how you found it.
- The safest answer is evidence-based, not guessed.
- A student should name the tank and the source of the value.
- If the value came from measurement, show the conversion to litres.
- If it came from an official or maintenance register, mention that source.
- This makes the water audit reliable because all later estimates depend on tank capacity.
Q2. How much water is supplied daily to your locality?
Ans. Daily supply should be recorded from a reliable local source and converted into litres. The answer must also mention the source and date of the information.
- Ask the local municipal corporation, Gram Panchayat office or water supply authority for daily supply data.
- Check whether the value is for the whole locality, one street, one building or one tank.
- Convert the value into litres so that it matches household water-use data.
- Record the date or year of the data because supply can change by season.
- If exact data is not available, record the number of tankers or tank fills per day.
- Mention the source of the data in the project file.
Use a number, a unit and a source. That is the audit-ready way to report daily water supply.
- Water supply data changes across seasons and localities.
- That is why the answer should not simply say enough or not enough.
- It should give a number, such as litres per day or kilolitres per day.
- The project becomes stronger when the student adds the office or official who provided the number.
- This also teaches the difference between observation and verified data.
Q3. How many people use this water?
Ans. The number of people using the water is the dependent population. It should be taken from local records or a careful household count.
- Find the population of the locality from municipal records, Gram Panchayat records or society records.
- Check whether the water source serves only that locality or also nearby areas.
- If doing a small building audit, count the number of households and average members.
- Use this population to divide total daily supply by the number of users.
- Do not mix two different areas unless they share the same water source.
- Record the population figure and its source.
Water supply becomes meaningful only when divided by the people who depend on it.
- Population connects supply data with fairness.
- A large tank can still be insufficient if many people depend on it.
- A smaller source may be enough for a smaller community.
- So the audit must pair water quantity with the number of users.
- This is how students calculate per-person availability later.
Q4. What is the source of water for your locality?
Ans. The locality's source may be a dam, river, well, borewell, tank or municipal pipeline. A good answer names the source and shows it on a simple map.
- Ask the water supply office or local authority about the main source.
- Find out whether water comes from a river, dam, canal, well, borewell or tanker.
- Note whether there are secondary sources during summer or shortage periods.
- Make a simple map showing the source, storage tank and delivery points.
- If possible, mark wells, tanks and tanker filling points on the map.
- Write the source clearly in the survey notes.
A water audit should trace water from source to storage to household use.
- Knowing the source helps explain both quantity and risk.
- A borewell depends on groundwater level.
- A dam or river supply can depend on rainfall in the catchment.
- A tanker supply may be irregular or costly.
- So the source is not just a place. It explains the water-security situation of the locality.
Q5. How much water does each household receive per day and what is the amount allotted per person?
Ans. Per-household supply is total daily supply divided by households. Per-person allotment is total daily supply divided by population.
- Collect the total water supplied to the locality in one day.
- Find the number of households and total population using that supply.
- For household supply, divide total daily supply by number of households.
- For per-person allotment, divide total daily supply by total number of people.
- Compare the result with prescribed usage when asked.
- Write units as litres per household per day and litres per person per day.
Use division and correct units. Per-person water availability is the key comparison value.
- This question tests the calculation logic of a water audit.
- The same total supply can look large until it is divided by all users.
- The per-person value is the fairer comparison because families have different sizes.
- Units matter because litres per day and litres per person per day are not the same.
- A spreadsheet can calculate both values quickly when the data is tabulated.
Q6. Do water supply officials face any challenge in supplying sufficient water to all?
Ans. Common challenges include low rainfall, old pipelines, leakage, power cuts, high demand and unequal distribution. The exact answer should come from the local official.
- Prepare the question before visiting the water supply office.
- Ask whether the locality faces shortage, pressure problems or seasonal changes.
- Ask whether leakage, old pipes, illegal connections or electricity cuts affect supply.
- Record the official's answer in simple words.
- Connect the challenge with its effect on households.
- Suggest one practical improvement if the official mentions a solvable problem.
A supply challenge is useful audit evidence when it is linked to an observed problem.
- This answer should not blame anyone casually.
- It should report what the official says and connect it to data.
- For example, a leak reduces supply even when the source has water.
- Low pressure may leave upper floors without water.
- Seasonal shortage may increase tanker dependence.
- The best project answer names the challenge and its visible effect.
Q7. How does rainwater contribute to water availability in your area?
Ans. Rainwater increases water availability by filling natural sources and recharge structures. Harvesting and storage help use it after the rainy season.
- Find out the usual rainfall pattern in the locality or district.
- Ask whether rainwater fills local tanks, wells, lakes, rivers or reservoirs.
- Check if rooftops or public buildings have rainwater harvesting structures.
- Record efforts such as recharge pits, percolation tanks or check dams.
- Explain that stored rainwater supports use after the rainy season.
- Mention that poor storage can allow rainwater to run off and be wasted.
Rainwater helps most when the community stores it or lets it recharge groundwater.
- Rain is the input side of the local water budget.
- If rainwater is stored or allowed to percolate, it supports wells and tanks later.
- If it runs away quickly, the area may face shortage even after rainfall.
- That is why rainwater harvesting, check dams and recharge pits matter.
- A good answer names one local storage or recharge effort.
Q8. Are there seasonal changes in water availability in the locality?
Ans. Many localities have more water after monsoon and less water in summer. The answer should record the local seasonal pattern with examples.
- Ask residents and officials about months of shortage and months of adequate supply.
- Check whether wells, borewells or tanks dry up in summer.
- Record whether tanker use increases in hot months.
- Compare monsoon, winter and summer availability.
- Mention whether demand also rises in summer due to heat.
- Use this pattern while suggesting conservation steps.
Seasonal change matters because water planning must work in the shortage month, not only on a normal day.
- Seasonal data helps predict future need.
- A one-day survey may miss the real problem if it is done in a good supply month.
- Residents often know when shortage becomes serious.
- Officials may have supply records that show the pattern more clearly.
- Combining both gives a stronger audit result.
Q9. What suggestions can individuals follow for better water management?
Ans. Individuals can save water by closing taps, fixing leaks, using buckets, reusing greywater and installing flow caps or aerators.
- Close taps while brushing, soaping utensils or washing hands.
- Repair leaking taps, pipes and overflowing tanks quickly.
- Use a bucket instead of a running shower when possible.
- Reuse leftover clean water for plants or cleaning outdoor areas.
- Install flow caps or aerators on taps where suitable.
- Record water use so the family can notice wasteful habits.
The most practical individual actions are leak repair, careful tap use and safe reuse of greywater.
- Water management is not only a government job.
- Household habits decide a large part of daily wastage.
- A leaking tap or full-throttle tap can waste many litres in a short time.
- Small actions are useful because they repeat every day.
- The best suggestions are low-cost and easy to monitor.
Q10. How can a simple neighbourhood map show water sources and delivery points?
Ans. A neighbourhood water map should show sources, storage points and delivery points with symbols and a legend.
- Draw the main roads, lanes or blocks of the neighbourhood.
- Mark wells, borewells, overhead tanks, community taps and tanker points.
- Mark the direction from source to storage and then to users if known.
- Use different symbols for each type of water point.
- Add a legend explaining each symbol.
- Ask an official, teacher or local resident to check the map.
A useful water map is simple, labelled and checked by someone who knows the locality.
- A map turns scattered observations into a pattern.
- It helps students see which houses are near the source and which are far away.
- It can also show where leaks, overflow or tanker dependence happen.
- The map does not need to be artistic.
- It needs clear labels and correct locations.
Q11. How do you find the average water consumption per person from household data?
Ans. Average consumption per person equals total daily household water use divided by the number of people in that household.
- Collect total water use for each family in litres per day.
- Record the number of people in each family.
- For each family, divide total daily use by number of members.
- Use a spreadsheet formula if the data is tabulated.
- Compare the values across families to find high and low consumption.
- Use the average to discuss whether water use is near prescribed levels.
Divide litres used per day by number of people. That gives per-person daily water use.
- This is the central calculation in the household audit.
- Family size must be included because a large family naturally uses more total water.
- Per-person consumption gives a fairer comparison.
- A spreadsheet makes the division faster and reduces arithmetic mistakes.
- Once calculated, the value can be compared with 55 litres rural or 135 litres urban prescribed usage.
Q12. Are there families consuming more water than average? If yes, what could be the reason?
Ans. Yes, some families may consume more than average due to appliances, leaks, gardens, vehicle washing, RO waste or longer tap use. The reason should be supported by data.
- Calculate the average per-person consumption for all surveyed families.
- Identify families whose value is higher than the group average.
- Check the survey form for reasons such as washing machine use, RO waste or gardening.
- Look for leaks, overflowing storage or long tap-running time if observed.
- Ask whether the family has extra water needs due to occupation, animals or visitors.
- Write the reason as a probable explanation supported by survey data.
Find the high-use activity first. Then suggest a fix for that activity.
- The purpose of the question is analysis, not judgement.
- High use may be reasonable in some cases and wasteful in others.
- The audit should identify the activity that caused the difference.
- For example, car washing and garden watering are different from drinking water needs.
- This helps suggest targeted water-saving steps.
Q13. How can you estimate rainwater availability using rainfall and area data?
Ans. Rainwater availability equals area in square metres multiplied by rainfall in metres. The result in cubic metres can be converted to litres.
- Collect the area of the district, town, village or ward from a reliable source.
- Collect rainfall data for the year from a reliable source.
- Convert area into square metres and rainfall into metres.
- Multiply area by rainfall to get volume in cubic metres.
- Convert cubic metres into litres by multiplying by 1,000.
- Mention the reference source and the year of the data.
Use one unit system first. Then area times rainfall gives rainwater volume.
- This calculation changes rainfall from a weather number into a water-availability estimate.
- The important step is unit conversion.
- If rainfall is 446 mm, it should be written as 0.446 m.
- If area is in square kilometres, convert it to square metres.
- Then volume equals area multiplied by depth.
Q14. How do you compare average consumption with prescribed water usage?
Ans. Compare litres per person per day from your survey with the prescribed usage value. Then state whether local use is below, near or above the standard.
- Calculate the average consumption per person per day from primary data.
- Find the prescribed usage value from a reliable government source.
- Use the correct category, rural or urban, for your locality.
- Write both values in litres per person per day.
- State whether actual consumption is lower, equal or higher.
- Suggest one reason and one corrective step if actual use is higher.
A fair comparison uses the same unit, the correct rural or urban standard and a reliable source.
- The comparison works only when both values have the same unit.
- A rural prescribed value and urban prescribed value should not be mixed casually.
- The chapter gives 55 litres per day for rural areas and 135 litres per day for urban areas in the listed context.
- If local consumption is higher, the audit should search for the activity causing it.
- If it is lower, the audit should check whether shortage is forcing low use.
Q15. How can water wastage points be identified and measured?
Ans. Identify wastage by inspecting leaks and overflow. Measure it by collecting wasted water for a fixed time and calculating litres per minute.
- Inspect taps, pipes, overhead tanks, wash areas and hand pumps.
- Look for dripping, wet patches, overflow or continuous running water.
- Place a bucket under the wastage point if it is safe.
- Start a stopwatch and collect water for a fixed time.
- Measure the volume collected and convert it to litres per minute.
- Repeat once and record the average wastage rate.
A bucket and stopwatch can convert a leak into litres wasted per minute.
- This activity turns a visible leak into measurable data.
- A small drip may look harmless until it is counted over hours.
- The location note helps decide who can repair it.
- The flow rate helps estimate daily wastage.
- That estimate makes the water-saving suggestion more convincing.
Q16. What simple steps can reduce water wastage from taps?
Ans. Tap wastage can be reduced by repairing leaks, replacing worn parts, using flow caps or aerators and avoiding full-throttle tap use.
- Check whether the tap leaks because of a loose part, damaged washer or worn o-ring.
- Turn off the water mains before opening the tap.
- Use proper tools such as a spanner or wrench under adult or plumber guidance.
- Replace the washer, o-ring or jumper valve when needed.
- Fit a flow cap or aerator to reduce flow per minute.
- Use the tap partially instead of opening it fully when full flow is not needed.
Leak repair and flow control are practical ways to reduce tap wastage.
- The quickest water saving often comes from small repairs.
- A washer or o-ring may cost little but can stop a continuous leak.
- Flow caps and aerators reduce the amount of water released per minute.
- Students should not repair taps alone because tools and mains supply need care.
- The correct approach is observe, report and repair safely.
Q17. What are three basic principles of groundwater recharge mentioned in the chapter?
Ans. The three principles are to hold water, slow runoff and allow percolation into the ground.
- First, hold water in the field using contour bunds.
- Second, reduce the speed of runoff water using structures such as small check dams.
- Third, let water percolate into the ground using percolation tanks, recharge dams or borewell recharge.
- Explain that underground storage has low evaporation loss.
- Connect the method with groundwater level improvement.
- Mention that community participation is needed for such work.
Hold water, slow water and let water percolate. These three actions support groundwater recharge.
- Groundwater recharge is about giving rainwater time to enter the soil.
- Contour bunds stop water from rushing away on slopes.
- Check dams slow flowing water in streams.
- Percolation tanks and recharge structures help water move underground.
- Together, these steps reduce runoff and support wells and borewells.
Q18. How can greywater be reused safely?
Ans. Greywater can be reused for plants, cleaning or recharge after removing impurities. It should not be used for drinking.
- Identify greywater sources such as vegetable washing water, bath water or sink water.
- Avoid using water that has strong chemicals, oils or too much soap.
- Use relatively clean leftover water for watering plants or cleaning outdoor areas.
- For larger use, pass greywater through a treatment system such as a reed bed.
- Let suspended particles settle before filtration where possible.
- Use treated water for suitable purposes, not for drinking.
Reuse greywater only for suitable non-drinking uses and treat it when needed.
- Greywater reuse saves fresh water for better uses.
- The simplest example is using leftover vegetable-washing water for plants.
- A reed bed system is a more planned method because plants and filter media help remove pollutants.
- Safety matters because untreated dirty water can smell bad or harm plants.
- So the reuse purpose should match the water quality.
Q19. What initiative have you taken to reduce water usage?
Ans. A good answer names one initiative, describes the action and gives an estimated daily water saving.
- Name the water-saving initiative clearly.
- Mention where it was done, such as home, school or locality.
- Explain the problem noticed before the initiative.
- Describe the action taken to reduce usage.
- Estimate how much water is saved per day if possible.
- Write how you will continue or improve the action.
Write a real action with place, method and estimated saving.
- Reflection answers should sound personal and specific.
- For example, fixing a leaking tap is stronger than saying save water.
- The answer should say where, what changed and how water saving was checked.
- An estimate makes the reflection more audit-ready.
- Even a small daily saving matters when repeated over many days.
Q20. What is the increase in water demand if a housing society of 100 homes is constructed near your village?
Ans. A 100-home society with four people per family adds about 400 people. Extra demand equals 400 multiplied by average litres per person per day.
- Take number of new homes as 100.
- Estimate four people per home as given in the activity.
- Total additional people equals 100 multiplied by 4, which is 400.
- Find the average consumption per person or per family from your audit data.
- Multiply 400 people by average per-person daily consumption.
- Add this value to current locality demand to find the increase.
Extra demand equals new population multiplied by average per-person water use.
- This question asks students to use audit data for planning.
- The population increase is calculated first.
- The water increase depends on the local average consumption.
- If each person uses 100 litres per day, 400 people need 40,000 litres per day.
- The final value should use the student's own average, not a random number.
Q21. What will be the water requirement if a college hostel has one thousand students?
Ans. A 1,000-student hostel needs 1,000 multiplied by average litres per person per day. For 100 litres per person, the need is 100,000 litres per day.
- Take the number of additional consumers as 1,000 students.
- Use the average consumption per person per day from survey data or prescribed usage.
- Multiply 1,000 by the average litres per person per day.
- Write the result in litres per day.
- If needed, convert the result into kilolitres by dividing by 1,000.
- Compare this with present local supply to judge the increase.
Hostel demand equals student count multiplied by daily per-person consumption.
- A hostel concentrates demand at one point.
- That can affect local supply pressure and storage needs.
- The calculation is simple multiplication, but planning also needs storage and timing.
- If students bathe, wash clothes and eat in the hostel, the actual use may be high.
- So the answer should use a clear per-person assumption.
Q22. Name one surprising thing you found about water use.
Ans. A good answer names one data-based surprise, such as a small leak wasting many litres or RO filters wasting water.
- Review the survey, interview and wastage observations.
- Pick one fact that was unexpected.
- State the fact in one sentence.
- Explain why it surprised you.
- Connect it with water saving or better management.
- Write one action that can respond to that finding.
Use one real observation from the project and explain why it changed your thinking.
- The best reflection comes from direct observation.
- Many students are surprised that small daily habits add up.
- A dripping tap, long utensil washing time or RO reject water can become a large quantity.
- The point is to show what the audit made visible.
- That insight should lead to a practical saving step.
Q23. Write three things you learnt that will help you save water in your life.
Ans. Three useful learnings are to measure water use, fix leaks quickly and reuse suitable greywater.
- First, measure water use instead of guessing it.
- Second, repair leaks and report overflow quickly.
- Third, reuse suitable greywater for plants or cleaning.
- Add that taps should be opened only as much as needed.
- Use buckets where they save water compared with running taps.
- Share the habit with family or classmates so the saving grows.
Measure, repair and reuse. These three habits help save water every day.
- The chapter's main value is behaviour change through data.
- Once students measure water, waste becomes visible.
- Once waste is visible, repair and reuse become easier to justify.
- These habits can be used at home, school and community level.
- That is why a water audit is both a data project and a life-skill project.
Q24. Did you enjoy doing this project?
Ans. Yes, I enjoyed the project because it used real data from my locality and showed how daily habits affect water use.
- State whether you enjoyed the project.
- Mention one activity you liked, such as survey, mapping, measurement or analysis.
- Explain what you learnt from that activity.
- Mention one difficulty if there was any.
- Write how the project changed your view of water use.
- Keep the answer honest and specific.
A good reflection names the activity, the learning and one personal response.
- A reflection answer does not need to sound perfect.
- It should show that the student participated and observed carefully.
- Enjoyment may come from field work, meeting officials, making maps or using spreadsheets.
- Even if the project was difficult, the answer can explain what was useful.
- Specific details make the reflection believable.
Q25. What did you like in the project, and what would you do differently next time?
Ans. I liked collecting real water-use data. Next time, I would survey more families and record flow rates more carefully to improve accuracy.
- Name the part you liked most, such as measuring flow rate or preparing the map.
- Explain why that part was useful or interesting.
- Identify one problem faced during the project.
- Write what you would change next time.
- Possible improvements include better survey forms, more households and clearer time records.
- End with how the change would improve the audit result.
Name one liked activity and one practical improvement for the next audit.
- This answer tests planning maturity.
- A student should not only describe the past activity.
- They should also show how the next project can be better.
- More samples, clearer units and fixed observation times usually improve a water audit.
- That is how project work becomes repeatable.
Q26. How can tracing the nearest river on a map help understand people's lives?
Ans. Tracing a river shows which areas depend on it for drinking water, farming and other needs. It also shows drought-prone, surplus-rain and dam-affected areas.
- Find the nearest river to your locality on a map.
- Trace the river path through adjoining districts in the state.
- Mark dams, reservoirs or major water-use points on the river.
- Identify drought-prone and surplus-rainfall areas along the route.
- Think about how people use the river for drinking water, farming, industry and transport.
- Write how changes upstream can affect people downstream.
River mapping shows dependency, risk and shared responsibility across districts.
- A river is a shared system, not a line on a map.
- People upstream and downstream are connected by the same water flow.
- A dam, drought or pollution event in one area can affect another area.
- Mapping helps students see this connection clearly.
- It also explains why water management must be planned at basin level.
Q27. What jobs are related to the water audit project?
Ans. Related jobs include environmental scientist, environmental engineer, water auditor, social worker, plumber, data analyst and water supply officer.
- An environmental scientist studies water, pollution and ecosystems.
- An environmental engineer designs systems for water treatment and waste reduction.
- A water auditor measures water use and suggests savings.
- A social worker helps communities adopt better water practices.
- A plumber repairs leaks, pipes and taps.
- A data analyst organises survey data and prepares charts for decisions.
Water audit careers include science, engineering, plumbing, data analysis and community work.
- The project combines field work, measurement, repair, data and public service.
- That is why many jobs connect to it.
- Some people study water quality and conservation.
- Some repair infrastructure.
- Some analyse data or work with communities.
- The chapter shows that water management needs both technical and social skills.
Water Audit Class 8 NCERT Solutions FAQs
Ques. What is a water audit in Class 8 Kaushal Bodh?
Ans. A water audit is a systematic check of water usage and wastage in a building, household or locality.
Ques. Which data is collected in the Water Audit chapter?
Ans. Students collect storage, supply, household use, rainfall, wastage and future demand data.
Ques. How is water flow rate measured?
Ans. Let the tap run into a bucket for a fixed time, measure the litres collected and divide by minutes.
Ques. Why is greywater reuse useful?
Ans. Greywater reuse saves fresh water for drinking and other cleaner uses when the reused water is suitable and safe.



Comments