



Education Journalist | Study Abroad Lead
Interquartile Range can be defined as the difference between the third and the first quartile. Quartiles are those partitioned values that divide a list of numerical data into four equal parts. Thus, there are basically three quartiles, first, second and third, that are denoted by Q1, Q2 and Q3 respectively. The first quartile (Q1) is known as the lower quartile, the second Quartile (Q2) is nothing but the median of the given data and the third Quartile (Q3) is known as the upper quartile. Hence, it can be said that the interquartile range is equal to the difference between the upper quartile and the lower quartile or the middle half of the data set.
Table of Contents
| Table of Content |
Key Takeaways: Interquartile Range, Outliers, Quartiles, Range, Median, Mean, Semi-Interquartile Range, Distribution of Data, Upper Quartile, Lower Quartile
Definition of Interquartile Range
[Click Here for Sample Questions]
Interquartile Range gives the range of the middle half of a data set. Consider dividing your data into quarters to visualise the interquartile range. Quarters are referred to as quartiles and they are labelled Q1, Q2, and Q3 in order of low to high. The smallest quarter of values in the data collection is covered by the lowest quartile (Q1). The highest quarter of values is represented by the upper quartile (Q3). The middle half of the data, between the upper and lower quartiles, is called the interquartile range. To put it another way, the interquartile range encompasses the 50% of data points that fall between Q1 and Q3.
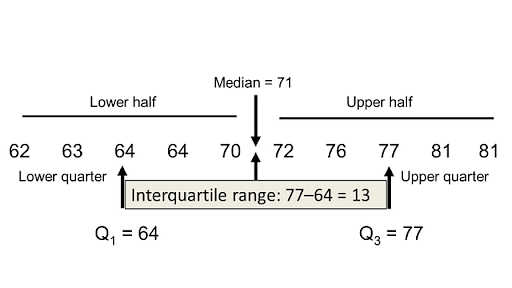
Interquartile Range
Interquartile Range Formula
[Click Here for Sample Questions]
The Interquartile Range (IQR) is the difference between the first quartile and third quartile. Given below is the formula for the interquartile ranges:
Interquartile Range = Upper Quartile – Lower Quartile = Q3 – Q1
Where
- Q1 refers to the first quartile of the series
- Q3 refers to the third quartile of the series

Interquartile Range Formula
Read More: Interquartile Range Formula: Definition, Formula and Calculation
Semi Interquartile Range
[Click Here for Sample Questions]
A measure of spread or dispersion is the semi-interquartile range. It's calculated as half the difference between the 75th percentile (Q3) and the 25th percentile (Q1).In simpler terms, semi-interquartile range refers to one-half of the difference between the first and third quartiles.
The formula for Semi Interquartile Range is as follows:
Semi Interquartile Range = (Q3– Q1) / 2
Read More: Measures of Dispersion
Median and Interquartile Range
[Click Here for Sample Questions]
When the data are not normally distributed, not measured on an interval scale, and/or there is only a small sample, a summary of the distribution of scores (central and spread) for a variable is needed. Thus, they are employed in the same data situations as the mean and standard deviation, except when the data are significantly non-normally distributed, the dependent variable's measurement scale is ordinal (rather than interval or ratio), or the sample size is too small.
The median is the value in the "middle" of the distribution, with 50% of the scores bigger than the median and 50% of the scores smaller than the median. It's vital to remember that this meaning of "middle" differs from the one used to describe the mean.
The Interquartile range (IQR) is the range of values in which the middle 50% of the scores are found. The first quartile (Q1) is the lower bound of the interquartile range; 25% of the scores have a value less than Q1 and 75% of the scores have a value greater than Q1. The third quartile (Q3) — 75 percent — is the upper bound of the interquartile range.
- Q1 – Lower Quartile Part
- Q2 – Median
- Q3 – Upper Quartile Part
Read More: Difference between Mean and Median
How to Calculate the Interquartile Range?
[Click Here for Sample Questions]
We can find the interquartile range with the help of the given steps:
- First, you need to arrange the given data into increasing (Ascending) or decreasing (Descending) order.
- Now, count the number of given values. If the number is odd, then the centre value is median else calculate the mean value for two centre values. This middle value is known as the Q2 value. In case there are an even number of values, the median will be the average of the middle two values.
- The median will distribute the given values into two equal parts as Q1 and Q3.
- The median of data values that are below the median represents Q1.
- The median of data values that are above the median value represents Q3.
- Lastly, subtract the median values of Q1 and Q3.
- The value obtained after the difference is the interquartile range.
Read More: Difference Between Variance and Standard Deviation
Interquartile Range: Solved Example[Click Here for Sample Questions] Example: Find the interquartile range for the first ten prime numbers. Solution: The first ten prime numbers are: 2, 3, 5, 7, 11, 13, 17, 19, 23, 29 (Arranged in increasing order) Here, the total number of values = 10 10 is an even number. Thus, the median will be the mean of 11 and 13 Q2 = (11 + 13)/2 = 24/2 = 12. The next step is to find two parts- the lower half to find Q1 and the upper half to find Q3. Q1 part: 2, 3, 5,7,11 Here the number of values = 5 As, 5 is an odd number, so, the centre value is 5, that is Q1= 5 Q3 part: 13, 17, 19, 23, 29 Here the number of values = 5 Again, 5 is an odd number. So, the centre value is 19, that is Q3= 19 The subtraction of Q1 and Q3 values will be 19 – 5 = 14 So, we get 14 as the interquartile range value. |
Things to Remember
- The Interquartile Range formula calculates the difference between the distribution's two extreme observations or data points.
- The formula for calculating the difference between the third and first quartiles is known as the interquartile range formula.
- The interquartile range formula is as IQR =Q3 – Q1, where, IQR = Interquartile range, Q1 = First Quartile and Q3= Third Quartile
- The semi-interquartile range is the difference between the upper and lower quartiles divided by half.
- We can determine the interquartile range in four steps: Ordering the data, calculating the median, finding the upper and lower medians and finally calculating the difference.
- The interquartile range has the advantage of being able to be utilised as a measure of variability even if the extreme values are not documented correctly (as in the case of open-ended class intervals in the frequency distribution).
Sample Questions
Ques. What is the use of the Interquartile Range? (3 Marks)
Ans. The interquartile range, or IQR, is the best measure of variability for skewed data distributions or data sets with outliers. This is because its values originate from the data distribution's middle half, which is less influenced by outliers. This range indicates the extent to which the database is dispersed. It tells us how far apart the first and third quartiles are in terms of inflation.
Ques. Explain the key differences between Interquartile Range and Standard Deviation. (5 Marks)
Ans. Extreme outliers have little effect on the interquartile range (IQR). An extremely small or extremely big value in a dataset, for example, will have no effect on the IQR computation because the IQR only utilises values from the dataset's 25th and 75th percentiles.
Extreme outliers have an impact on the standard deviation. Because the standard deviation considers every value in a dataset in its formula, an excessively large value in a dataset will cause the standard deviation to be significantly larger.
When there are extreme outliers in a dataset, the interquartile range should be used to measure the dispersion of values. When there are no extreme outliers, however, the standard deviation should be used to measure the distribution of data.
Ques. Anjali finds the first quartile and the third quartile values of the data to be 43 and 71 respectively. What will be the interquartile range for this data? (3 Marks)
Ans. Given that
Q1 = 43
Q3 = 71
Interquartile Range = Q3 - Q1
= 71 − 43
= 28
Thus, the interquartile range will be 28.
Ques. What is the difference between the Range and Interquartile Range? (3 Marks)
Ans. The range is the most basic measure of variability. The difference between the highest and lowest value is the difference. Because ranges only count extreme values, they may not have a significant impact on variability. In this scenario, you can use an interquartile range as a measure of variability (IQR).
Another measure of variability is the interquartile range. Because it excludes the extreme values, it is a better measure of dispersion than range. It divides the distribution into four equal sections, which are referred to as quartiles. The first quartile (Q1), the third quartile (Q3), and the middle quartile (Q2) are the first, third, and second quartiles, respectively.
Ques. Use the interquartile range formula to determine the range of the following data set: {4, 17, 7, 14, 18, 12, 3, 16, 10, 4, 4, 11} (5 Marks)
Ans. Number of terms = 12,
Set = {4, 17, 7, 14, 18, 12, 3, 16, 10, 4, 4, 11}
Arranged set = {3, 4, 4, 4, 7, 10, 11, 12, 14, 16, 17, 18}
Now, divide the set into quartiles, so each quarter will have 3 terms: {3, 4, 4}, {4, 7, 10}, {11, 12, 14}, {16, 17, 18}
First Quartile,
Q1 = (4 + 4)/ 2 = 4
Third Quartile,
Q3 = (14 + 16)/2 = 15
Put the Interquartile Range Formula, Q2 = Q3–Q1
= 15 - 4
= 11
So, the Interquartile range of the given set = 11
Ques. Find the interquartile range value for the first ten odd numbers. (5 Marks)
Ans. The first ten odd numbers: 1, 3, 5, 7, 9, 11, 13, 15, 17, 18
n = 10
Since 10 are even, using the median formula, calculate the median as the mean of the 5th and 6th terms.
That is Q2 = (9+11)/2 ⇒ Q2 = 10.
Now Q1 part is {1, 3, 5, 7, 9}
Here the number of data points = 5
Q1 = median of {1, 3, 5, 7, 9} = 5
Q3 part is {11, 13, 15, 17, 19}
Here the number of data points = 5
Q3 = median of {11, 13, 15, 18, 19} = 15
Using Interquartile range formula, IQR = Q3–Q1
Q3–Q1 is 15 – 5 = 10
So, the interquartile range for the given set of first 10 odd numbers is 10.
Ques. Explain Quartiles. (5 Marks)
Ans. A set of data series is divided into four equal portions by the Quartiles namely First Quartile (Q1), Second Quartile (Q2), and Third Quartile (Q3). The second Quartile (Q2) is also known as the Median of the data series since it divides the data into two equal parts.
- The first quartile divides the data into quarters, with one-fourth of the values falling below it and the remaining three-quarters falling above it. The first quartile is sometimes known as the lower quartile (Q1)
- The second quartile divides the data or observations into two equal portions, with 50 per cent of the observations falling below it and 50 per cent falling above it. It's also known as the Median and refereed as Q2.
- The third quartile splits the series so that three-quarters (75%) of the observations are below it and one-fourth (25%) of the observations are above it. The third quartile is sometimes known as the upper quartile and referred to as Q3.
Related Links:



Comments
Found 1 Comment
Resolved.