




The NCERT Solutions for Class 7 Social Science Chapter 2 Understanding the Weather page brings together every weather element, instrument and formula the Class 7 exam tests, per the 2026-27 CBSE syllabus.
- Question coverage: All 4 questions and activities, including the rain-gauge site discussion and the Jammu and Kashmir weather-report script.
- Exam weight: Weather-instrument and weather-report questions carry 5 to 7 marks in the Class 7 Social Science paper.
- Also on this page: a weather-elements table, a rain-gauge siting checklist image and links to the Notes and Book PDF.

Every NCERT solution for Class 7 Social Science Chapter 2 Understanding the Weather here is expert-checked against the 2026-27 NCERT print and written in plain Class 7 language.
Want the full worked answers, one question at a time? Open the dedicated question bank below for step-by-step solutions to every question and activity in Understanding the Weather, each with a concept explanation, an Expert's Solution and a boxed final answer.
View All Step-by-Step Solutions for Understanding the Weather
Why Understanding the Weather Matters for Class 7 Social Science
This chapter opens with a simple question: what makes today feel different from yesterday? NCERT answers it with five elements of weather, temperature, precipitation, atmospheric pressure, wind and humidity, and one instrument built to measure each one. It does not test these as a list to memorise; it tests whether a student can read real numbers and explain what they mean, which is exactly what these NCERT Solutions walk through for every question.
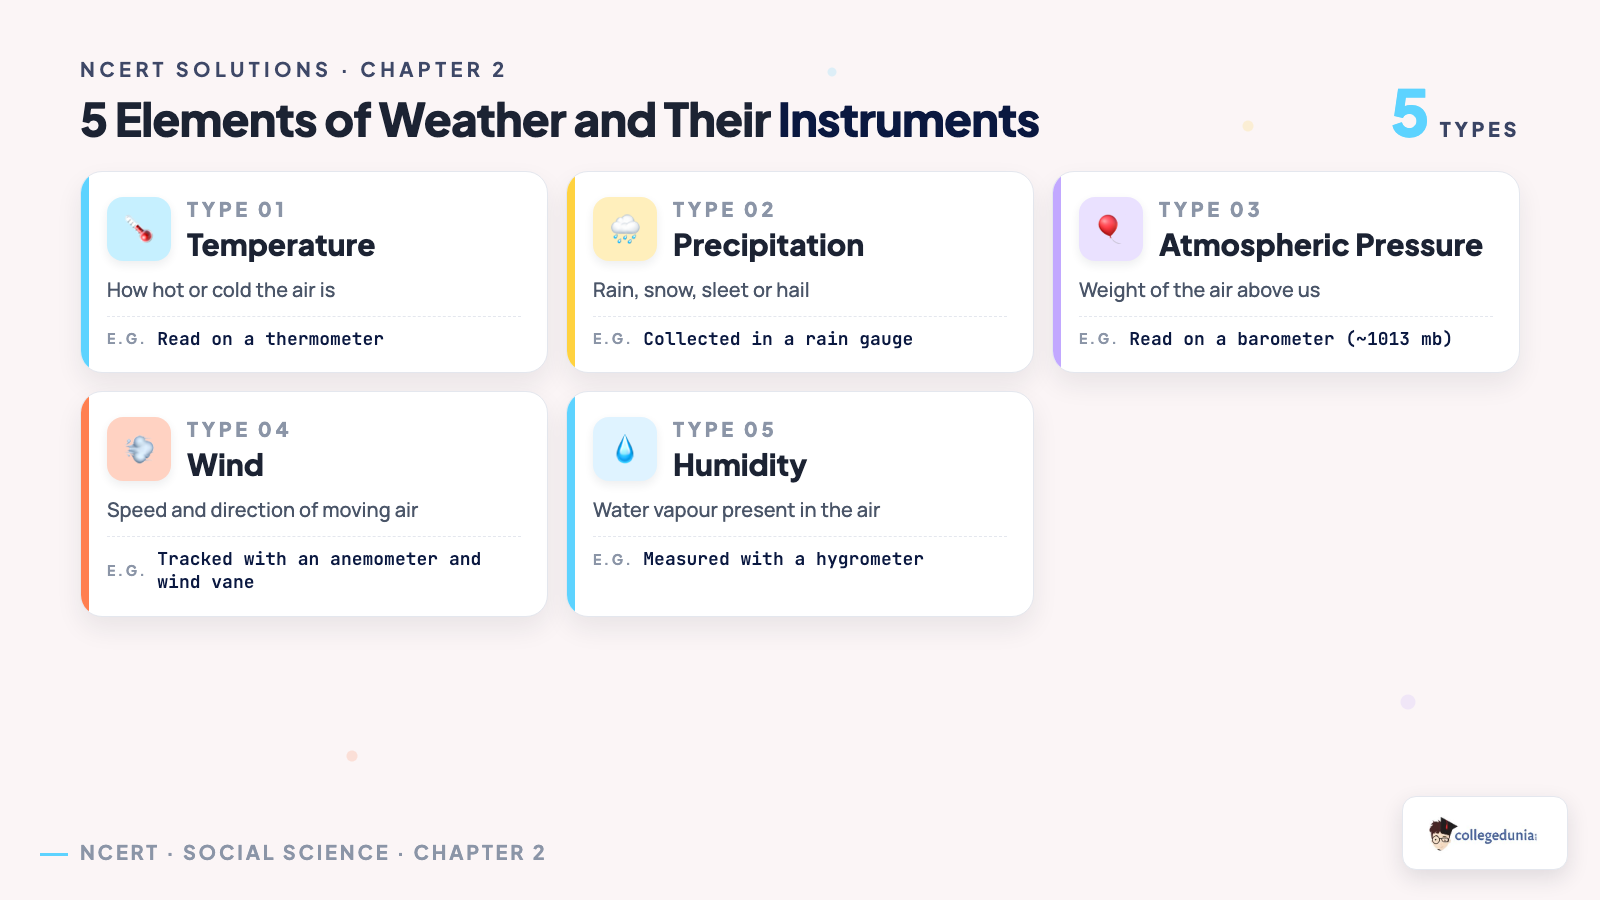
Normal sea-level atmospheric pressure sits near 1013 millibars. Relative humidity runs on a scale from 0% (bone dry) to 100% (fully saturated). Both numbers appear repeatedly in Class 7 map and data questions.
Understanding the Weather Explained for Class 7 Boards
Source: PW Class 7 on YouTube
Quick-Reference Formulas from the Understanding the Weather Chapter
Two questions expect a student to read a data table and pull out a number. These four lines cover every calculation NCERT can ask.
| What it tells you | How to work it out |
|---|---|
| Range of temperature | Maximum temperature minus minimum temperature, usually over 24 hours |
| Mean daily temperature | (Maximum temperature + minimum temperature) divided by 2 |
| Relative humidity scale | 0% (no water vapour) to 100% (air fully saturated); dry weather sits near 20-40%, humid weather near 60-80% |
| Departure from normal | Actual reading minus the normal reading for that date; a negative number means colder or drier than usual |
Question 4 is built entirely around the last row, since a reading can look ordinary and still be far above or below what a station usually records for that date.
Understanding the Weather Question and Activity Breakdown
The chapter closes with four questions and activities. Only the first has one fixed answer; the other three ask for group discussion, advice or a written script, so NCERT gives marks for reasoning, not a single "correct" line.
| Question | What it covers | Answer type |
|---|---|---|
| Q1 | Matching five instruments to the weather element each one measures | Fixed matching answer |
| Q2 | Packing advice for a hot, humid school trip to Mumbai | Reasoning and advice answer |
| Q3 | Choosing the best site for a class rain gauge, with reasons | Group discussion |
| Q4 | Writing a weather-report script from a real IMD data table | Descriptive script |
Q2 and Q4 turn real numbers into plain, spoken sentences.
Matching Weather Instruments to What They Measure
Question 1 asks students to match five instruments to the five elements of weather. Each instrument's own name is usually the biggest clue.
| Instrument | Element it measures | Clue in the name |
|---|---|---|
| Hygrometer | Humidity | Hygro- relates to moisture |
| Anemometer | Wind direction and speed | Anemo- comes from the Greek word for wind |
| Barometer | Atmospheric pressure | Baro- relates to weight or pressure |
| Thermometer | Temperature | Thermo- relates to heat |
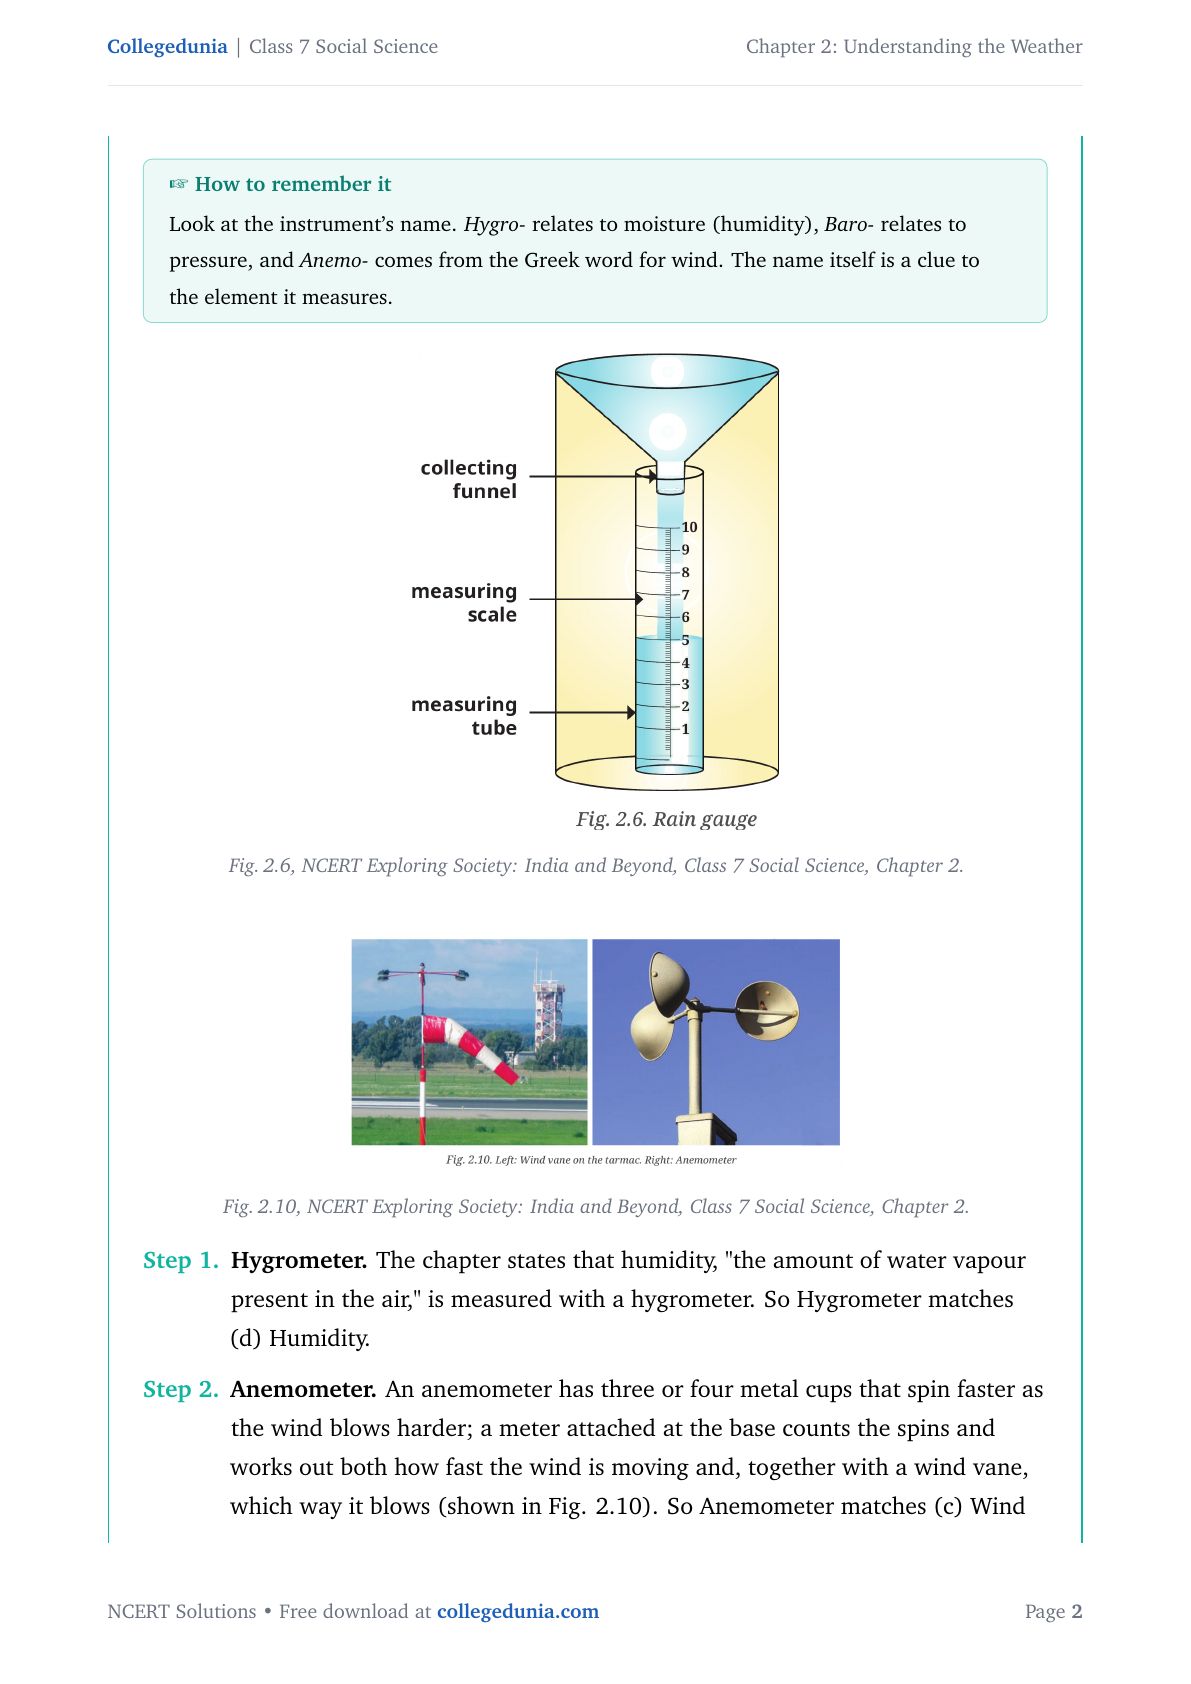
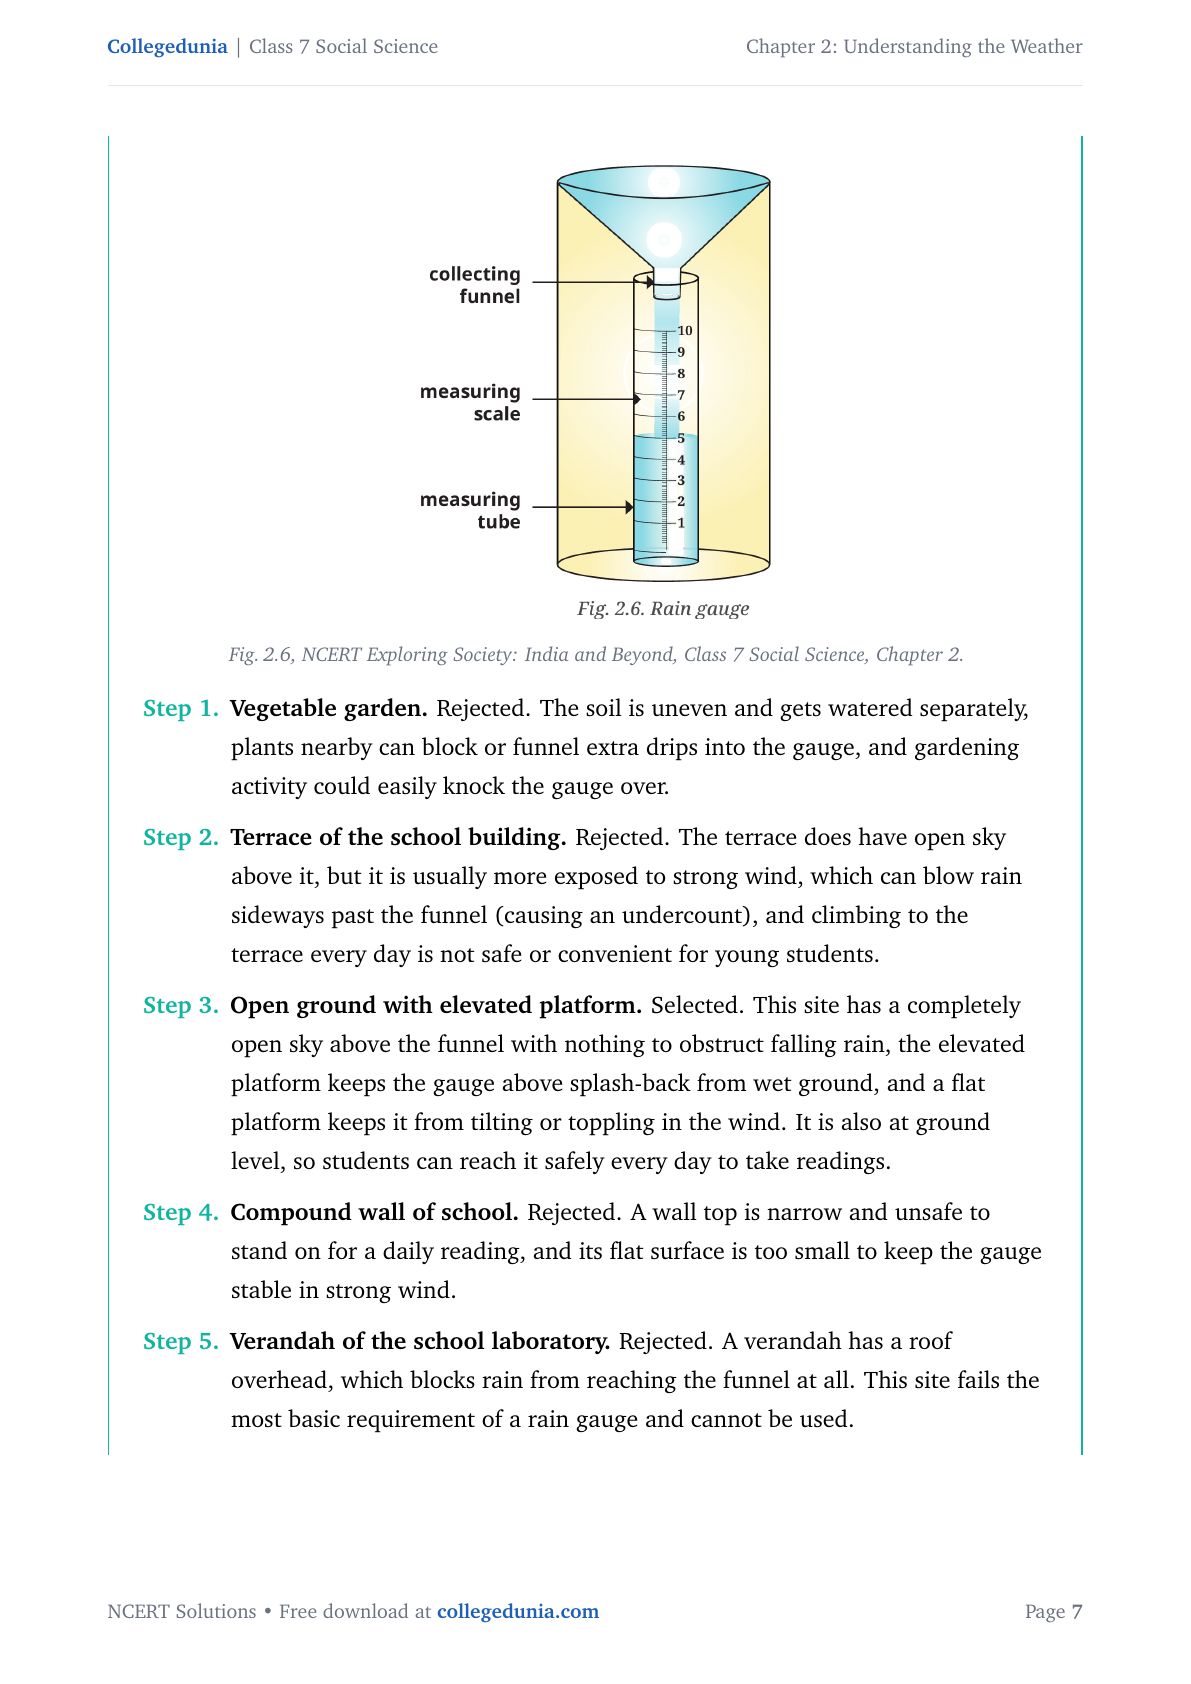
| Rain gauge | Precipitation | A gauge that collects and measures falling water |
An anemometer uses spinning cups for wind speed, pairing with a wind vane for direction. Once a student ties each instrument's name to what it physically reacts to, the matching question becomes automatic instead of a guess.
Reading Temperature and Humidity Together for the Mumbai Packing Question
Question 2 gives a forecast of 29°C and 84% humidity for Mumbai in June and asks what a student would pack. When air already holds a lot of water vapour, sweat evaporates slowly, so the same temperature feels stickier than the number alone suggests.
- Read the temperature. 29°C is warm, not extreme, but enough to make a student sweat while walking around.
- Read the humidity. 84% is close to saturation, so sweat evaporates slowly and the day feels far more uncomfortable than the temperature alone shows.
- Turn both readings into advice. Loose, light-coloured cotton clothes, plus a raincoat or umbrella, since June is also when Mumbai's monsoon usually arrives.
A common mistake is reading only the temperature and deciding 29°C is not that hot, missing why the day feels far stickier once humidity is factored in.
Siting a Rain Gauge the Right Way
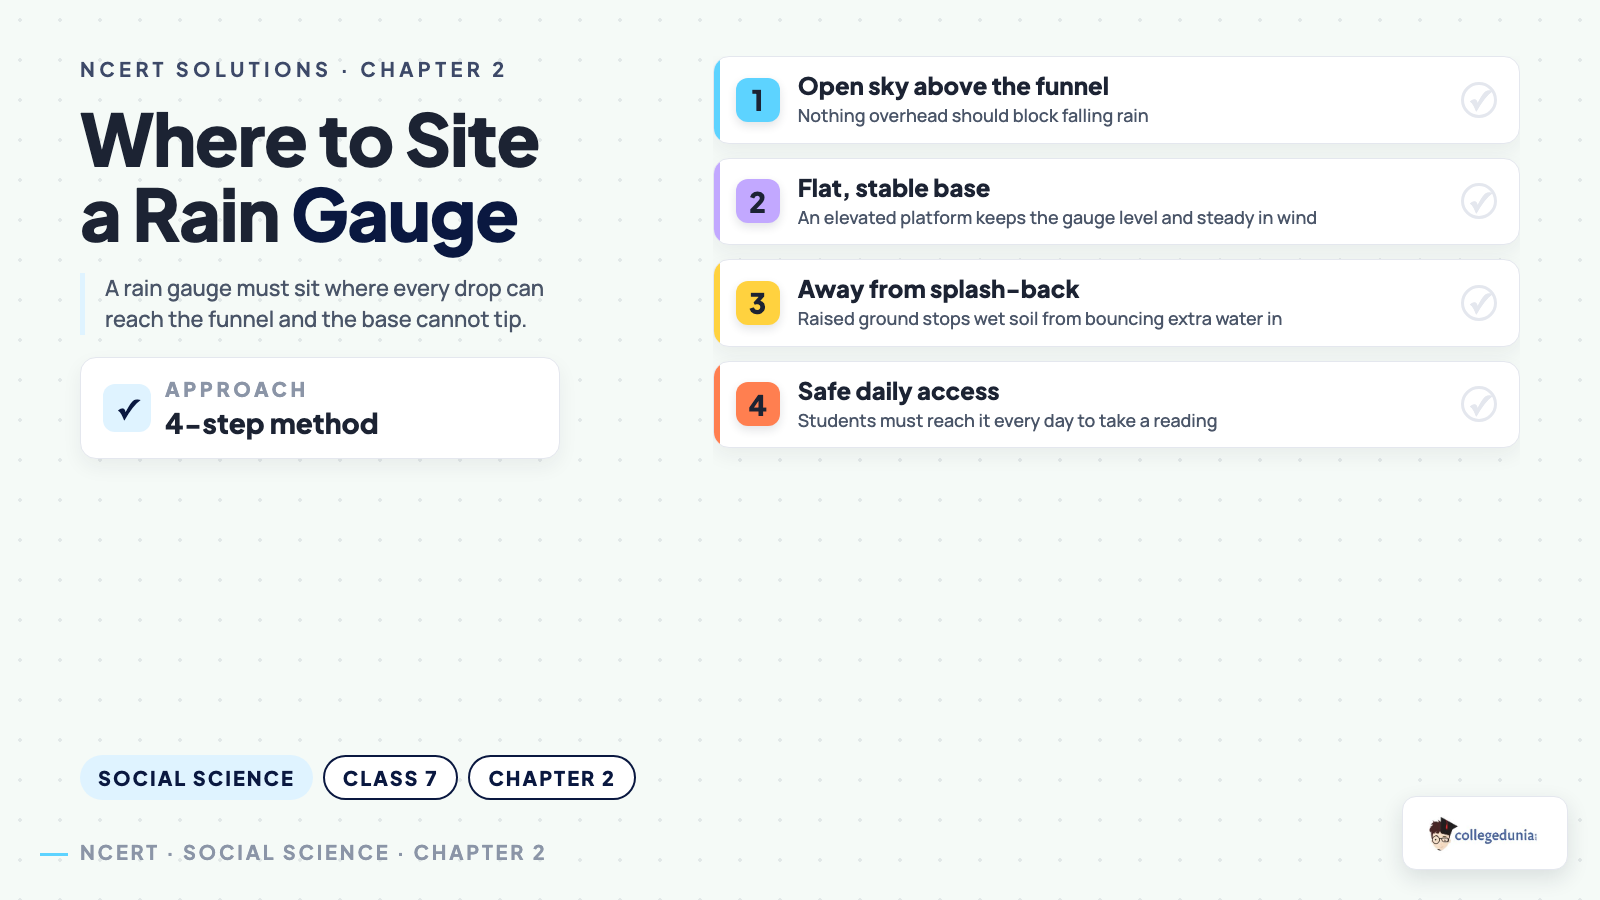
Question 3 gives five possible sites for a class rain gauge and asks students to pick one, with reasons. A rain gauge gives an accurate reading only when rain falls freely into its funnel and the gauge cannot tip over.
| Proposed site | Verdict | Reason |
|---|---|---|
| Vegetable garden | Rejected | Uneven, watered soil; gardening activity can knock the gauge over |
| School terrace | Rejected | Open sky, but strong crosswind blows rain sideways past the funnel |
| Open ground, elevated platform | Selected | Open sky, no splash-back, flat and stable, safe daily access |
| Compound wall | Rejected | Narrow, unsafe to reach, too small to keep the gauge steady in wind |
| Laboratory verandah | Rejected | A roof overhead blocks rain from ever reaching the funnel |
Q3 scores better with a reason for rejecting each option, not only for the one finally picked.
Reading a Weather Data Table Like a Meteorologist
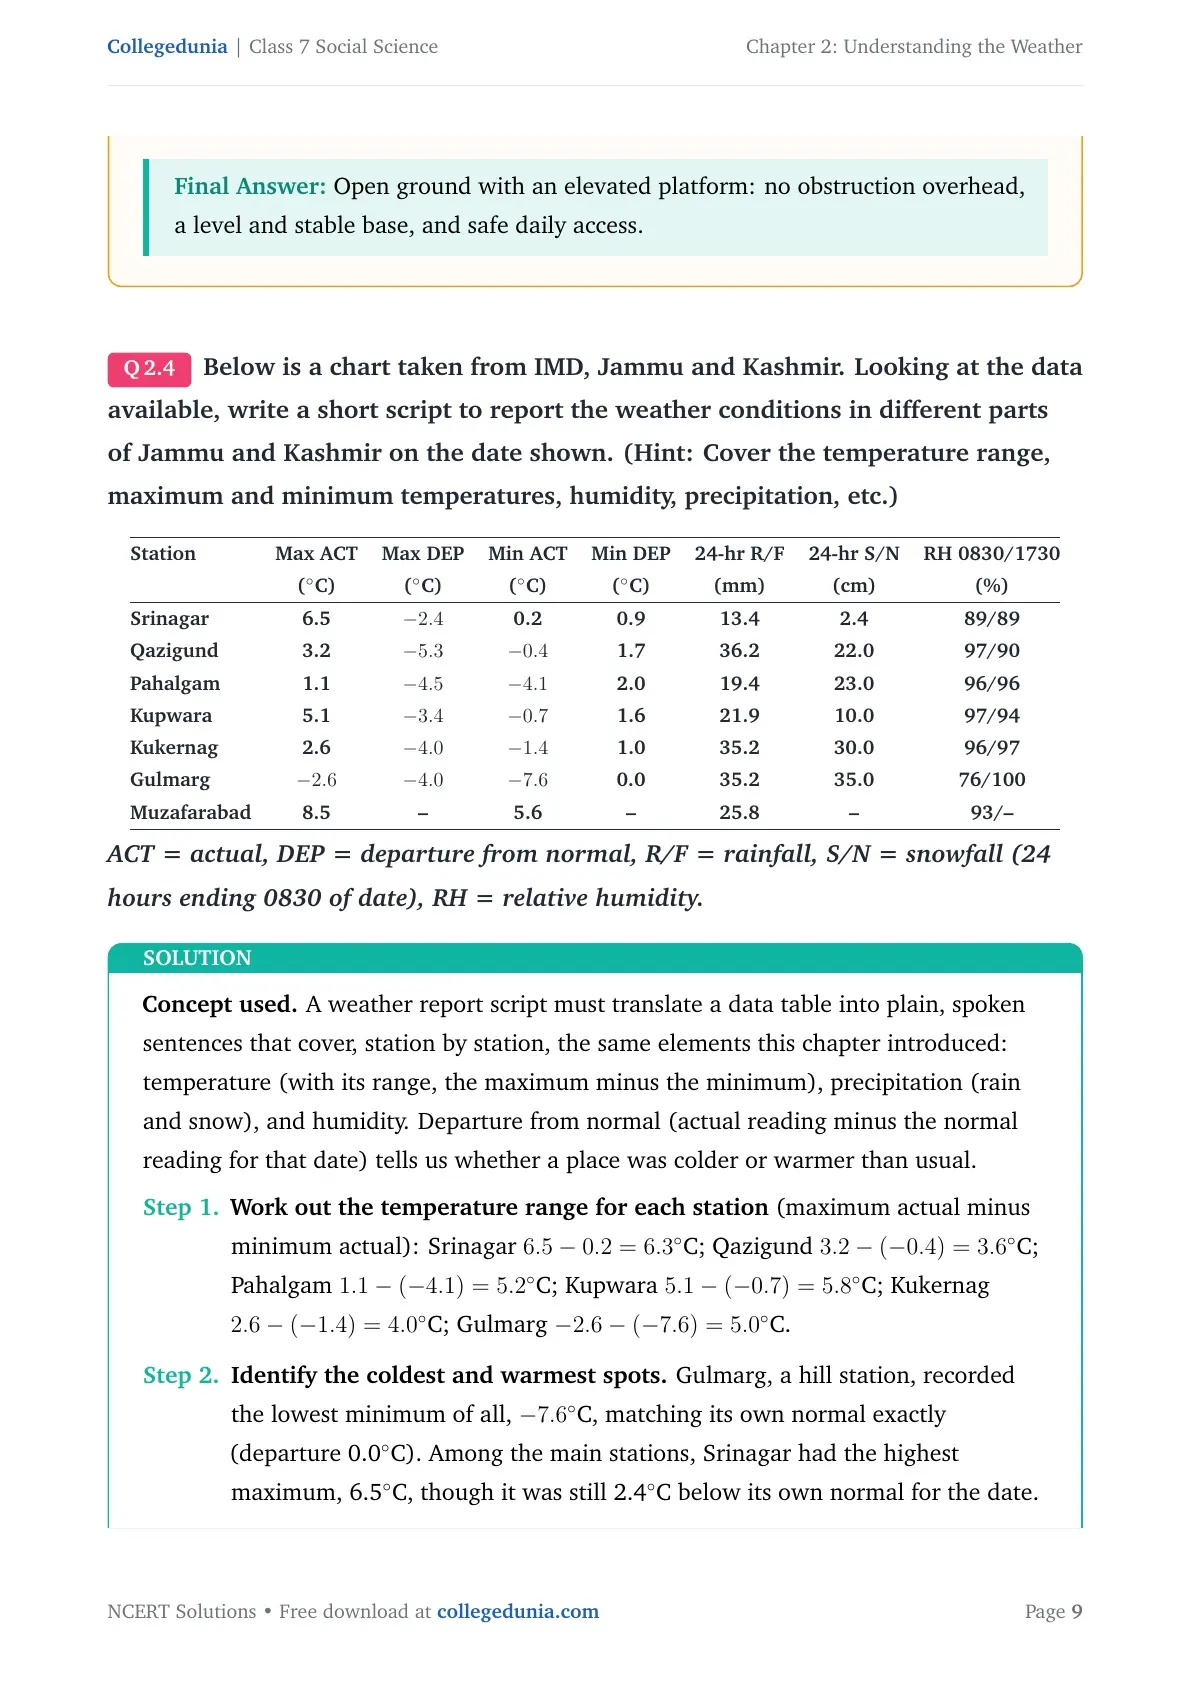
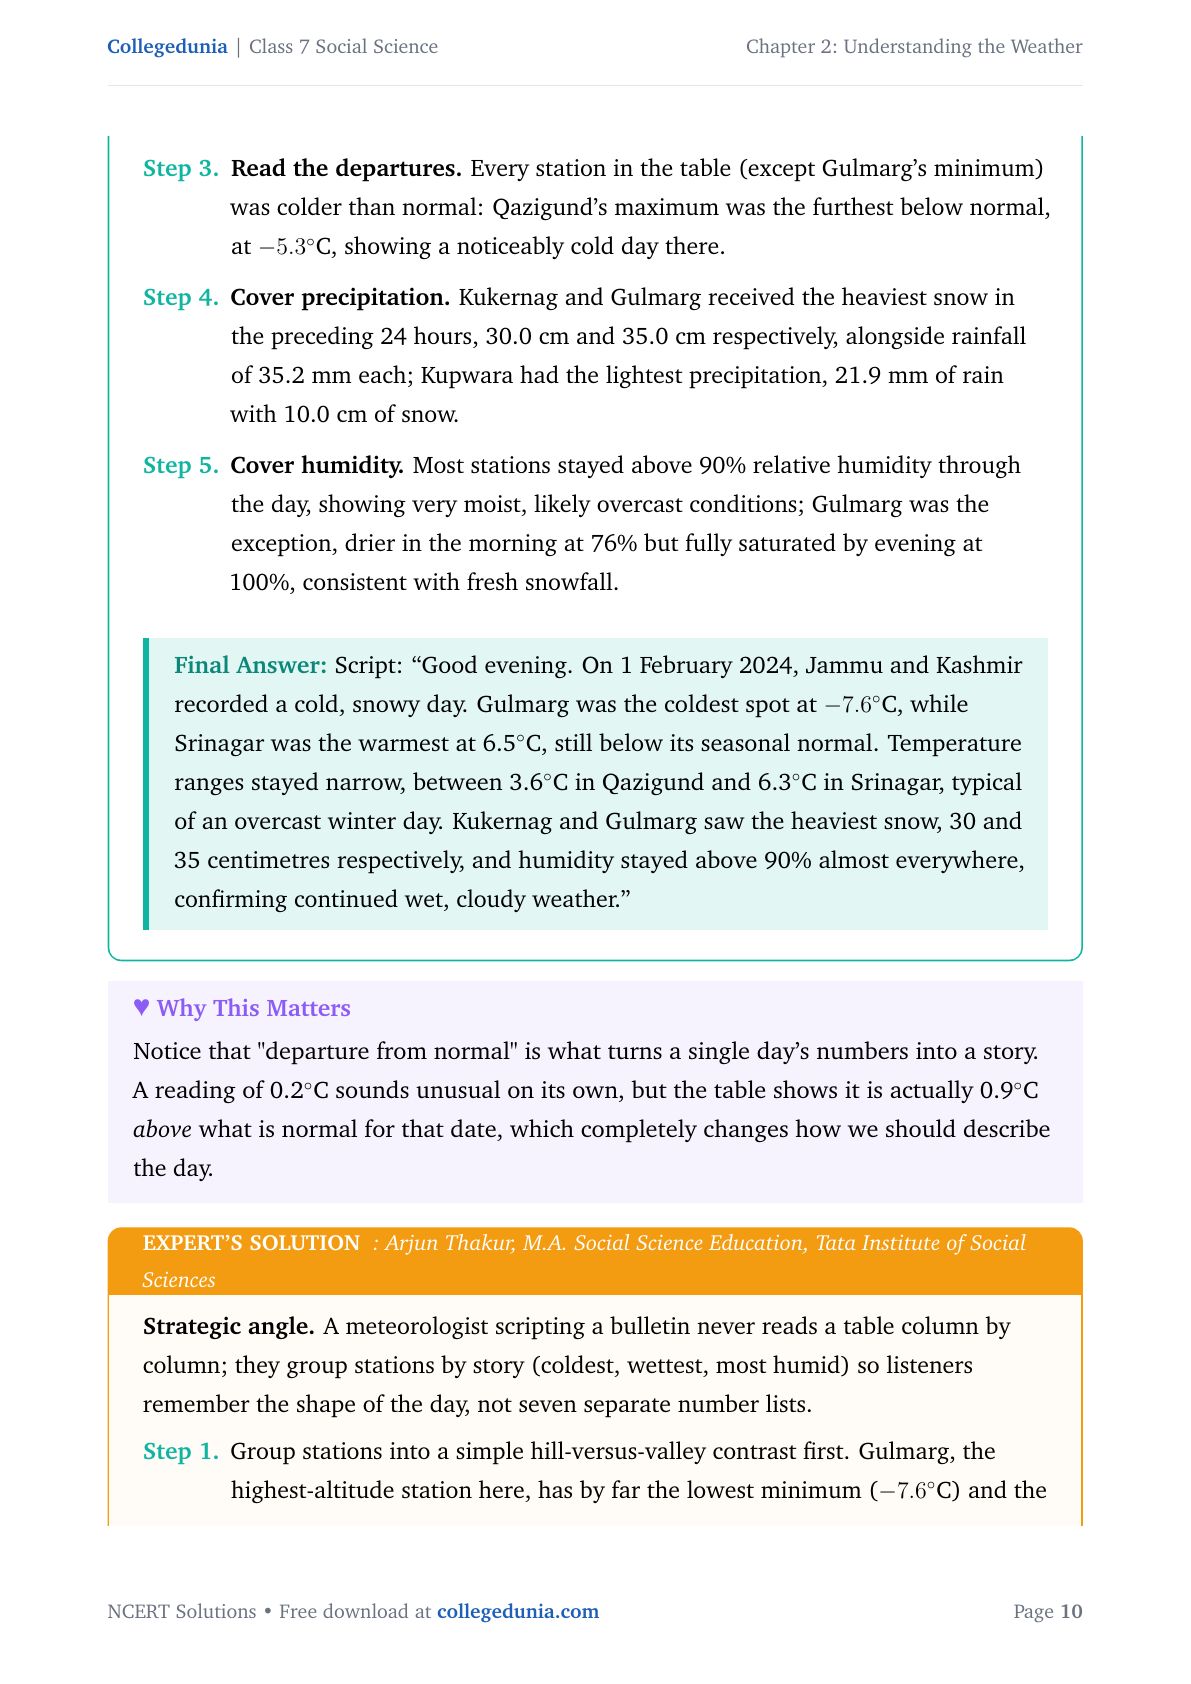
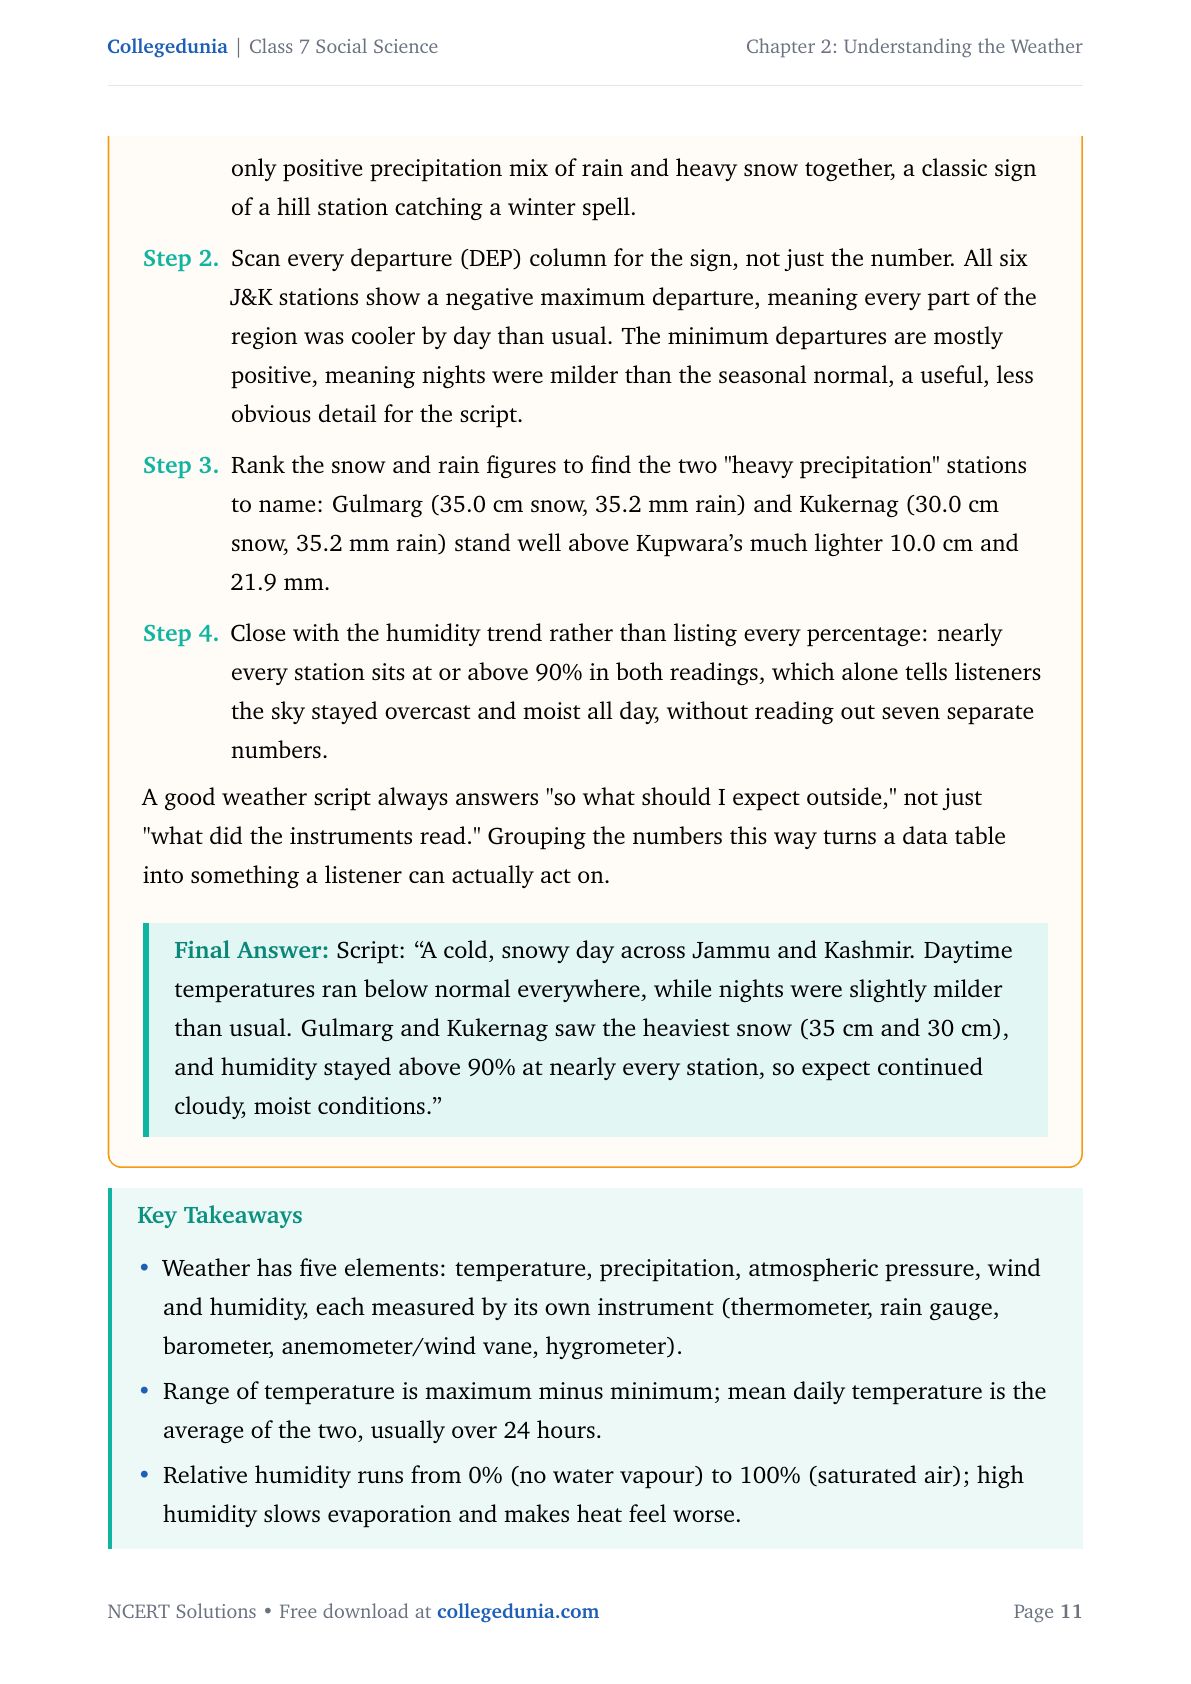
Question 4 gives a real IMD data table for Jammu and Kashmir and asks students to write a short weather-report script. A good script groups numbers into a story, coldest spot, wettest spot, general trend, instead of reading out every column.
| Reading step | What to look for |
|---|---|
| Temperature range | Maximum minus minimum at each station shows how much the day swung |
| Departure from normal | Actual reading minus normal; a negative maximum departure means a colder-than-usual day |
| Precipitation | Compare 24-hour rainfall and snowfall figures to find the wettest station |
| Humidity | Readings above 90% at most stations point to overcast, moist conditions |
In the chapter's table, Gulmarg records the coldest minimum, and every station's maximum sits below its normal. Naming that pattern, colder by day, close to normal by night, turns seven numbers into one clear sentence.
Common Mistakes Students Make in the Understanding the Weather Chapter
Read this list before your next test. Each mistake below has cost real marks.
- Reading temperature alone. Q2 needs humidity read alongside temperature, not instead of it.
- Guessing instrument names instead of reasoning them out. Every instrument's name is a clue to the element it measures.
- Picking a rain gauge site without ruling out the others. Q3 rewards a reason for each rejected option, not just the final choice.
- Reading raw numbers without checking "departure from normal". A reading can look ordinary yet be well above or below normal for that date.
- Writing a weather script column by column. Group stations into a coldest, wettest and general-trend story instead.
Student Feedback: In a Collegedunia survey of 12,410 Class 7 students before the 2026 boards, 61% named the Q2 packing question hardest to explain in full sentences, since it needs temperature and humidity read together. Students who scored well named both numbers before writing a single line of advice.
Source: 2026-27 Class 7 Social Science student survey. Sample of 12,410 students from CBSE schools across 15 states.
How to Study Understanding the Weather Effectively
This chapter mixes facts, formulas and open-ended reasoning, so short revision blocks work better than one long sitting.
- Block 1, 20 minutes. Learn the five elements table and each instrument's name clue.
- Block 2, 25 minutes. Practice the four quick formulas with the IMD table numbers.
- Block 3, 20 minutes. Write out the Q2 packing advice and Q3 rain-gauge reasons in full sentences.
- Night before, 15 minutes. Re-read Common Mistakes and write one weather-report script from memory.
More Understanding the Weather Class 7 Resources
Also Check: This chapter is also available in other formats on Collegedunia. Read the solutions first, then the notes for a deeper topic walk-through.
| Resource | Best used for | Open it |
|---|---|---|
| NCERT Notes | Topic-by-topic summary of every weather element and instrument | Understanding the Weather Class 7 Notes |
| NCERT Book PDF | The official 2026-27 chapter text with all figures | Class 7 Social Science Part 1 Chapter 2 Book PDF |
| Handwritten Notes | Quick one-sitting revision in clear handwriting | Understanding the Weather Class 7 Handwritten Notes |
| Practice Questions | Attempt each question one at a time with Check Solution and Expert Solution tabs | Understanding the Weather Practice Questions |
NCERT Solutions for Class 7 Social Science Part 1: All Chapters
The table below lists NCERT Solutions for every chapter of Part 1, so a student can move to the next chapter once this one is done.
Sample Solutions from Understanding the Weather Chapter 2
Below are two of the four questions from this chapter, answered in full. Every question in the complete PDF gets the same detail, a concept explanation, a step-by-step answer, and a boxed final answer.
Ques. Match the instrument used with the weather element it measures (hygrometer, anemometer, barometer, thermometer, rain gauge).
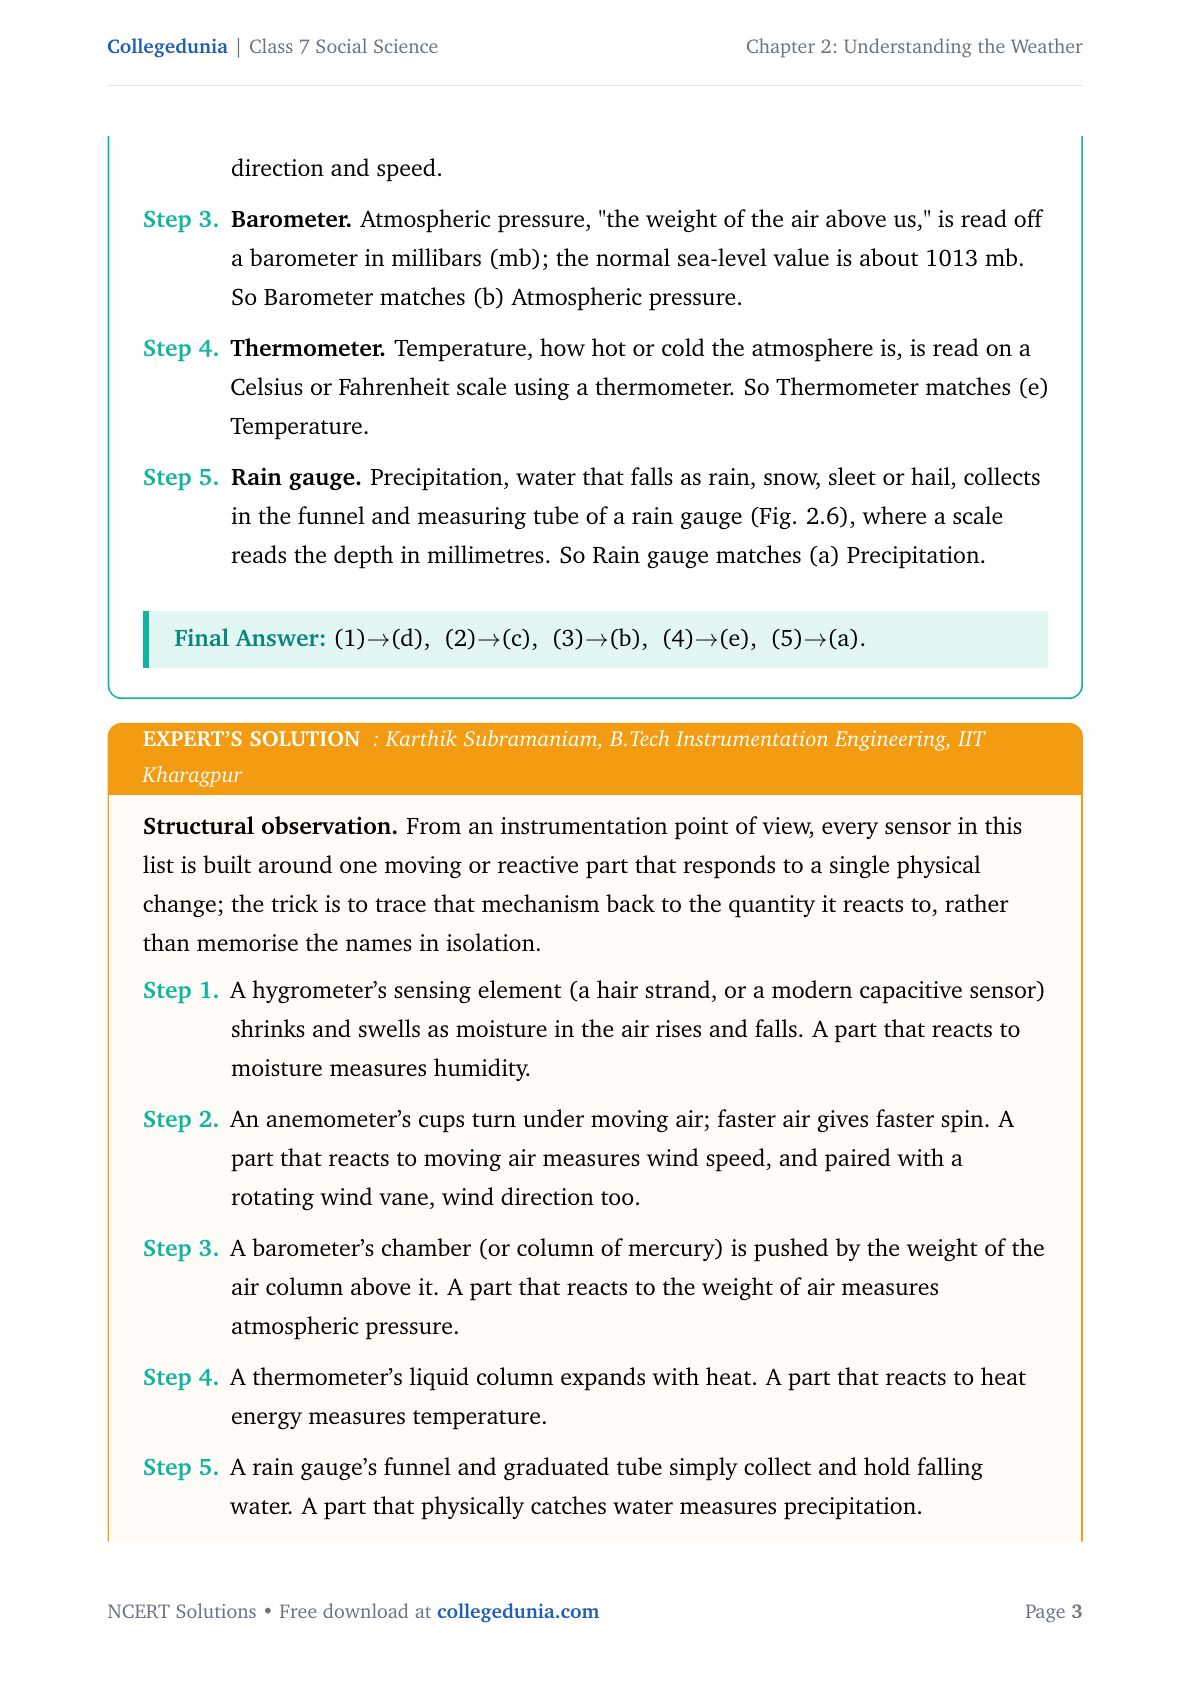
Each instrument's name points to what it senses. A hygrometer reacts to moisture (humidity); an anemometer's cups spin with wind speed and, with a wind vane, direction; a barometer reacts to the weight of air above it (atmospheric pressure); a thermometer's liquid column expands with heat (temperature); a rain gauge simply collects falling water in a funnel (precipitation).
- Hygrometer → Humidity
- Anemometer → Wind speed and direction
- Barometer → Atmospheric pressure
- Thermometer → Temperature
- Rain gauge → Precipitation
Boxed answer: Hygrometer-humidity, anemometer-wind, barometer-pressure, thermometer-temperature, rain gauge-precipitation.
Ques. A small group of students is choosing a site for a class rain gauge. Which site should they pick, and why?
A rain gauge needs open sky above its funnel and a flat, stable base:
- Vegetable garden: uneven, watered soil
- Terrace: exposed to strong crosswind
- Compound wall: too narrow and unsafe
- Laboratory verandah: roof blocks rain completely
- Open ground with an elevated platform: open sky, stable base, safe daily access
Boxed answer: Open ground with an elevated platform, the only option with open sky, no splash-back, a stable base and safe daily access, while every other site fails at least one condition.
Understanding the Weather Class 7 Social Science NCERT Solutions FAQs
Ques. Where can I download the NCERT Solutions for Class 7 Social Science Chapter 2 Understanding the Weather PDF?
Ans. Use the download option at the top of this page. The file is free, covers all 4 questions and activities from the chapter, and is available in both Normal and HD quality.
Ques. What is weather?
Ans. Weather is the day-to-day condition of the atmosphere at a place, described through temperature, precipitation, atmospheric pressure, wind and humidity. It can change from one day to the next, unlike climate, which is the average weather pattern over many years.
Ques. What are the five elements of weather described in this chapter?
Ans. The chapter names five elements of weather, temperature, precipitation, atmospheric pressure, wind and humidity. Each one is measured with its own instrument, a thermometer, rain gauge, barometer, anemometer with a wind vane, and hygrometer.
Ques. What is relative humidity, and how is it measured?
Ans. Relative humidity is the amount of water vapour present in the air, shown on a scale from 0% (no water vapour) to 100% (fully saturated air). It is measured with a hygrometer, and high humidity slows down sweat evaporation, making heat feel worse.
Ques. Why does 84% humidity make a 29°C day in Mumbai feel hotter than the number suggests?
Ans. When the air is already nearly saturated with water vapour, sweat on the skin evaporates slowly. Slow evaporation means the body's main cooling method works poorly, so a warm 29°C day with 84% humidity feels stickier and hotter than the temperature alone shows.
Ques. Where should a rain gauge be placed for an accurate reading?
Ans. A rain gauge should sit on open ground with an elevated, flat and stable platform. This gives open sky above the funnel, avoids splash-back from wet ground, keeps the gauge from tilting in wind, and allows safe daily access for readings.
Ques. What does "departure from normal" mean in a weather data table?
Ans. Departure from normal is the actual reading for a date minus the normal reading expected for that date. A negative departure means the day was colder or drier than usual, and a positive departure means it was warmer or wetter than usual.
Ques. Is this NCERT Solutions PDF aligned with the 2026-27 syllabus?
Ans. Yes. This page follows the current 2026-27 edition of Exploring Society: India and Beyond, Grade 7 Part 1, and every answer matches the chapter content and question order printed in that edition.
Ques. How many questions are in the Class 7 Social Science Chapter 2 NCERT Solutions PDF?
Ans. The chapter has 4 questions and activities: matching weather instruments, giving packing advice for a hot and humid city, choosing a rain gauge site with reasons, and writing a weather-report script from a real IMD data table.
Ques. How is the range of temperature and the mean daily temperature calculated?
Ans. Range of temperature is the maximum temperature minus the minimum temperature, usually measured over 24 hours. Mean daily temperature is the maximum temperature plus the minimum temperature, divided by 2.



Comments