




These Class 12 Geography Chapter 1 Data: Its Source and Compilation handwritten notes are a topper's genuine handwritten revision pages, mapped to the 2026-27 CBSE syllabus. The pages cover primary and secondary sources of data, methods of data collection, tabulation and classification, and the steps for compiling raw data into usable information. Use the PDF in the 24 hours before the board paper.
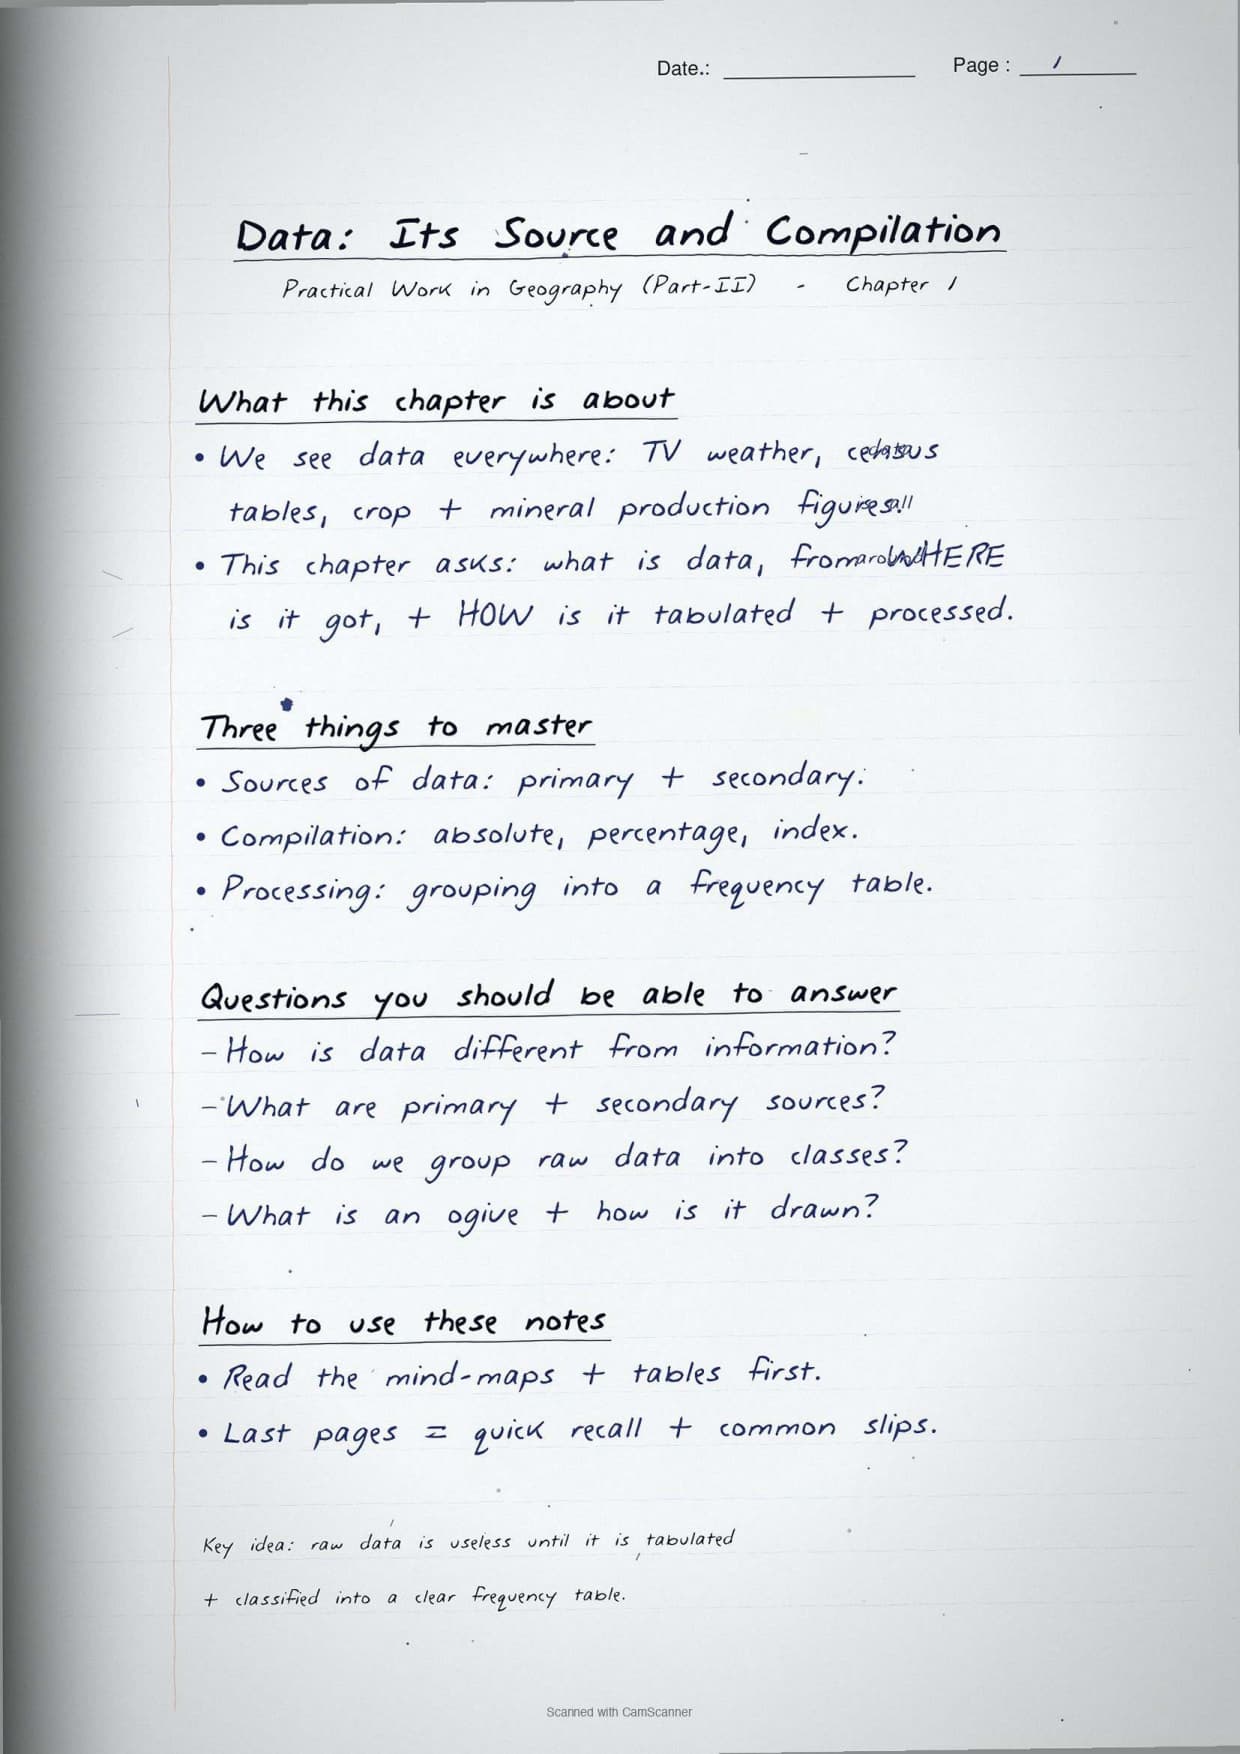
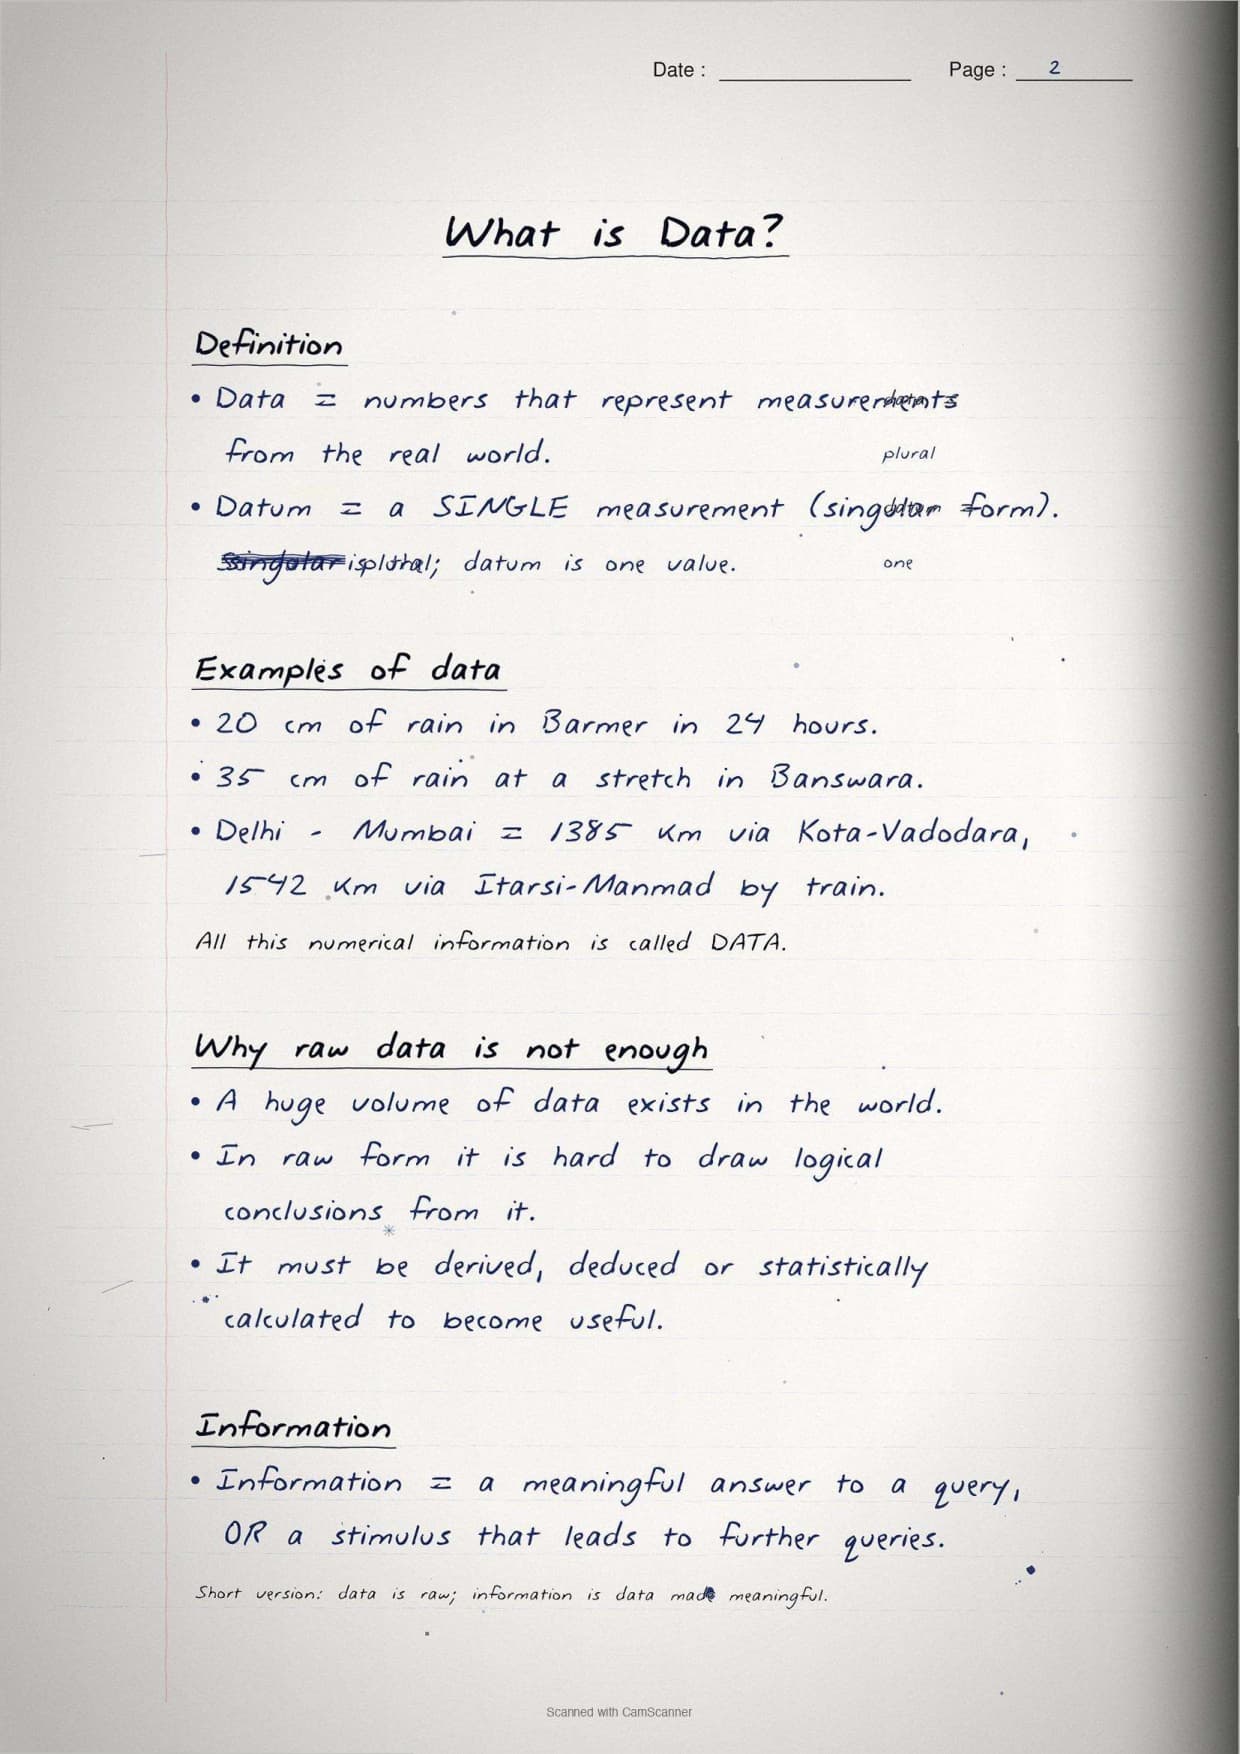
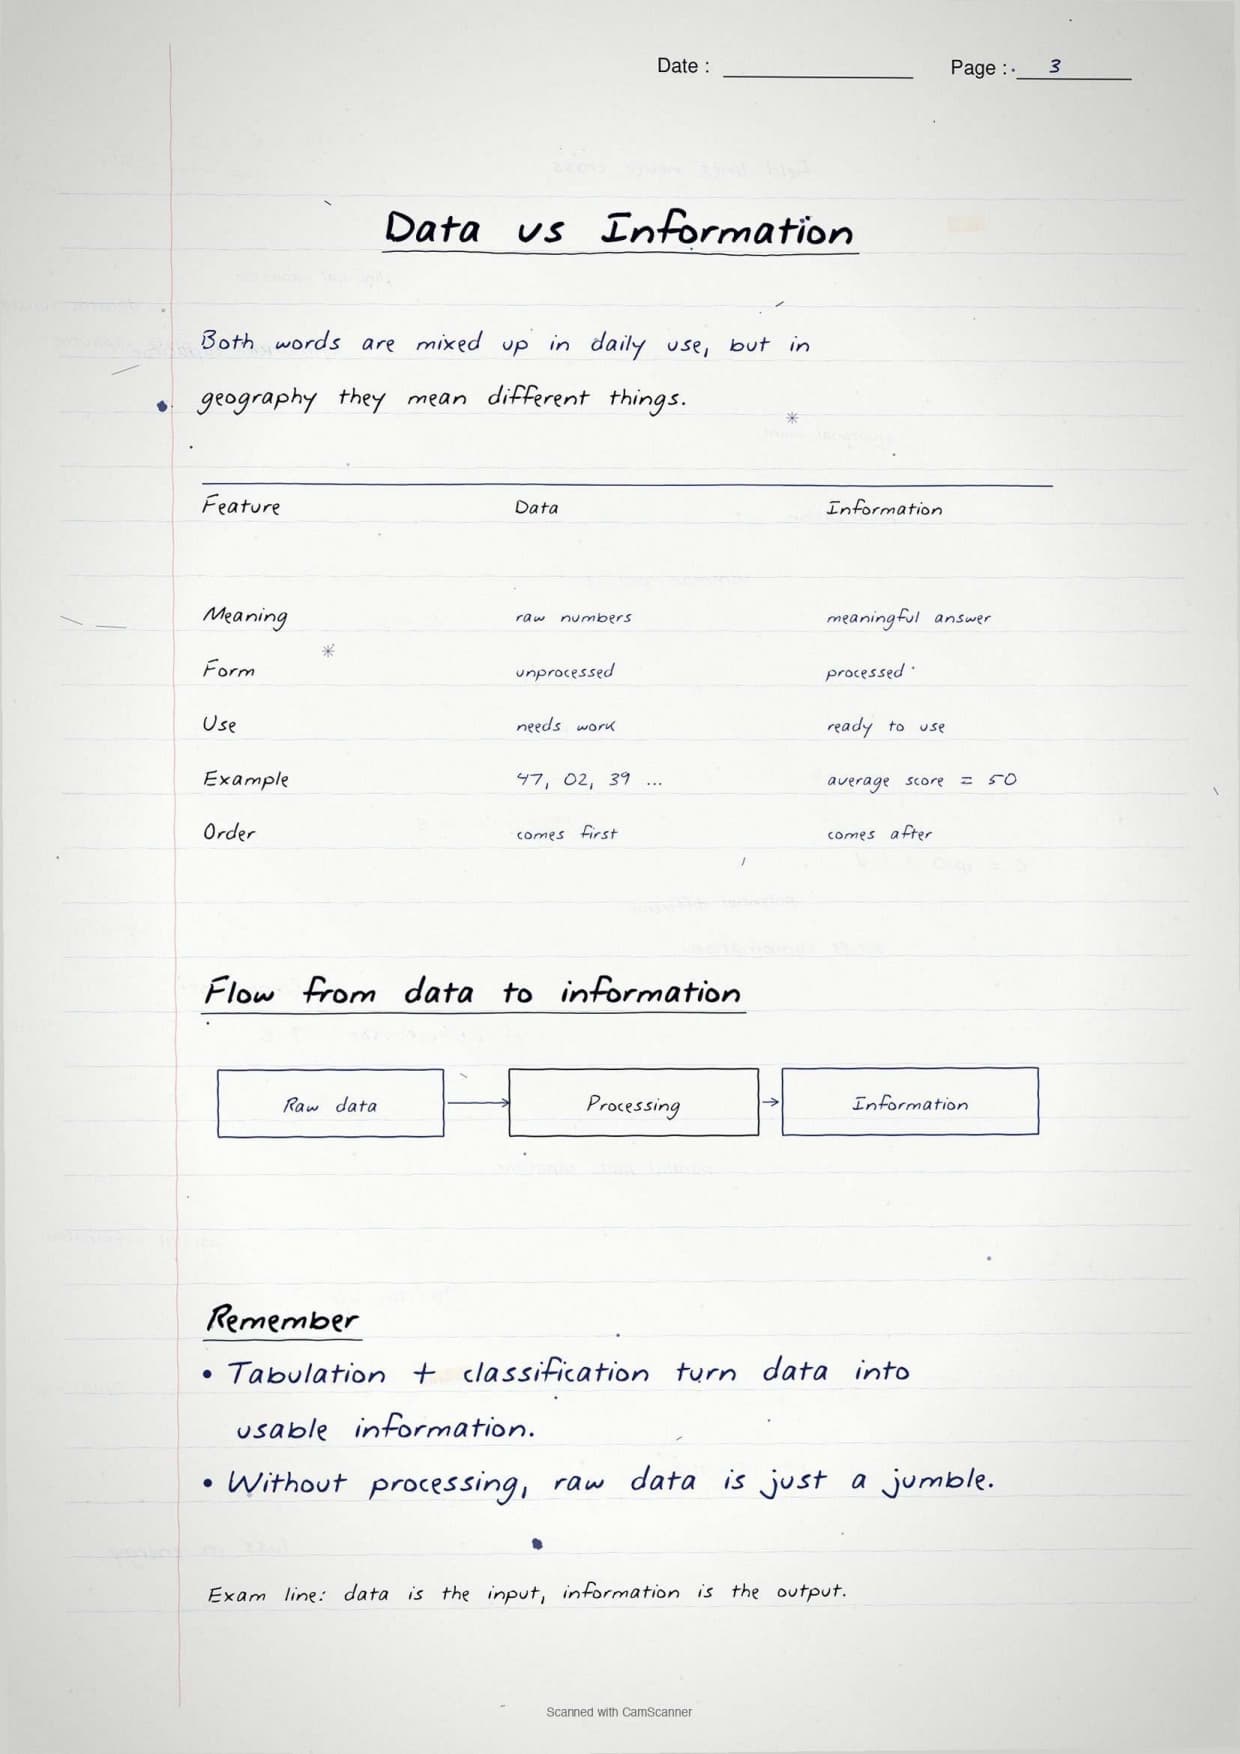
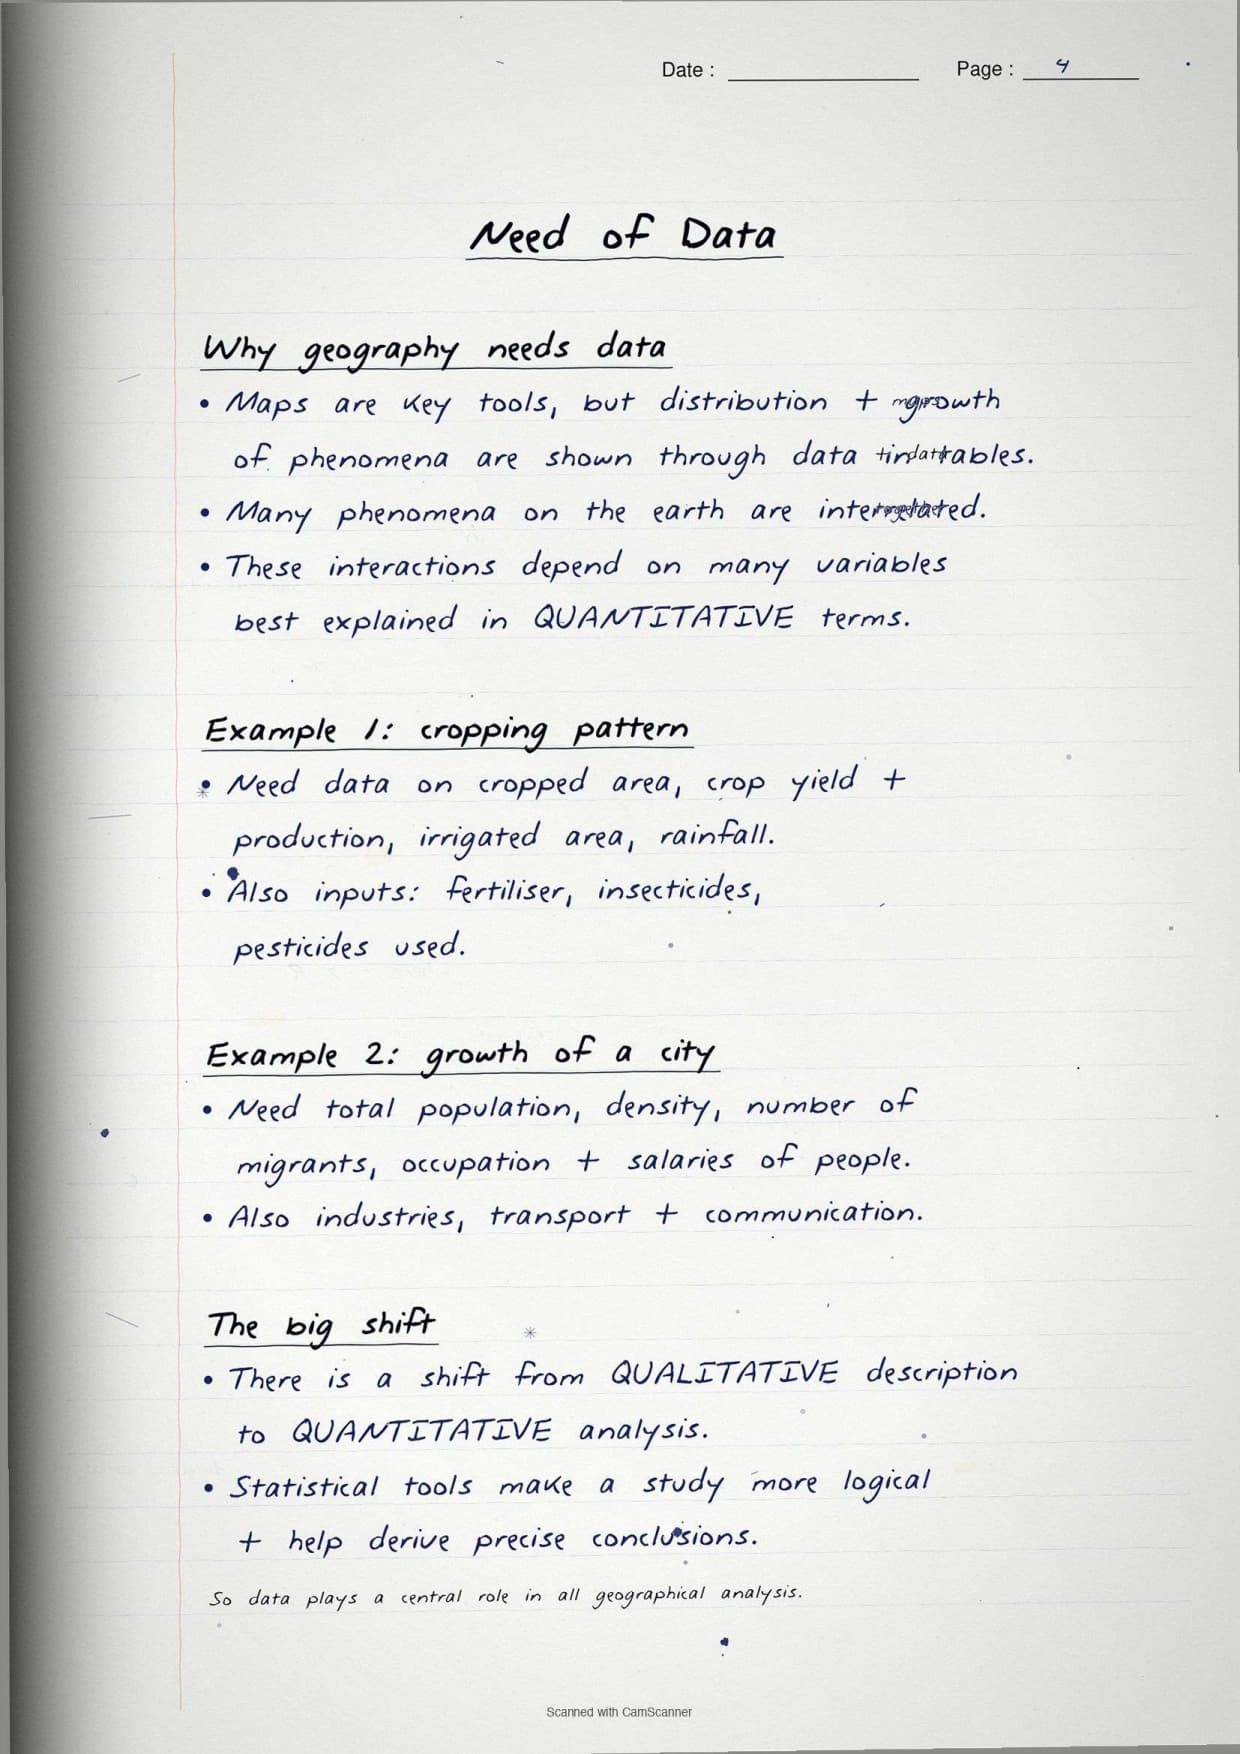
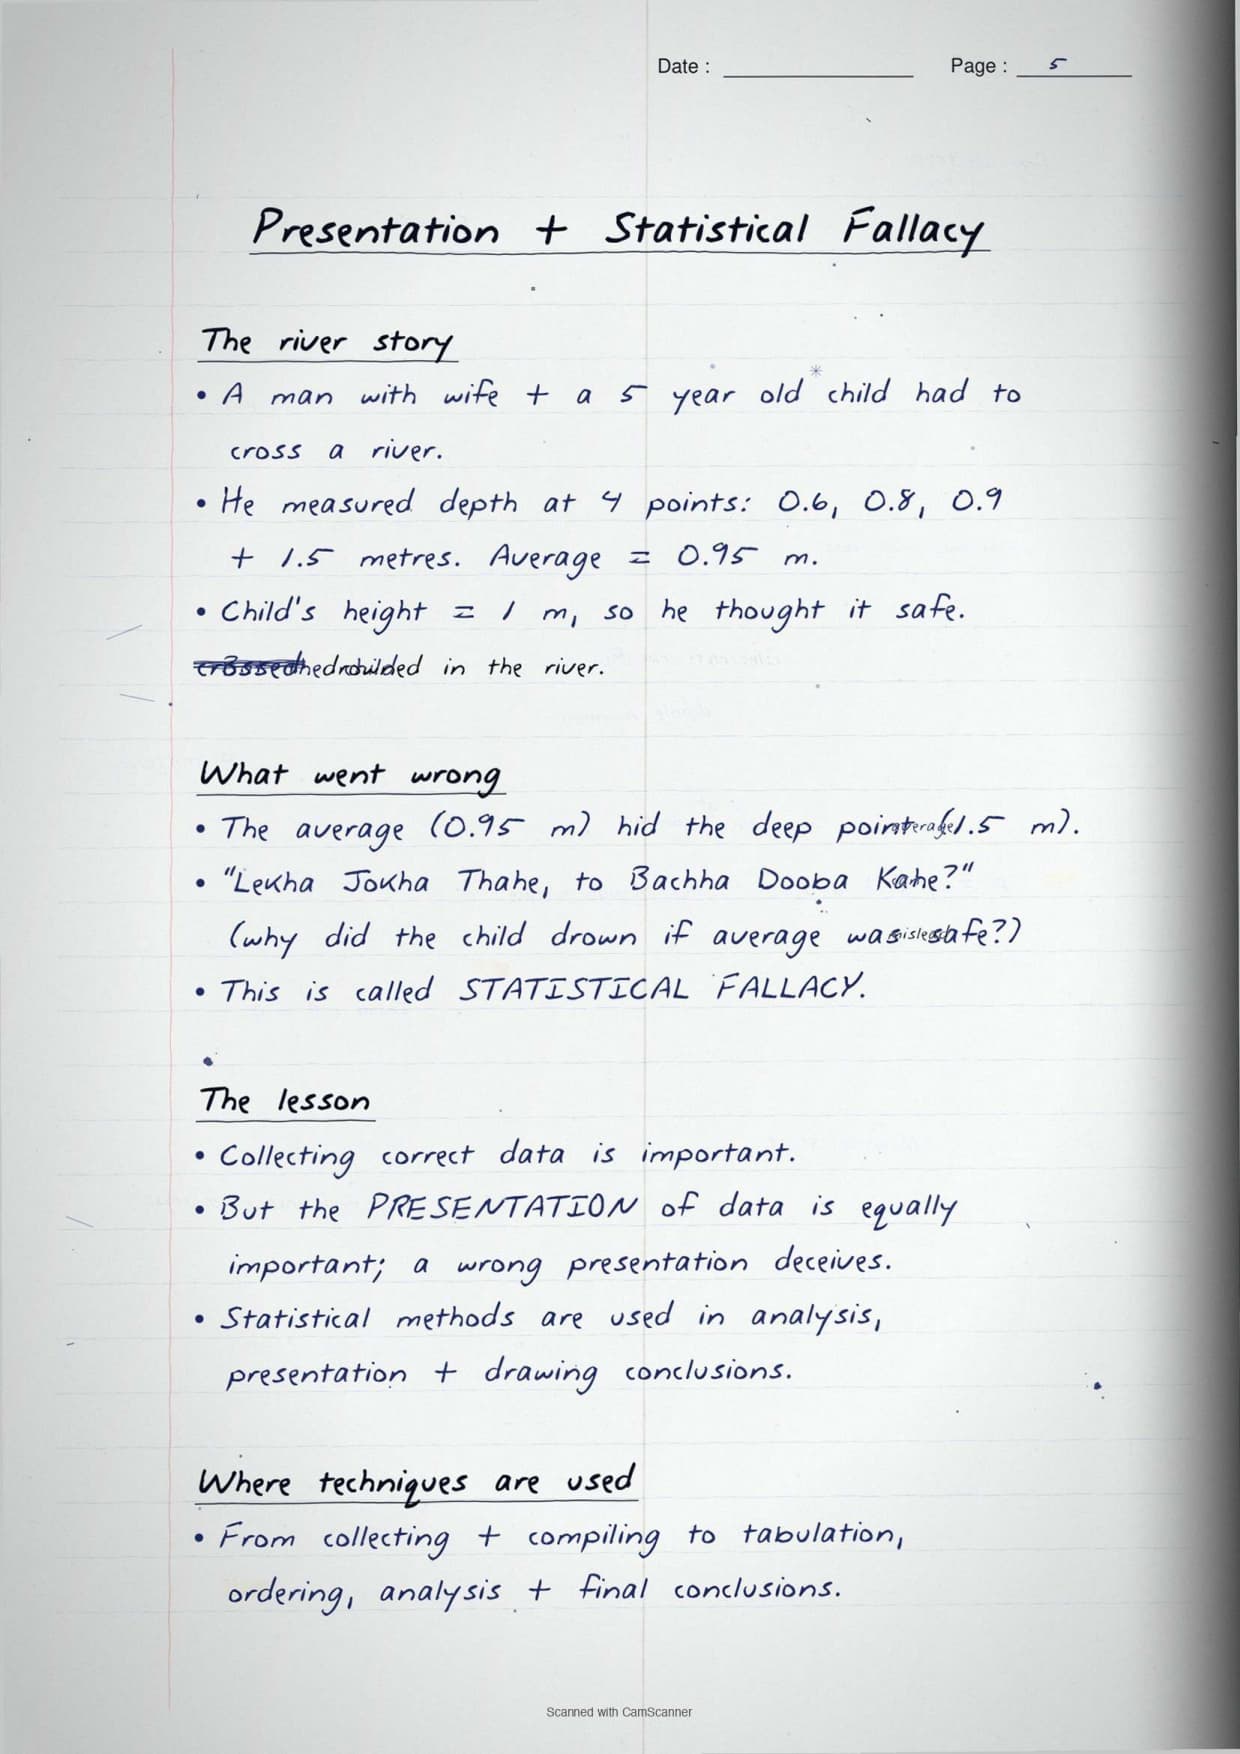
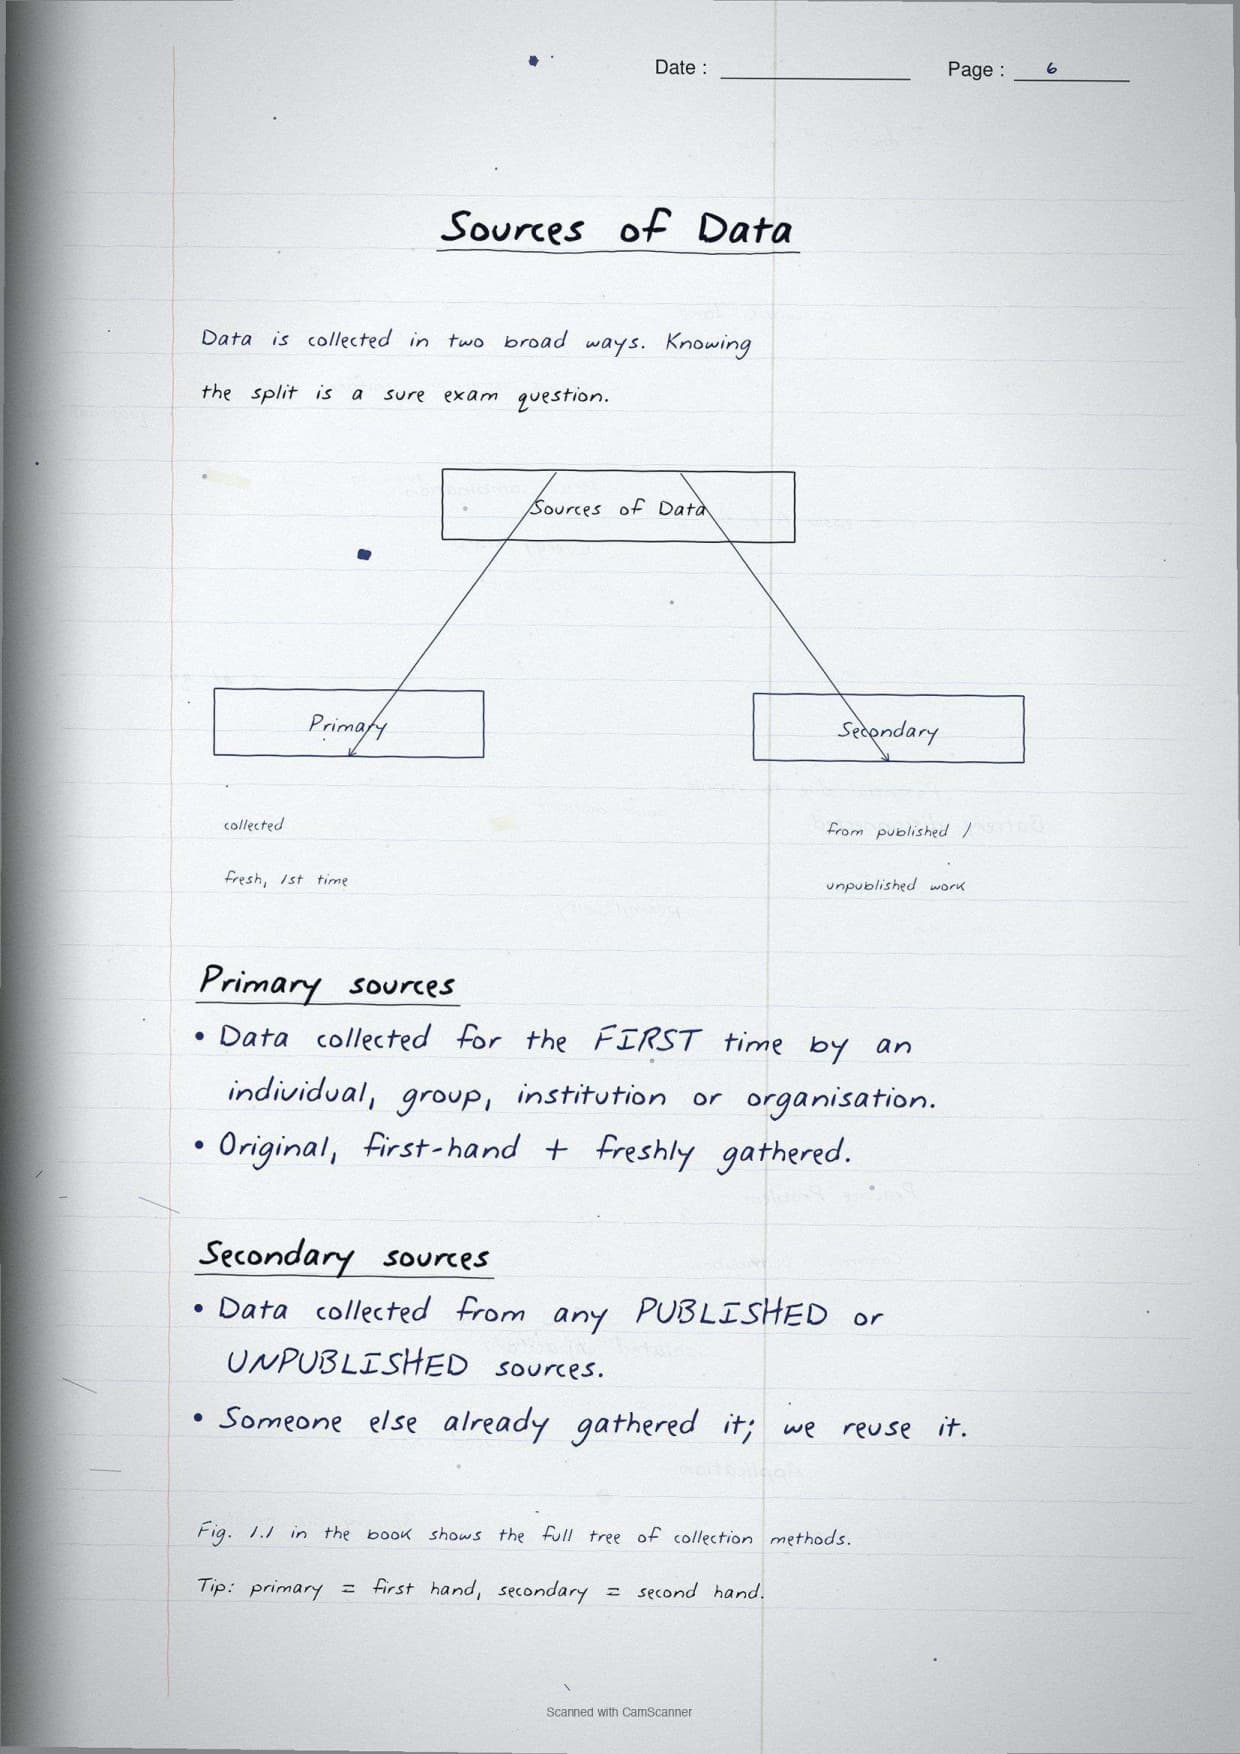
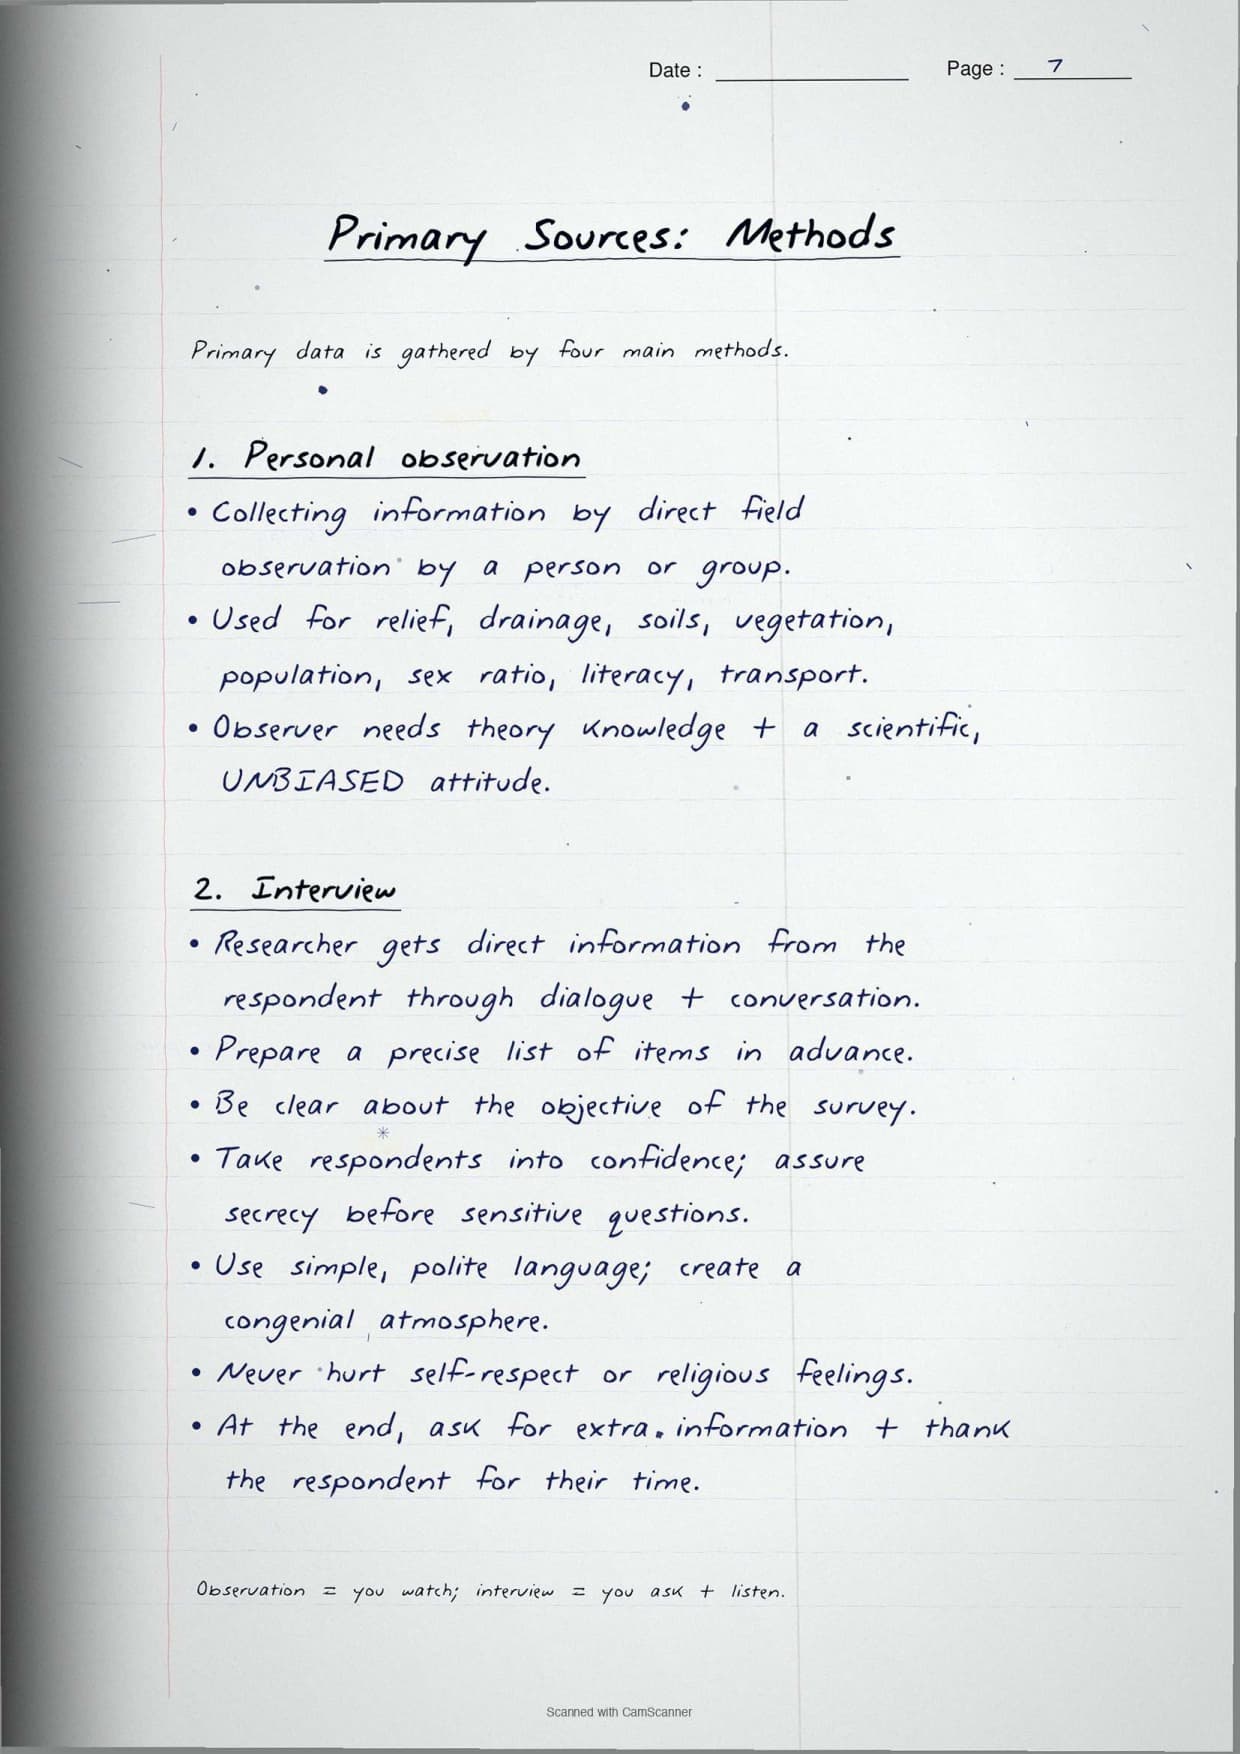
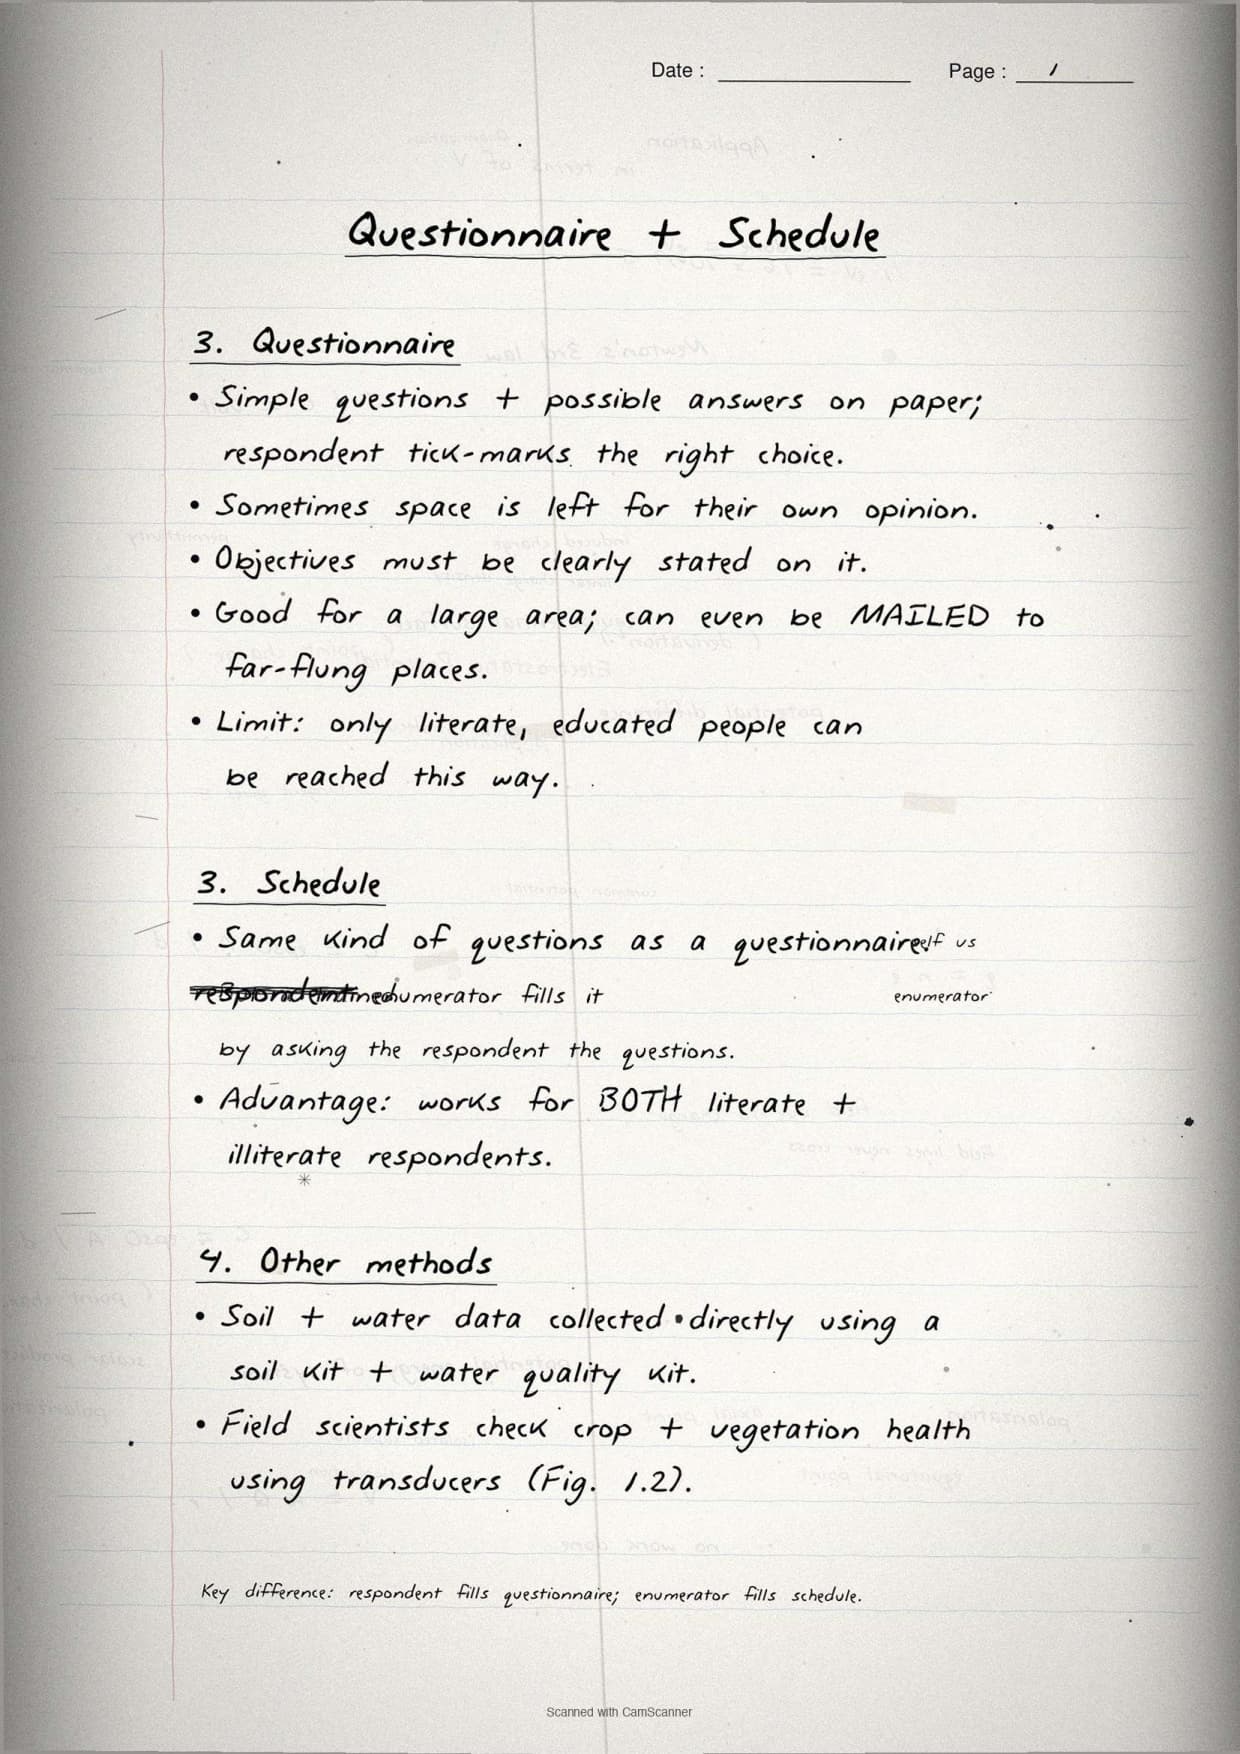
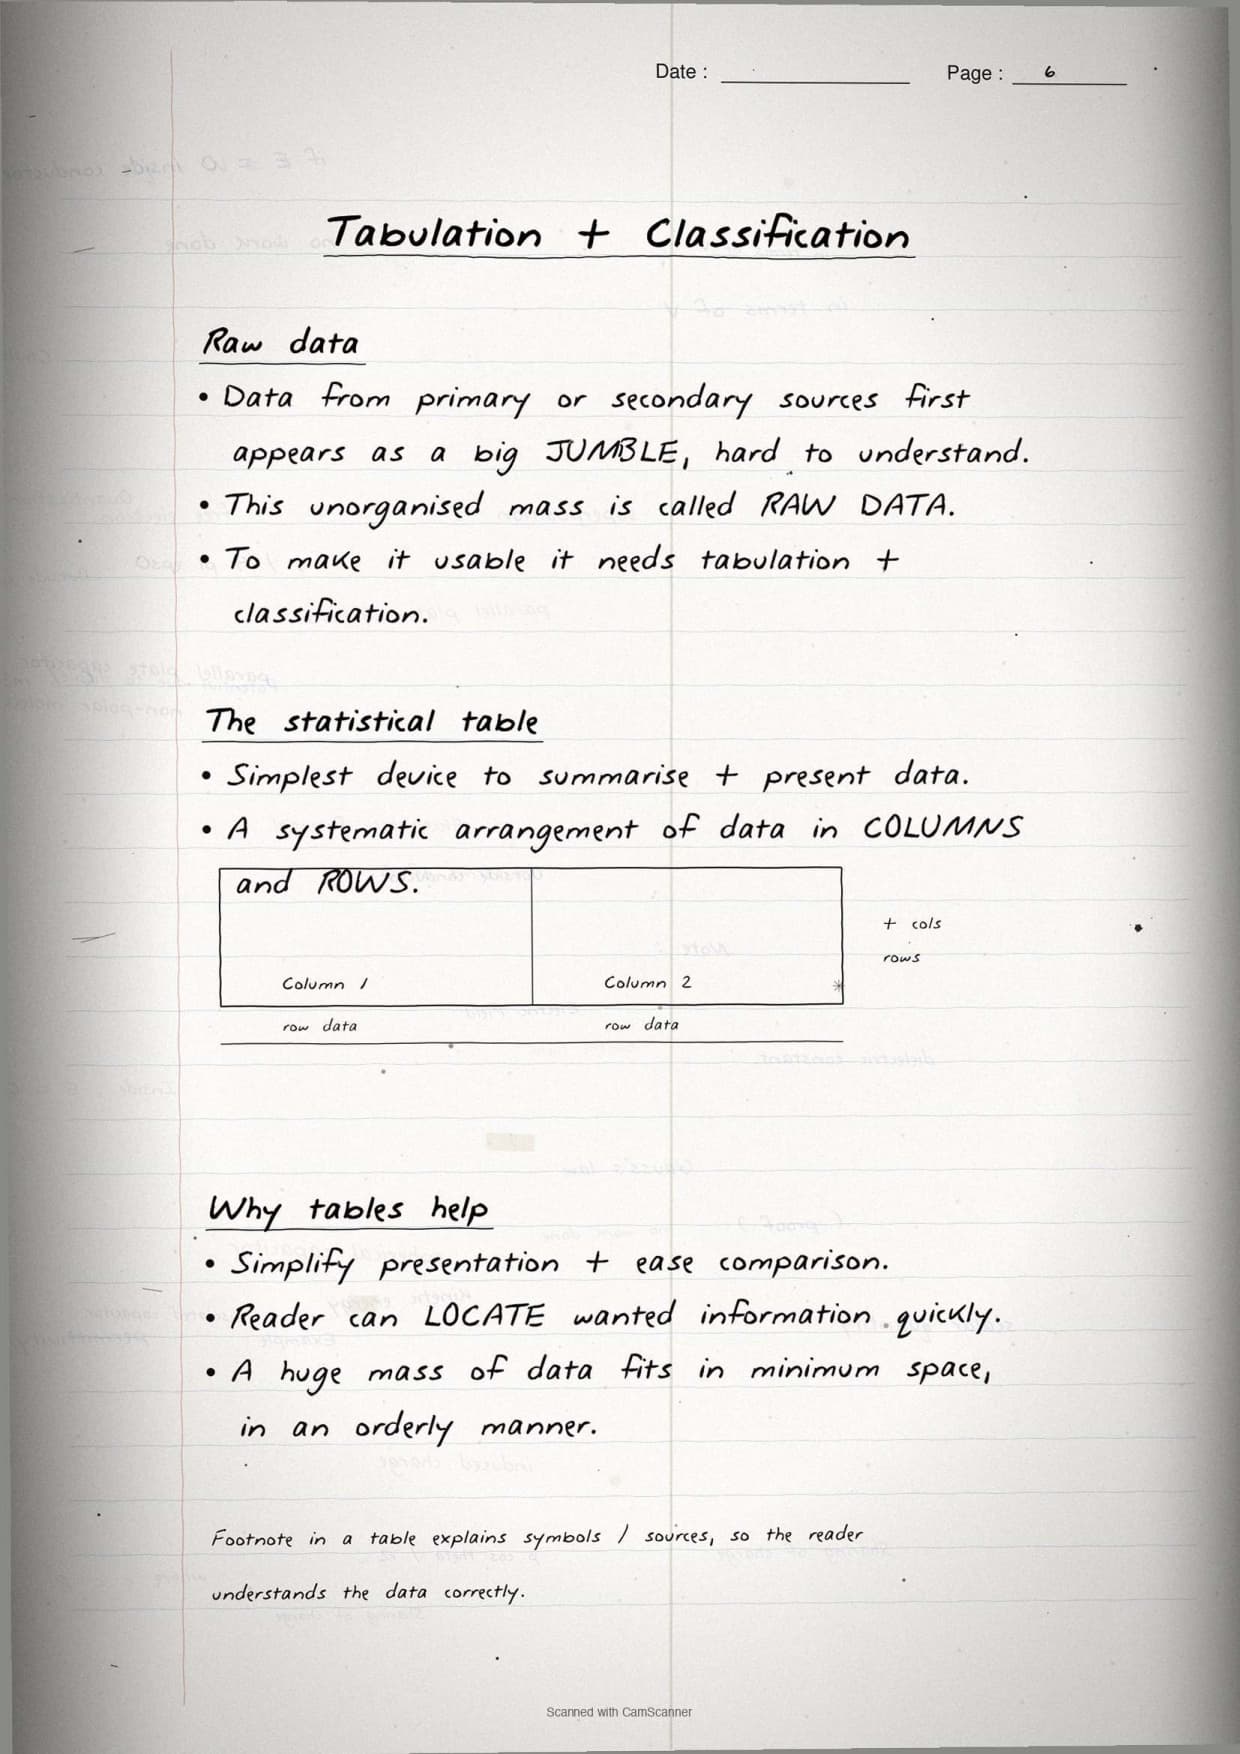
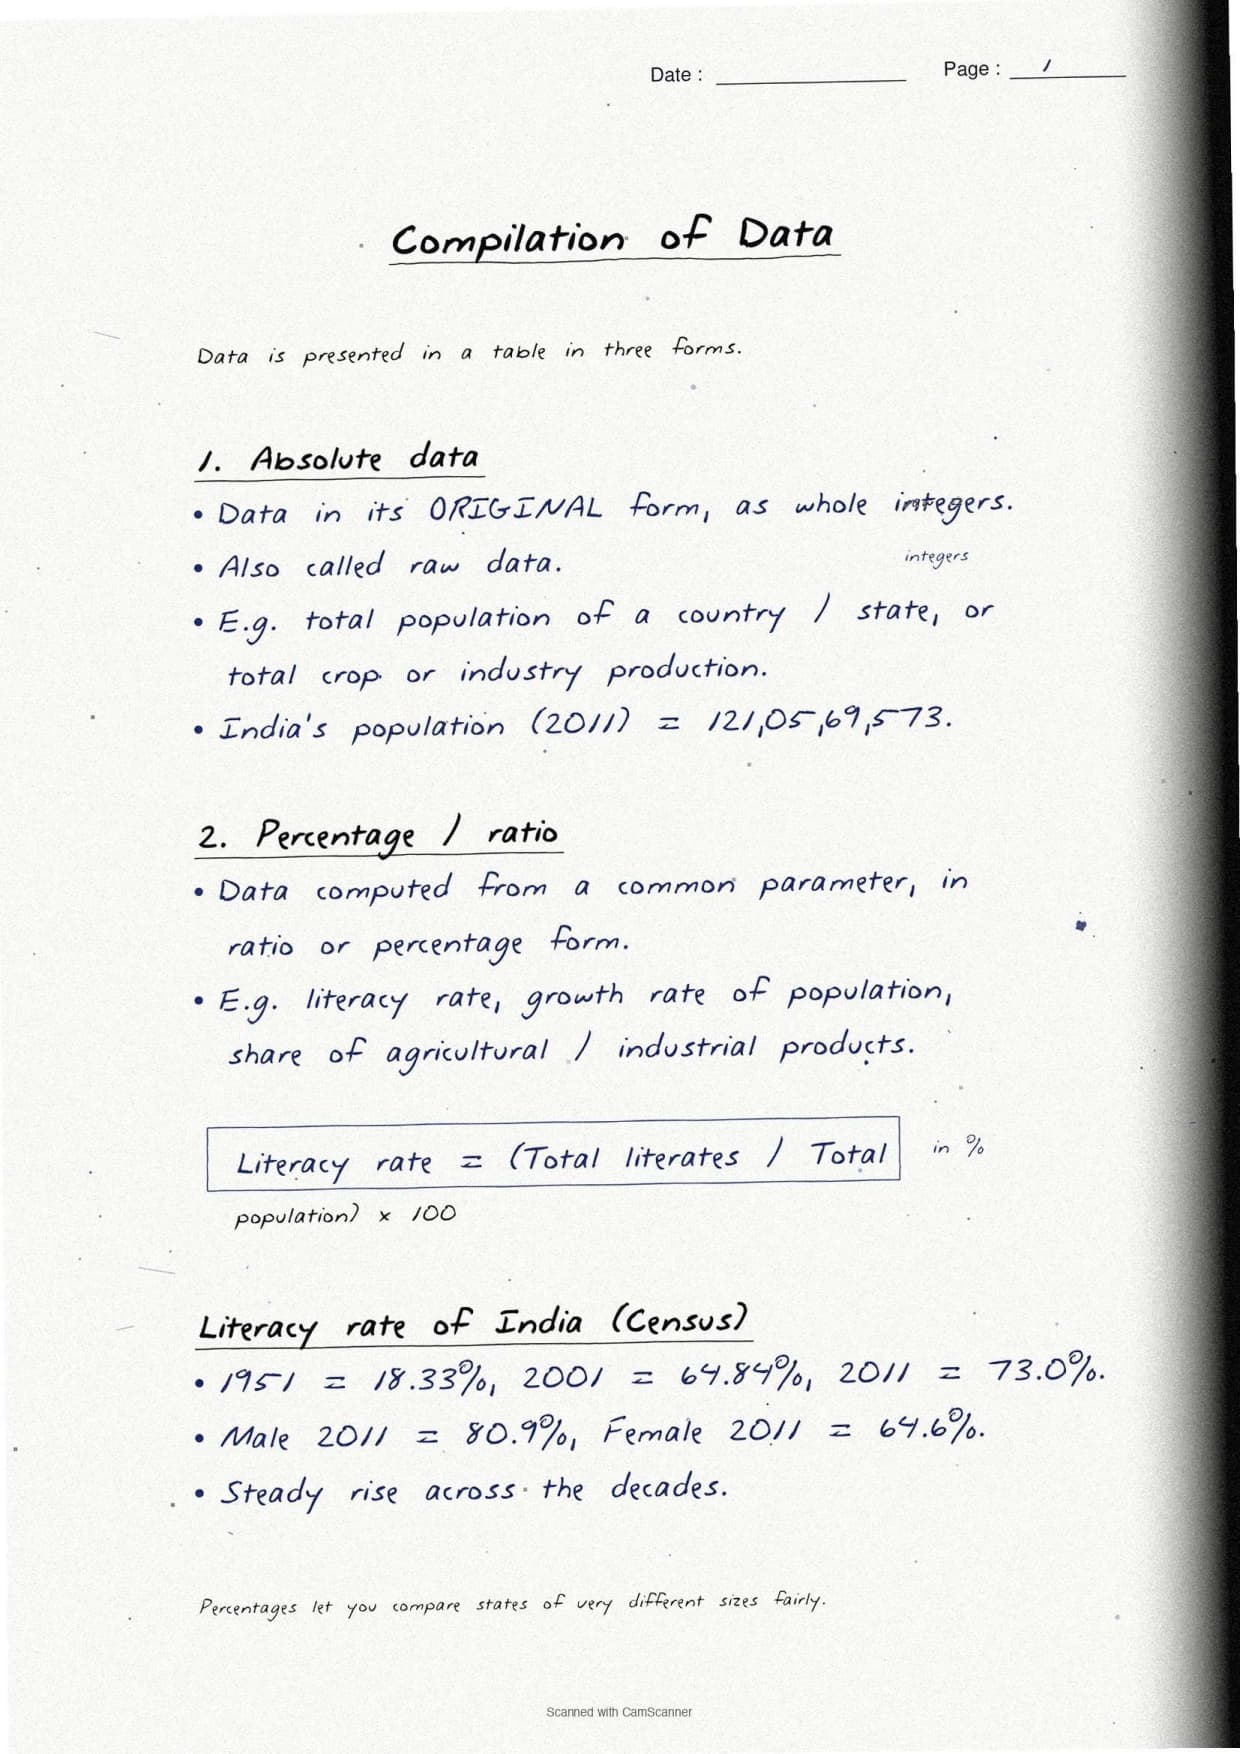
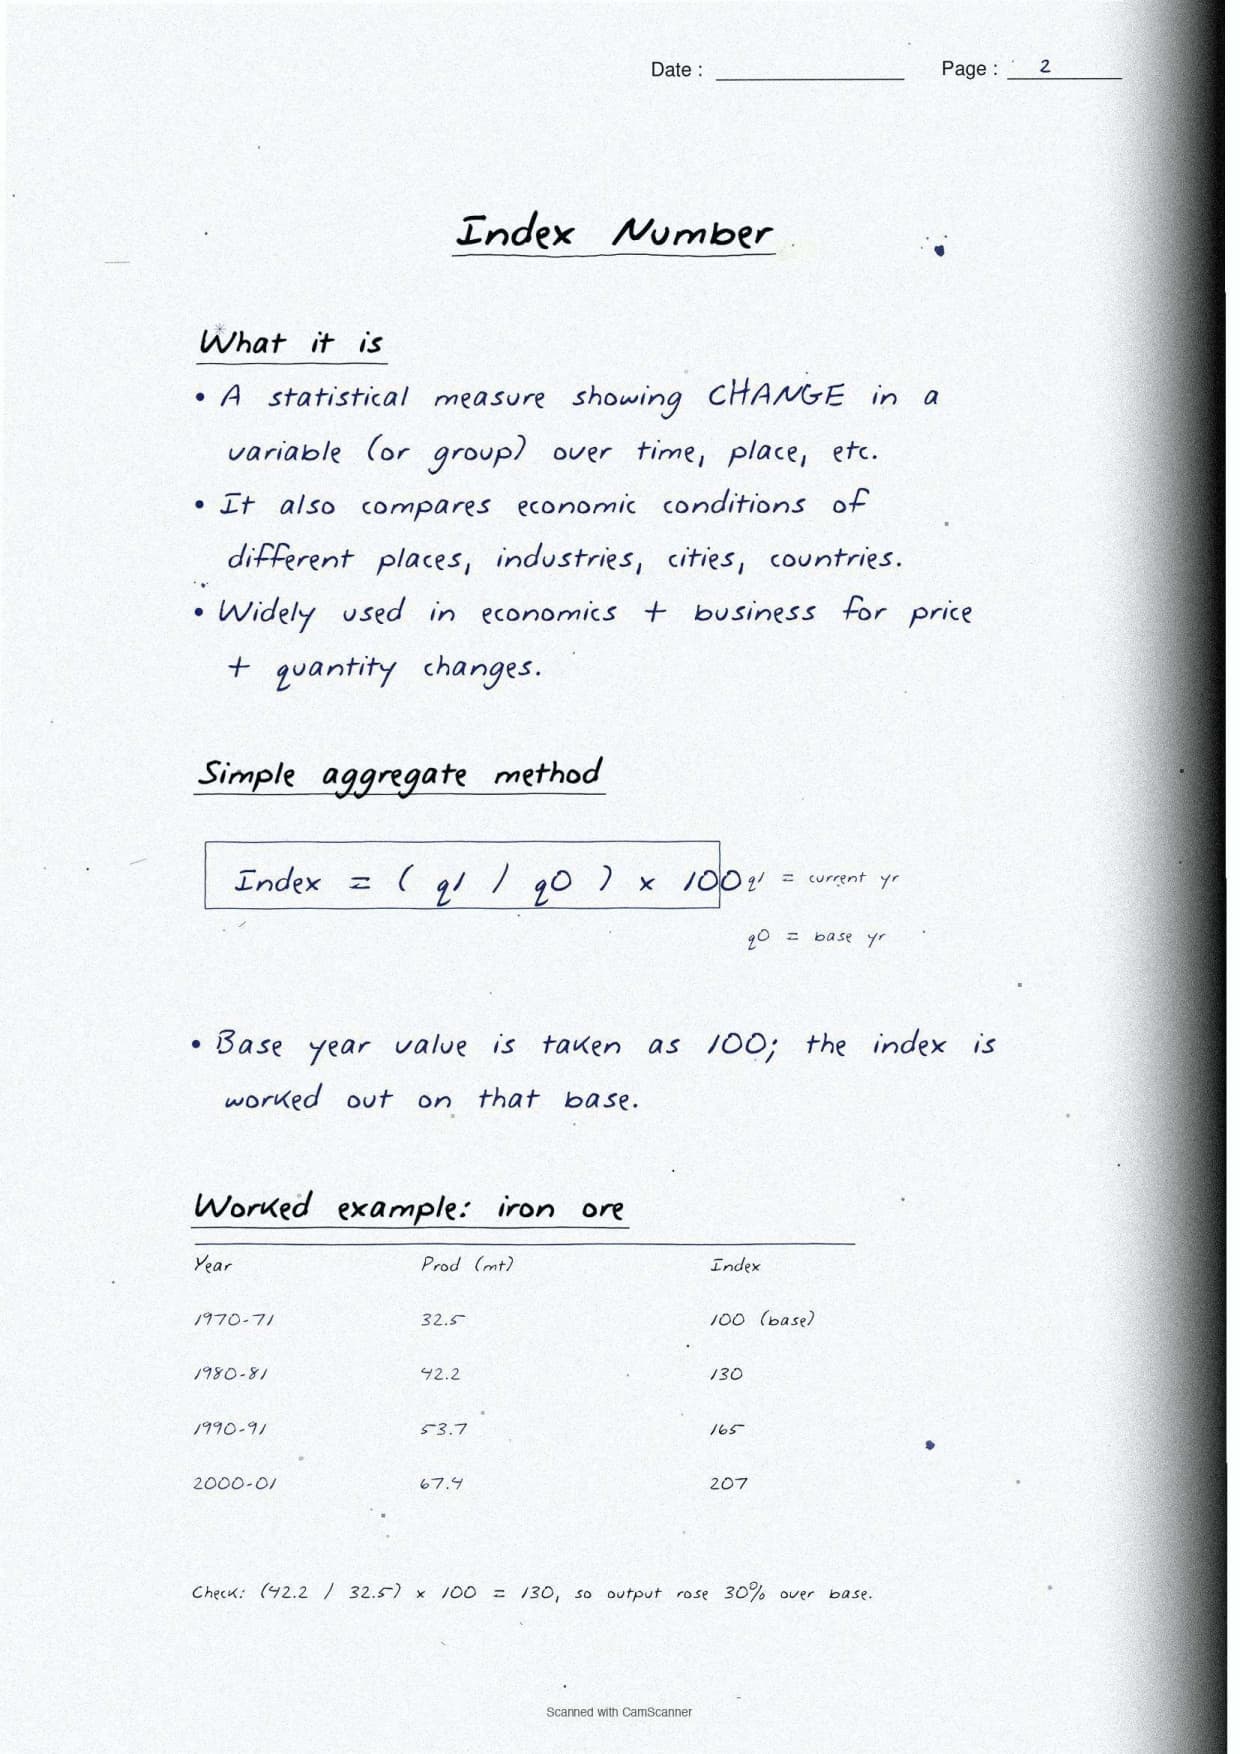
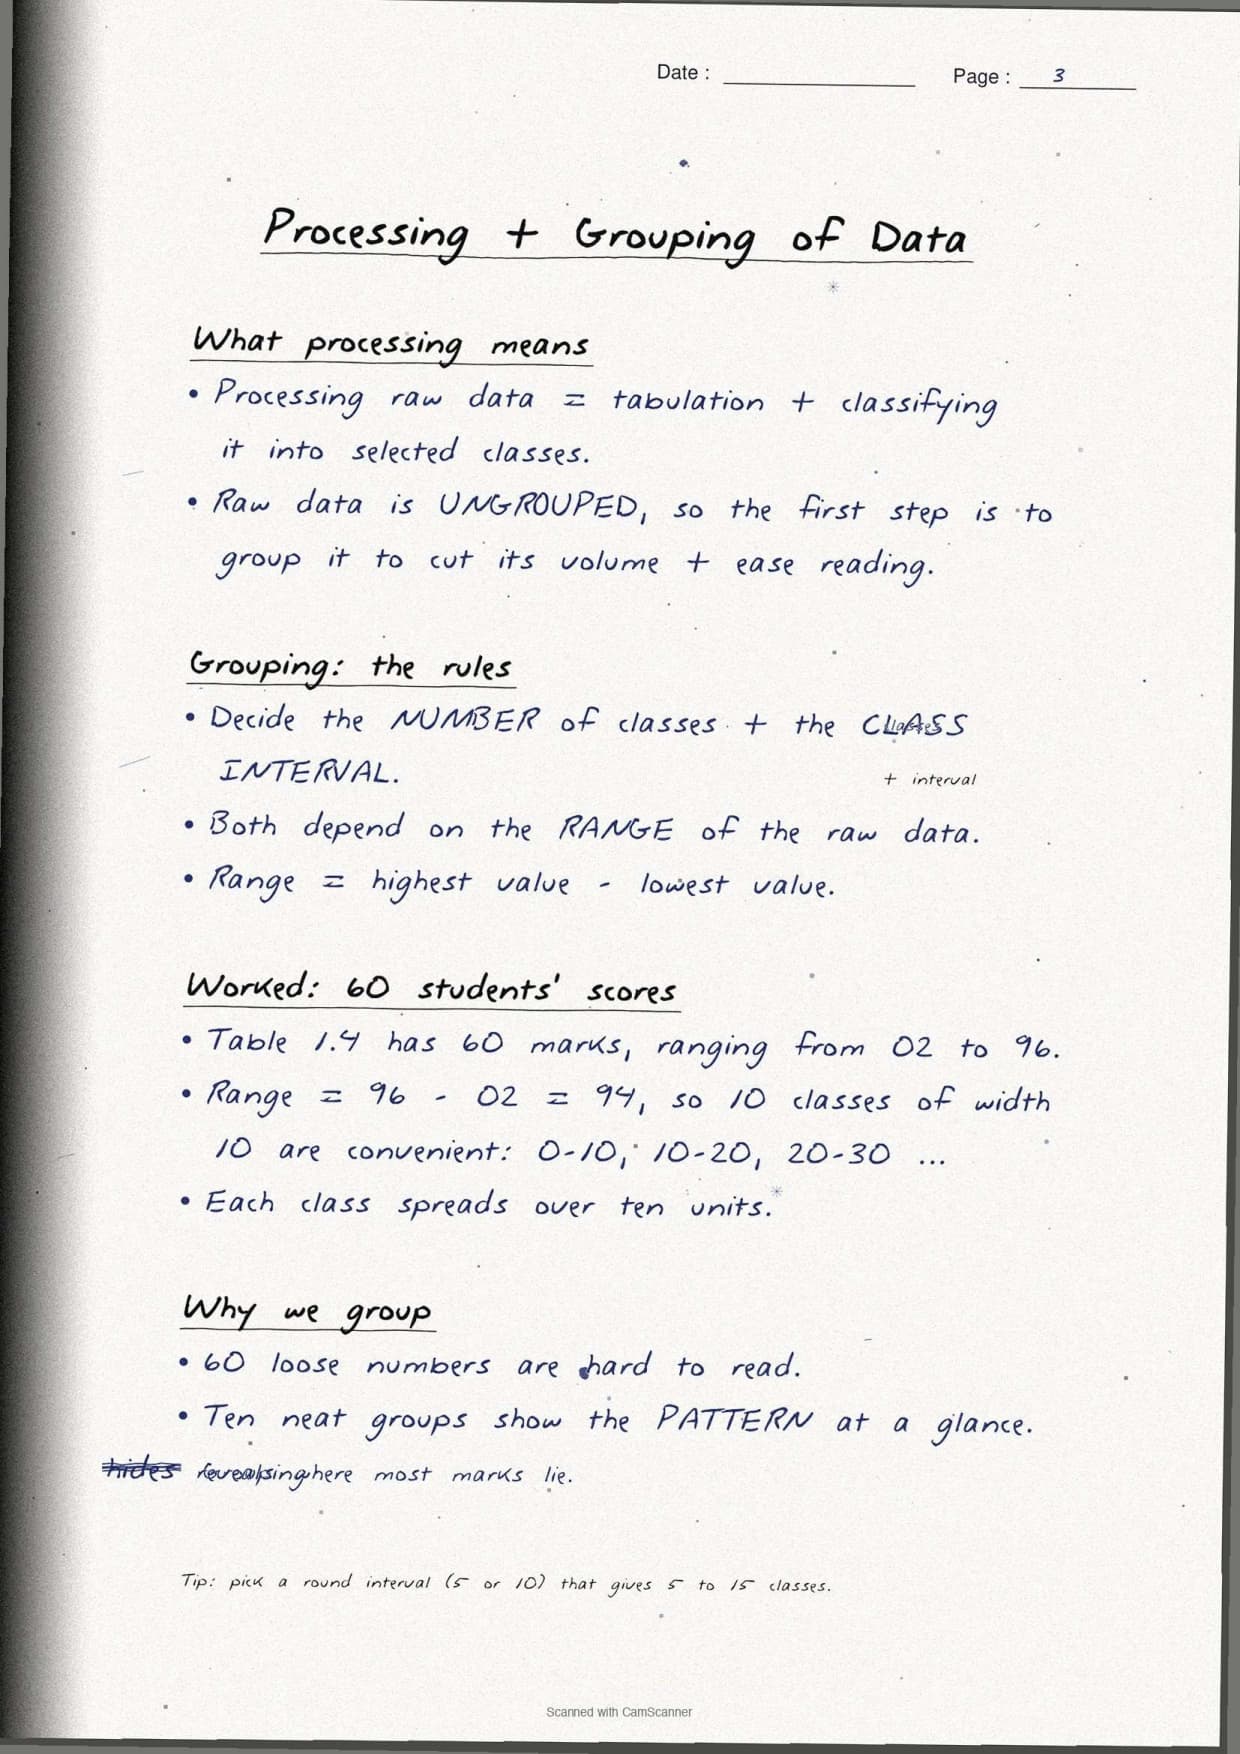
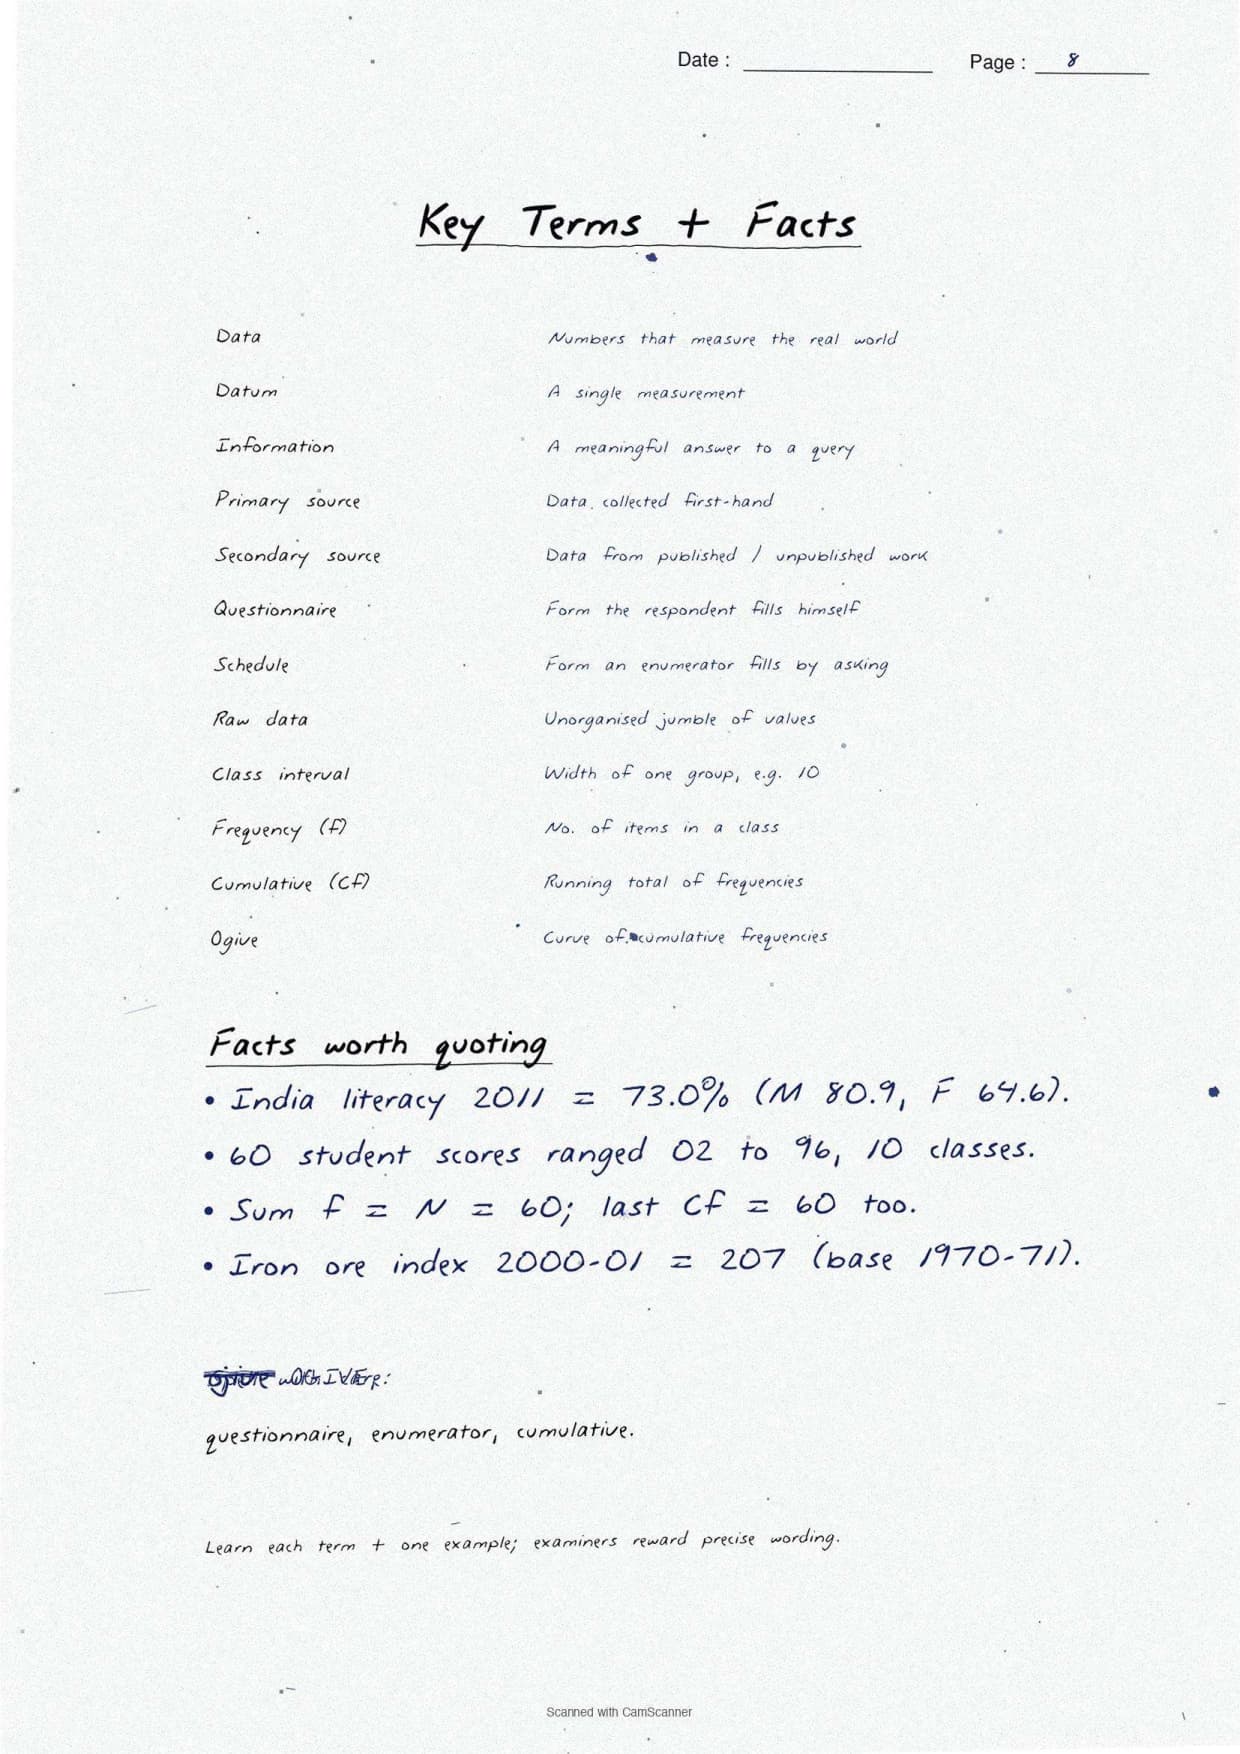
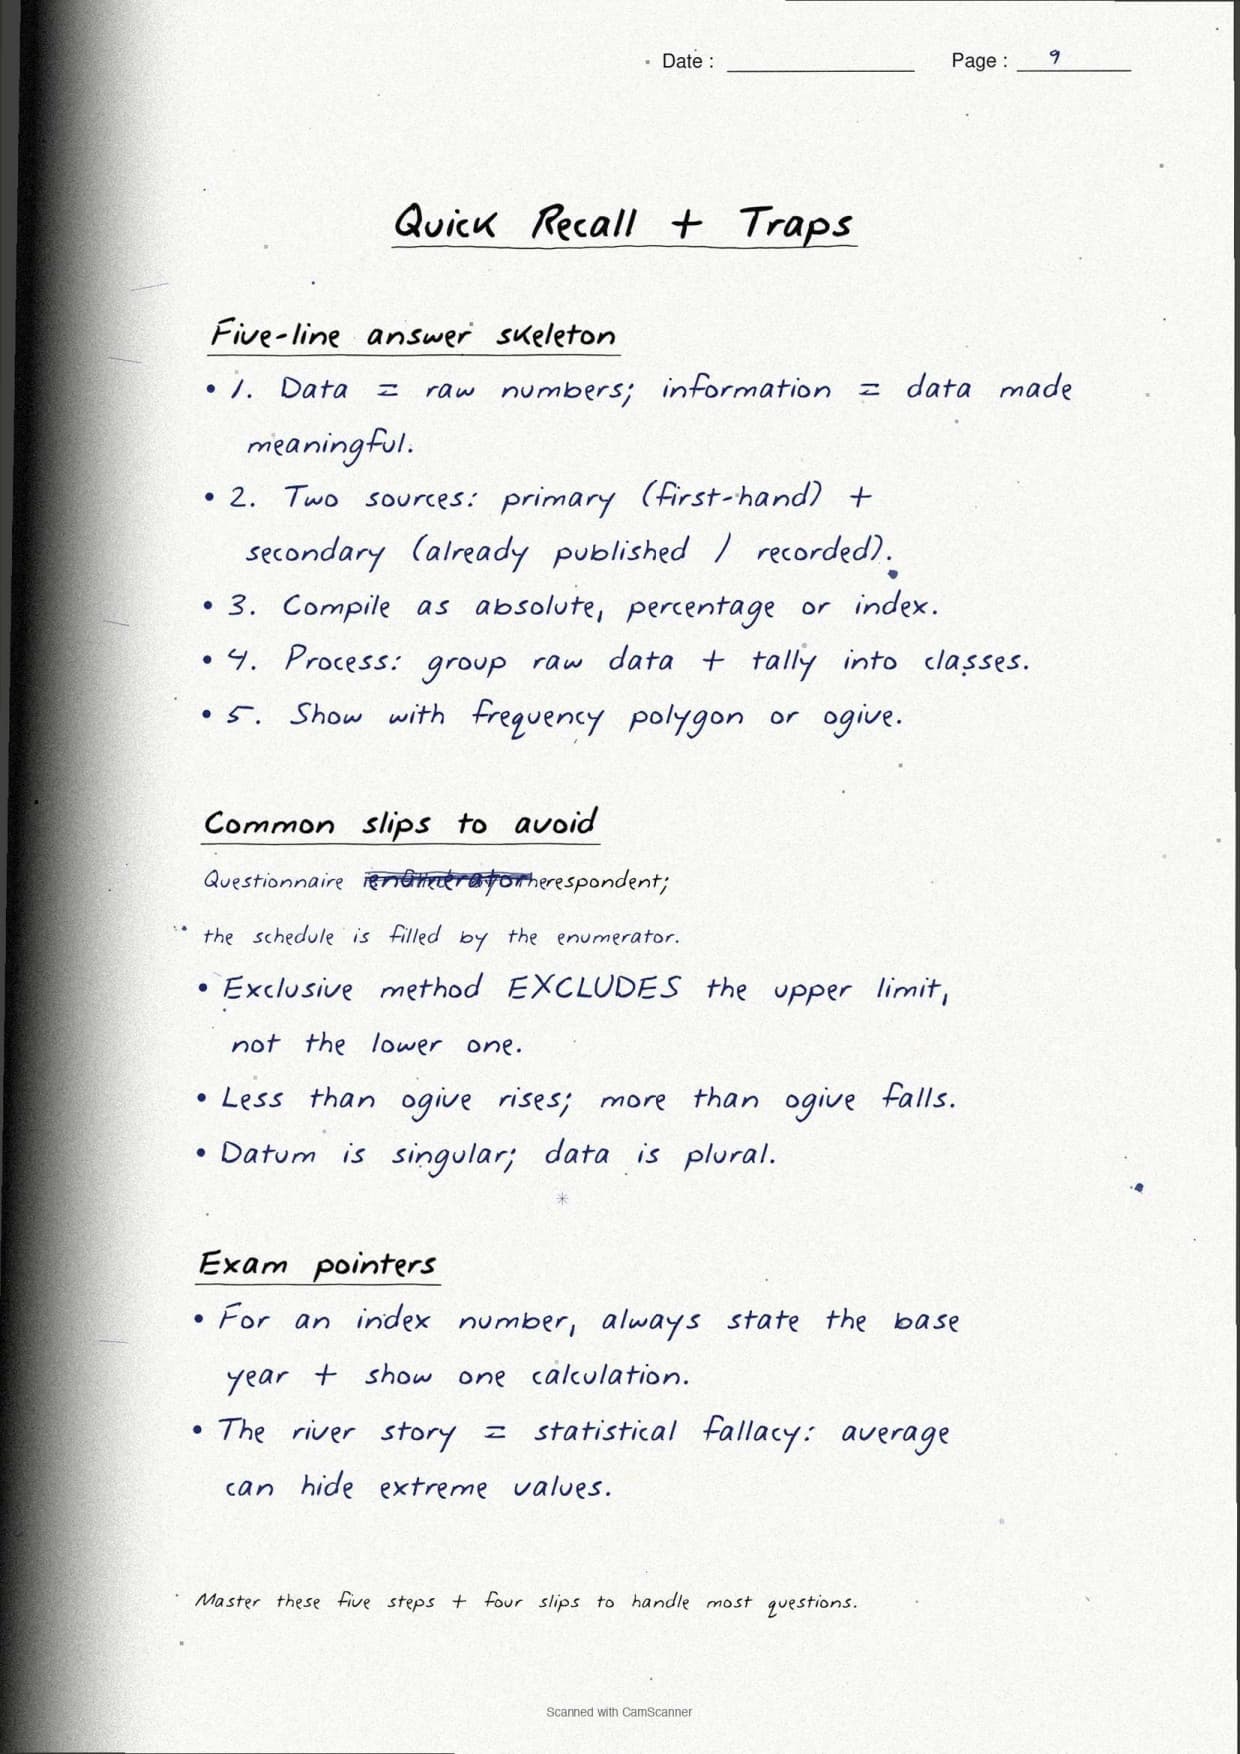
- Topper's handwritten revision notes covering all of CBSE Class 12 Practical Work in Geography Chapter 1.
- 3-5 marks weightage in the Class 12 Geography board paper, with primary vs secondary source distinctions, interview protocols and tabulation rules written out by hand.
- Pairs with the typed NCERT Solutions, typed Notes and the official NCERT Book PDF for the same chapter.
Each page of these data sources and compilation class 12 geography handwritten notes is written by a Collegedunia subject expert, mapped to the 2026-27 NCERT Practical Work in Geography textbook, and cross-checked against the last five years of CBSE Class 12 Geography board papers.
Student Feedback
70% of Class 12 students said handwritten notes feel faster to scan than typed PDFs in the final 48 hours before the board exam, and 4 out of 5 said pen-on-paper classification boxes stick in memory better. Most finished one full revision pass in about 18 minutes.
Source: 2026-27 Class 12 Geography handwritten-notes poll, 9,240 CBSE students.
What These Handwritten Notes Include
The data sources and compilation class 12 geography handwritten notes PDF is a 22-page revision file. Every page carries hand-drawn classification trees for primary and secondary sources, arrow-tagged boxes for methods of data collection, and colour corrections where a definition is tightened. It is built for last-mile revision, not first-time concept building.
The notes capture every concept tested in Chapter 1 of Practical Work in Geography: the definition of data and information, the primary vs secondary source split, all four methods of primary data collection, the full tree of secondary sources (published and unpublished), tabulation and classification, and data presentation including absolute data, percentages, index numbers and ogive curves.
| Pages | What the pages cover | Approx revision time |
|---|---|---|
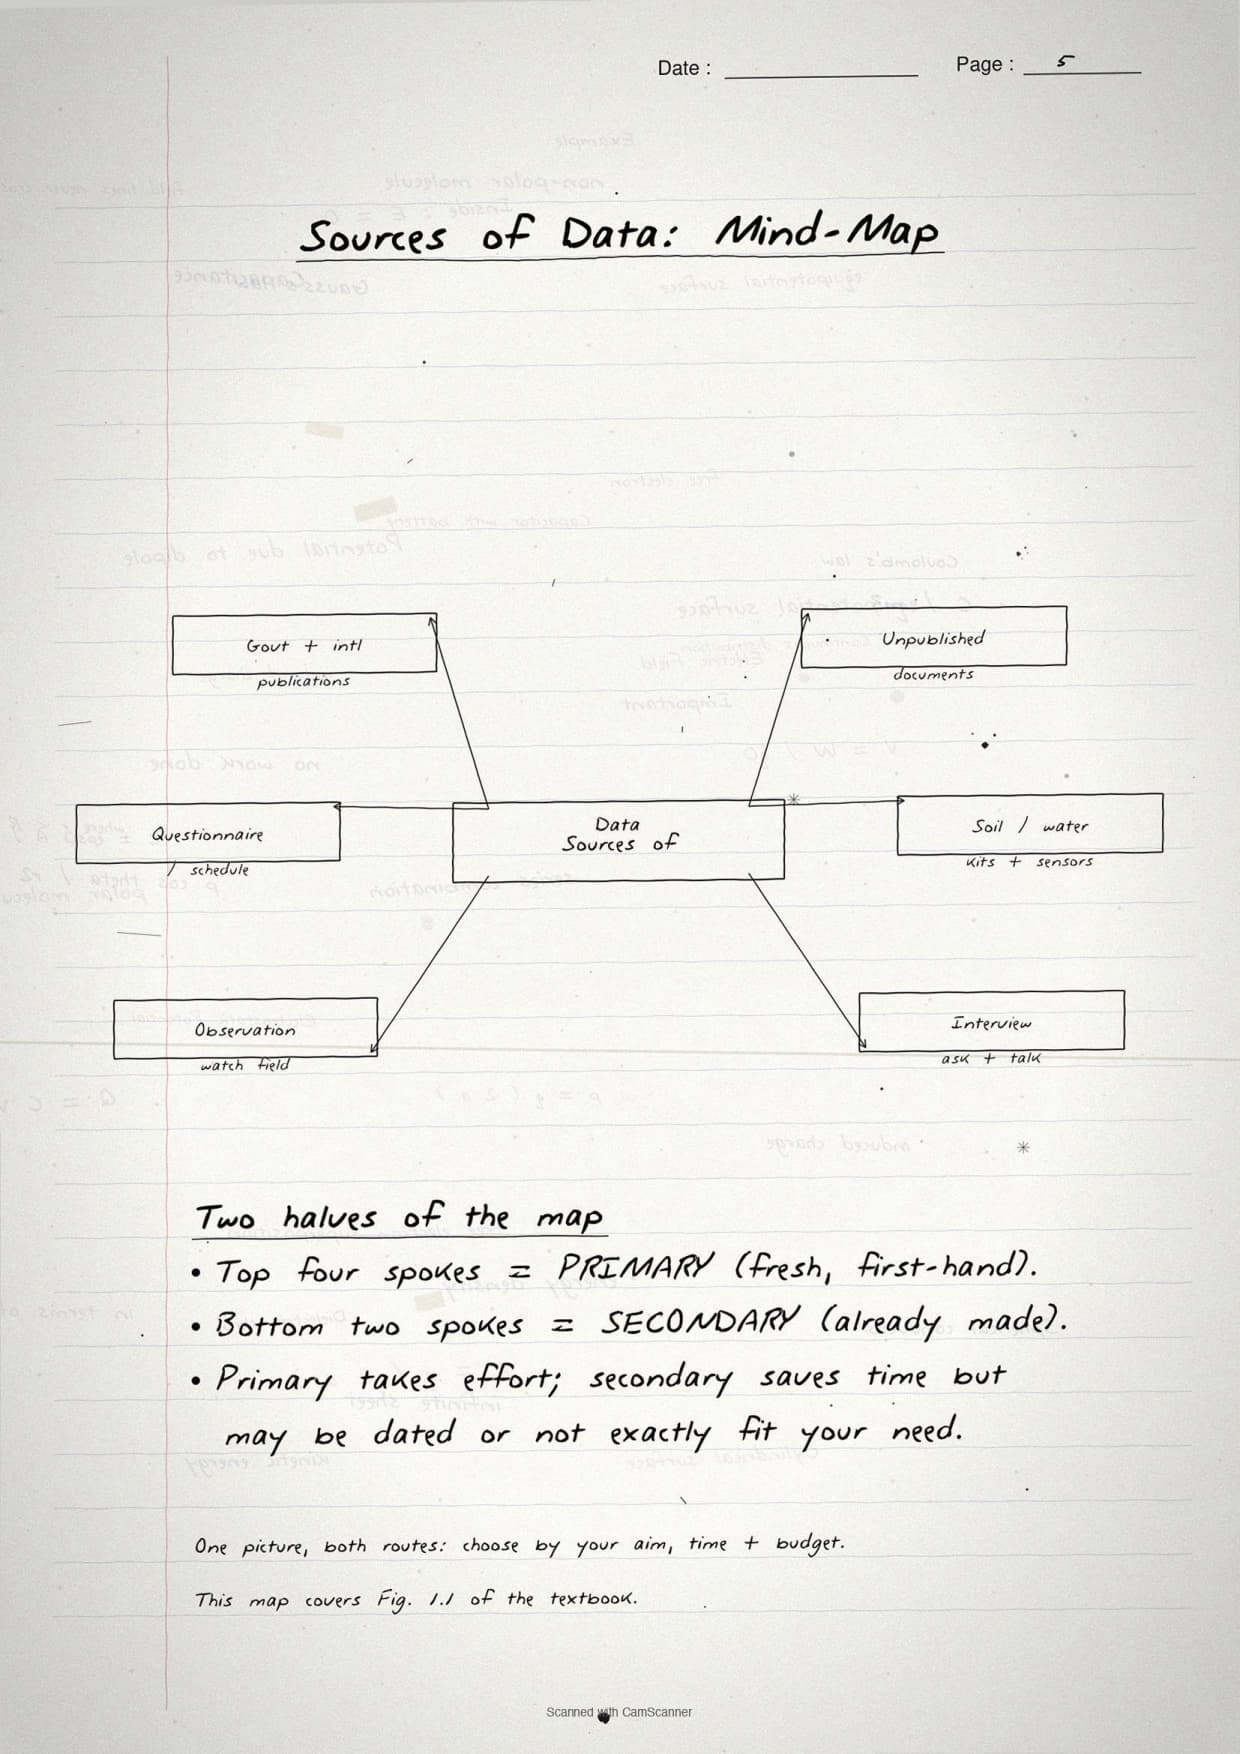
| Pages 1-5 | Data vs information, need of data, statistical fallacy story, sources of data tree diagram (primary vs secondary), personal observation method. | 5 minutes |
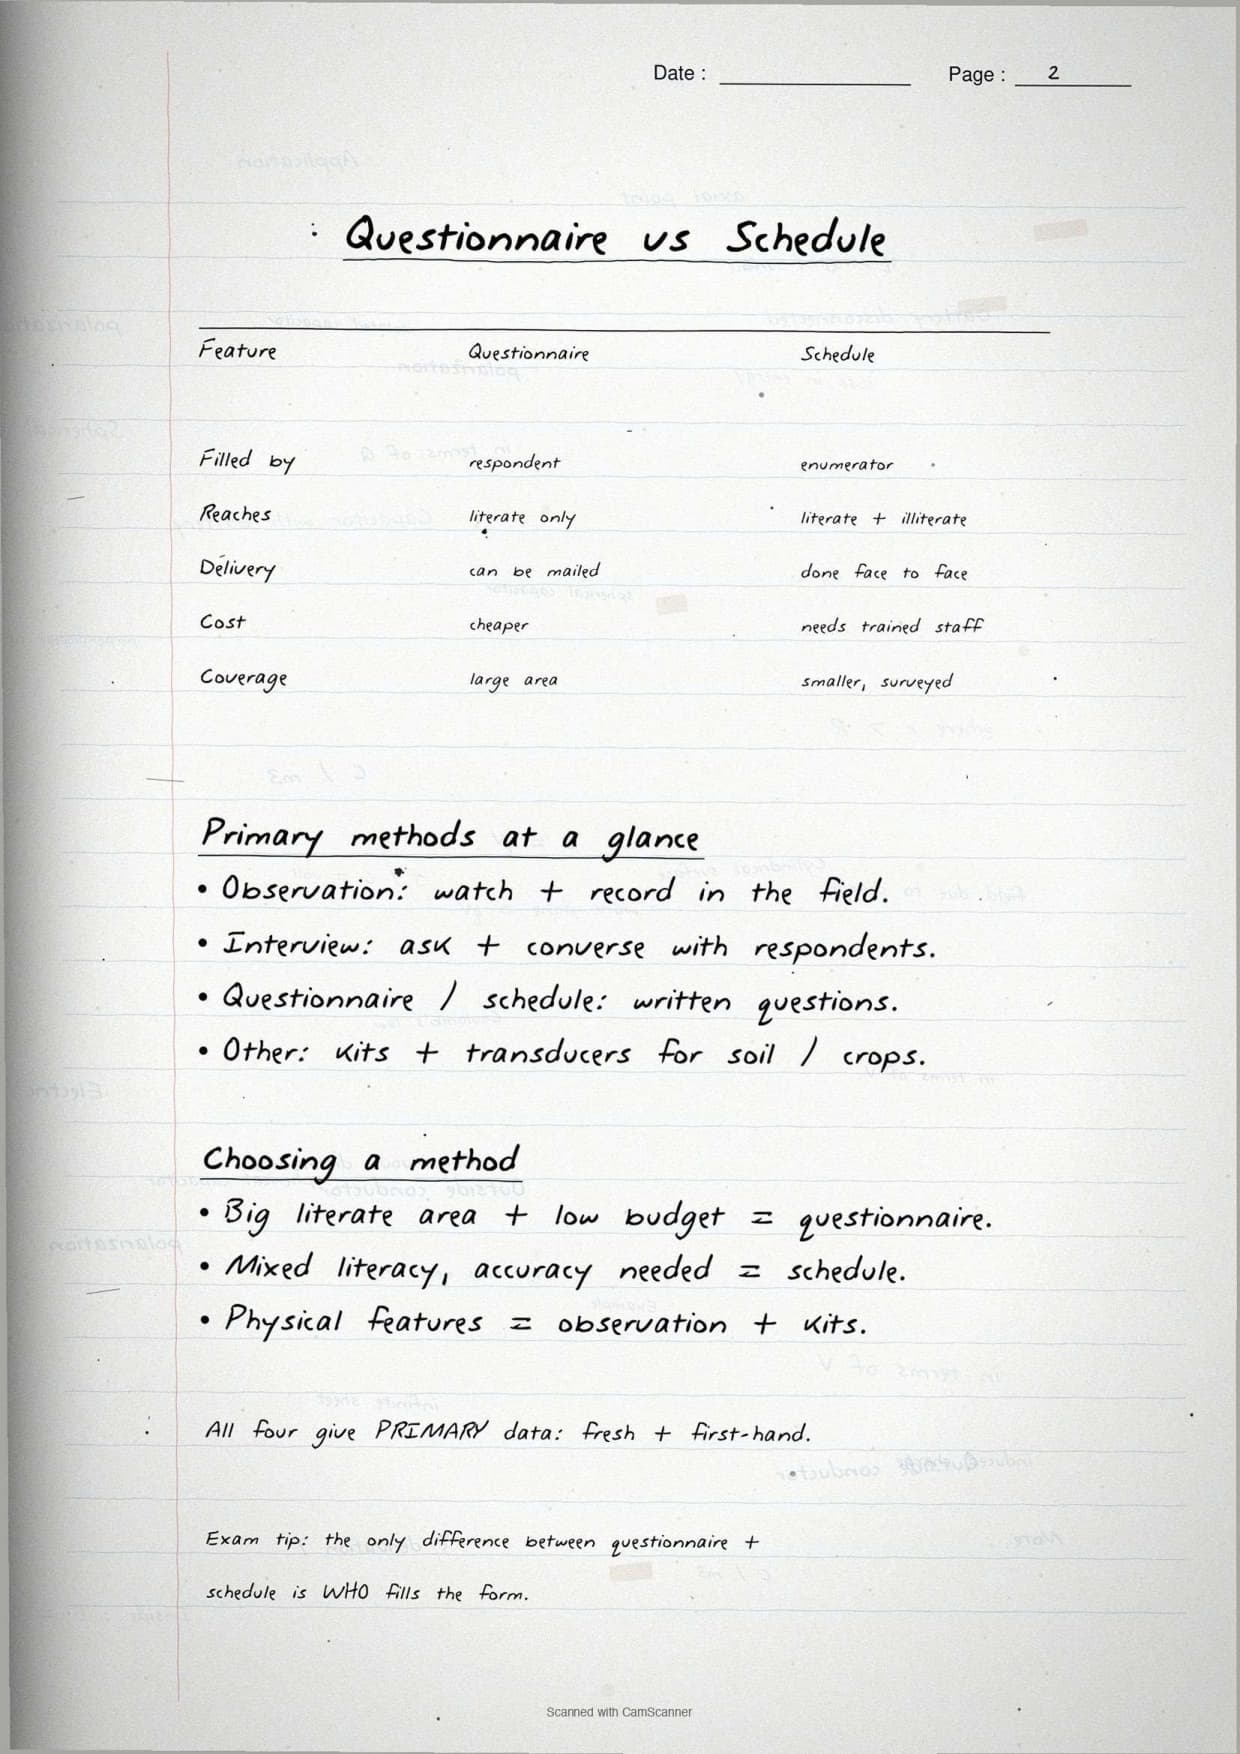
| Pages 6-10 | Interview method (8 precautions), questionnaire vs schedule, other methods (soil kit, water kit, transducers), secondary published sources. | 7 minutes |
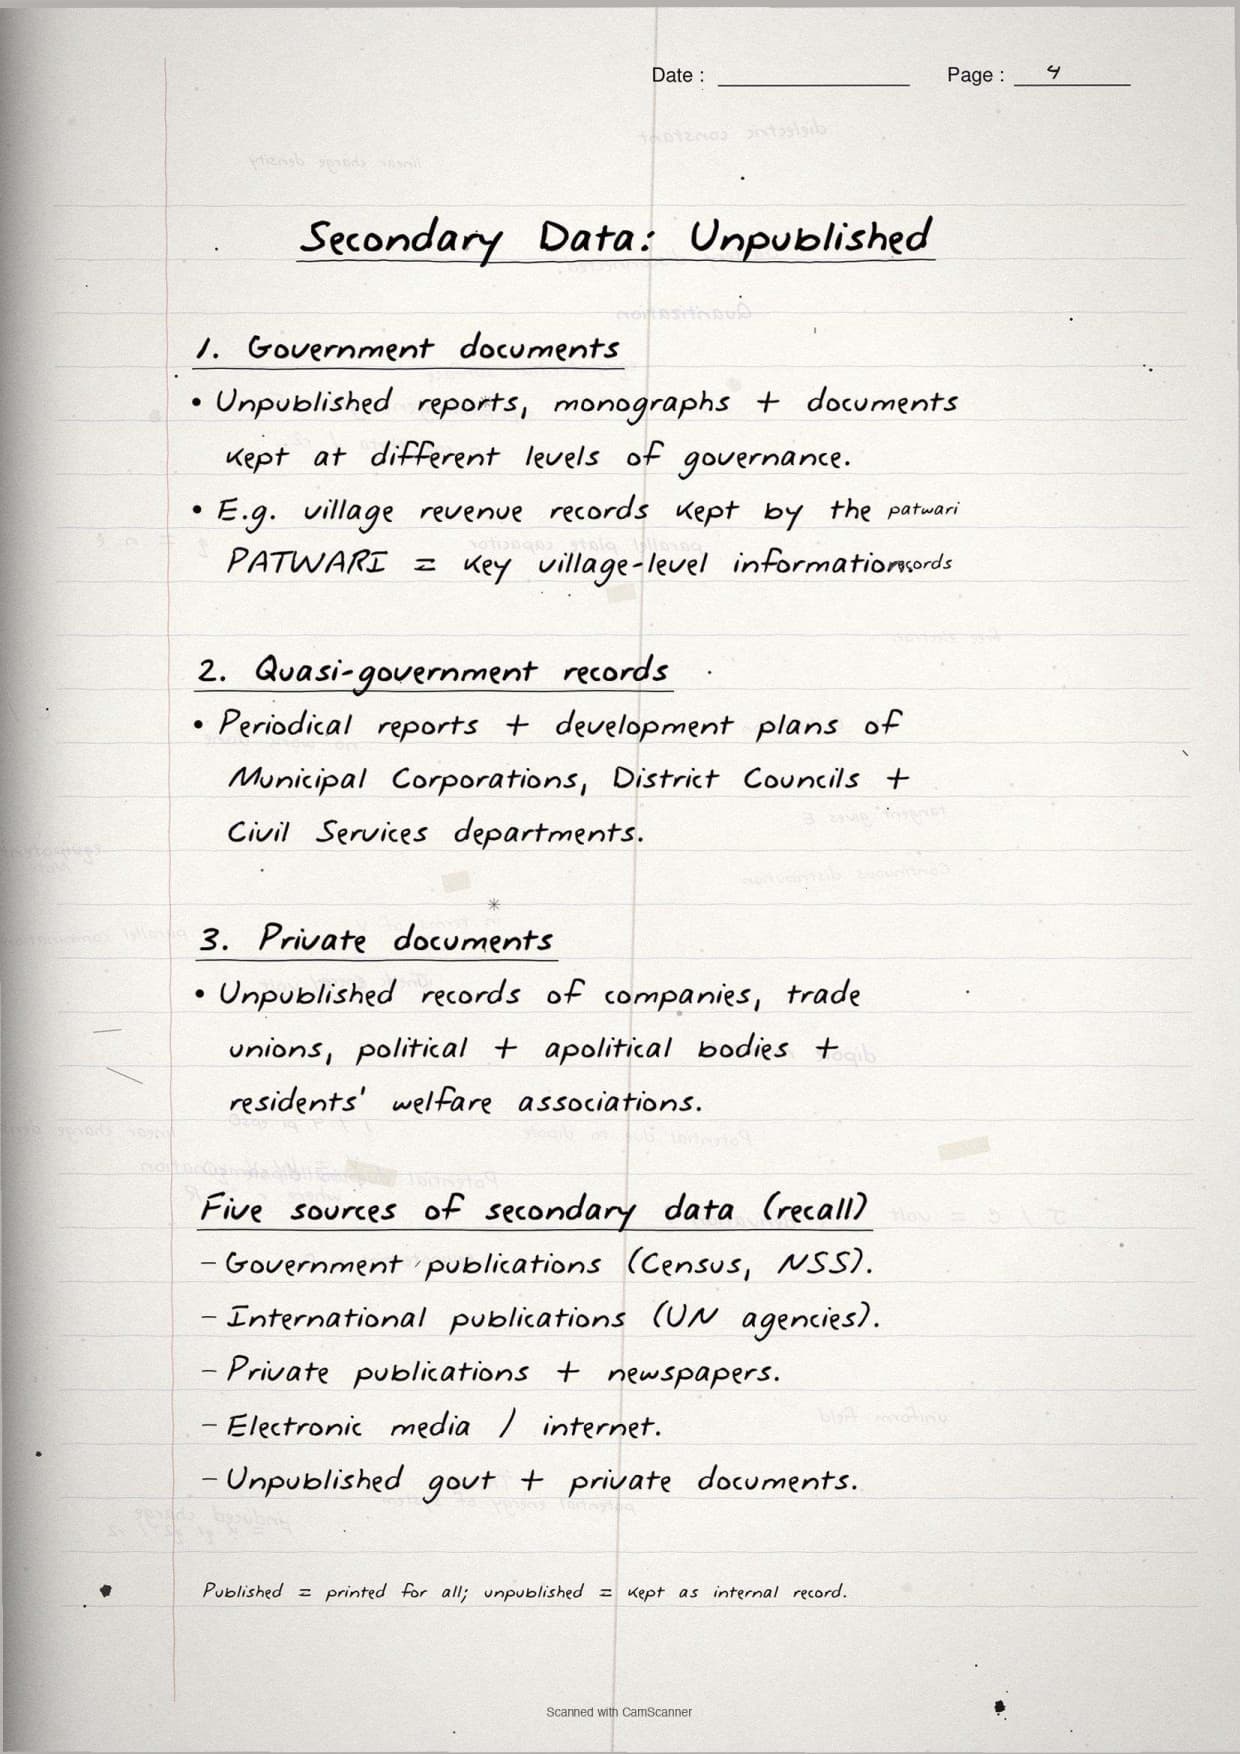
| Pages 11-15 | Unpublished secondary sources, tabulation and classification, statistical tables, absolute data, percentage data, index numbers. | 6 minutes |
| Pages 16-22 | Frequency distribution (tally marks, inclusive and exclusive methods), cumulative frequency, less than and more than ogive curves, exercises. | 5 minutes |
Primary vs Secondary Sources: Key Distinctions at a Glance
The primary and secondary sources of data class 12 distinction is the backbone of this chapter. Both produce usable data, but they differ in who collects it, when, and how. CBSE asks this distinction almost every year, typically for 3 marks.
| Basis of difference | Primary sources | Secondary sources |
|---|---|---|
| Who collects it | The researcher or their team, directly in the field | Someone else, before the current researcher's study |
| First time? | Yes, collected for the first time | No, already collected and published or filed |
| Examples | Field survey, interview, questionnaire | Census of India, UN Demographic Year Book, newspaper |
| Cost and time | Higher cost and time, but more specific to the research need | Lower cost and time, but may not fit the exact research need |
| Limitation | Limited to areas or groups the researcher can physically reach | May be outdated or not exactly relevant to the study area |
The notes add a margin rule that resolves almost every classification question: "If you collected it yourself, it is primary. If you found it in a book or report, it is secondary."
Methods of Primary Data Collection Explained
The NCERT chapter covers four methods of primary data collection, mapping directly to the 3-mark and 5-mark board questions.
Personal observation
Direct field observation by the researcher, used for relief features, drainage, soil, vegetation and population structure. Key precaution: the observer must have theoretical knowledge and a scientific attitude for unbiased evaluation.
Interview method
Information is gathered directly through dialogue. NCERT lists eight precautions; the most-tested is to assure the interviewee that secrecy will be maintained before asking any sensitive question.
Questionnaire and schedule
A questionnaire is filled in by the informant themselves; a schedule is filled in by a trained enumerator. Questionnaires reach only literate people, while schedules also reach illiterate people. This 1 to 2 mark distinction appears in the CBSE paper almost every year.
Other methods
Soil and water properties are measured directly with field kits, and crop-health data is collected using transducers. This is instrument-based field measurement, not interview-based.
Important: Questionnaire and interview are often confused. If the person fills in the form themselves, it is a questionnaire. If the researcher or enumerator asks and records, it is an interview or schedule.
Secondary Sources: Published and Unpublished Records
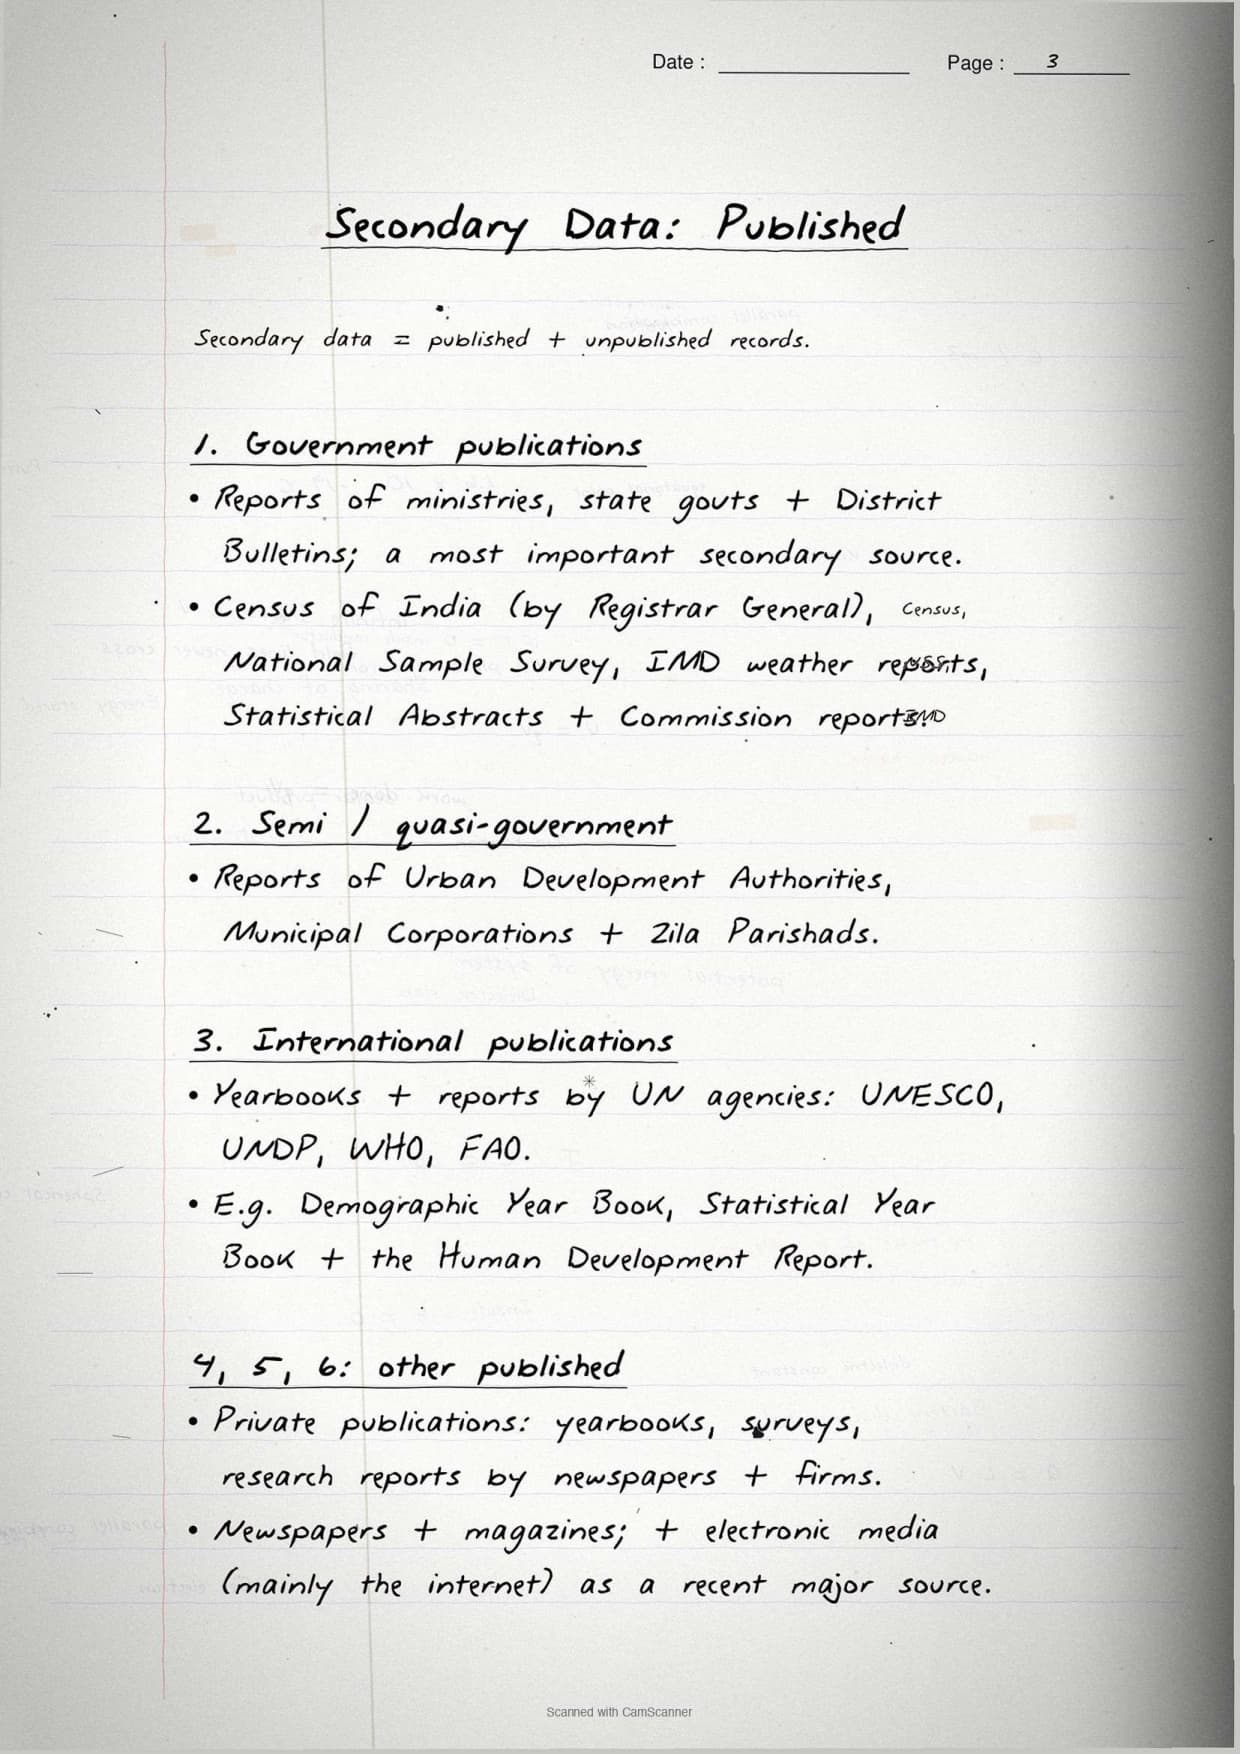
Secondary sources split into published and unpublished records. NCERT lists six published sources and three unpublished ones, all captured in a hand-drawn classification tree that mirrors Figure 1.1 of the textbook.
| Category | Source type | Examples from NCERT |
|---|---|---|
| Published | Government publications | Census of India, National Sample Survey reports, IMD weather reports, State Statistical Abstracts |
| Semi/Quasi-government publications | Urban Development Authorities, Municipal Corporations, Zila Parishads | |
| International publications | UN Demographic Year Book, Statistical Year Book, Human Development Report (UNESCO, UNDP, WHO, FAO) | |
| Private publications | Yearbooks, surveys, research reports by newspapers and private organisations | |
| Newspapers and magazines | Daily newspapers, weekly, fortnightly and monthly magazines | |
| Electronic media | Internet sources, online databases | |
| Unpublished | Government documents | Village-level revenue records maintained by the patwari |
| Quasi-government records | Reports and development plans of Municipal Corporations, District Councils, Civil Services | |
| Private documents | Records of companies, trade unions, political and residents' welfare associations |
The Census of India and the UN Human Development Report appear most often in the board paper, so be able to name three government publications and two international publications in 30 seconds.
Tabulation and Classification of Data
Raw data is first a jumble of numbers. Tabulation arranges it into a structured table of rows and columns; classification groups it into categories for analysis. The notes cover both across four pages, with worked tally marks and frequency tables.
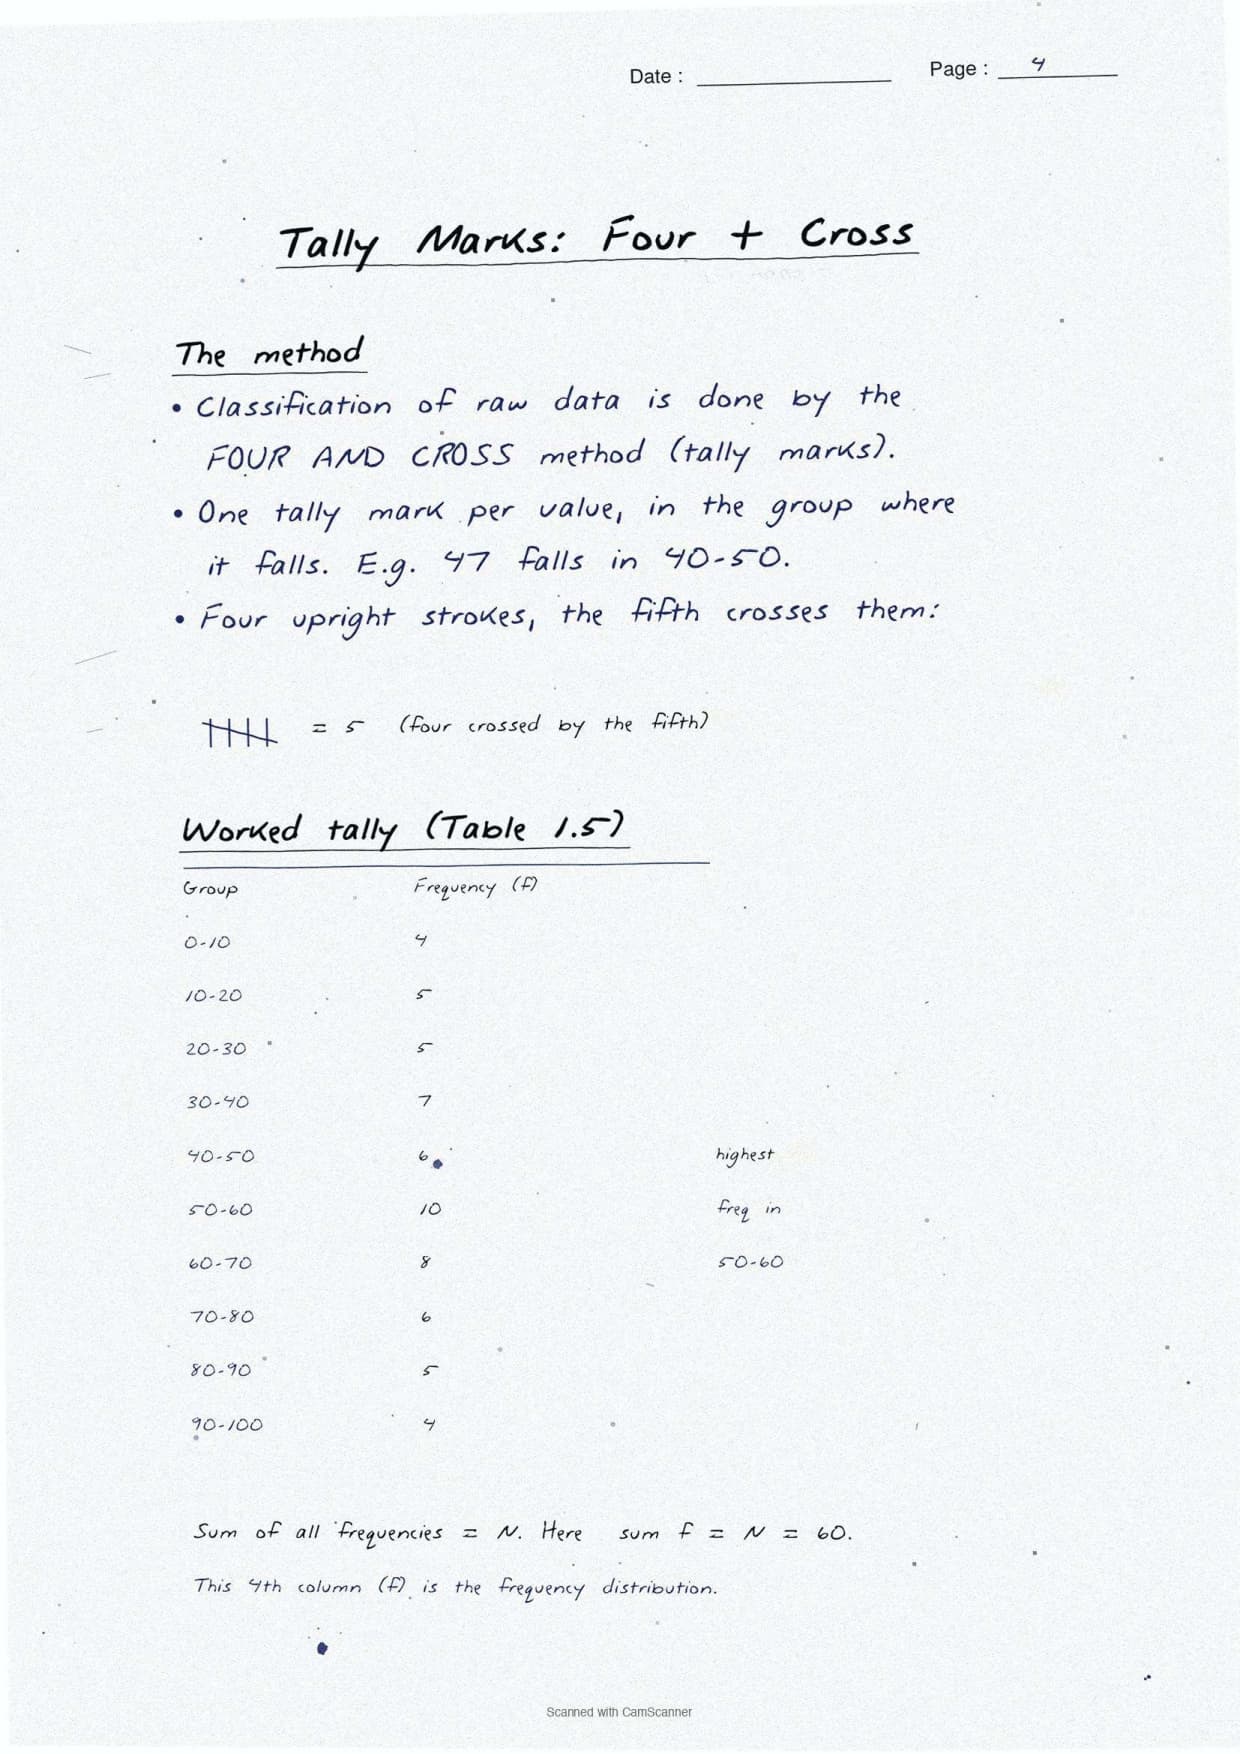
Tally marks and frequency distribution
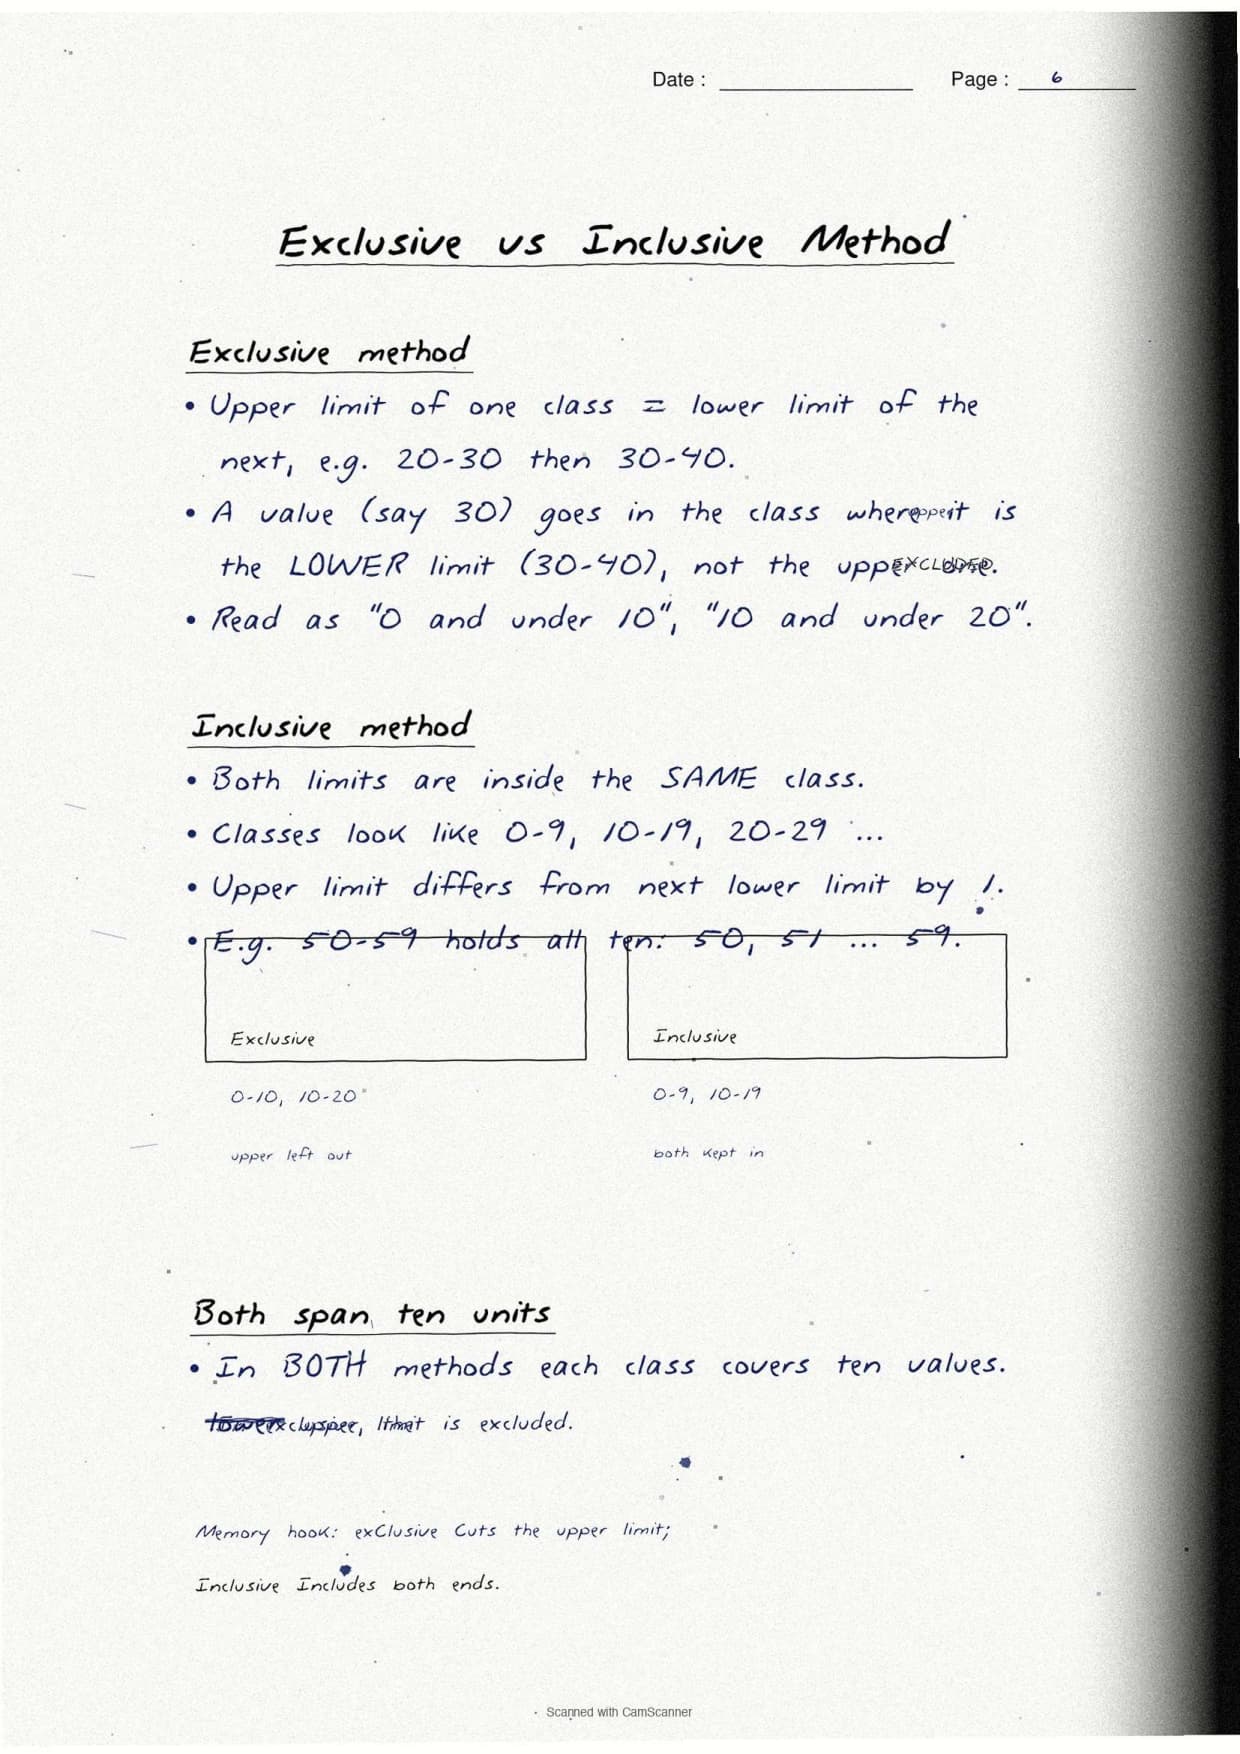
Tally marks group in fours with a crossing fifth stroke. Class intervals use the exclusive method (upper limit excluded) or the inclusive method (both limits included). CBSE favours the exclusive method, and the worked example uses 35 students' unit-test marks.
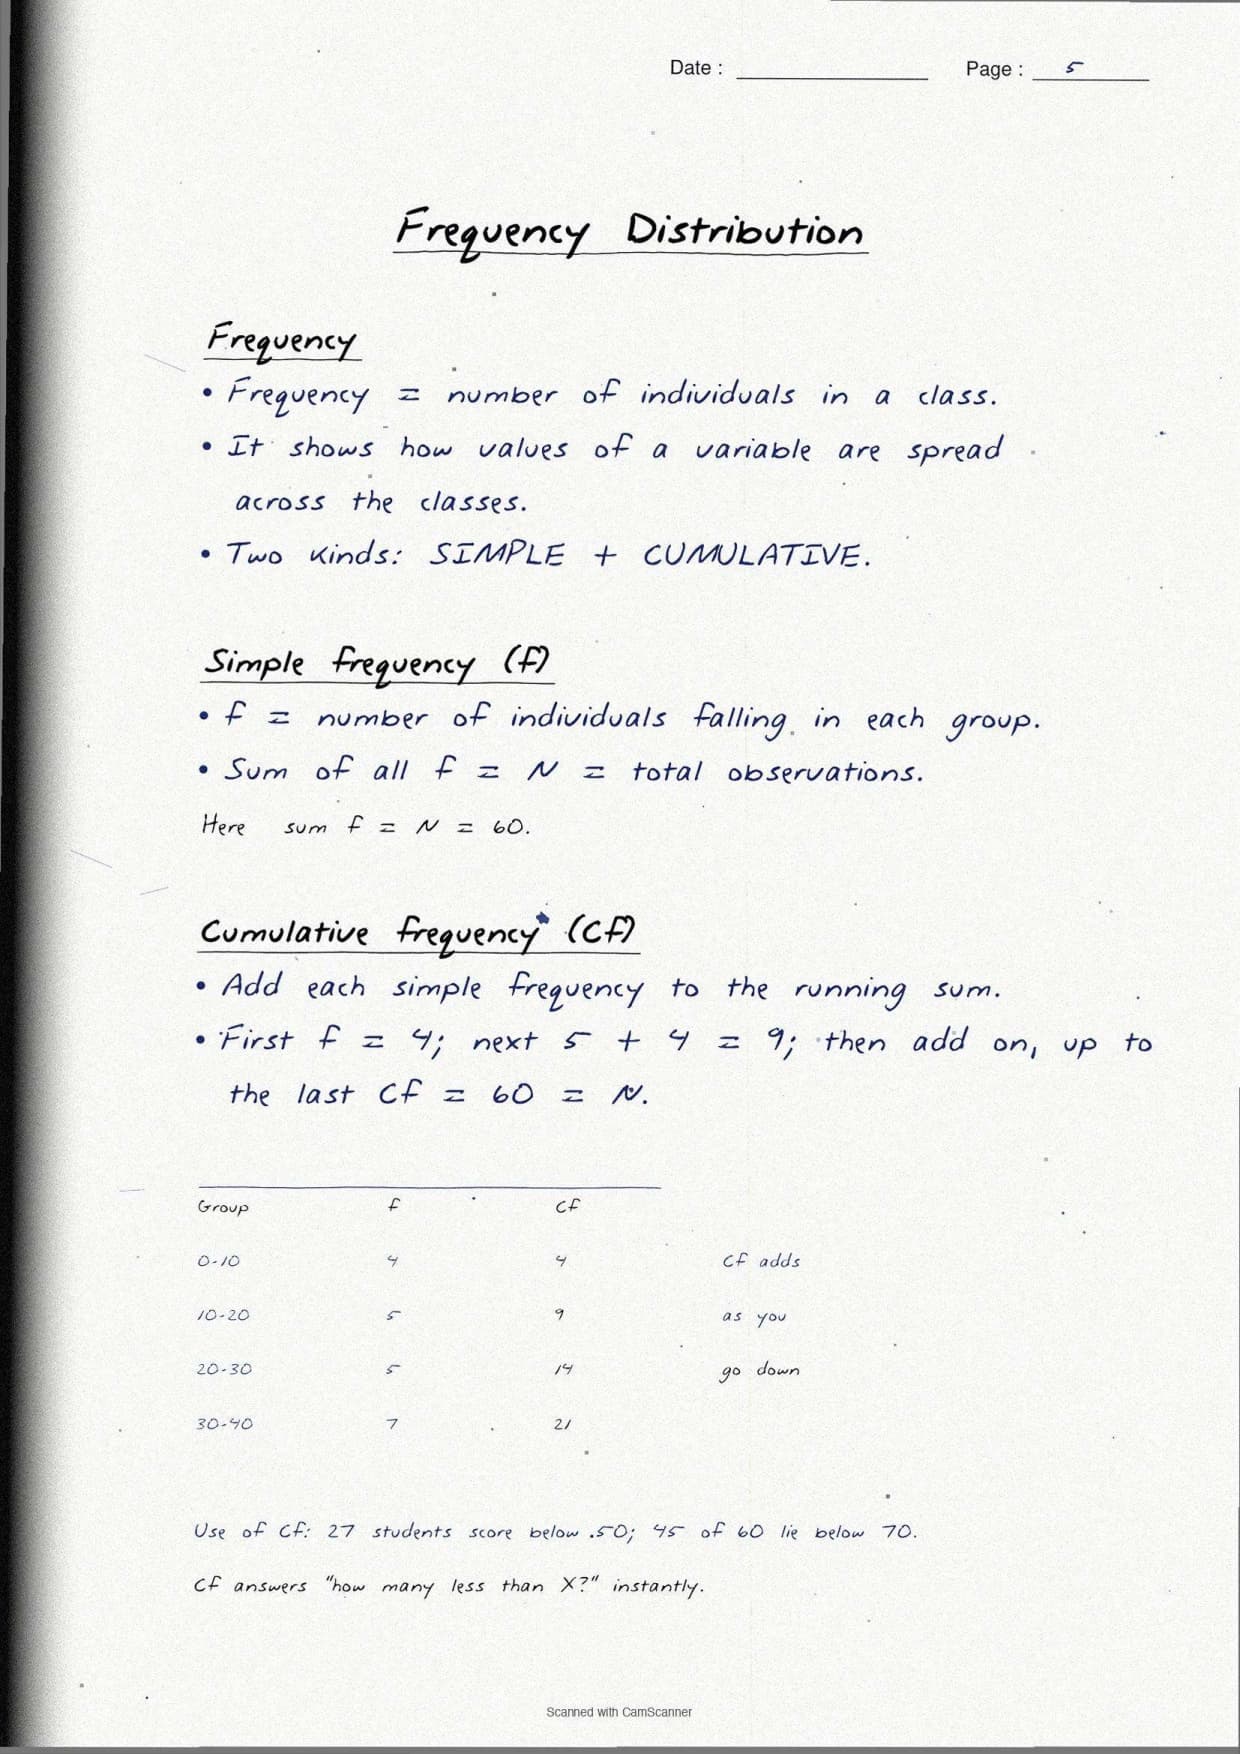
Cumulative frequency and ogive curves
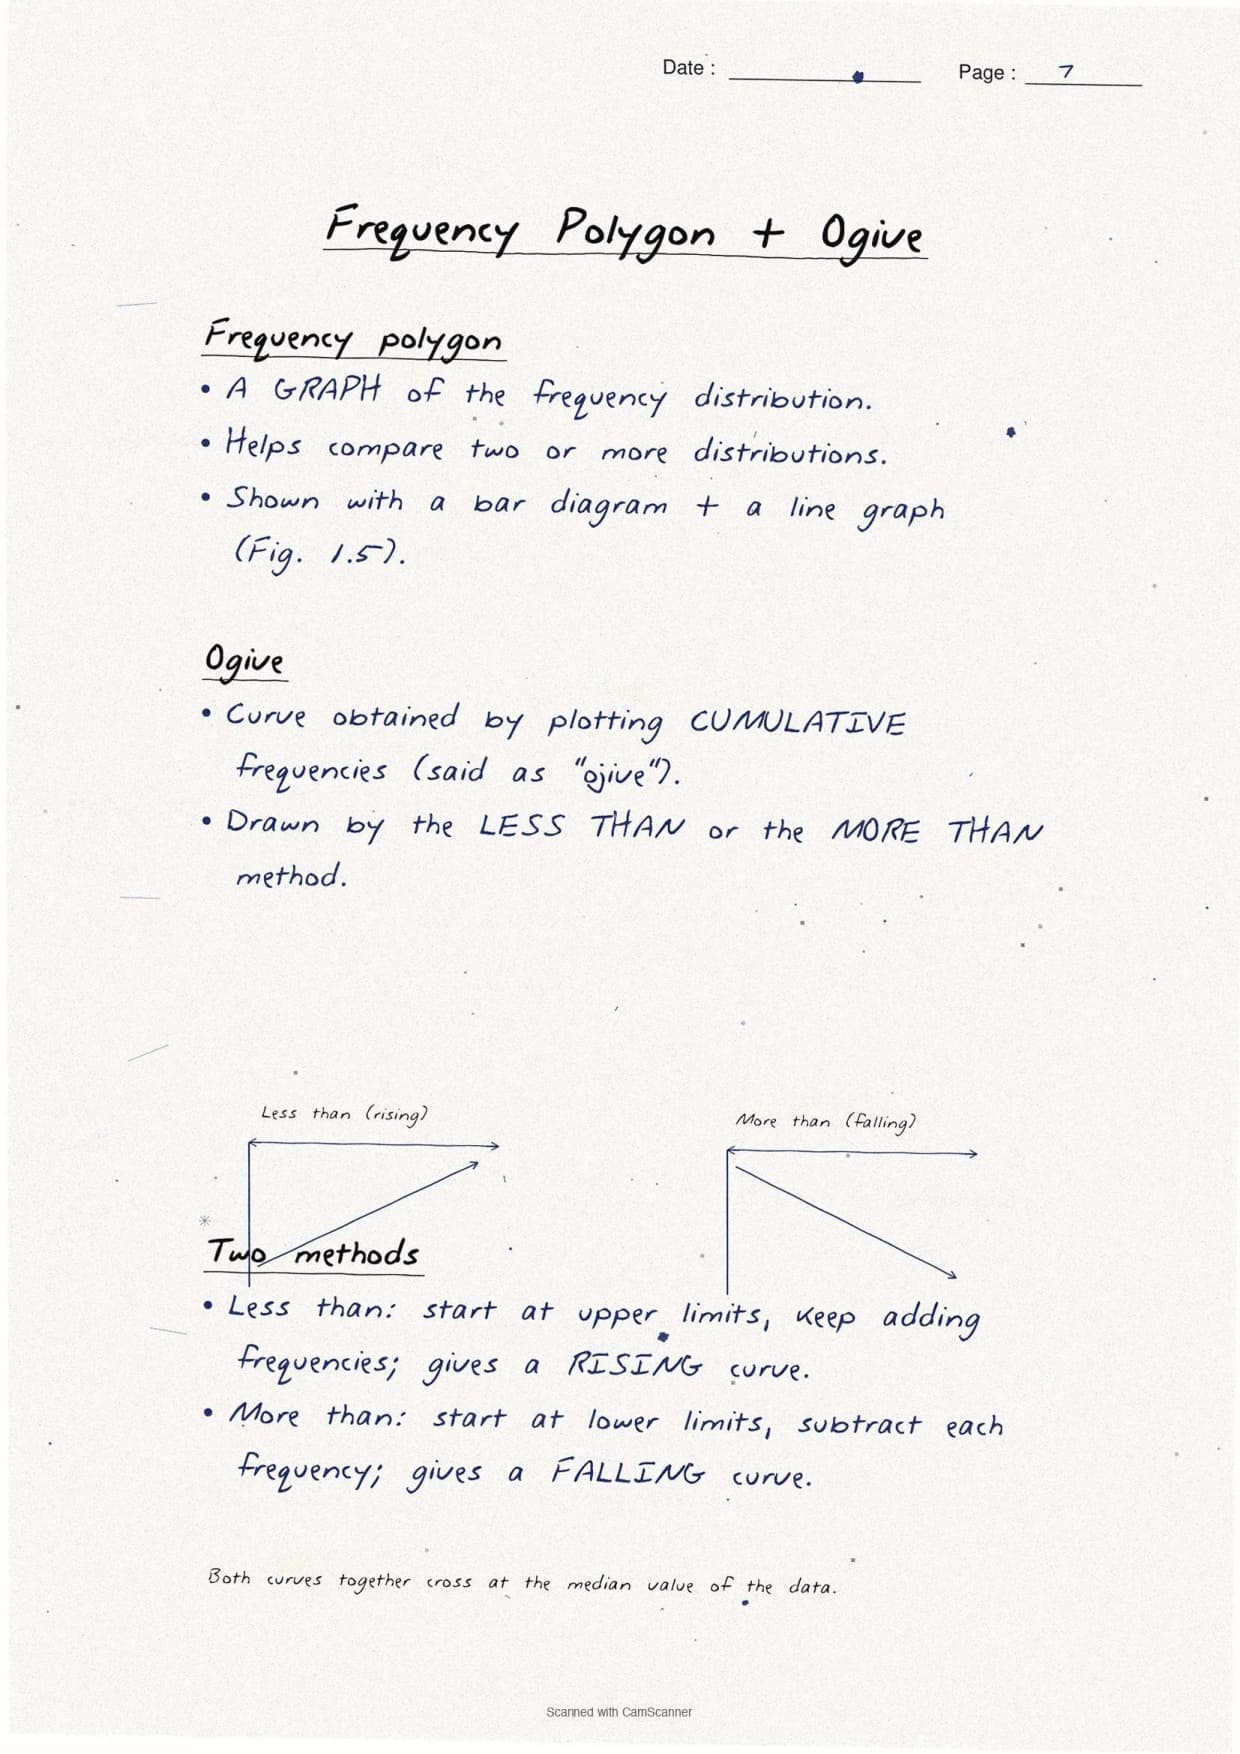
Cumulative frequency is built by adding from the top (less than ogive) or the bottom (more than ogive). An ogive plots cumulative frequency against class limits. The two ogives intersect at the median point, the most-asked fact about ogives.
The five repeat-offender mistakes CBSE examiners flag each year on data sources and compilation class 12 questions, each marked in the margin of the notes in a second ink colour:
- Confusing questionnaire with schedule. Questionnaire is self-filled by the person surveyed; schedule is filled by the enumerator.
- Listing electronic media under unpublished sources. The internet and electronic databases are published secondary sources.
- Forgetting the patwari's revenue records. This is the key example of an unpublished government document.
- Confusing absolute data with index numbers. Absolute data is the original integer; an index number is a ratio to a base-year value.
- Drawing the ogive as a bar chart. An ogive is a smooth cumulative frequency curve, not a histogram.
Each mistake has a one-line memory hook in the margin, the most quoted being "Respondent fills questionnaire; Enumerator fills schedule". The notes also underline "or unpublished" twice on the definition page, since the NCERT definition of secondary data includes both published and unpublished records.
Previous Year Question Trends
The CBSE Class 12 Geography board paper has carried a stable 5 to 8 marks from this chapter over the last five years, split across a definition question, a distinction question and a short-answer question on sources.
| Year | Question asked | Marks | Notes page to revise |
|---|---|---|---|
| 2025 | Differentiate between questionnaire and schedule + name three government publications | 3 + 3 | Page 6 + Page 11 |
| 2024 | Define primary sources with two examples + what is an ogive? | 2 + 2 | Page 1 + Page 19 |
| 2023 | State any three precautions for conducting an interview | 3 | Page 7 |
| 2022 | What is data? Distinguish between data and information. | 1 + 2 | Page 1 |
| 2021 | List any five secondary sources of data + define statistical table | 3 + 2 | Page 11 + Page 13 |
The questionnaire-vs-schedule distinction and the list of secondary sources are the most frequently tested concepts, so revise those pages together.
Other Resources for Class 12 Geography Chapter 1 (PWG)
Pair these handwritten notes with the matching NCERT Solutions, typed Notes and the official NCERT Book chapter.
| Resource | What it covers | Open |
|---|---|---|
| Handwritten Notes | Topper's handwritten revision pages for last-mile board exam prep. | You are here |
| NCERT Solutions | Step-by-step answers to all exercise questions with concept explanations. | Class 12 Geography Chapter 1 NCERT Solutions |
| Notes | Concept-first typed revision notes with definitions, source trees and common mistakes. | Class 12 Geography Chapter 1 Notes |
| NCERT Book PDF | Official NCERT Practical Work in Geography Chapter 1 textbook in PDF form. | Class 12 Geography Chapter 1 NCERT Book PDF |
| Subject Hub | All chapters of Class 12 Geography with every resource in one place. | Class 12 Geography Subject Hub |
All Chapters Handwritten Notes for Class 12 Practical Work in Geography
Related Links: Use the table below to open the handwritten notes for the other chapters of Class 12 Practical Work in Geography.
| Chapter | Topic | Handwritten Notes link |
|---|---|---|
| Chapter 1 | Data: Its Source and Compilation | You are here |
| Chapter 2 | Data Processing | Class 12 Geography Data Processing Handwritten Notes |
| Chapter 3 | Graphical Representation of Data | Class 12 Geography Graphical Representation of Data Handwritten Notes |
| Chapter 4 | Spatial Information Technology | Class 12 Geography Spatial Information Technology Handwritten Notes |
Data Its Source and Compilation Class 12 Handwritten Notes FAQs
Ques. What are these data its source and compilation class 12 handwritten notes meant to be used for?
Ans. The data its source and compilation class 12 handwritten notes are a topper's handwritten revision file that compresses the full NCERT Chapter 1 of Class 12 Practical Work in Geography into 22 pages of classification trees, method comparison boxes and margin-callout common mistakes. Students typically use the file for last-mile revision in the 24 hours before the board paper, paired with the typed Notes PDF for concept building and the NCERT Solutions PDF for written practice.
Ques. How are handwritten notes different from the typed notes for data sources class 12 geography?
Ans. The typed data sources class 12 notes carry deeper prose around each source type (definitions, examples, common-mistake explanations) and run 6 to 8 pages long. The handwritten notes compress that prose down to classification trees and distinction boxes alone, run 22 pages for the full visual detail, and lean on visual recall (ruler-drawn boxes, arrow-tagged trees, colour corrections) rather than typed explanations. The two files are designed to be used together. Read the typed Notes first, then move to the handwritten file for the second and third revision passes.
Ques. What is the difference between questionnaire and schedule in Class 12 Geography?
Ans. The key difference is who fills in the form. In a questionnaire, students or informants fill in the answers themselves. In a schedule, a trained enumerator visits the person, asks the questions aloud and writes the answers. The main advantage of schedule over questionnaire is that it can reach both literate and illiterate people. Questionnaires are limited to literate people only. This distinction is tested in the CBSE Class 12 Geography board paper in almost every year, and the handwritten notes draw a two-column comparison box on Page 6 to make the difference impossible to miss.
Ques. What are the primary sources of data in Class 12 Geography?
Ans. Primary sources of data in Class 12 Geography are those collected for the first time by the researcher or their team directly from the field. The NCERT chapter identifies four methods: personal observation (direct field survey), interview (dialogue with people in the area), questionnaire or schedule (structured question forms), and other methods (using soil kits, water quality kits and transducers to measure soil, water and crop properties). These are called primary because the researcher is the original collector of the data, unlike secondary sources where someone else collected it earlier.
Ques. What are secondary sources of data in Class 12 Geography?
Ans. Secondary sources of data are those collected from published or unpublished records that were created by someone other than the current researcher. Published secondary sources include government publications (Census of India, National Sample Survey, IMD reports), quasi-government publications (Municipal Corporation reports, Zila Parishad plans), international publications (UN Demographic Year Book, Human Development Report), private publications, newspapers and magazines, and electronic media (internet). Unpublished secondary sources include government documents (patwari revenue records), quasi-government records and private documents (company and trade union records).
Ques. What is an ogive in Class 12 Geography Practical Work?
Ans. An ogive is a method of data presentation in which cumulative frequency is plotted against class limits to produce a smooth S-shaped curve. There are two types: the less than ogive (cumulative frequency plotted against upper class limits, reading upward) and the more than ogive (cumulative frequency plotted against lower class limits, reading downward). When both ogives are drawn on the same graph, they intersect at a point whose x-coordinate gives the median of the distribution. The handwritten notes draw both types of ogive on Page 19, with the intersection point marked and labelled "Median = x at intersection".
Ques. Are these data sources and compilation class 12 handwritten notes enough for the CBSE board exam?
Ans. The handwritten notes are sufficient for the definition and classification component (roughly 5 to 6 marks of the 5 to 8 marks the chapter typically carries), but the written practice for short-answer questions in this file is limited to the concept boxes themselves. Students aiming for 90-plus in CBSE Class 12 Geography should pair the handwritten file with the matching NCERT Solutions PDF (all exercise questions worked end-to-end) and one set of previous year board paper questions for additional practice. All resources are linked in the cross-resource table on this page.
Ques. How long does it take to revise these data sources class 12 notes?
Ans. The full handwritten notes file is designed for an 18-minute first revision pass, a 12-minute targeted pass and a 5-minute final pass right before the exam. Students who already have the chapter under their belt finish the full file in under 18 minutes. The primary vs secondary comparison page and the questionnaire vs schedule distinction box together take 6 to 8 minutes to revise and cover roughly 5 to 6 of the 5 to 8 marks the chapter typically carries in the CBSE Class 12 Geography board paper.
Ques. Can these handwritten notes be printed and pasted in a physical revision notebook?
Ans. Yes, and that is the recommended use pattern. The PDF is rendered at 150 DPI and sized for A4 printing, with each page sitting cleanly inside a standard ruled notebook page. Toppers in the 2026 Class 12 Geography student poll reported that printing the pages and pasting them inside the physical revision notebook added 2 marks on average on the data sources question, because the pen-on-paper layout matches the muscle memory of writing the answer in the answer script during the exam.
Ques. Is the Class 12 Geography syllabus for data sources and compilation changing in 2026-27?
Ans. No major changes in 2026-27. The Practical Work in Geography Part II Chapter 1 textbook structure is unchanged for the current cycle, and the CBSE marking scheme continues to reward definition-plus-example in short-answer questions and classification trees in long-answer questions. These data its source and compilation class 12 handwritten notes for the 2026-27 cycle are aligned to the unchanged textbook and the latest CBSE sample paper released for the 2026 boards.
Ques. What is meant by data in Class 12 Geography?
Ans. Data in Class 12 Geography are numbers that represent measurements from the real world. A single measurement is called a datum. For example, 20 centimetres of continuous rain in Barmer, or the Delhi to Mumbai train distance of 1,385 kilometres, are both data. Data becomes information when it is algorithmically derived, logically deduced or statistically calculated to give a meaningful answer to a query. Raw data is a jumble of numbers without meaningful conclusions; processed data is information. The NCERT chapter illustrates the difference between data and information using the famous statistical fallacy story of the man who calculated an average river depth but still lost his child because the maximum depth was far higher than the average.
Ques. What is the difference between tabulation and classification of data?
Ans. Tabulation is the arrangement of data in a systematic table of rows and columns, making it easy to locate and compare information. Classification is the process of grouping data into categories based on shared characteristics, which is done before tabulation. In practice, classification comes first (for example, grouping students by marks range into class intervals), then tabulation (arranging those groups with their frequencies in a statistical table). The handwritten notes draw both steps on Pages 13 to 15, with the tally mark method used to show how classification builds a frequency table and how the table is then laid out in formal tabular form.



Comments