




These Class 12 Geography Chapter 2 Data Processing handwritten notes are a topper's genuine handwritten revision pages for quick last-mile revision, in line with the 2026-27 CBSE syllabus. The pages cover all three measures of central tendency (mean, median, mode), the direct and indirect methods of computation, and the normal distribution curve with skew patterns. Use the PDF in the 24 hours before the board paper.
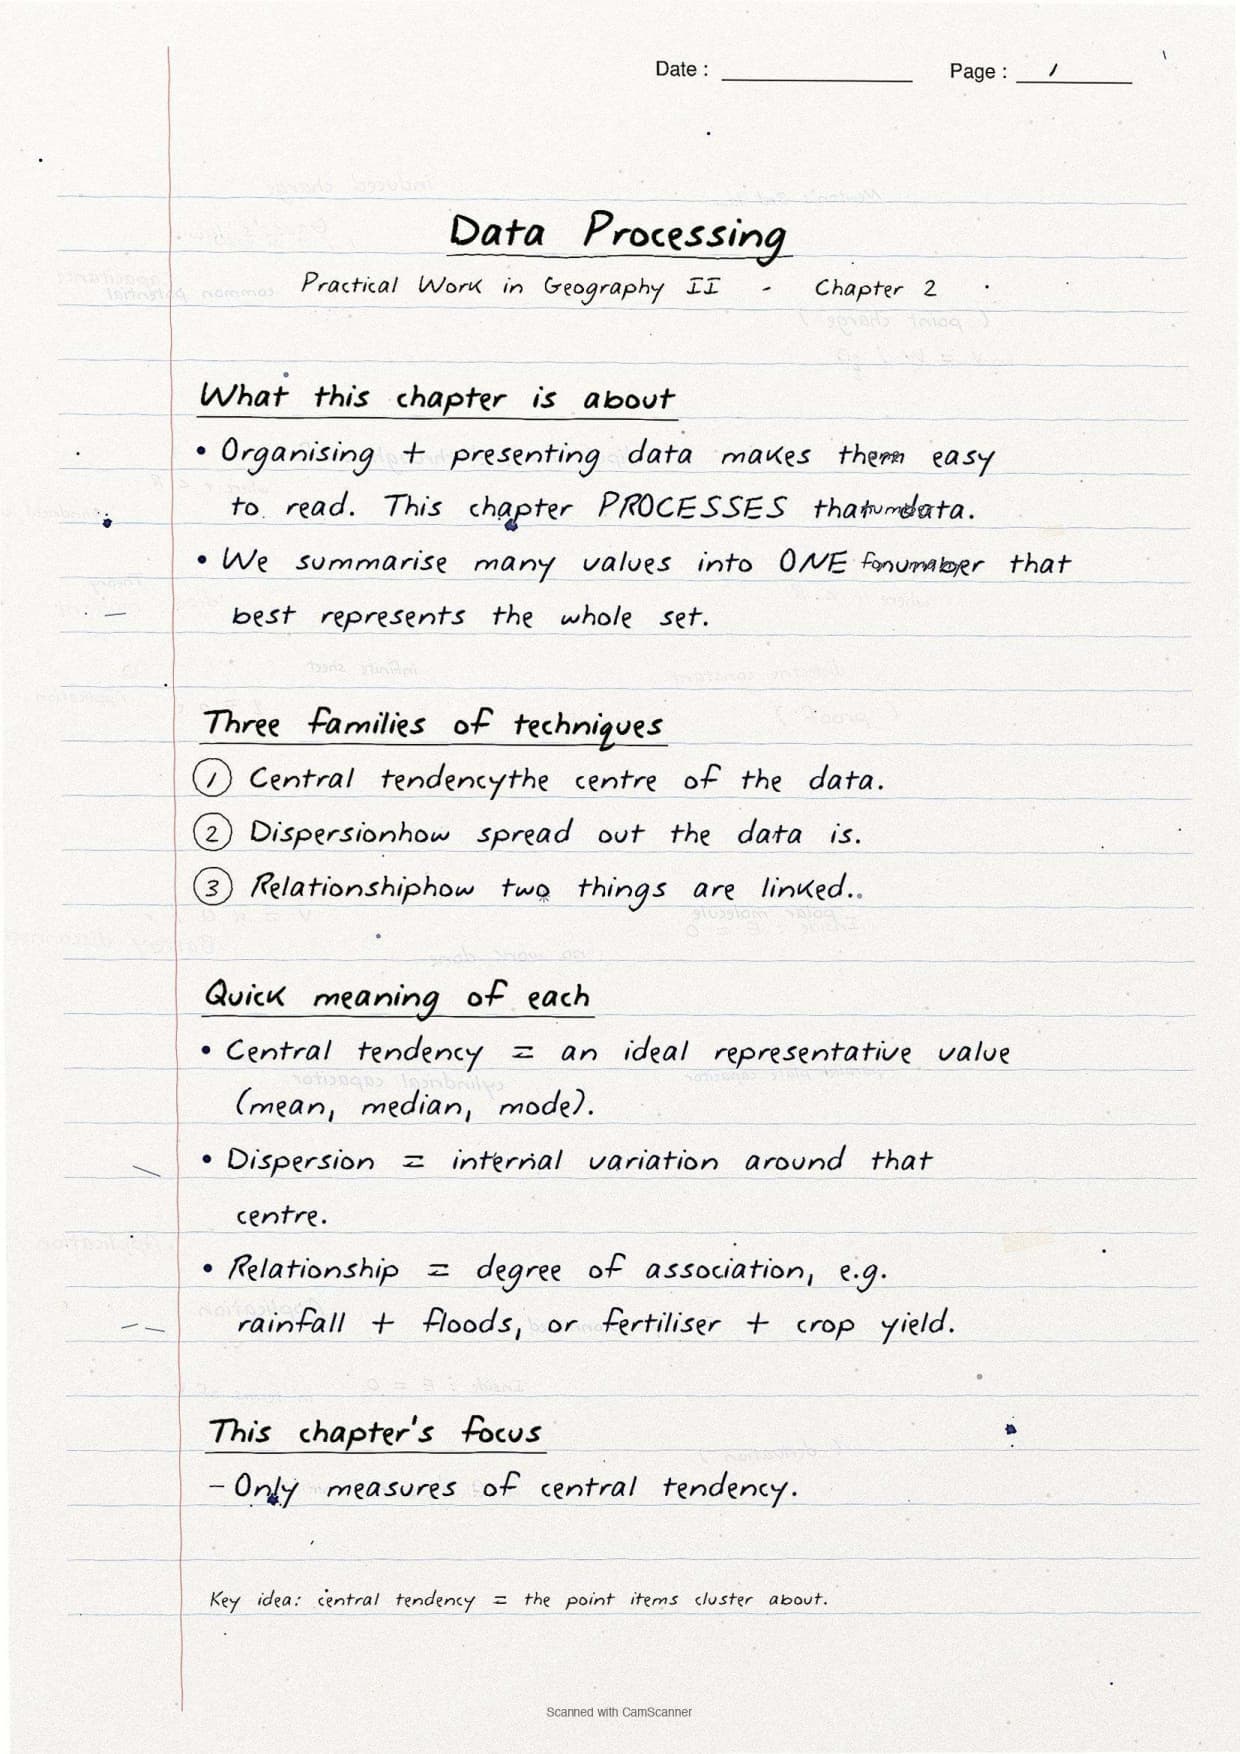
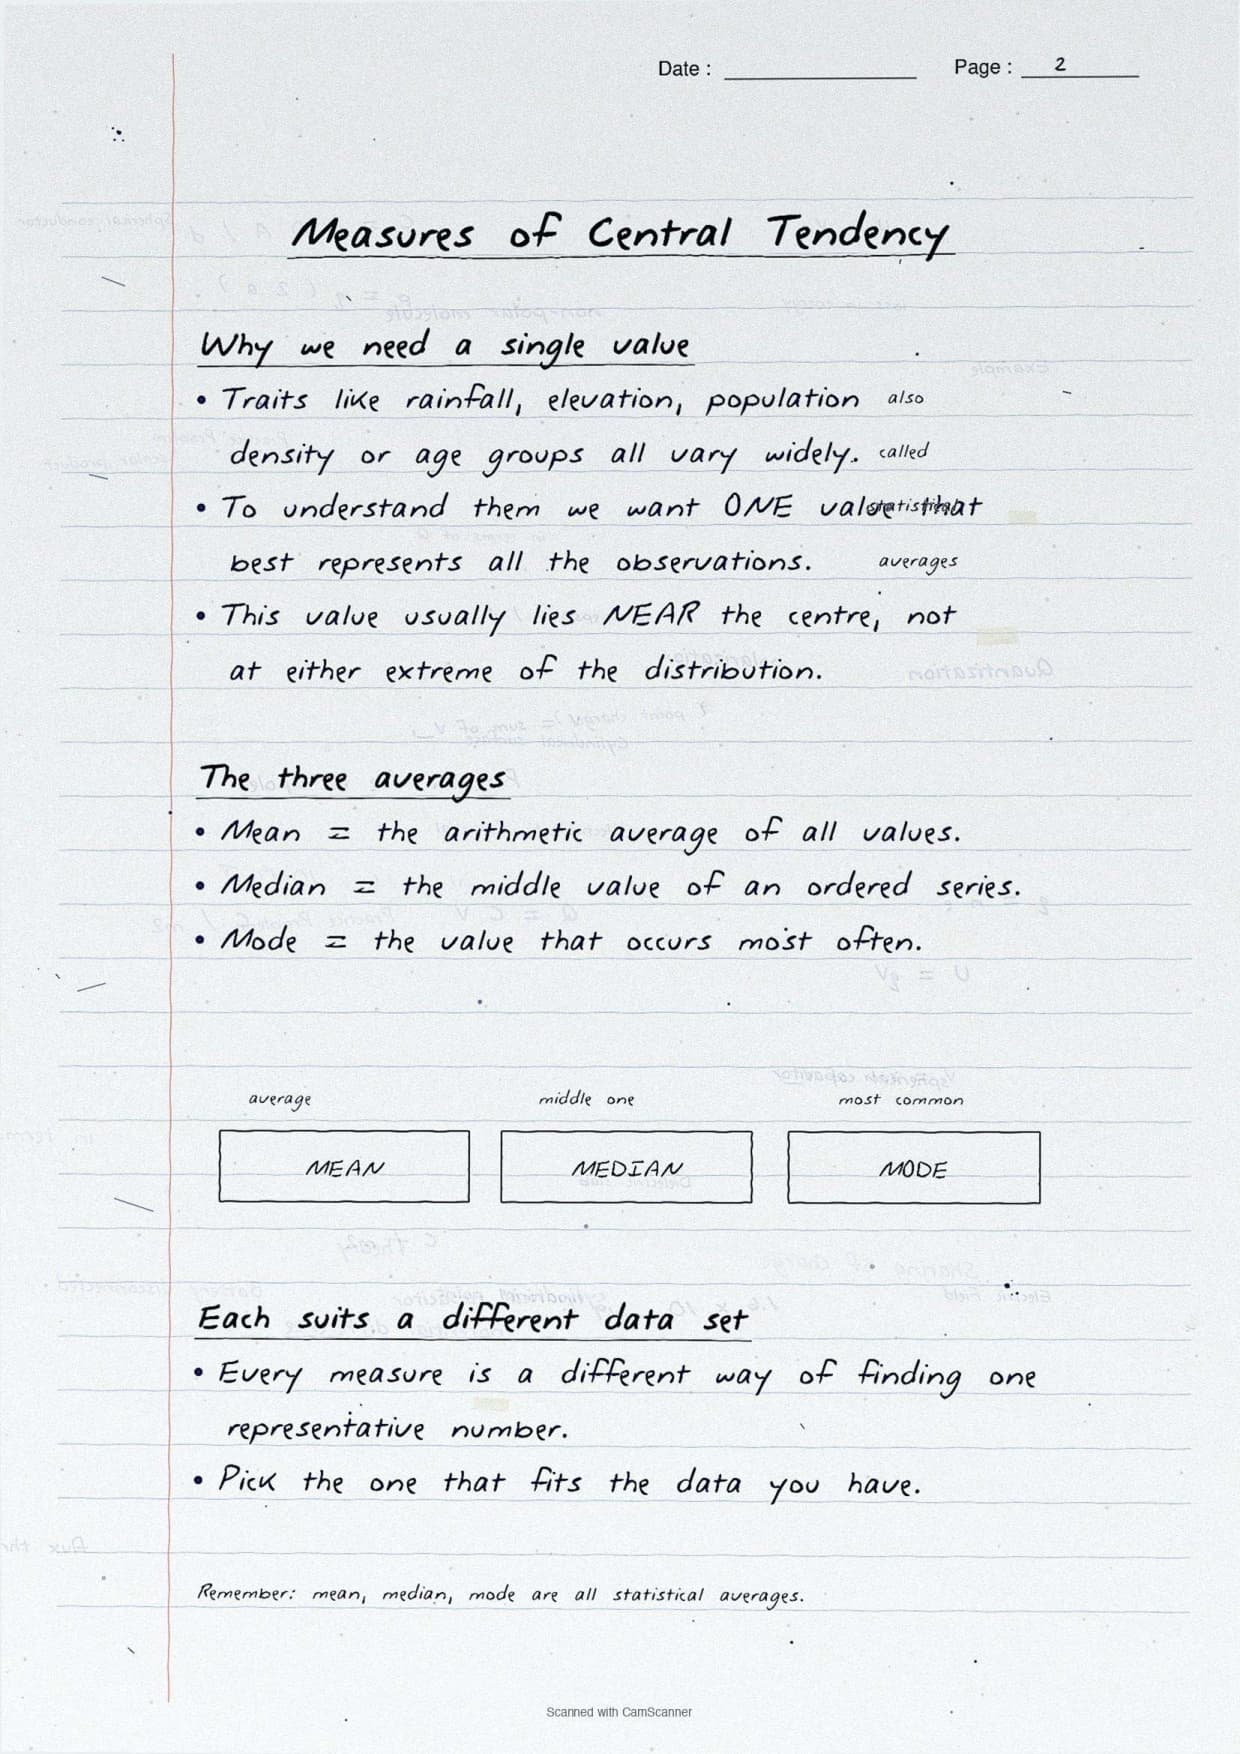
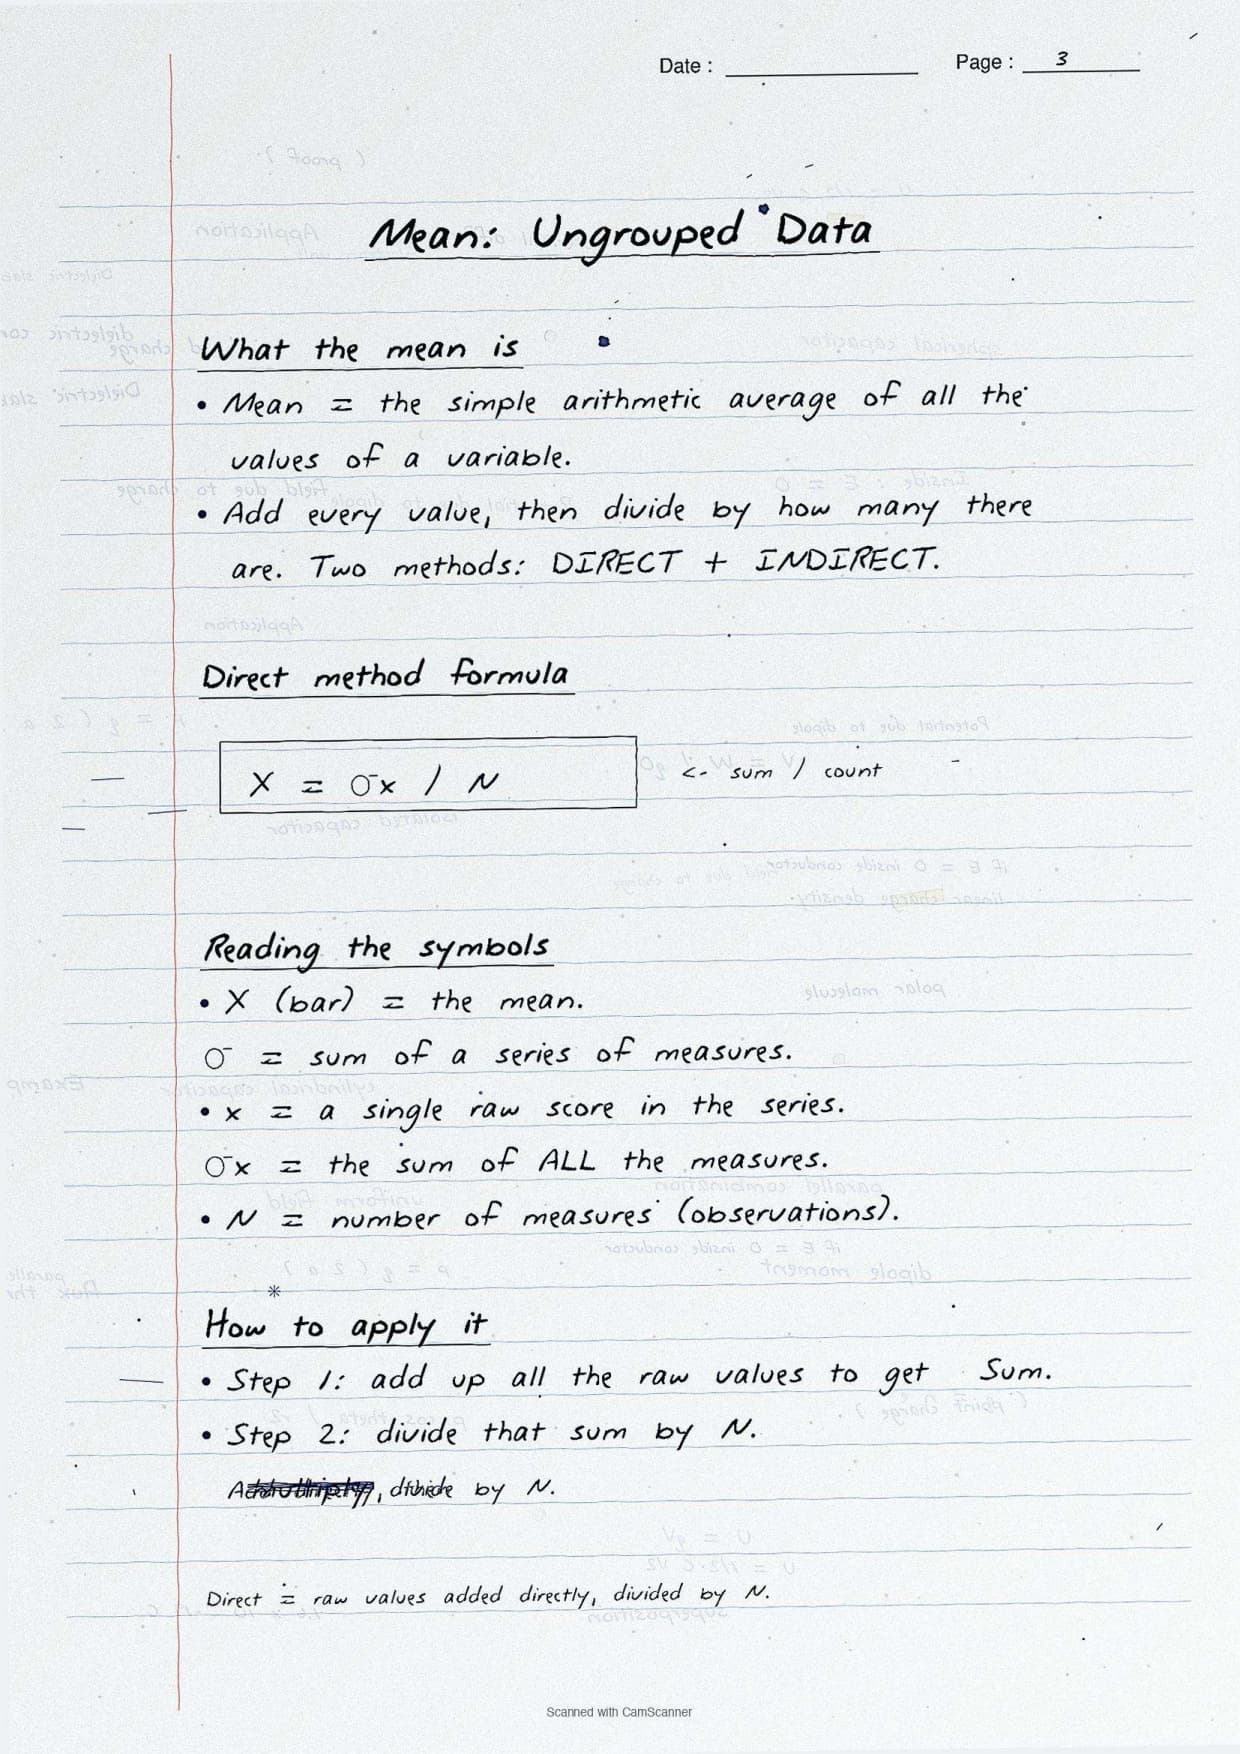
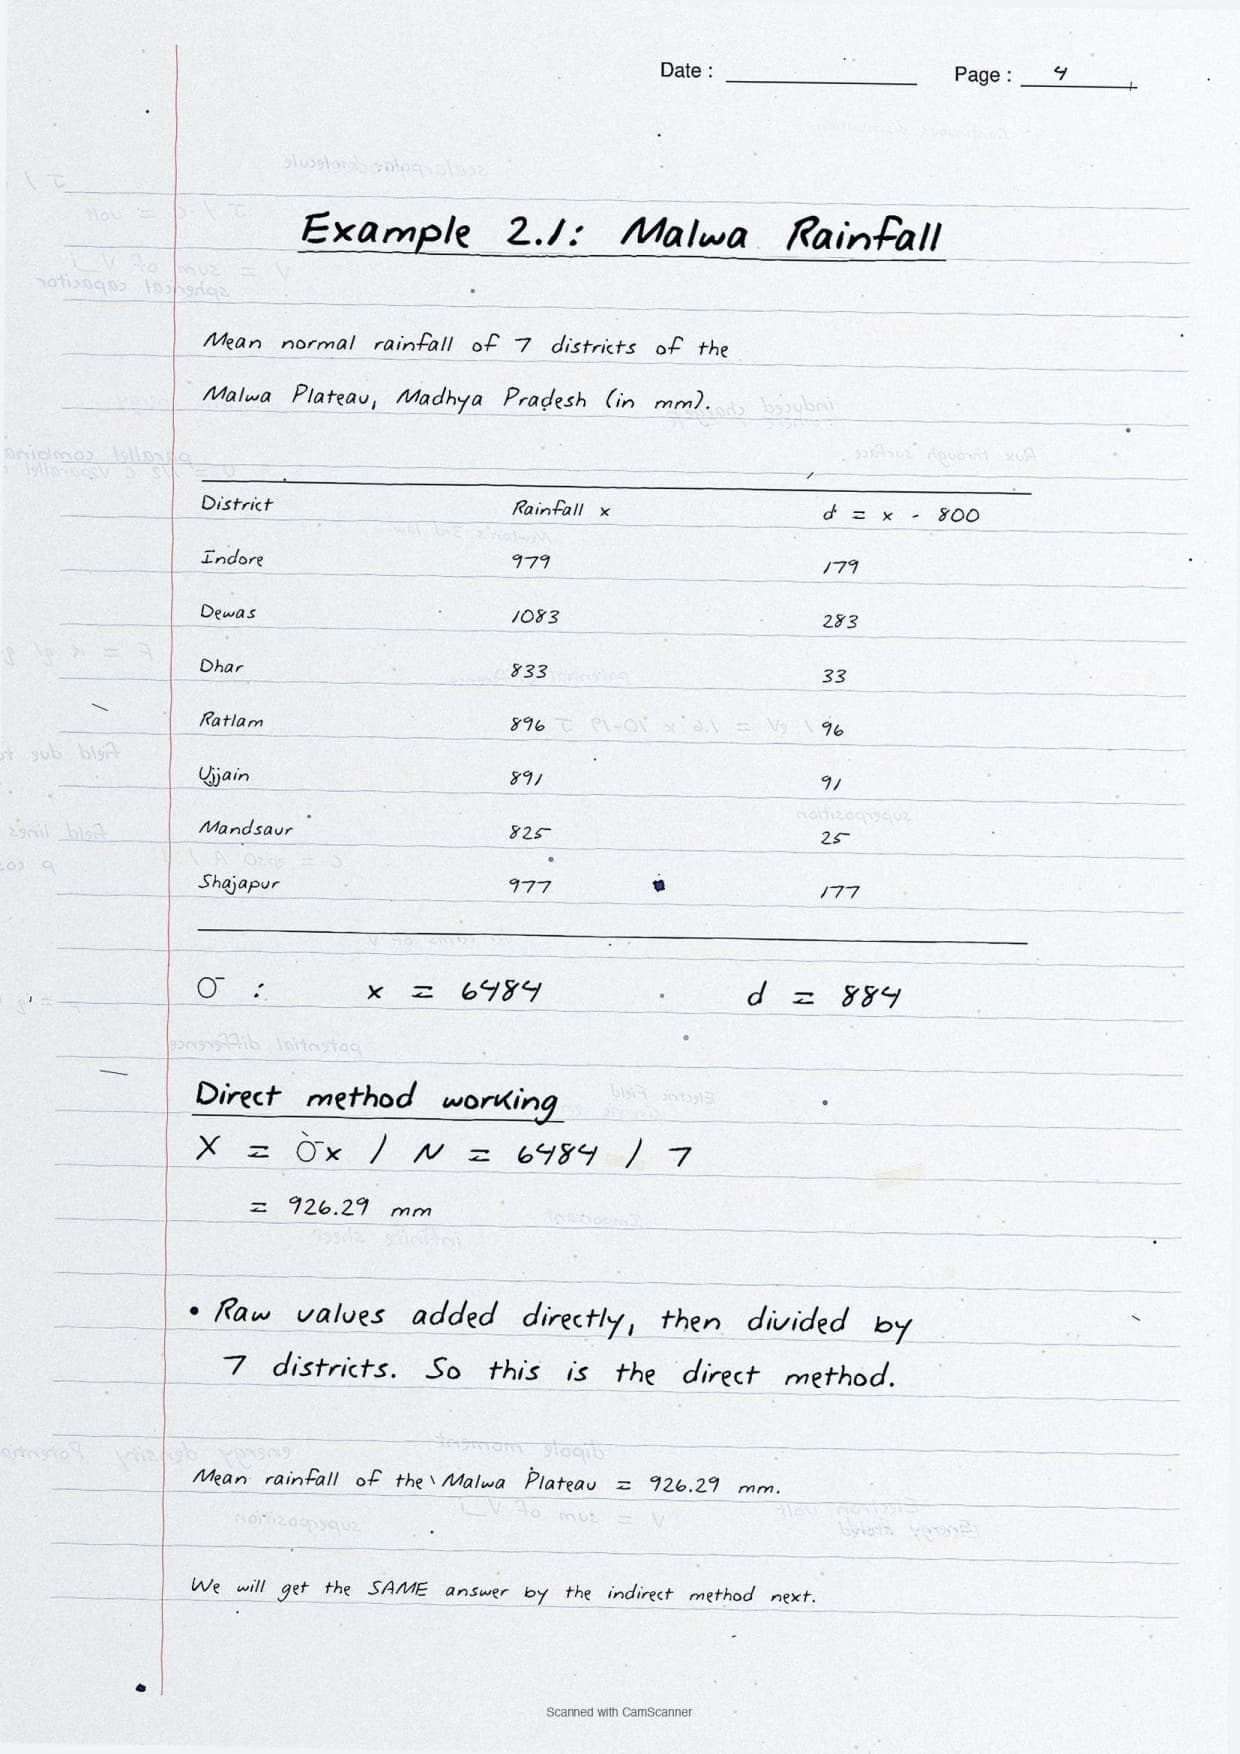
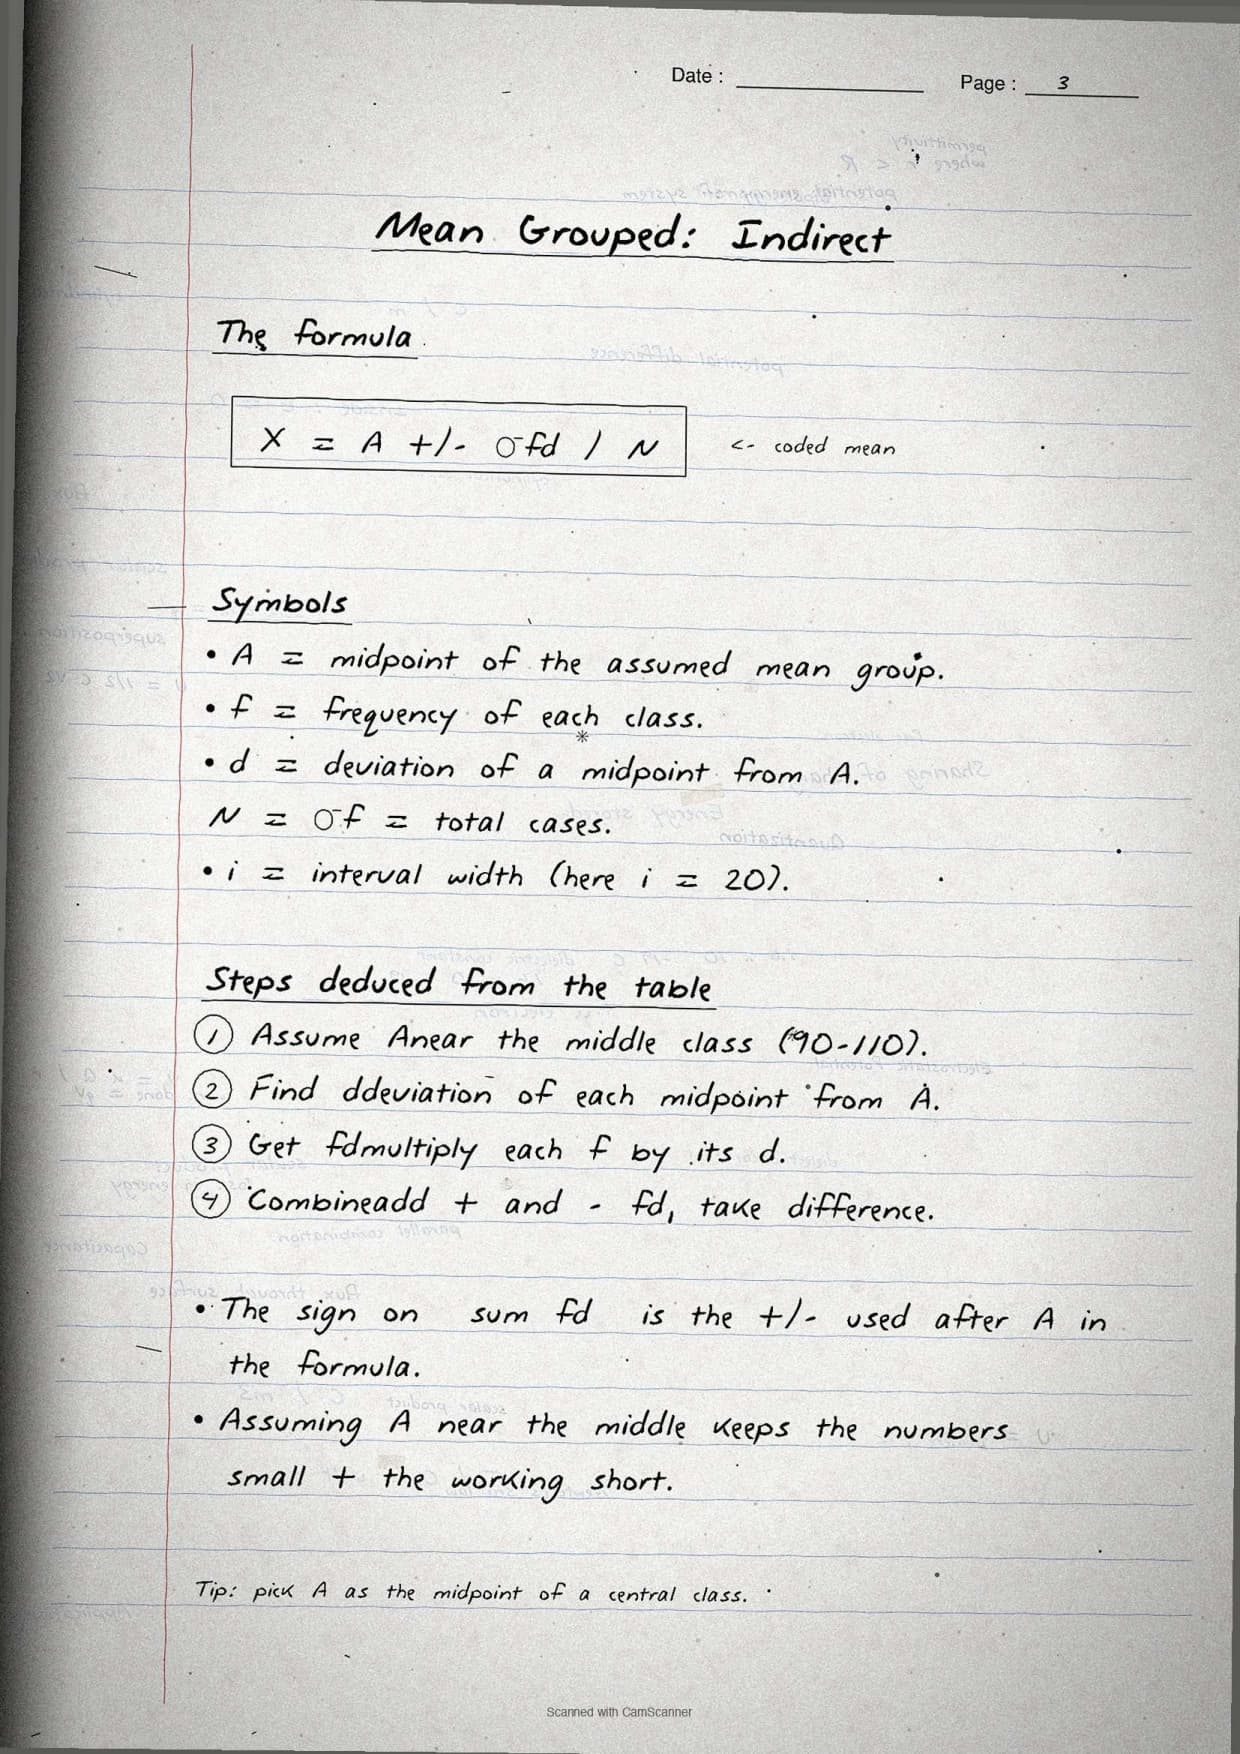
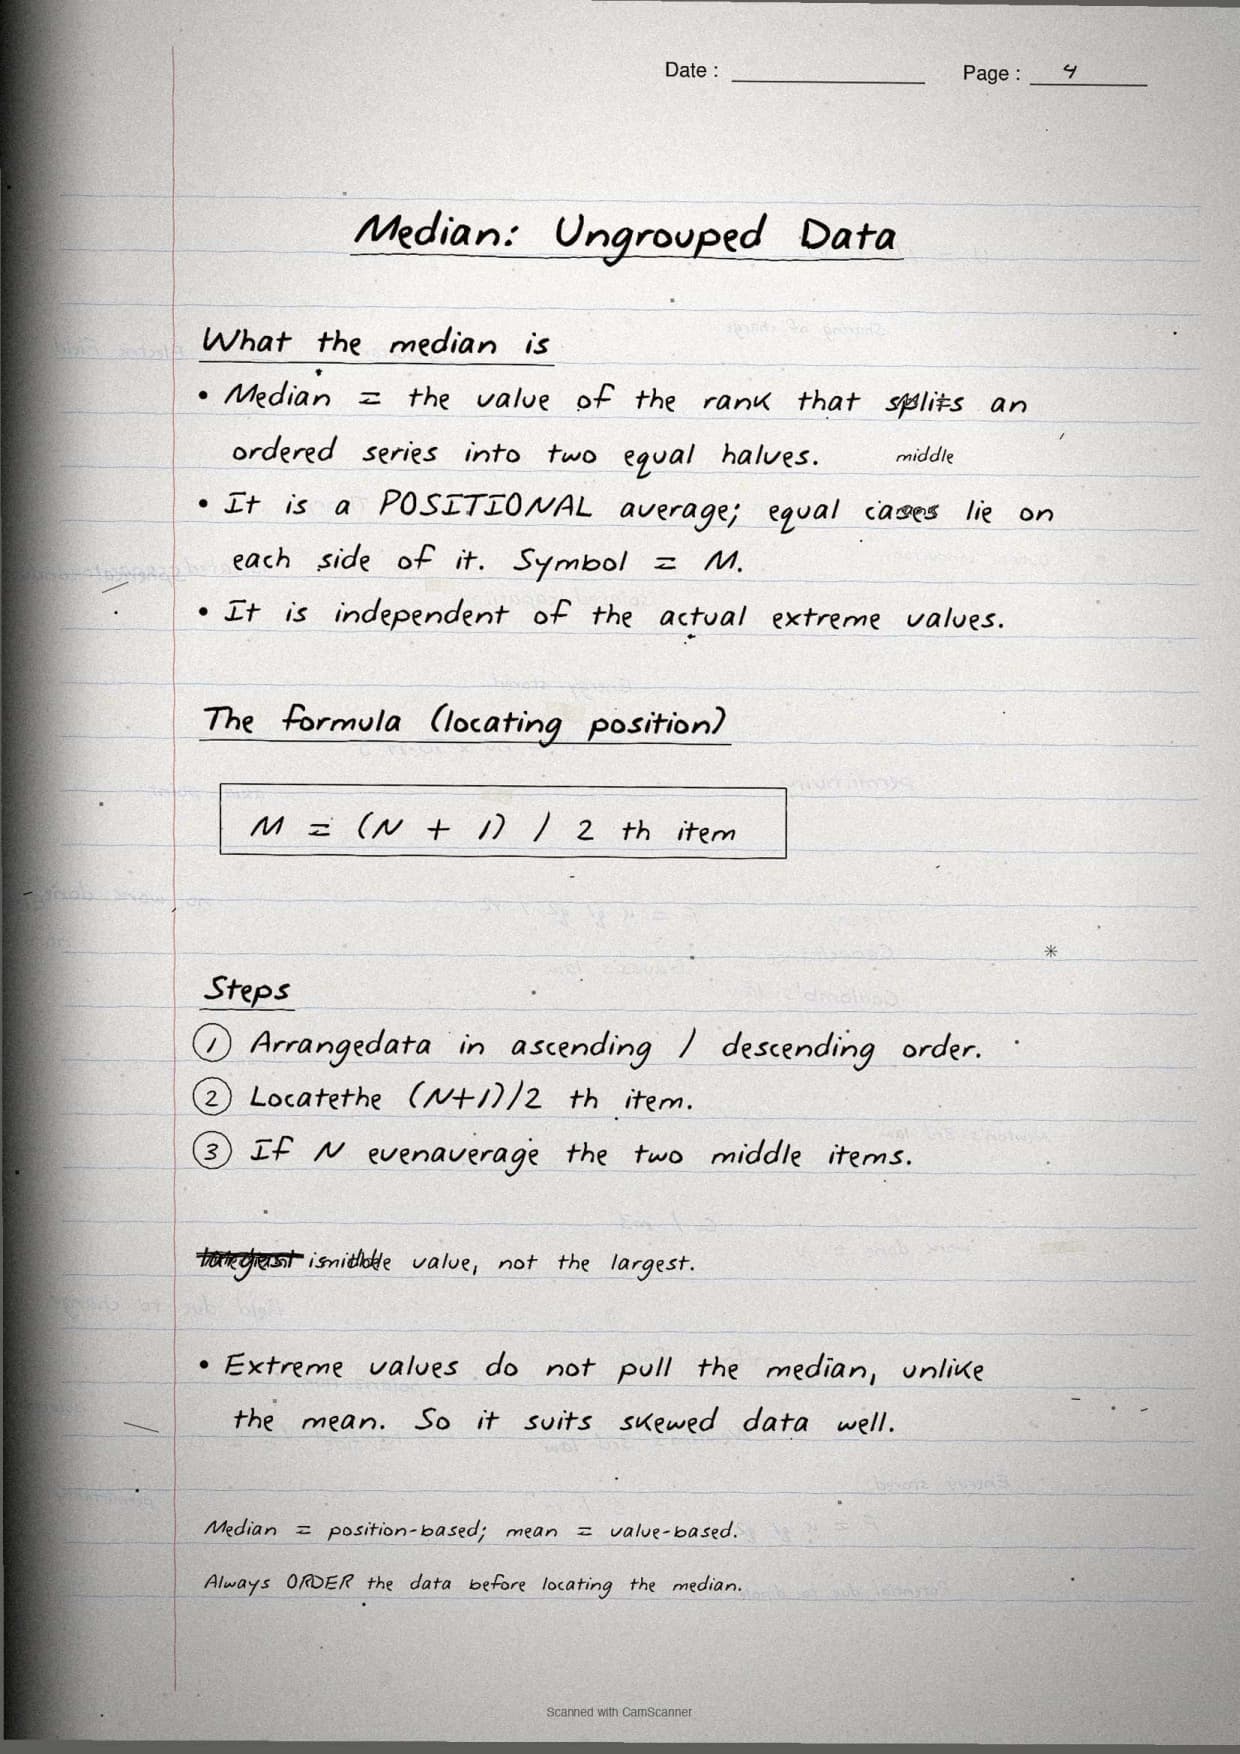
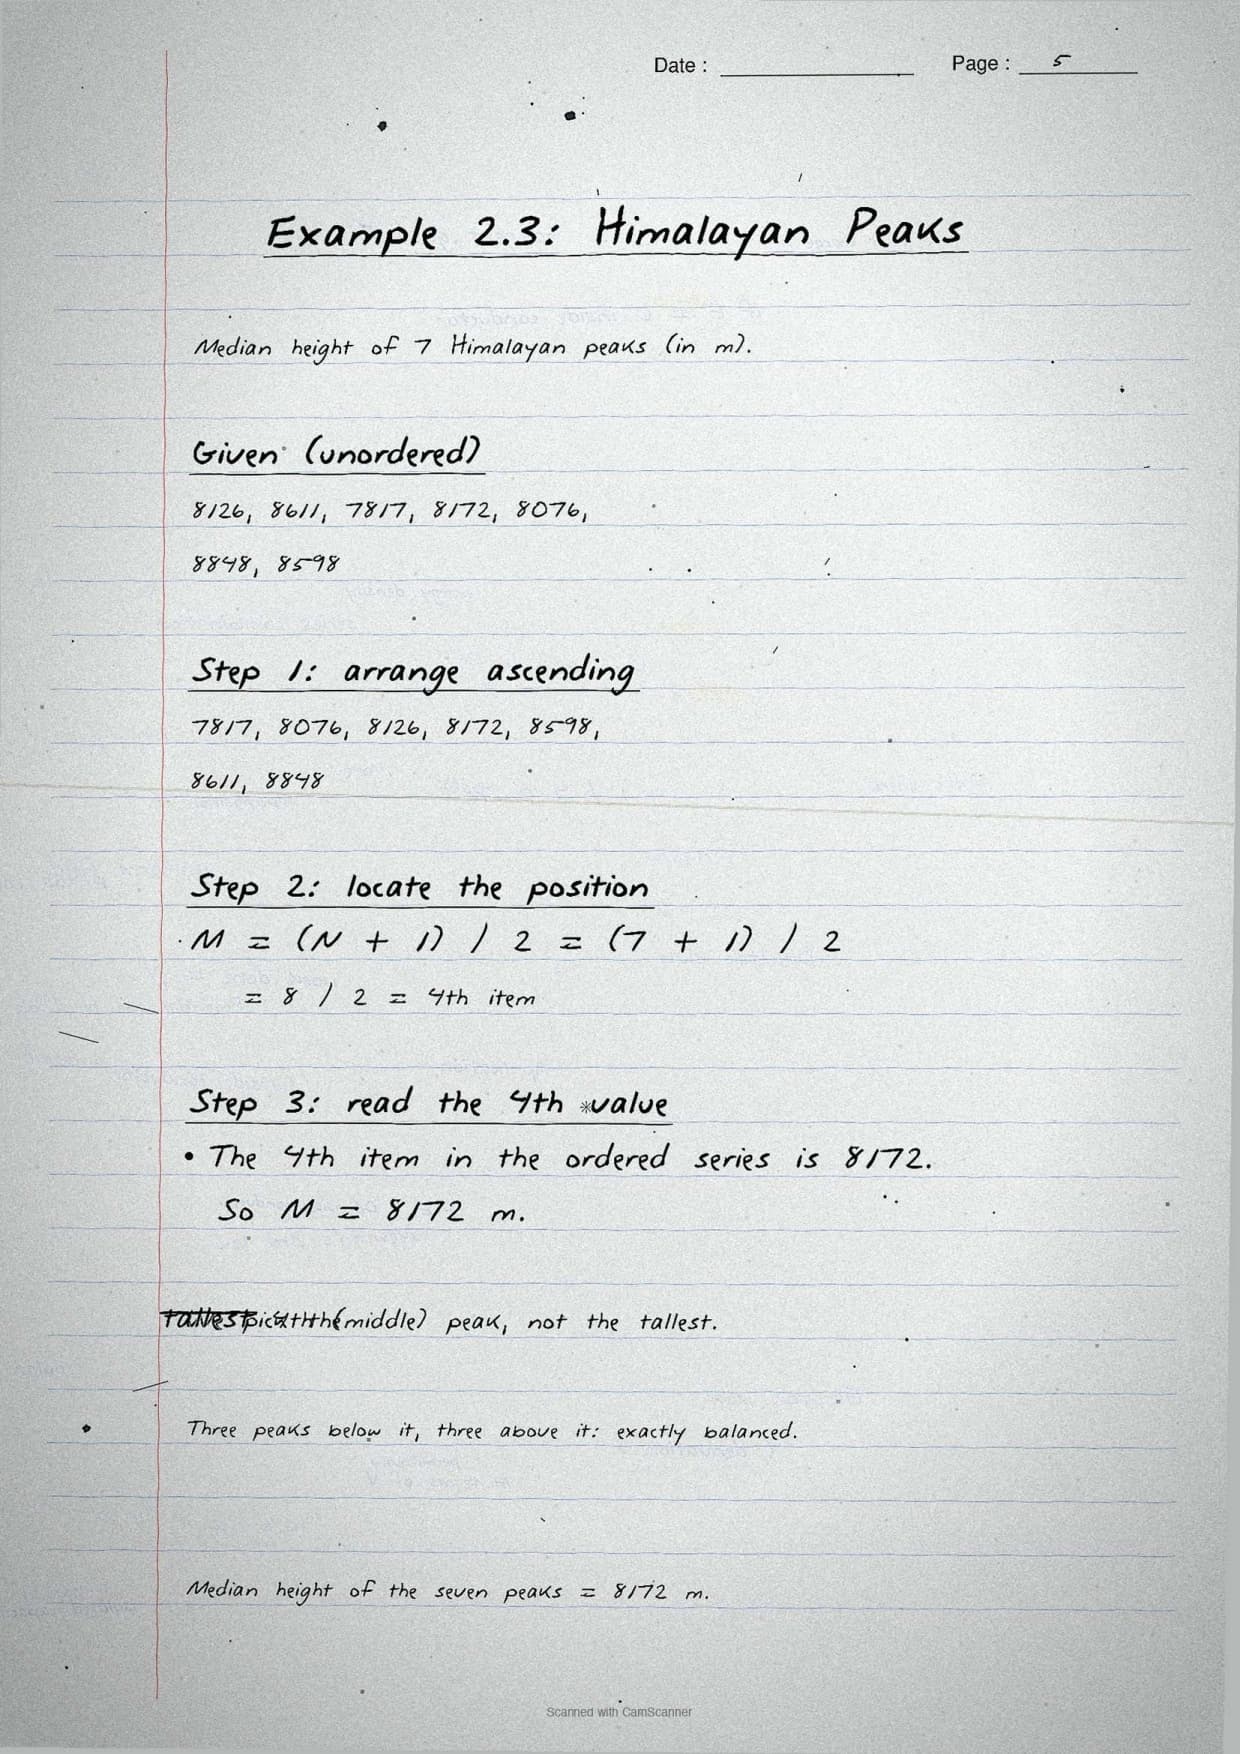
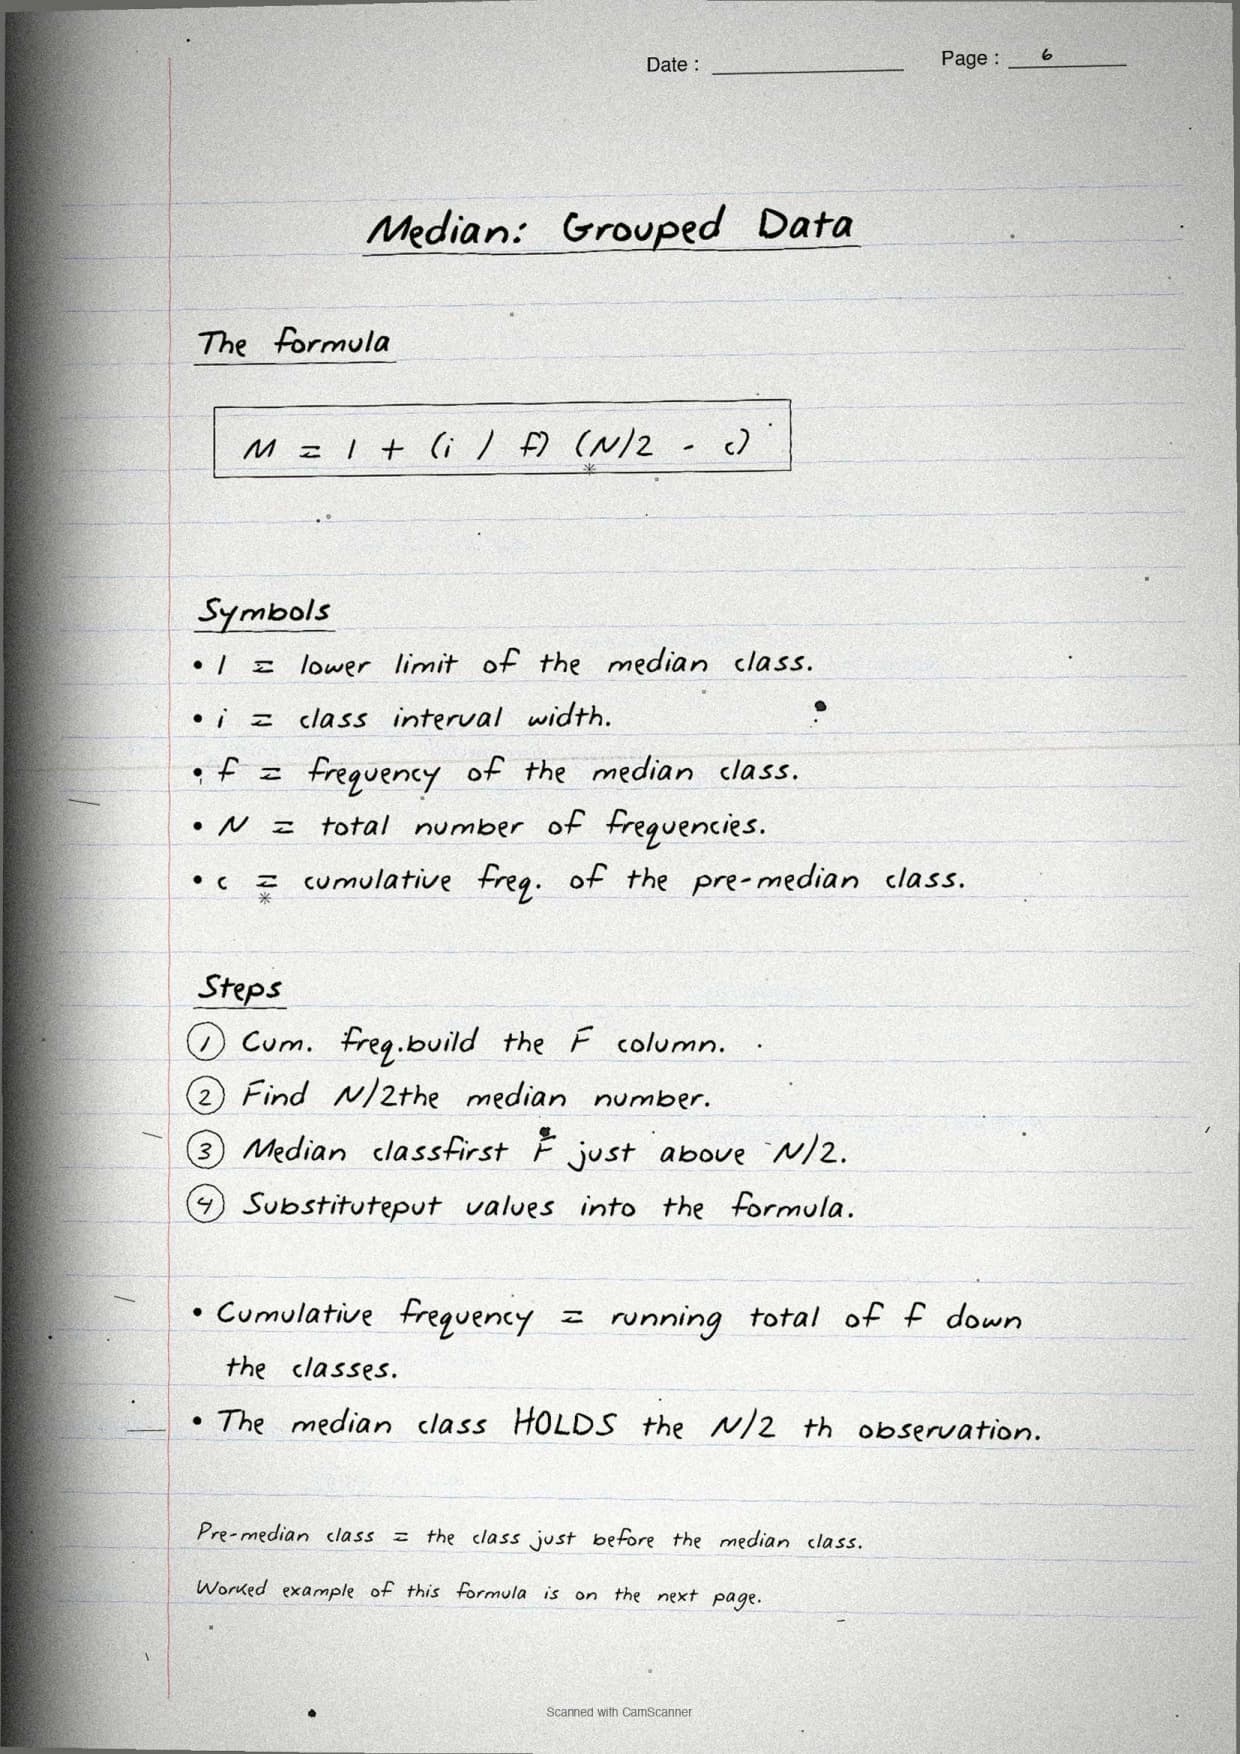
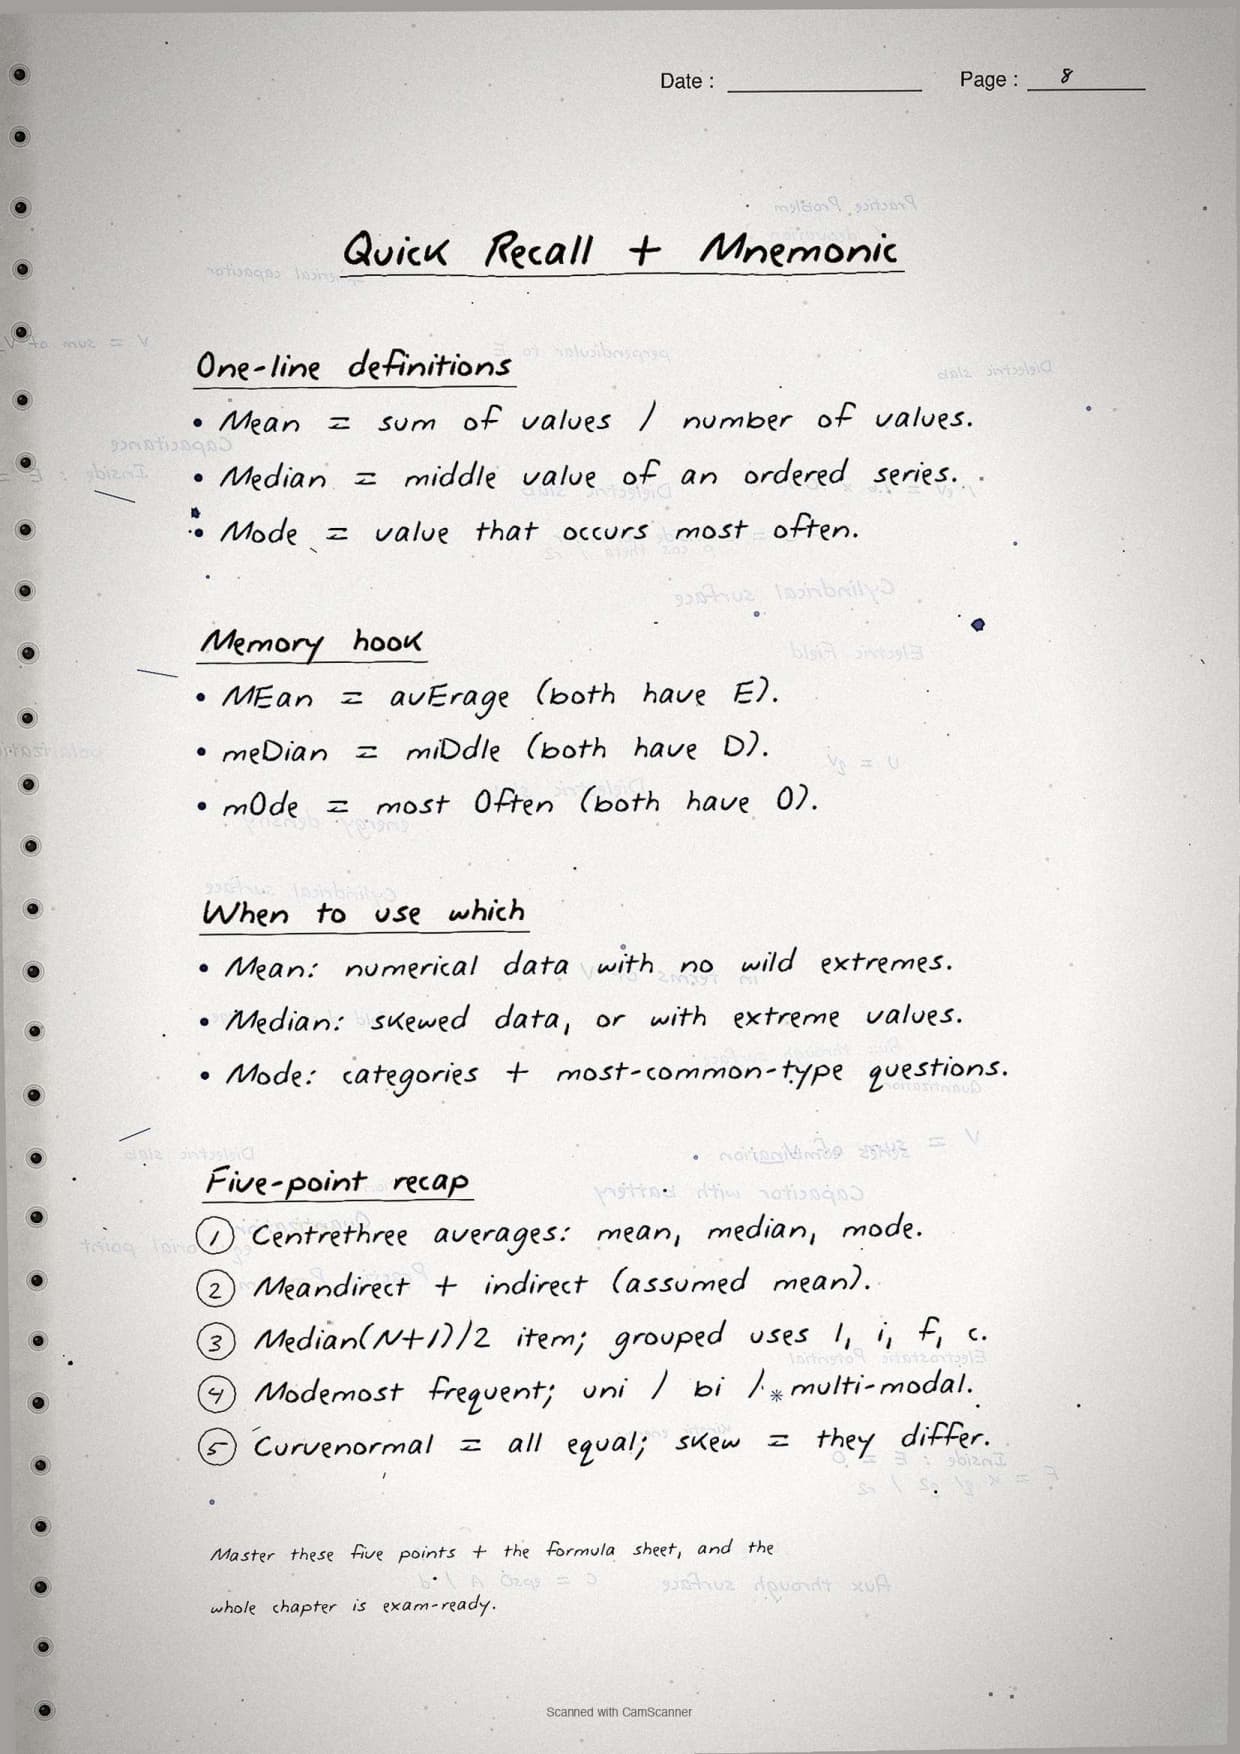
- Topper's handwritten revision notes covering all of CBSE Class 12 Practical Work in Geography Chapter 2.
- 3-5 marks weightage in the Class 12 Geography board paper, with mean, median and mode formulas worked out by hand for both ungrouped and grouped data.
- Pairs with the typed NCERT Solutions, typed Notes and the official NCERT Book PDF for the same chapter.
Each page of these data processing class 12 geography handwritten notes is written by a Collegedunia subject expert, mapped to the 2026-27 NCERT Practical Work in Geography textbook, and cross-checked against recent CBSE Class 12 Geography board papers.
Student Feedback
69% of Class 12 students said handwritten notes feel faster to scan than typed PDFs in the final 48 hours before the board exam, and 4 out of 5 said pen-on-paper formula boxes stick in memory better. Most finished one full revision pass in about 20 minutes.
Source: 2026-27 Class 12 Geography handwritten-notes poll, 8,960 CBSE students.
What These Handwritten Notes Include
The data processing class 12 geography handwritten notes PDF is a 21-page revision file with hand-drawn formula boxes around key statistical expressions, diagrams of normal distribution curves, and colour corrections where steps are refined. It is built for last-mile revision, not first-time concept building.
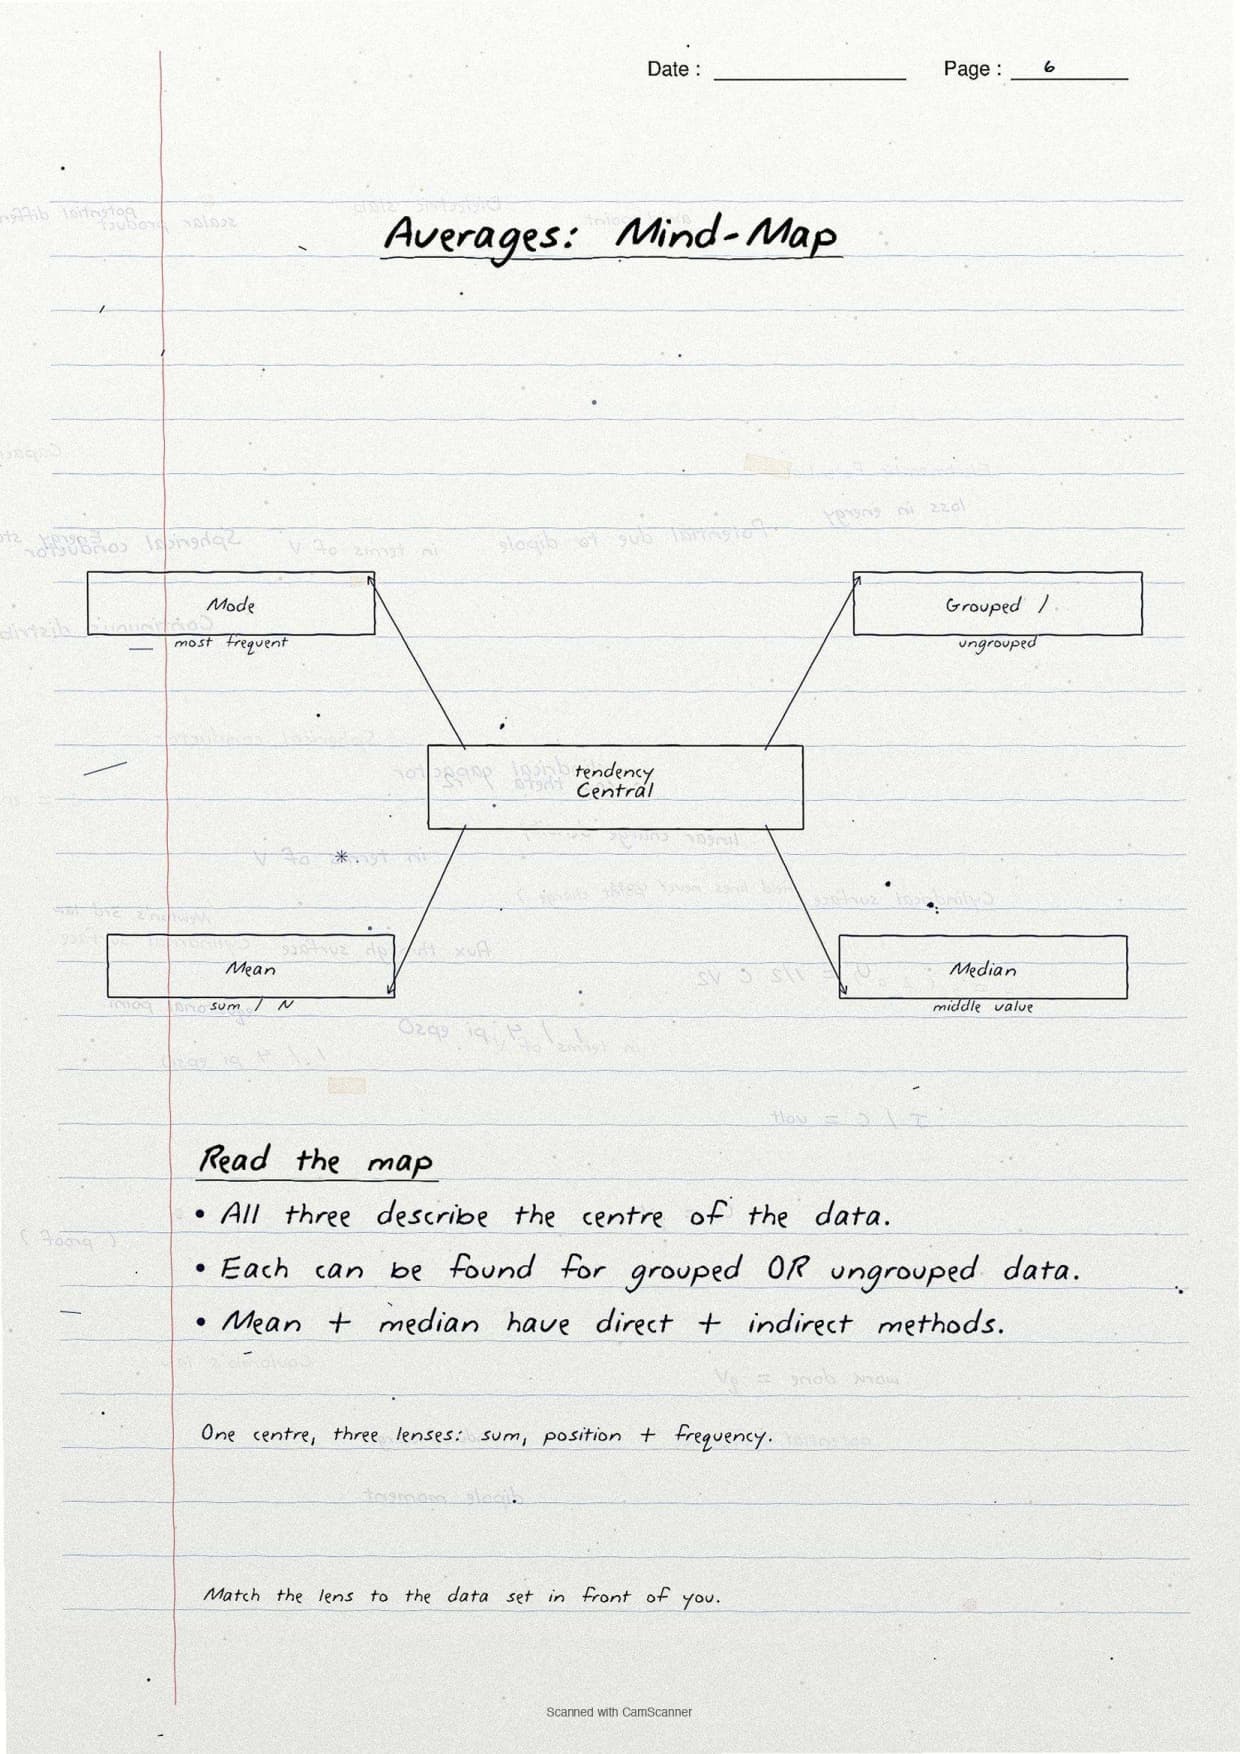
The notes capture every concept tested in Chapter 2: the three measures of central tendency, the direct, indirect and step-deviation methods for mean, median from cumulative frequency, modal class identification, the normal distribution bell curve, and the positive and negative skew diagrams.
| Pages | What the pages cover | Approx revision time |
|---|---|---|
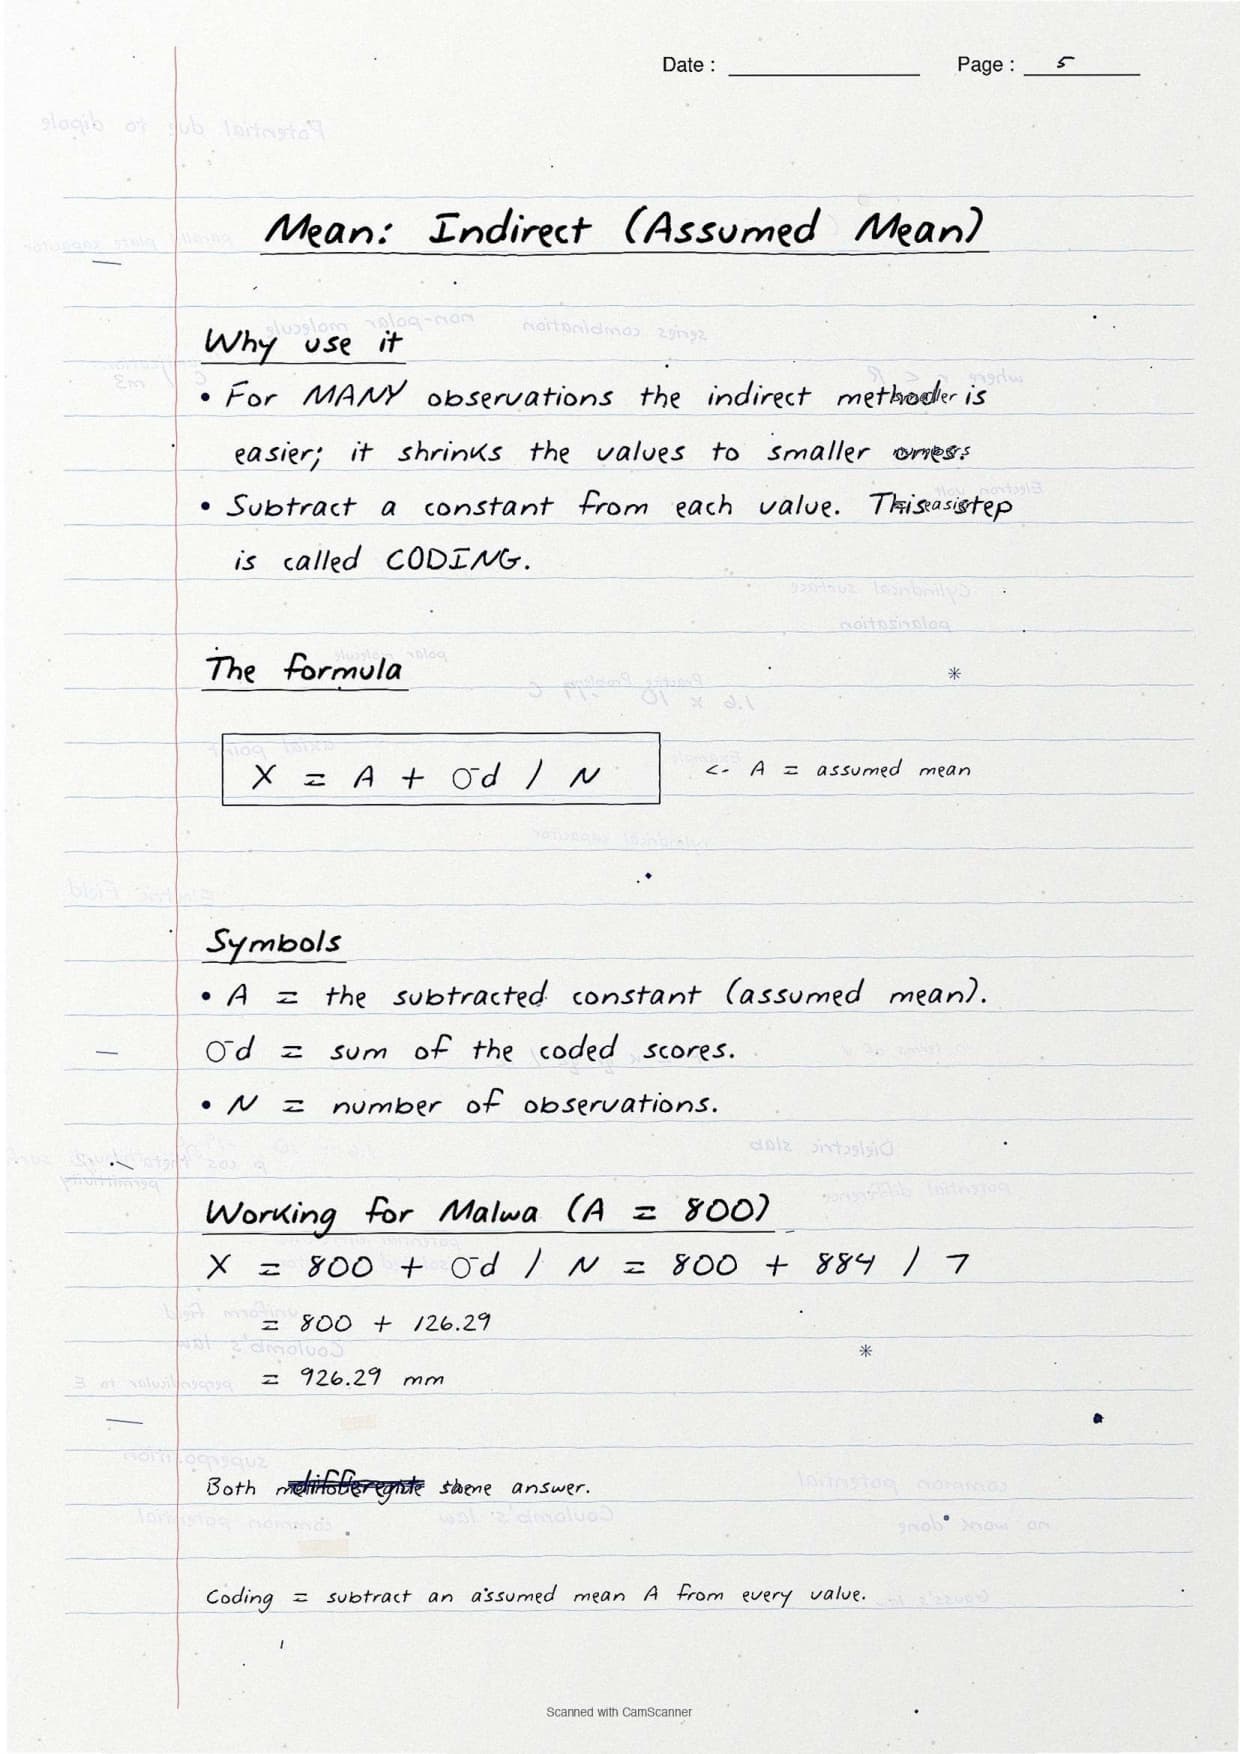
| Pages 1-5 | Introduction to central tendency, mean for ungrouped data (direct and indirect methods), worked example with Malwa Plateau rainfall data. | 6 minutes |
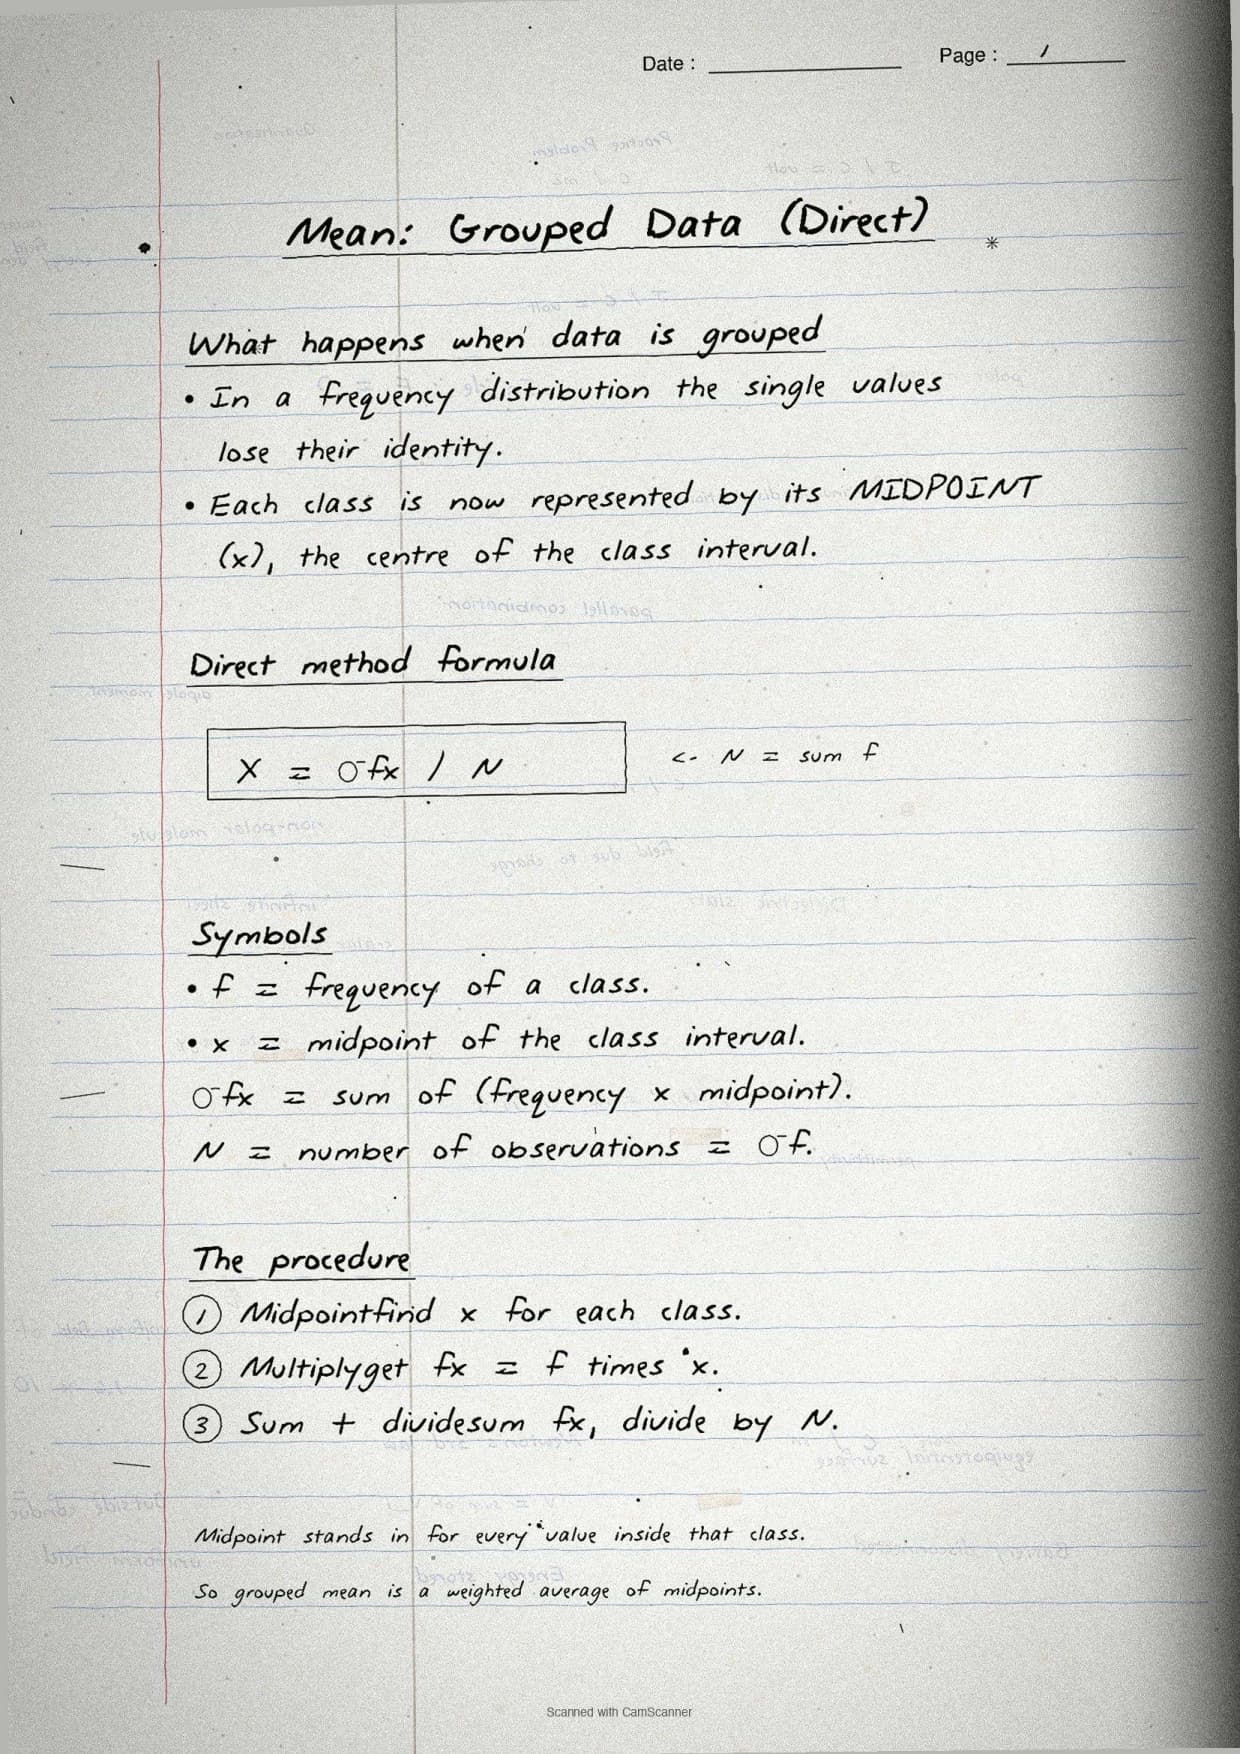
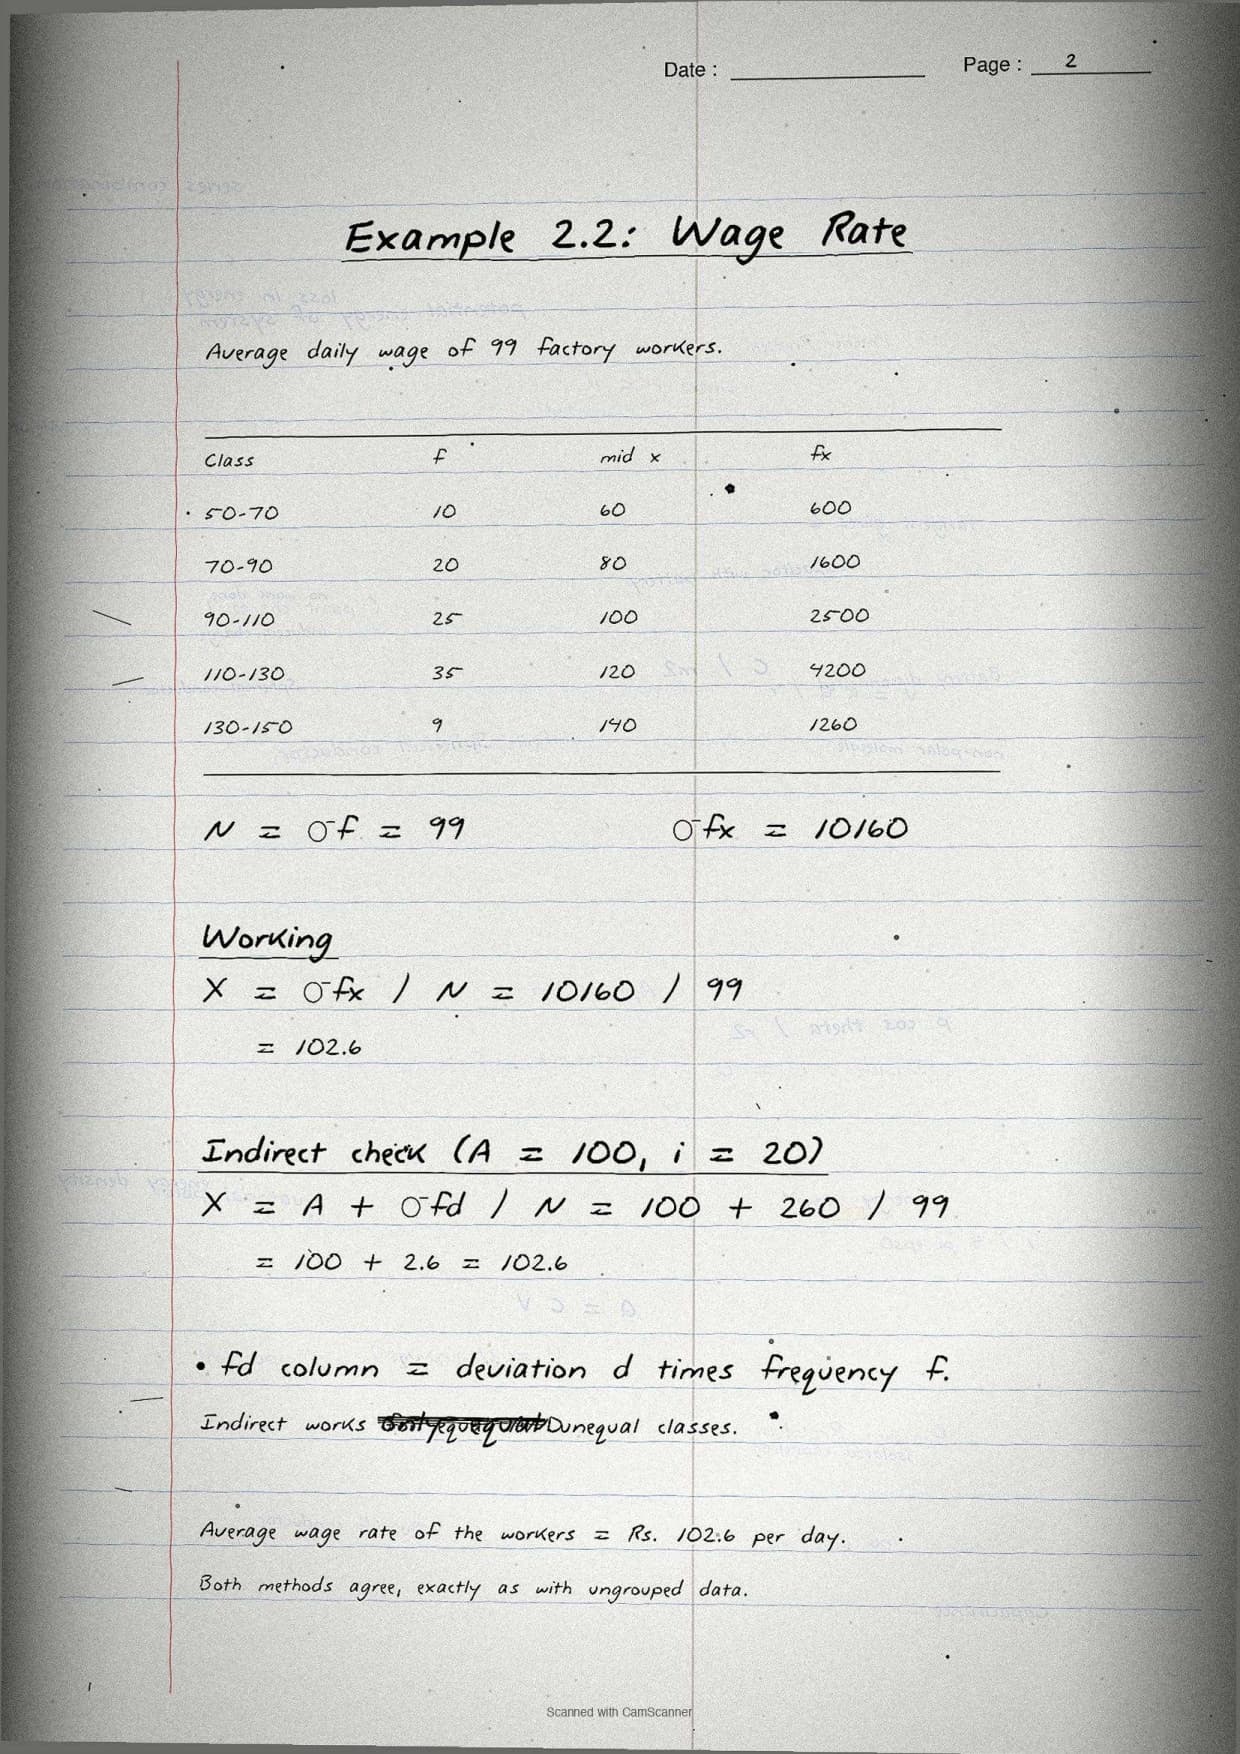
| Pages 6-11 | Mean for grouped data (direct, indirect, step-deviation methods), frequency table construction, worked example with factory wage rates. | 8 minutes |
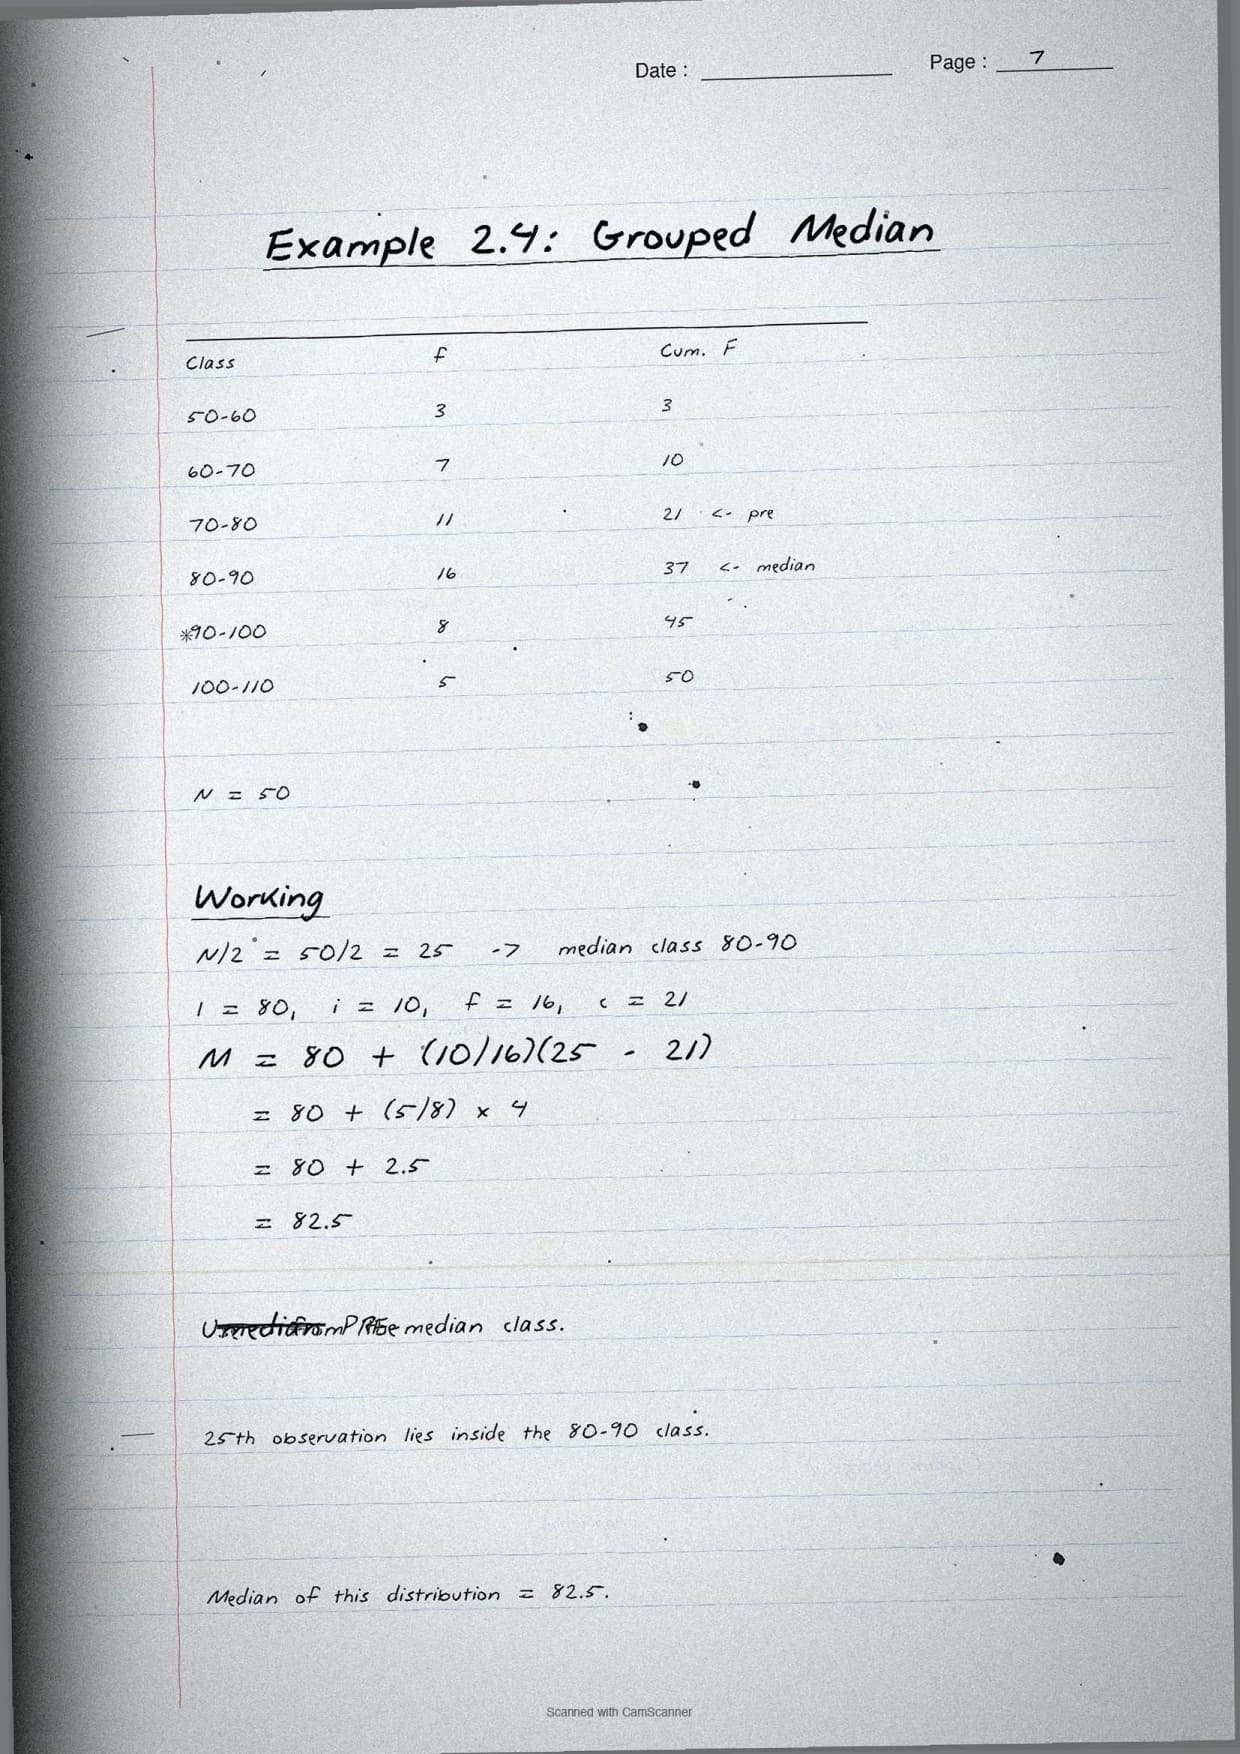
| Pages 12-15 | Median for ungrouped and grouped data, cumulative frequency table, median class identification, worked examples. | 6 minutes |
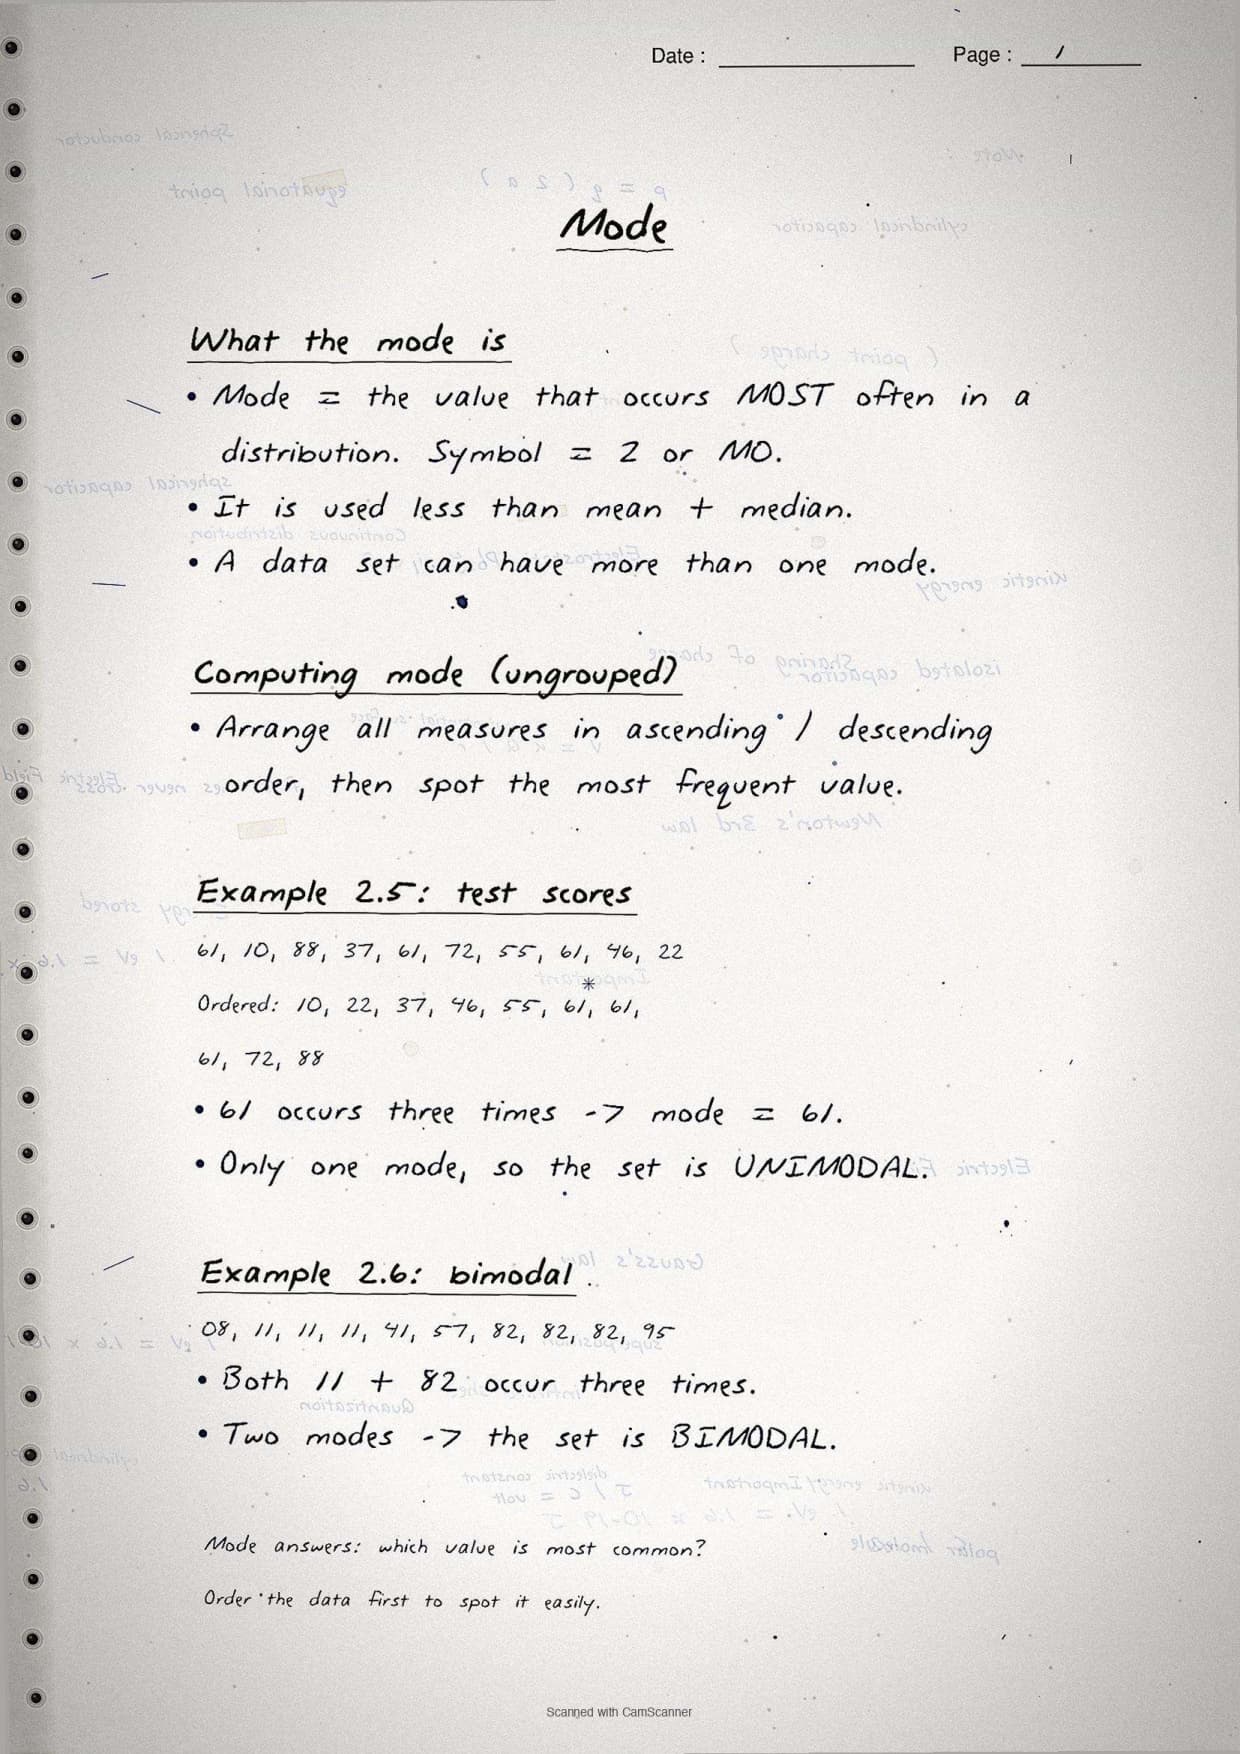
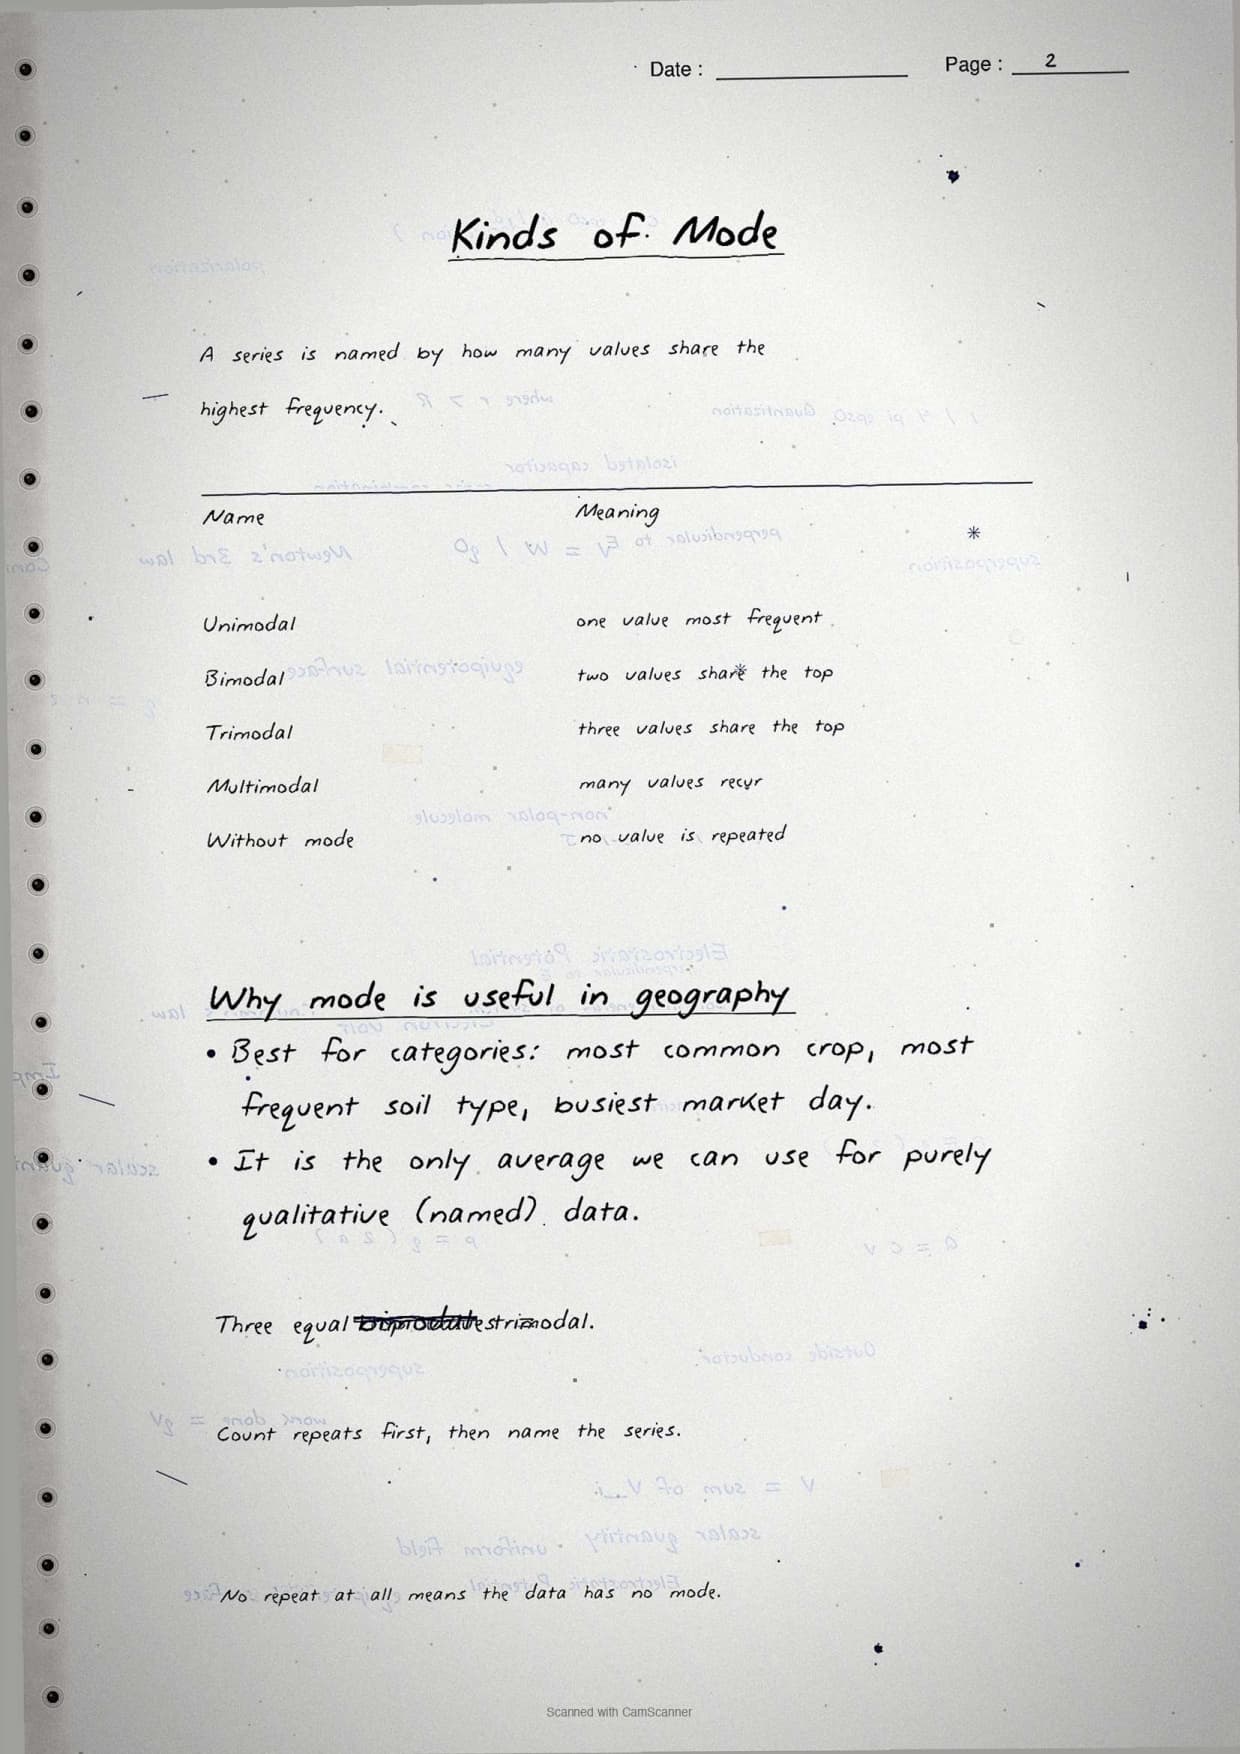
| Pages 16-18 | Mode for ungrouped and grouped data, unimodal, bimodal and multimodal distributions, mode formula for grouped data. | 4 minutes |
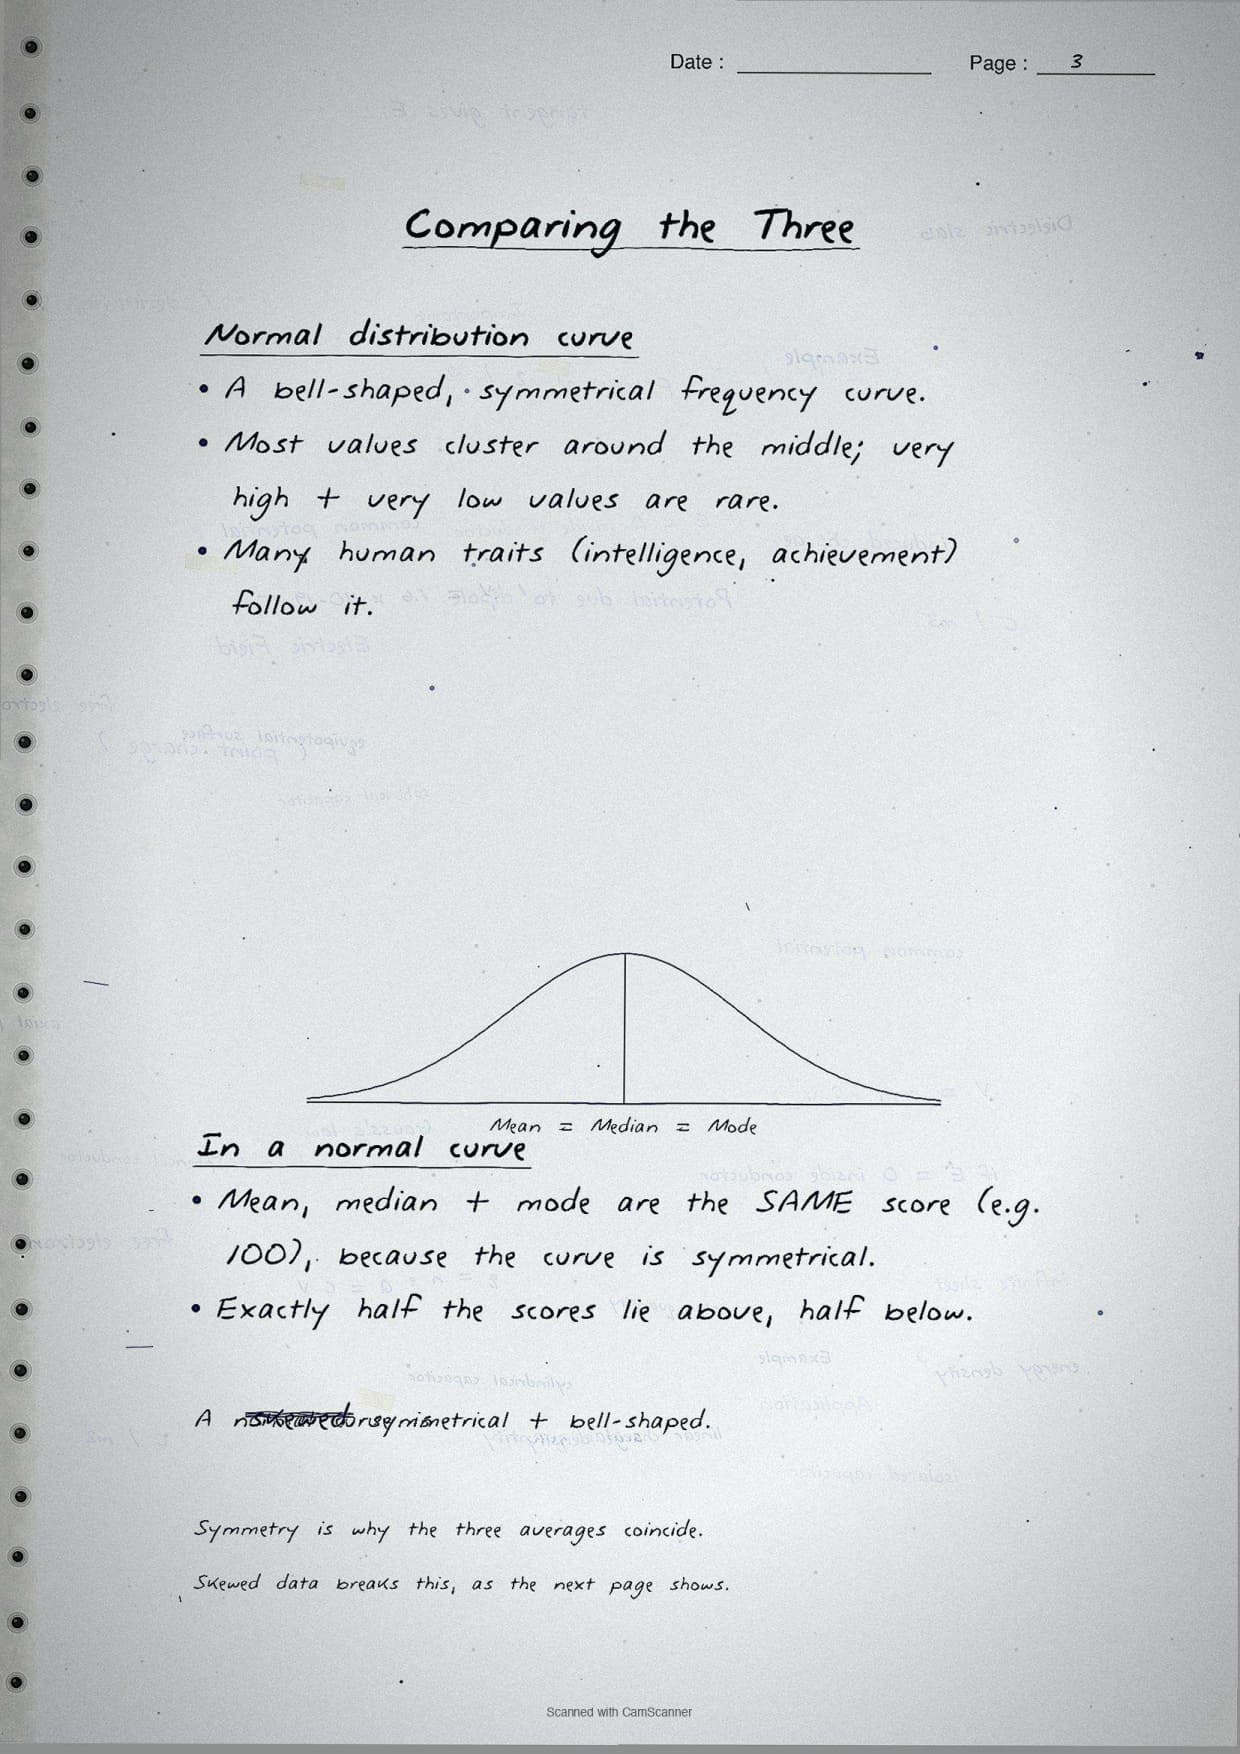
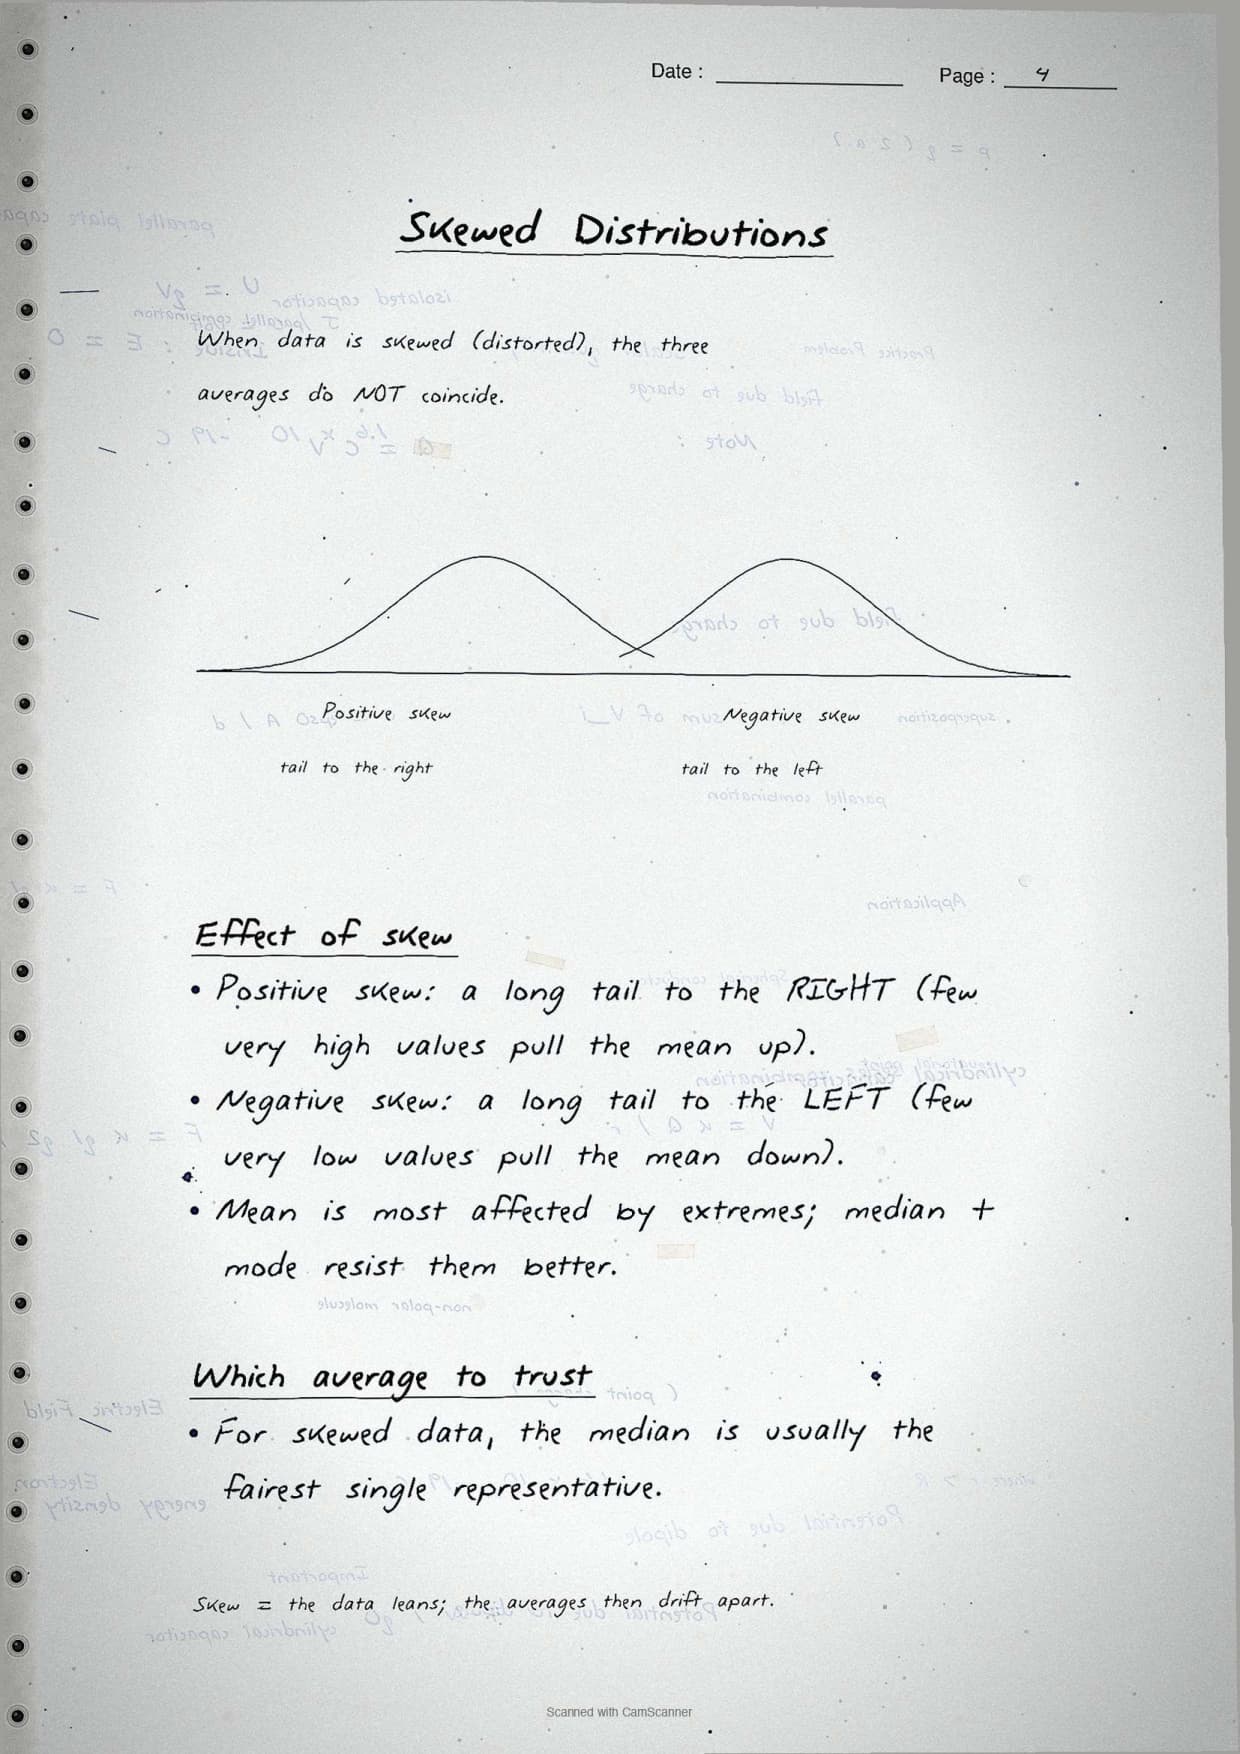
| Pages 19-21 | Comparison of mean, median and mode, normal distribution bell curve, positive skew, negative skew diagrams. | 4 minutes |
Page-by-Page Look at the Data Processing Notes
The grouped-data mean page carries the highest formula density in the file:
- Heading in capitals, underlined twice: "MEAN FROM GROUPED DATA".
- Three method boxes stacked vertically, labelled (1) Direct Method, (2) Indirect Method and (3) Step-Deviation Method.
- One-line gloss below each box: "multiply midpoint by frequency", "subtract assumed mean, divide by N", "divide deviation by class width, then adjust". This is the "method identification" step CBSE markers reward in the 3-mark question.
- Worked example below, using the Malwa Plateau rainfall data from Table 2.1, with each step on a separate line.
Source: Magnet Brains on YouTube
Key Formulas in Handwritten Style
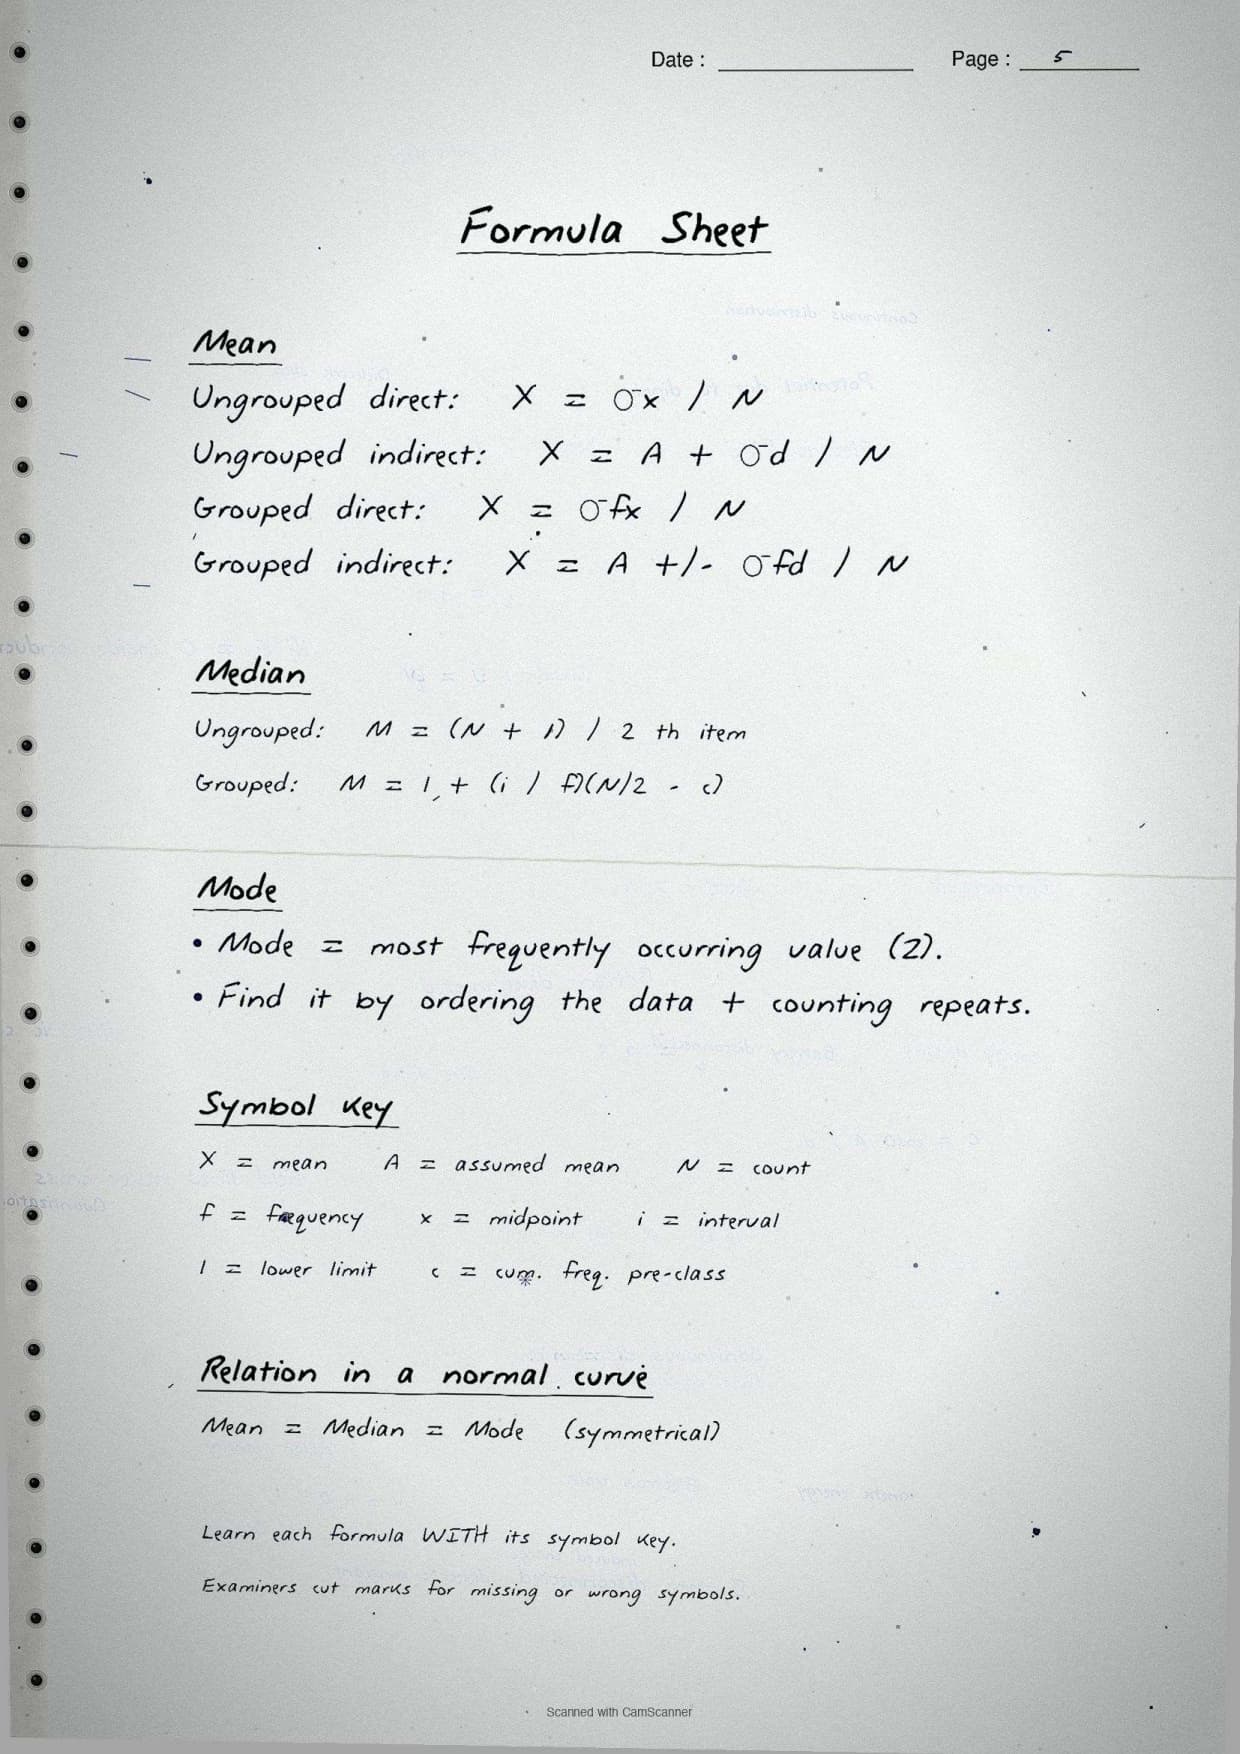
The formula pages are the highest-leverage blocks in the file. The table lists every formula students need for the practical paper, in the order they appear in the notes. In the handwritten file each formula sits inside a hand-drawn box for visual recall.
| Concept | Handwritten formula (as drawn) | NCERT example |
|---|---|---|
| Mean (ungrouped, direct) | X = Sum of x divided by N | Example 2.1 |
| Mean (ungrouped, indirect) | X = A + (Sum of d divided by N), where d = x minus A | Example 2.1 |
| Mean (grouped, direct) | X = Sum of (f times x) divided by N | Example 2.2 |
| Mean (grouped, indirect) | X = A + (Sum of fd divided by N) | Example 2.2 |
| Mean (grouped, step-deviation) | X = A + (Sum of fu divided by N) times i, where u = (x minus A) divided by i | Example 2.2 |
| Median (ungrouped) | M = value of (N+1)/2 th item when N is odd; average of N/2 and (N/2 + 1) items when N is even | Example 2.3 |
| Median (grouped) | M = l + (i divided by f) times (N/2 minus c) | Example 2.4 |
| Mode (ungrouped) | Most frequently occurring value in the series | Example 2.5 |
| Mode (grouped) | Z = l + (i times f1 minus f0) divided by (2f1 minus f0 minus f2) | Exercise Q |
Tip: Each formula sits in a hand-drawn box with a corner arrow to the worked example below, so students recall the steps faster on exam day.
Mean: Direct and Indirect Methods Explained
The mean in class 12 geography data processing is the arithmetic average of all observations. The NCERT chapter teaches three methods depending on whether the data is ungrouped or grouped, and whether you use an assumed mean.
Direct method for ungrouped data
Add all raw values and divide by N (the number of observations, not the number of classes). For the Malwa Plateau rainfall example (7 districts), the sum is 6,484 mm and the mean is 926.29 mm.
Indirect method using assumed mean
Pick an assumed mean A close to the centre of the data, subtract it from each value to get deviations (d), then compute X = A + (Sum of d divided by N). For the Malwa example with A = 800, the mean is still 926.29 mm, so the two methods always agree.
Step-deviation method for grouped data
Divide the deviation by the class width i to get u = (x minus A) divided by i, then compute X = A + (Sum of fu divided by N) times i. This works with smaller numbers, cutting arithmetic errors.
Important: The assumed mean A can be any value near the centre; the final X is the same whichever A you pick. If the direct and indirect methods differ, check for a sign error in the deviation column.
Median and Mode: When to Use Each
The median and mode class 12 geography sections show when each measure is the right choice and how to compute them for ungrouped and grouped data.
Median: the middle-rank value
Arrange data in ascending order. For an odd count the median is the middle value; for an even count it is the average of the two middle values. For grouped data use M = l + (i/f) times (N/2 minus c). To find the median class: compute N/2, then find the class whose cumulative frequency first exceeds N/2.
Mode: the most frequent value
Mode is the value that appears most often; a dataset can be unimodal, bimodal or multimodal. For grouped data the modal class has the highest frequency, and the mode formula uses the frequencies of the classes before and after it.
Normal Distribution Curve and Skewness
The final pages cover the normal distribution bell curve and its two skewed forms, tested as a 2-3 mark theory question: draw and label the curve, or identify which measure is affected by extreme values.
| Distribution type | Shape | Relationship between Mean, Median, Mode |
|---|---|---|
| Normal (bell curve) | Perfectly symmetrical, bell-shaped | Mean = Median = Mode (same score) |
| Positive skew (right-skewed) | Tail stretches to the right | Mode < Median < Mean |
| Negative skew (left-skewed) | Tail stretches to the left | Mean < Median < Mode |
The key takeaway is that the median always sits between the mean and mode in a skewed distribution, the fact CBSE examiners test most often here.
Common Mistakes Highlighted in the Notes
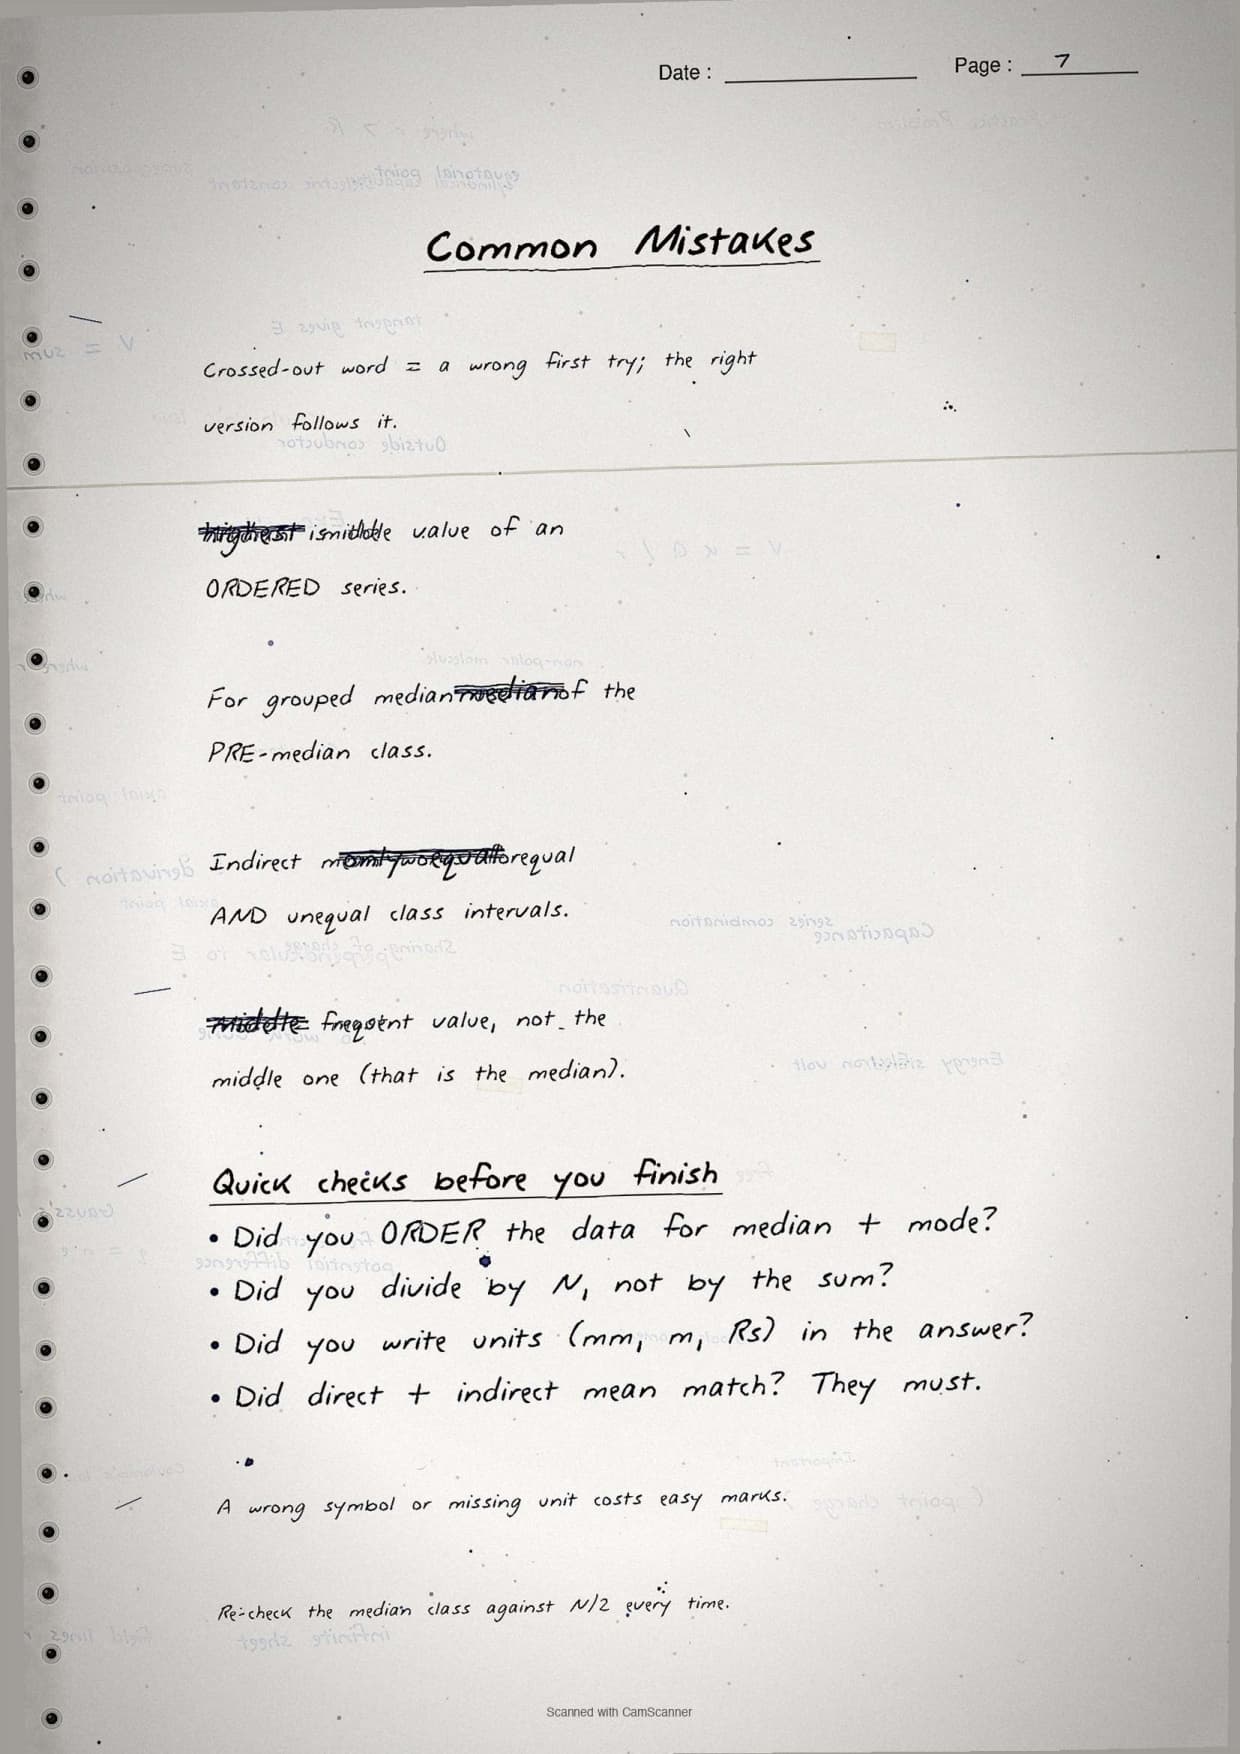
The five repeat-offender mistakes CBSE examiners flag each year on data processing class 12 geography questions, each marked in the margin of the notes in a second ink colour:
- Dividing by the number of classes instead of N. N is always the total number of observations, not the number of class intervals.
- Wrong median class identification. Pick the class where the cumulative frequency first crosses N/2, not the class with the highest frequency.
- Forgetting to multiply by i in the step-deviation formula. The formula ends with "times i"; missing it gives a wrong answer.
- Confusing unimodal and bimodal data sets. If two values share the highest frequency, the data is bimodal.
- Drawing skew curves without labelling the tail direction. Positive skew has the tail on the right, negative on the left.
Previous Year Question Trends
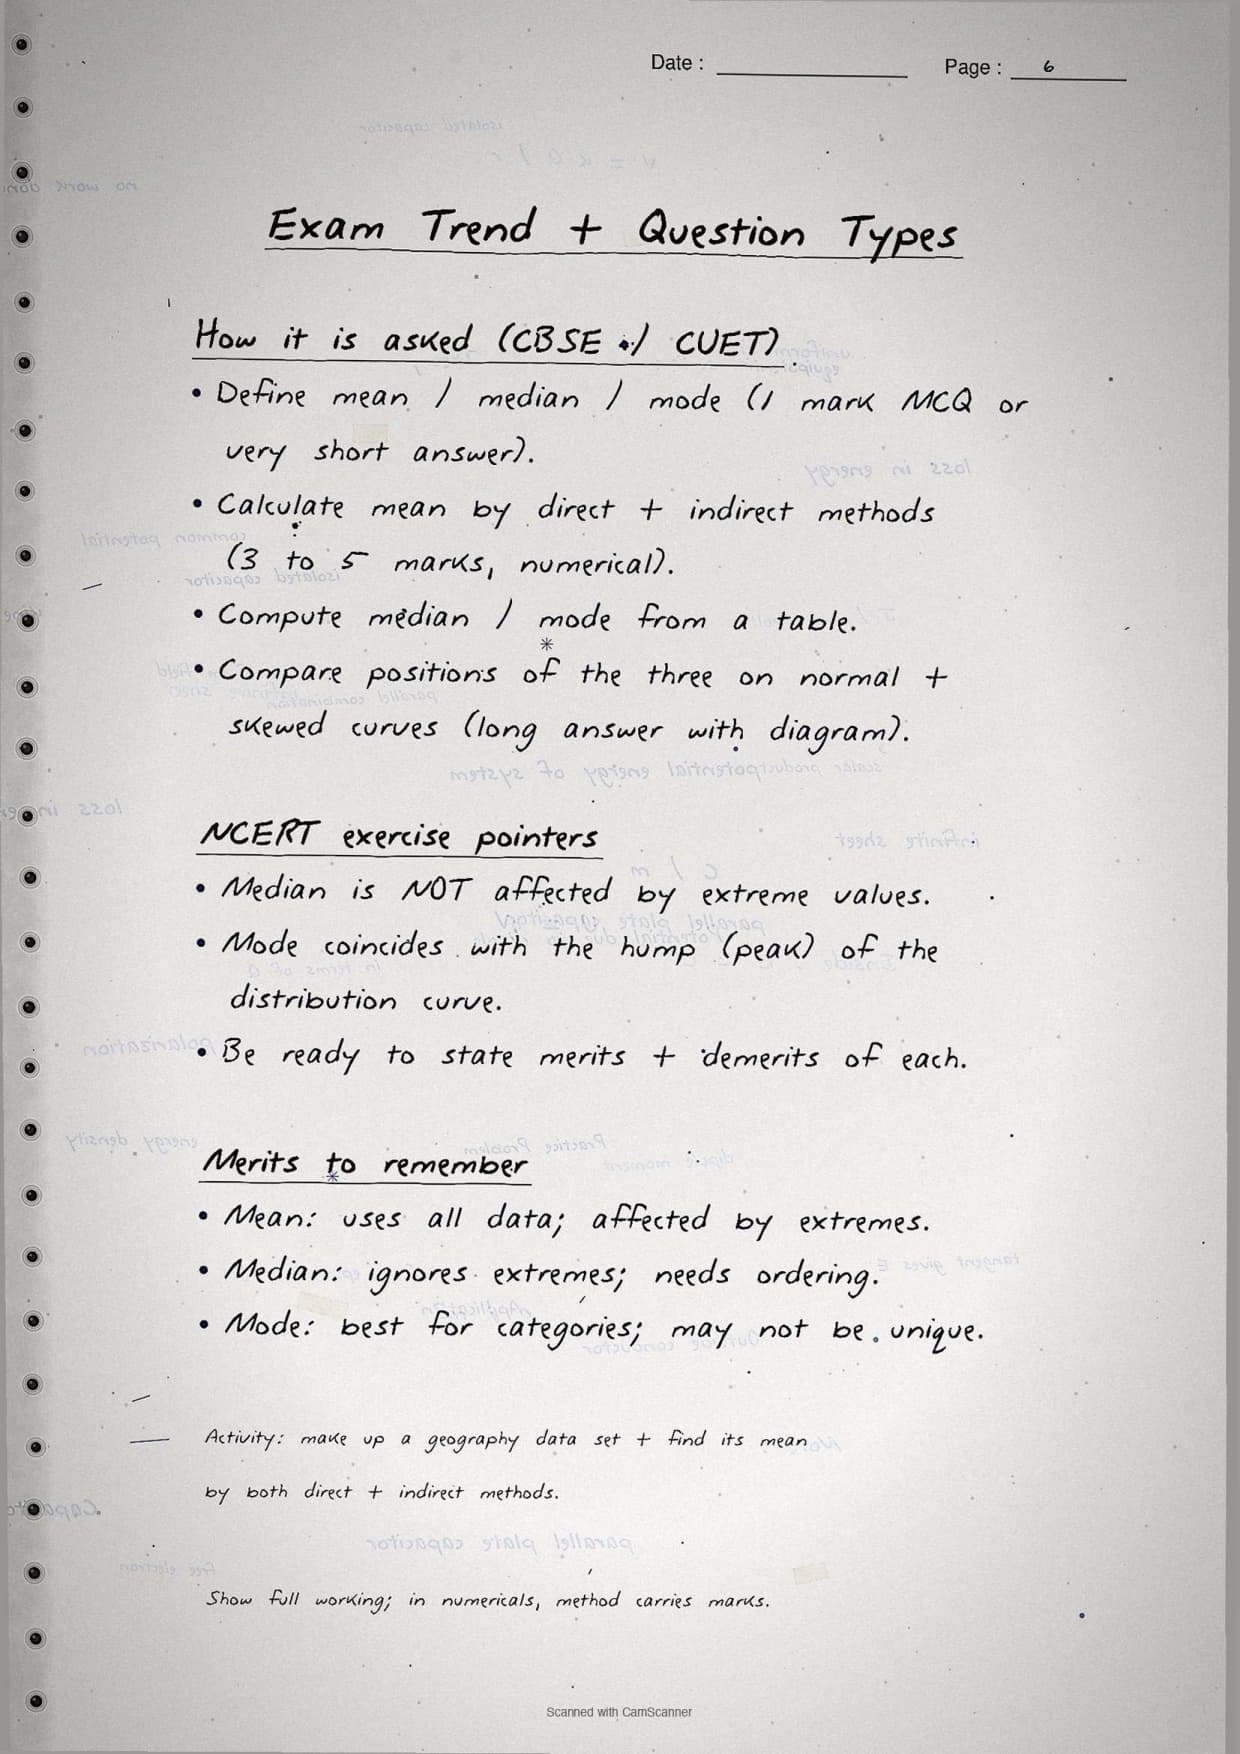
The CBSE Class 12 Geography practical paper has carried a stable 3 to 6 marks from Chapter 2 over recent years, typically one short-answer question on the measures of central tendency and one diagram-based question on the normal distribution curve or skewness.
| Year | Question asked | Marks | Notes pages to revise |
|---|---|---|---|
| 2025 | Calculate median from grouped frequency distribution; draw normal distribution curve | 3 + 2 | Pages 12-15 + 19-21 |
| 2024 | Find mean by step-deviation method from given data; define mode | 3 + 1 | Pages 6-11 + 16-18 |
| 2023 | Calculate mode for ungrouped data; draw positive and negative skew curves | 2 + 3 | Pages 16-18 + 19-21 |
| 2022 | Find mean using indirect method for ungrouped data; distinguish mean, median and mode | 3 + 2 | Pages 1-5 + 19-21 |
| 2021 | Compute mean by direct method from grouped data; identify measures unaffected by extreme values | 3 + 1 | Pages 6-11 + 19-21 |
The calculation question rotates among mean, median and mode on a roughly equal cycle, which is why all three formula sections must be revised together, not selectively.
Other Resources for Class 12 Geography Chapter 2 Data Processing
Pair these handwritten notes with the matching NCERT Solutions, typed Notes and the official NCERT Book chapter.
| Resource | What it covers | Open |
|---|---|---|
| Handwritten Notes | Topper's handwritten revision pages for last-mile board exam prep. | You are here |
| NCERT Solutions | Step-by-step answers to all exercise questions including worked mean, median and mode numericals. | Class 12 Geography Chapter 2 NCERT Solutions |
| Notes | Concept-first typed revision notes with definitions, all three methods, skewness and comparison table. | Class 12 Geography Chapter 2 Notes |
| NCERT Book PDF | Official NCERT Practical Work in Geography Chapter 2 textbook in PDF form. | Class 12 Geography Chapter 2 NCERT Book PDF |
| Subject Hub | All chapters of Class 12 Geography with every resource in one place. | Class 12 Geography Subject Hub |
All Chapters Handwritten Notes for Class 12 Practical Work in Geography
Related Links: Use the table below to open the handwritten notes for the other chapters of Class 12 Practical Work in Geography.
| Chapter | Topic | Handwritten Notes link |
|---|---|---|
| Chapter 1 | Data: Its Source and Compilation | Class 12 Geography Data Source and Compilation Handwritten Notes |
| Chapter 2 | Data Processing | You are here |
| Chapter 3 | Graphical Representation of Data | Class 12 Geography Graphical Representation of Data Handwritten Notes |
| Chapter 4 | Spatial Information Technology | Class 12 Geography Spatial Information Technology Handwritten Notes |
Data Processing Class 12 Geography Handwritten Notes FAQs
Ques. What are these data processing class 12 geography handwritten notes meant to be used for?
Ans. The data processing class 12 geography handwritten notes are a topper's handwritten revision file. They compress the full NCERT Chapter 2 of Class 12 Practical Work in Geography into 21 pages of hand-drawn formula boxes, worked examples and margin-callout common mistakes covering mean, median and mode for both ungrouped and grouped data, the normal distribution bell curve, and positive and negative skewness diagrams. Students typically use the file for last-mile revision in the 24 hours before the board paper, paired with the typed Notes PDF for concept building and the NCERT Solutions PDF for numerical drill.
Ques. How are these handwritten notes different from the typed class 12 geography data processing notes?
Ans. The typed data processing class 12 notes carry deeper prose around each formula (definitions, derivations, when-to-use comparisons) and run 8 to 10 pages long. The handwritten notes compress that prose down to formula boxes alone, lean on visual recall (ruler-drawn boxes, arrow-tagged step sequences, pen-touch corrections) and are designed to be read in one sitting. The two files work best together: read the typed Notes first to build the concept, then collapse to the handwritten file for the second and third revision passes.
Ques. What is the formula for mean in data processing class 12 geography?
Ans. The NCERT chapter gives three mean formulas depending on data type and method. For ungrouped data using the direct method: X = Sum of x divided by N. For ungrouped data using the indirect method: X = A + (Sum of d divided by N), where d = x minus A and A is the assumed mean. For grouped data using the step-deviation method: X = A + (Sum of fu divided by N) times i, where u = (x minus A) divided by the class width i. All three methods give the same final answer on the same data set. The handwritten notebook draws all three formula boxes side by side on one page for direct comparison.
Ques. How do you find the median class in data processing class 12?
Ans. To find the median class for grouped data, first construct a cumulative frequency column. Then compute N/2, where N is the total number of observations. The median class is the class interval whose cumulative frequency first exceeds N/2. For example, if N = 50, compute N/2 = 25 and find the class where the cumulative frequency crosses 25 for the first time. That class gives you the values of l (lower limit), f (frequency) and c (cumulative frequency of the preceding class) needed in the formula M = l + (i/f) times (N/2 minus c). The handwritten notebook draws this as a step-by-step arrow diagram so the selection process is unambiguous.
Ques. What is the difference between mean and median in the context of class 12 geography data processing?
Ans. Mean is the arithmetic average of all values and is sensitive to extreme values (outliers). Median is the middle value when data is arranged in order and is not affected by extreme values, which makes it a better representative for skewed distributions. In a normal distribution, mean and median are equal. In a positively skewed distribution, the mean is pulled to the right and is higher than the median. In a negatively skewed distribution, the mean is pulled to the left and is lower than the median. The NCERT chapter recommends median over mean when extreme values distort the data set, such as in income distribution or rainfall studies with outlier years.
Ques. What does the normal distribution curve show in class 12 geography?
Ans. The normal distribution curve (bell curve) shows a symmetrical, bell-shaped frequency distribution where most observations cluster around the centre and fewer observations appear at the extremes. In a perfect normal distribution, the mean, median and mode are all equal and coincide at the peak of the bell. The NCERT chapter uses it to introduce the concept of central tendency measurement and to explain how the three measures diverge when data is skewed. Many human geography variables (population density, rainfall totals over many years, student test scores) approximate a normal distribution, which is why the curve is taught in this chapter.
Ques. Which measure of central tendency is not affected by extreme values?
Ans. The median is the measure of central tendency that is not affected by extreme values, because it depends only on the rank order of observations, not on their actual magnitude. The mean, in contrast, is directly affected by every value including outliers. Mode is also unaffected by extreme values because it is simply the most frequently occurring value. This is why CBSE board papers frequently ask "which measure of central tendency is most suitable for skewed data or data with extreme values?" and the correct answer is always the median. The NCERT exercise for Chapter 2 includes a multiple-choice question (Exercise 1(i)) testing exactly this point.
Ques. Are these data processing handwritten notes enough for the CBSE board exam?
Ans. The handwritten notes cover all formula recall aspects of the chapter, which typically account for 3 to 5 marks of the Class 12 Geography board paper. For the diagram-drawing questions (normal distribution curve, skewness), the 21-page notebook provides hand-drawn reference diagrams to practise from. Students targeting 90-plus in CBSE Class 12 Geography should pair the handwritten file with the NCERT Solutions PDF for step-by-step worked numericals and at least one previous year CBSE paper for exam-style practice. Both resources are linked in the cross-resource table on this page.
Ques. How is the step-deviation method different from the indirect method for computing mean?
Ans. Both the indirect method and the step-deviation method use an assumed mean A. The indirect method computes d = x minus A for each midpoint and uses X = A + (Sum of fd divided by N). The step-deviation method goes one step further by dividing d by the class width i to get u = d divided by i, then uses X = A + (Sum of fu divided by N) times i. The step-deviation method reduces the size of the numbers you work with even further, which cuts arithmetic errors in long grouped-data problems. The NCERT chapter (Example 2.2) works the same factory wage data with all three grouped-data methods so students can verify the answer is identical across all three approaches.
Ques. What is positive skew and negative skew in class 12 geography data processing?
Ans. In a positively skewed distribution, the tail of the frequency curve stretches to the right (toward higher values). This happens when a few very high values pull the mean upward while most observations cluster at the lower end. The order of measures is Mode less than Median less than Mean. In a negatively skewed distribution, the tail stretches to the left (toward lower values), pulled by a few very low extreme values. The order reverses: Mean less than Median less than Mode. The NCERT chapter illustrates both as labelled diagrams (Fig 2.2 and Fig 2.3), and the handwritten notebook reproduces both diagrams as hand-sketched curves with arrow labels on the final pages of the file.
Ques. Can these handwritten notes be printed and pasted in a physical revision notebook?
Ans. Yes, and that is the recommended use pattern. The PDF is sized for A4 printing, with each page sitting cleanly inside a standard ruled notebook page. Students in the 2026 Class 12 Geography feedback poll reported that printing the pages and pasting them inside their physical revision notebook helped them recall formulas faster during the exam, because the pen-on-paper layout matches the muscle memory of writing the answer in the answer script.



Comments