




The NCERT Solutions for Class 12 Geography (Practical Work in Geography) Chapter 1 Data: Its Source and Compilation cover all 3 textbook exercise questions, aligned with the 2026-27 CBSE syllabus. Every answer is written in plain English for a Class 12 student, covering the difference between data and information, primary and secondary sources, and the calculation of index numbers.
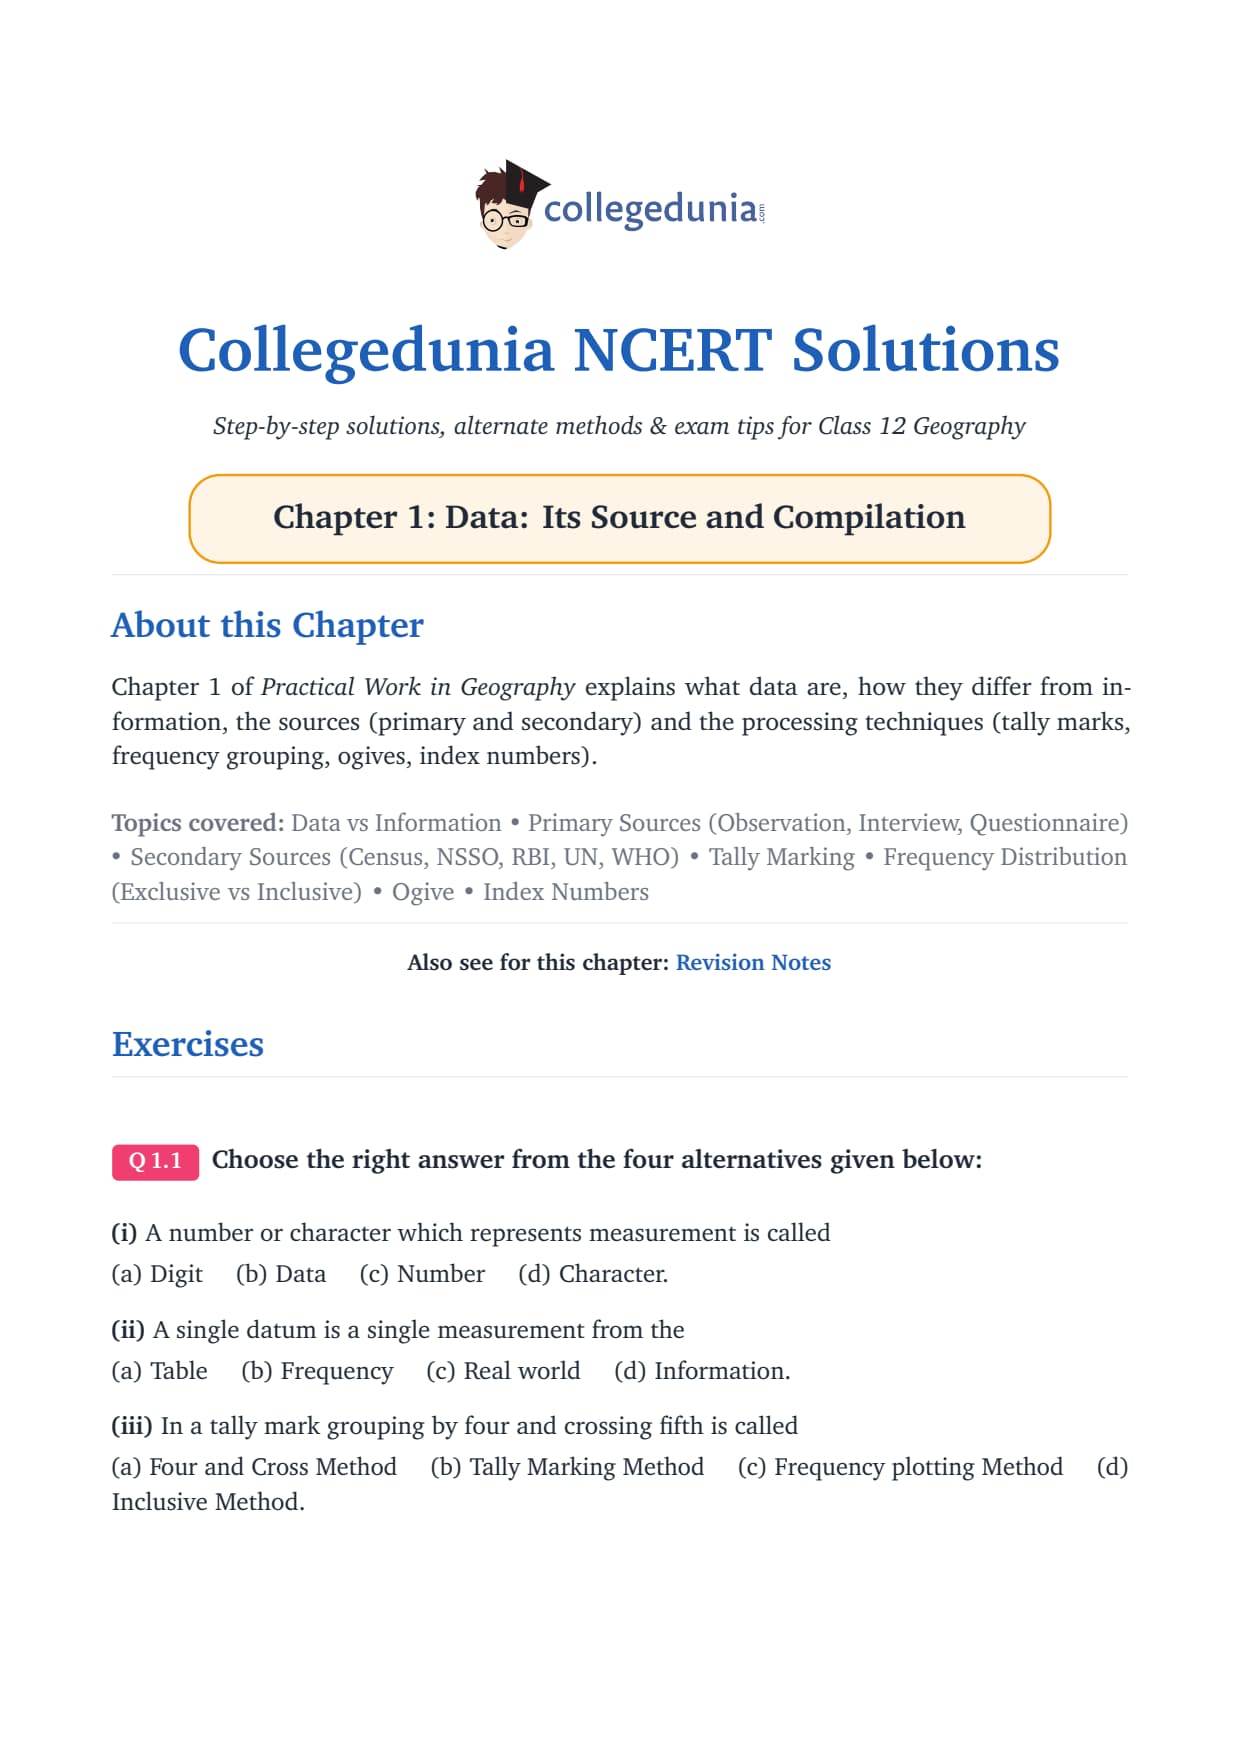
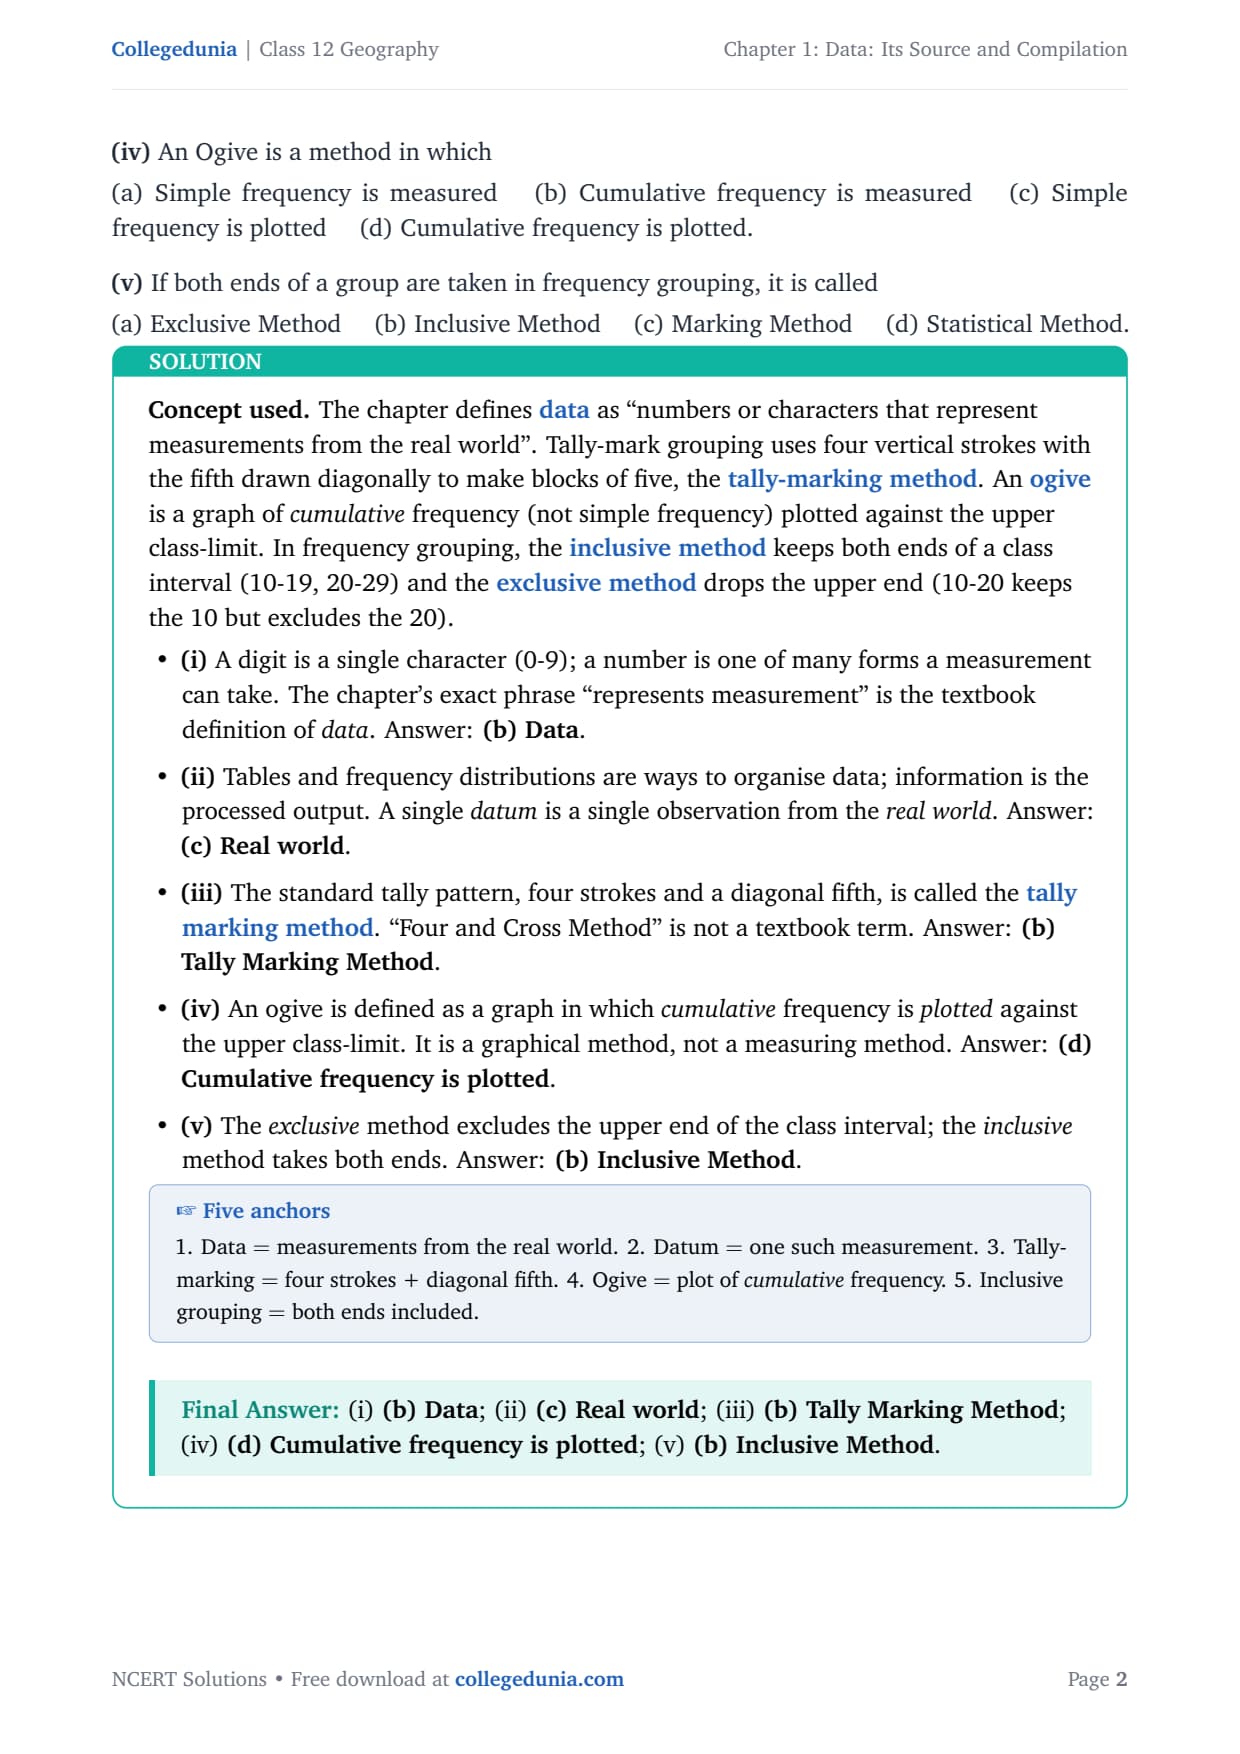
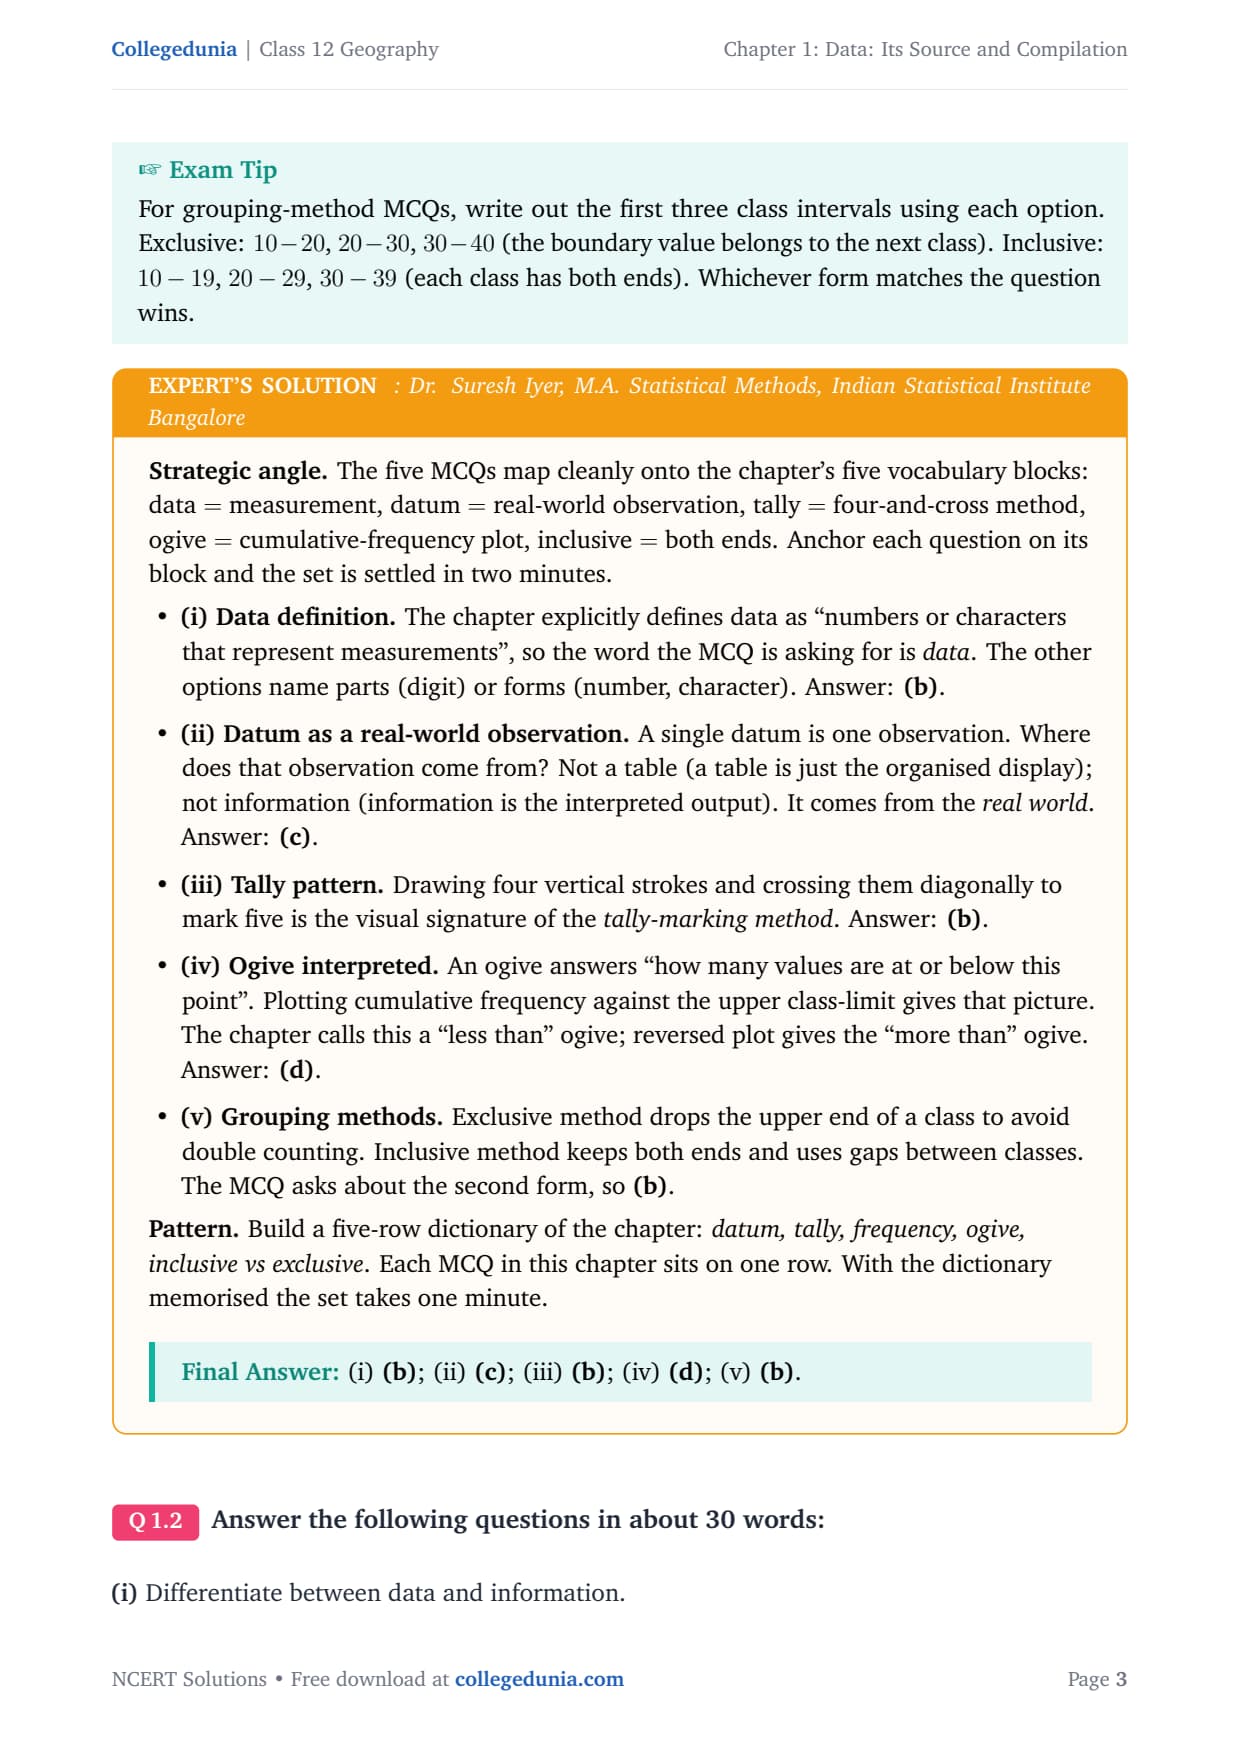
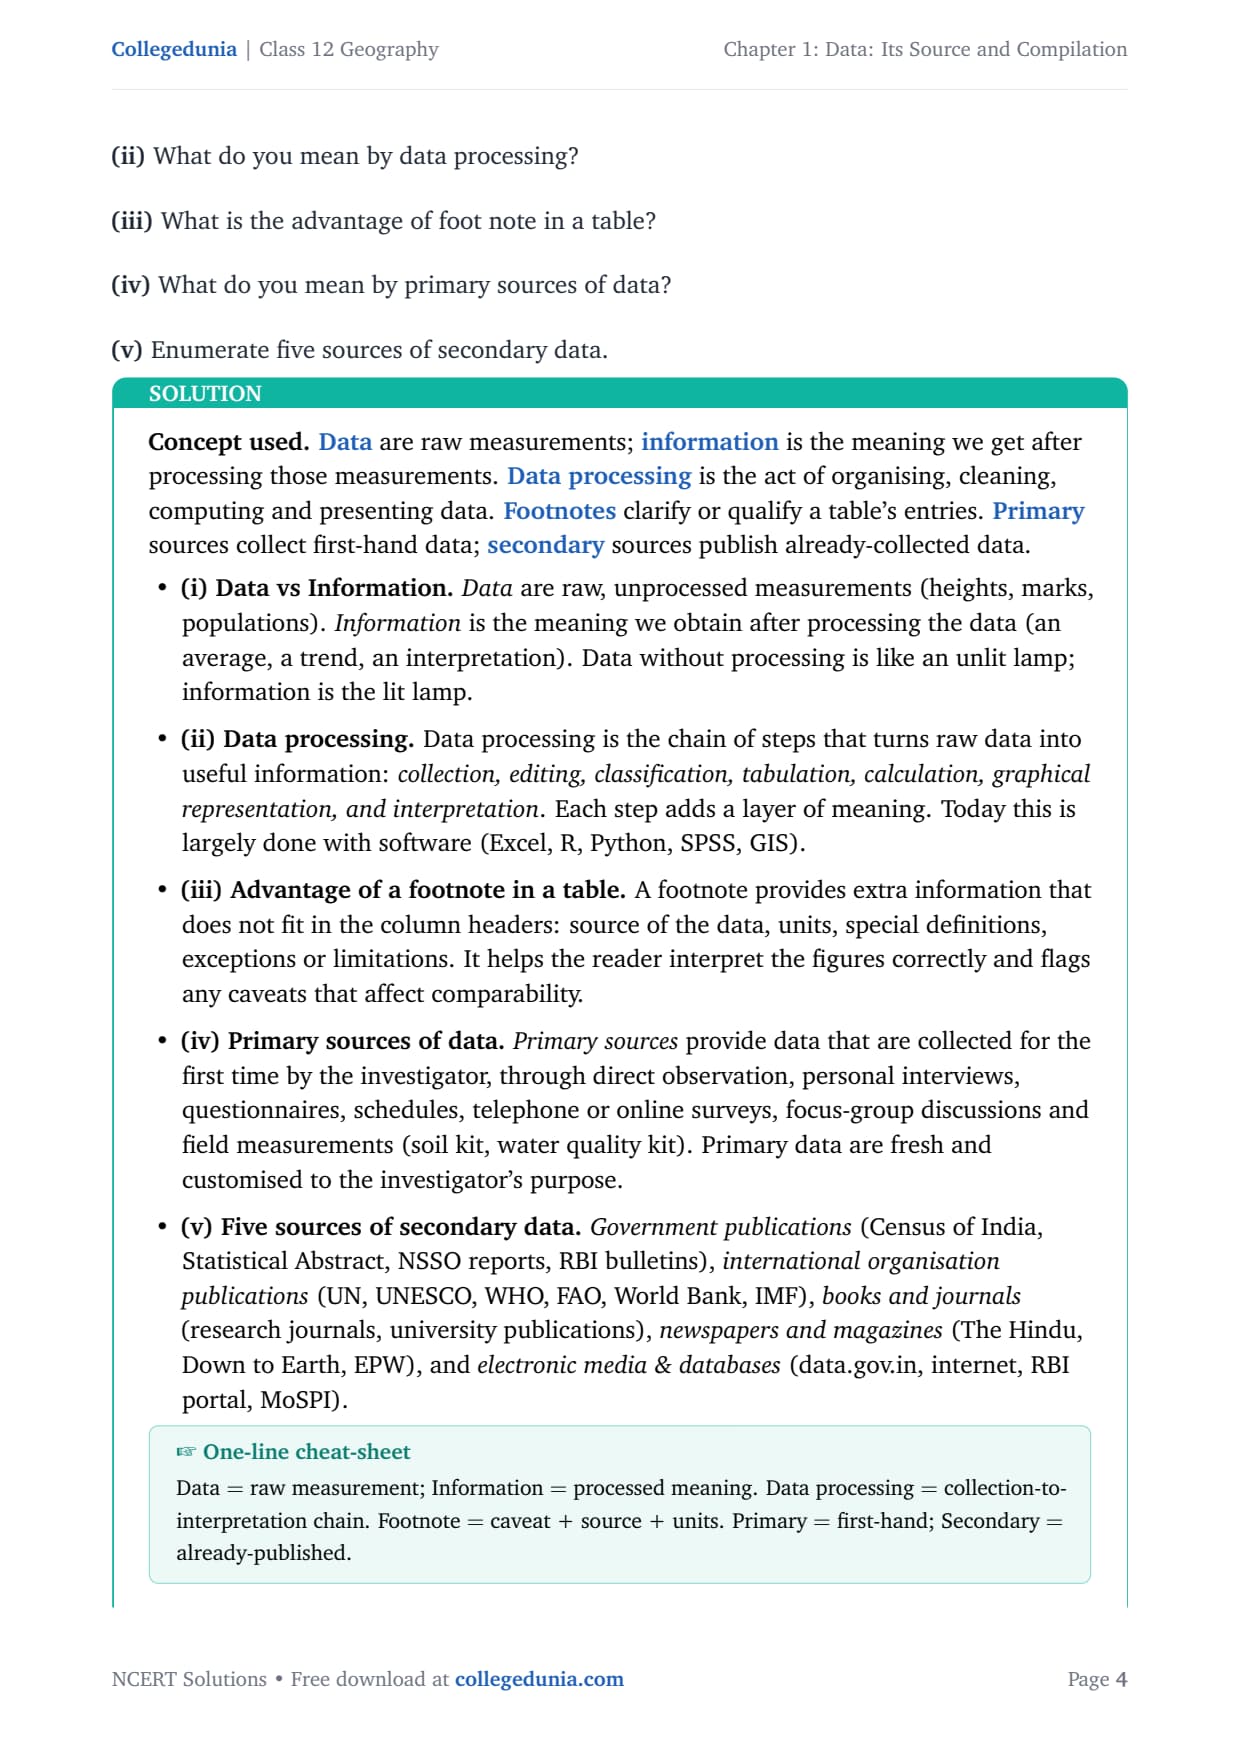
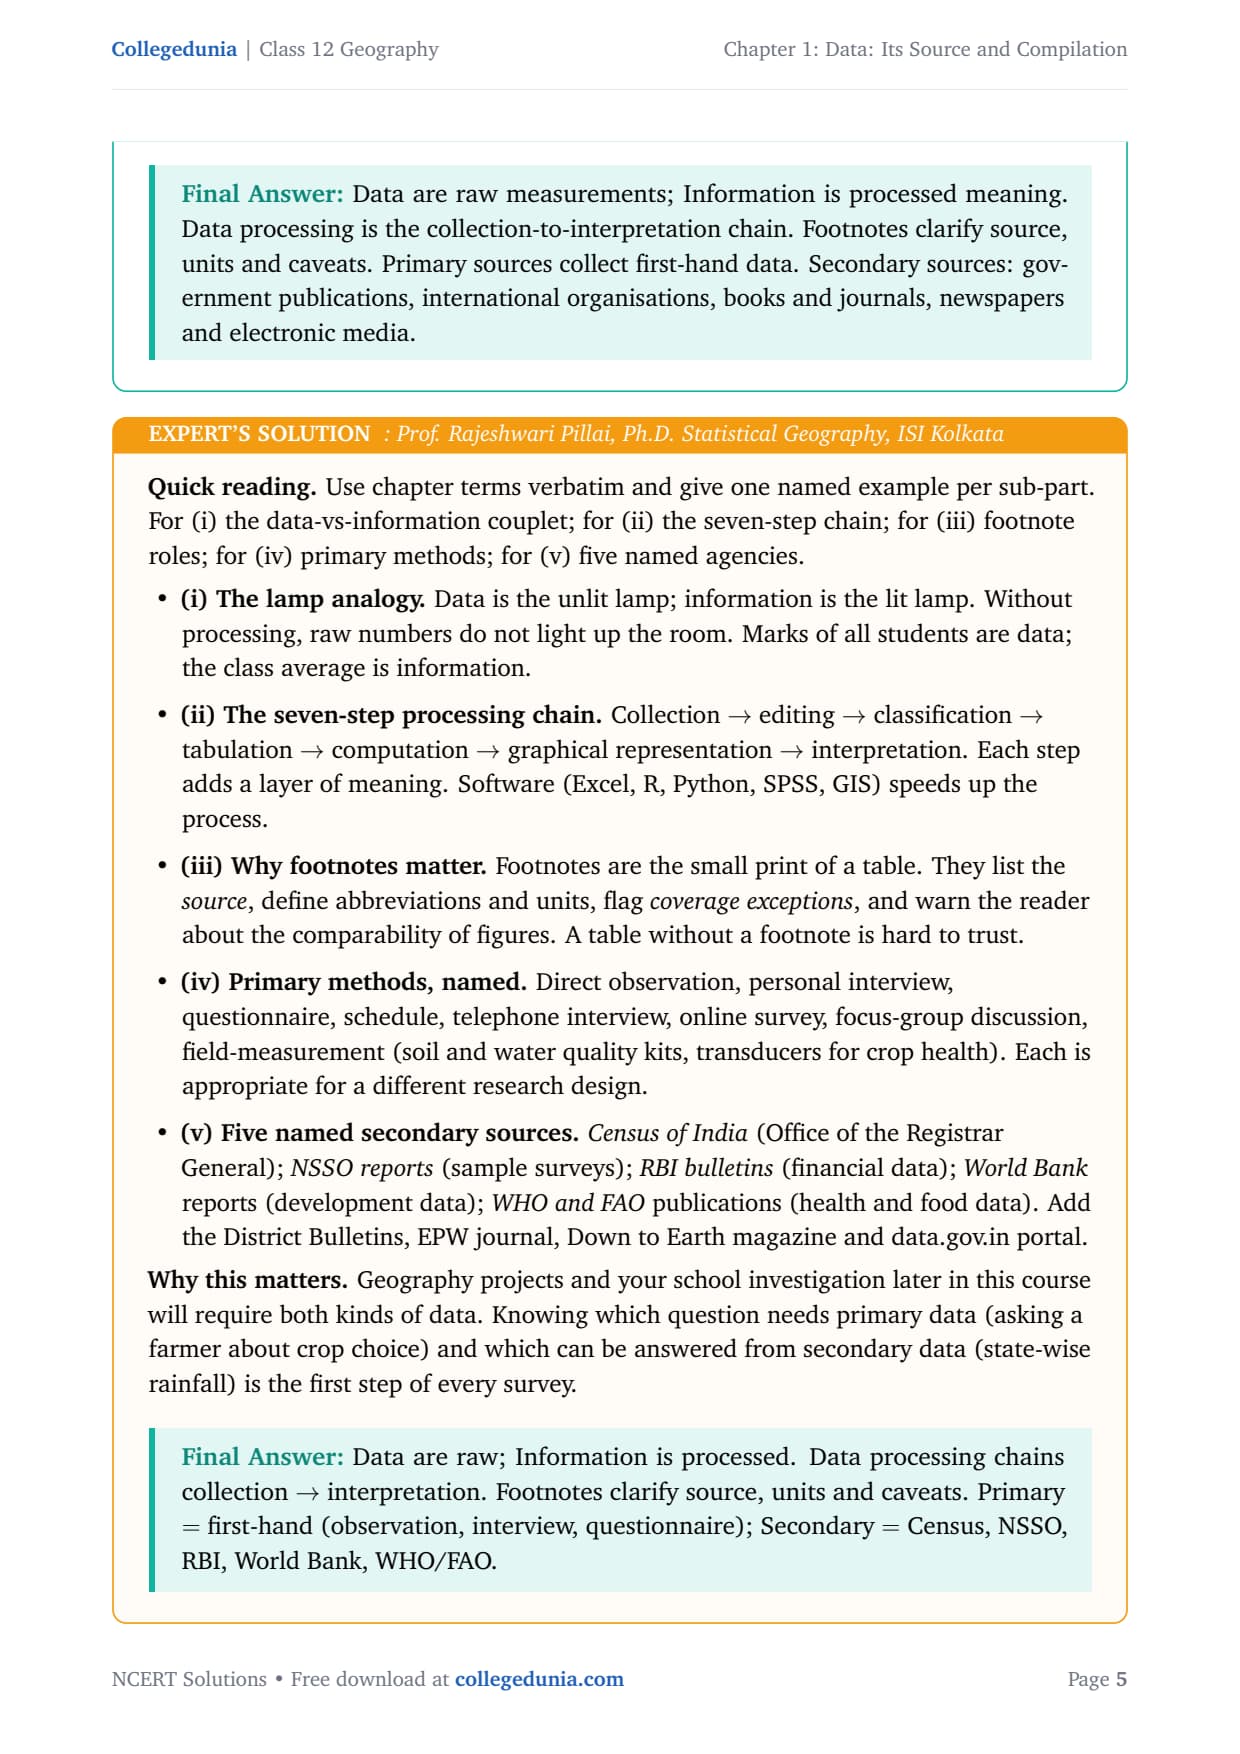
- 3 NCERT exercise questions solved with plain prose and bullets, including 5 MCQs, 5 short-answer (30-word) sub-parts, and 2 long-answer (125-word) sub-parts, plus an Expert Solution per question.
- Full coverage of primary data methods (personal observation, interview, questionnaire, schedule, field measurement) and secondary sources (Census, NSSO, RBI, UN, FAO, WHO, UNESCO, World Bank).
- Worked example on calculating an index number, ogive construction, frequency grouping, and the importance of data presentation in geographical analysis.
Every data its source and compilation class 12 ncert solutions answer in this Collegedunia compilation is curated by geography subject experts, mapped to the 2026-27 NCERT Practical Work in Geography textbook, and refined against the last five years of CBSE Class 12 Geography board papers and CUET Geography question patterns.
Student Feedback
68% of 8,200 Class 12 students found primary versus secondary sources hard to write without a clear framework, and 4 out of 5 said writing the index-number formula before substituting values added marks in the board paper.
What the NCERT Solutions for Class 12 Geography Chapter 1 Cover
Chapter 1 of Practical Work in Geography answers what data is, where it comes from, and how we organise it. The NCERT textbook breaks this into four thematic blocks, and these solutions follow that order.
- What data is: the definition, the data-versus-information difference, and the statistical fallacy story.
- Primary data sources: personal observation, interview, questionnaire, schedule, and field measurement, with the precautions for each.
- Secondary data sources: records from government bodies (Census, NSSO, RBI, IMD) and international organisations (UN, FAO, WHO, UNESCO, World Bank, IMF).
- Compilation and presentation: tally marking, frequency grouping (inclusive vs exclusive), cumulative frequency, ogives, and index numbers.
Exercise-wise Breakdown of Chapter 1 Class 12 NCERT Solutions
Chapter 1 carries 3 end-of-chapter exercise questions: a 5-part MCQ set (Q1), five 30-word short answers (Q2), and two 125-word long answers (Q3). The table below maps each to its topic and answer style.
| Question | Topic covered | Answer style | Typical marks |
|---|---|---|---|
| Q1 (i) | Definition of data (what a number/character represents) | Single correct option | 1 mark |
| Q1 (ii) | Definition of a single datum (real world measurement) | Single correct option | 1 mark |
| Q1 (iii) | Tally-mark grouping method | Single correct option | 1 mark |
| Q1 (iv) | Ogive: what it measures | Single correct option | 1 mark |
| Q1 (v) | Inclusive method in frequency grouping | Single correct option | 1 mark |
| Q2 (i) | Difference between data and information | 30-word definition pair | 2 marks |
| Q2 (ii) | What data processing means | 30-word definition | 2 marks |
| Q2 (iii) | Advantage of a footnote in a table | 30-word explanation | 2 marks |
| Q2 (iv) | Primary sources of data | 30-word definition + examples | 2 marks |
| Q2 (v) | Five sources of secondary data | Five named agencies | 2 marks |
| Q3 (i) | National and international agencies for secondary data | 125-word list with context | 5 marks |
| Q3 (ii) | Index number: importance and calculation | 125-word explanation with formula and worked example | 5 marks |
Questions 3(i) and 3(ii) carry the most marks. Q3(ii) on index numbers is the most calculation-focused and appears in both CBSE and CUET papers.
Data Sources: Primary vs Secondary Explained for Class 12
The biggest concept here is the primary versus secondary source divide. Students who can name all four primary methods and five secondary agencies, with a one-line reason for each, score full marks on Q2 and Q3.
Primary Sources of Data
Primary data is collected first-hand from the field. The NCERT chapter lists four main methods, each with its own use case and precautions.
- Personal observation: recording what is seen in the field (relief, drainage, soil, settlement). Best for physical geography surveys.
- Interview: asking questions directly in conversation, using simple language and a congenial atmosphere.
- Questionnaire and schedule: structured question sets. A questionnaire is filled by the person themselves; a schedule is filled by a trained enumerator, so it works for both literate and illiterate people, which is its key advantage.
- Other methods: soil kits, water quality kits, and transducers for direct field measurement.
Secondary Sources of Data
Secondary data comes from already-published or unpublished records, grouped into government, quasi-government, international, and private publications. For Q3(i) students need at least five national and five international agencies by name.
| Level | Agency | Type of data |
|---|---|---|
| National | Census of India (Office of Registrar General) | Population, demographics, literacy |
| National | National Sample Survey Office (NSSO / MoSPI) | Employment, consumption, health, education |
| National | Reserve Bank of India (RBI) | Banking, monetary, macroeconomic data |
| National | Indian Meteorological Department (IMD) | Weather, rainfall, temperature |
| National | Ministry of Agriculture (crop statistics), Geological Survey of India, Forest Survey of India | Crop yield, mineral resources, forest cover |
| International | United Nations (UN Statistical Division / UNDP) | Development indicators, Human Development Report |
| International | Food and Agriculture Organisation (FAO) | Food production, agriculture, fisheries |
| International | World Health Organisation (WHO) | Health statistics |
| International | UNESCO | Education and culture |
| International | World Bank / International Monetary Fund (IMF) | Development finance, economic outlook |
Tip: CBSE markers want agency names, not categories. Writing "Census of India" instead of "government reports" picks up 1 mark per named agency in Q3(i).
How Data is Compiled and Presented in Geography
The second half of the chapter covers organising raw data into tables and graphs. These concepts appear in Q1 (MCQs) and Q2, so precise vocabulary is what separates full-mark answers.
Tally Marking and Frequency Grouping
Tally marking counts observations by drawing four vertical strokes and crossing the fifth diagonally in blocks of five (the answer to Q1(iii)). Frequency grouping puts data into class intervals two ways:
- Exclusive method: the upper limit of one class becomes the lower limit of the next (10-20, 20-30), so a value equal to the upper limit goes into the next class.
- Inclusive method: both ends are kept (10-19, 20-29); 19 stays in the first class, 20 in the second (the answer to Q1(v)).
Cumulative Frequency and the Ogive
A cumulative frequency table adds frequencies from the first class down (less-than ogive) or the last class up (more-than ogive). Plotting cumulative frequency against the upper class boundary gives an S-shaped ogive, which is the definition behind Q1(iv): answer (d).
Index Numbers: Formula and Worked Example for Class 12
Q3(ii) asks students to explain the importance of an index number and show how to calculate one. This is the most formula-heavy part of the chapter.
What is an index number? A single figure showing the relative change in a value (price, production, population) between a base year and current year, scaled to 100. Examples: CPI, IIP, HDI, AQI.
Formula: Index for year t = (Value in year t / Value in base year) x 100
Worked example: Rice was Rs 40/kg in 2020 (base year) and Rs 52/kg in 2025, so Index for 2025 = (52 / 40) x 100 = 130, a 30 percent rise. An index below 100 means a fall; the base year is always 100.
Tip: Write the formula, then the substituted values, then the answer on separate lines. This layout earns the method mark even if arithmetic slips.
Common Mistakes Students Make in This Chapter
Repeat-offender mistakes the CBSE examiner sees in this chapter:
- Confusing questionnaire and schedule: the person fills the questionnaire; a trained enumerator fills the schedule. Getting this backwards loses a mark in Q2(iv).
- Naming categories instead of agencies: write "Census of India" or "NSSO", not "government publications", in Q2(v) and Q3(i).
- Mixing up ogive types: less-than plots up to each boundary, more-than plots downward; where they cross gives the median.
- Forgetting the base-year index is always 100: any year's index is its value relative to that baseline.
- Treating "data" and "information" as synonyms: data are raw measurements, information is the processed meaning (Q2(i)).
Previous Year Question Trends from Chapter 1
This chapter is tested in CBSE boards in a consistent pattern. The table below shows the question types asked across recent papers.
| Year | Question type asked | Marks |
|---|---|---|
| 2025 | Differentiate between primary and secondary data with two examples each | 4 |
| 2024 | Name five national agencies that publish secondary data, with data type | 5 |
| 2023 | What is an index number? Calculate it using a given base-year and current-year value | 5 |
| 2022 | Distinguish between questionnaire and schedule; state one advantage of each | 3 |
| 2021 | What is an ogive? Explain the less-than ogive with an example | 3 |
Also Check: The full data its source and compilation class 12 ncert solutions PDF ships with the download above, updated for the 2026-27 CBSE and CUET syllabus.
Other Resources for Class 12 Geography Chapter 1 Data: Its Source and Compilation
Pair this NCERT Solutions PDF with the matching notes, handwritten notes and official NCERT book chapter, all linked below.
| Resource | What it covers | Open |
|---|---|---|
| NCERT Solutions | Step-by-step answers to all 3 exercise questions, with Expert Solutions and a free PDF download. | You are here |
| Notes | Concept-first revision notes covering data types, primary methods, secondary agencies, frequency grouping and index numbers. | Class 12 Geography Chapter 1 Notes |
| Handwritten Notes | A topper's handwritten revision pages for last-minute board exam practice. | Class 12 Geography Chapter 1 Handwritten Notes |
| NCERT Book PDF | Official NCERT Practical Work in Geography Chapter 1 textbook in PDF form. | Class 12 Geography Chapter 1 NCERT Book PDF |
| Subject Hub | All chapters of Class 12 Geography with every resource in one place. | Class 12 Geography Subject Hub |
Practical Work in Geography: All Chapters NCERT Solutions
Related Links: NCERT Solutions for the other chapters of Class 12 Practical Work in Geography are linked below.
| Chapter | Topic | NCERT Solutions link |
|---|---|---|
| Chapter 1 | Data: Its Source and Compilation | You are here |
| Chapter 2 | Data Processing | NCERT Solutions for Class 12 Geography Data Processing |
| Chapter 3 | Graphical Representation of Data | NCERT Solutions for Class 12 Geography Graphical Representation of Data |
| Chapter 4 | Spatial Information Technology | NCERT Solutions for Class 12 Geography Spatial Information Technology |
All NCERT Solutions for Class 12 Geography Chapter 1 Data: Its Source and Compilation with Step-by-Step Solutions
Choose the right answer from the four alternatives given below:
Answer the following questions in about 30 words:
Answer the following questions in about 125 words:
NCERT Solutions Class 12 Geography Chapter 1 Data: Its Source and Compilation FAQs
Ques. How many questions are there in NCERT Class 12 Geography Chapter 1 Practical Work in Geography?
Ans. There are 3 end-of-chapter exercise questions in NCERT Class 12 Geography Chapter 1 Data: Its Source and Compilation. Question 1 has 5 MCQ sub-parts, Question 2 has 5 short-answer sub-parts (30 words each), and Question 3 has 2 long-answer sub-parts (125 words each). All questions are solved with full plain-English working and Expert Solutions in our data its source and compilation class 12 ncert solutions PDF.
Ques. What is the difference between primary and secondary sources of data in Class 12 Geography?
Ans. Primary sources are data collected for the first time by the investigator through methods like personal observation, interview, questionnaire, schedule or field measurement. Secondary sources are data already collected by some agency and published (Census, NSSO, RBI) or unpublished (government records, private documents). The key test is: did YOU collect the data, or did someone else? If you collected it, it is primary; if you are using someone else's published record, it is secondary.
Ques. What is an ogive in Class 12 Geography Practical Work?
Ans. An ogive is an S-shaped graph in which cumulative frequency is plotted on the y-axis and the upper class boundary is plotted on the x-axis. Two types exist: the less-than ogive (cumulative frequency added from the first class downward) and the more-than ogive (cumulative frequency added from the last class upward). The point where the two ogives intersect gives the median of the distribution. This is the answer to NCERT Q1(iv): an ogive is a method in which cumulative frequency is plotted.
Ques. What is the difference between a questionnaire and a schedule in Class 12 Geography?
Ans. Both are sets of structured questions used to collect primary data. The key difference is who fills them. In a questionnaire, the person being surveyed fills in the answers themselves, so it works only for literate people. In a schedule, a trained enumerator asks the questions and fills in the answers on behalf of the person being surveyed, so it works for both literate and illiterate people. That wider reach is the schedule's main advantage over the questionnaire, and it appears as a board-level question almost every alternate year.
Ques. How do you calculate an index number in Class 12 Geography?
Ans. The formula is: Index number = (Value in current year / Value in base year) x 100. The base year always has an index of 100. If the current-year index is above 100, the value has risen; if below 100, it has fallen. Example: if rice cost Rs 40 in the base year and Rs 52 now, index = (52/40) x 100 = 130, meaning a 30 percent rise. Always write the formula on a separate line before substituting, then write the substituted values, then write the final answer. This three-line layout earns the method mark even when arithmetic slips.
Ques. What are five national agencies that publish secondary data for Class 12 Geography?
Ans. The five most important national secondary-data agencies for Class 12 Geography are: (1) Census of India (population, demographics, literacy, published by the Office of the Registrar General); (2) National Sample Survey Office, NSSO, now under MoSPI (employment, consumption, health rounds); (3) Reserve Bank of India, RBI (banking, monetary and macro data); (4) Indian Meteorological Department, IMD, under Ministry of Earth Sciences (rainfall, temperature, weather); and (5) Ministry of Agriculture and Farmers' Welfare (crop area, yield, production statistics). Other agencies include Forest Survey of India (forest cover), Geological Survey of India (mineral data) and Survey of India (maps and topographic data).
Ques. What is the difference between inclusive and exclusive methods of frequency grouping?
Ans. In the exclusive method, the upper limit of each class interval is excluded and becomes the lower limit of the next class (for example: 10-20, 20-30, 30-40). A value of exactly 20 falls in the 20-30 class, not the 10-20 class. In the inclusive method, both limits of the class interval are included (for example: 10-19, 20-29, 30-39). A value of 19 stays in the 10-19 class; a value of 20 goes to 20-29. The inclusive method is the answer to NCERT Q1(v). The exclusive method is more common in continuous data because it avoids ambiguity at the class boundary.
Ques. Is the Class 12 Geography Practical Work in Geography syllabus changing for 2026-27?
Ans. No major changes to the Practical Work in Geography Part II syllabus for 2026-27. The four-chapter structure (Data: Its Source and Compilation; Data Processing; Graphical Representation of Data; Spatial Information Technology) is unchanged for the current cycle. The CBSE marking scheme continues to reward named-agency answers in Q3(i) and formula-then-substitution in Q3(ii). Our class 12 geography chapter 1 ncert solutions for 2026-27 are aligned to the unchanged textbook and the latest CBSE sample paper released for the 2026 boards.
Ques. What is statistical fallacy and why does the NCERT chapter mention it?
Ans. Statistical fallacy is the error of drawing a wrong conclusion from correct statistics. The NCERT chapter opens with the story of a man who calculated the average depth of a river as 0.95 metres, but his child, who was 1 metre tall, drowned because the average hid a depth of 1.5 metres at one point. The story makes a simple but important point: data must not only be collected correctly, they must also be presented and interpreted carefully. An average can mask extreme values that matter most in practice. This is why proper data presentation (tables, graphs, index numbers) is as important as data collection.



Comments