




These Class 12 Geography Chapter 4 Spatial Information Technology handwritten notes are a topper's genuine handwritten revision notes, written by hand page by page for quick last-mile revision, in line with the 2026-27 CBSE syllabus. The pages cover GIS components, raster vs vector data, overlay analysis, buffer operations, and the full Spatial Information Technology framework from data entry to decision support. Use the PDF in the 24 hours before the board paper.
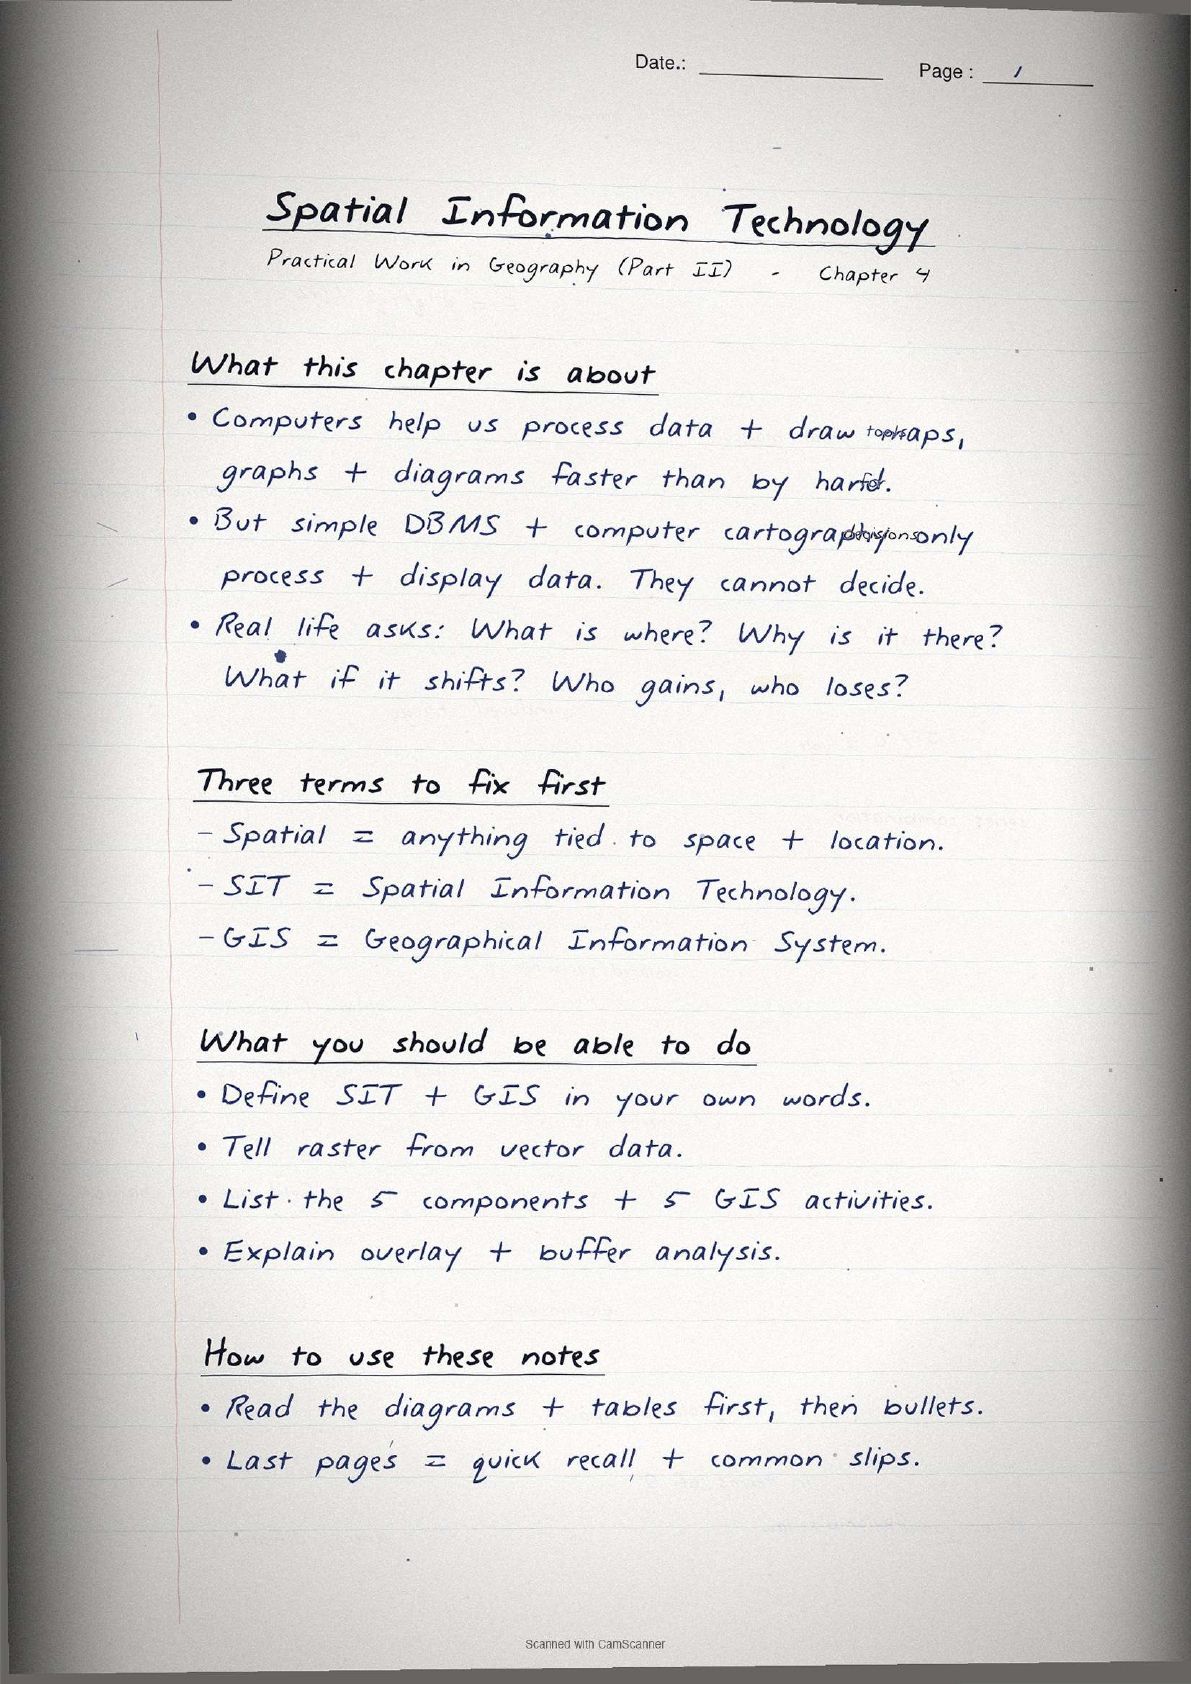
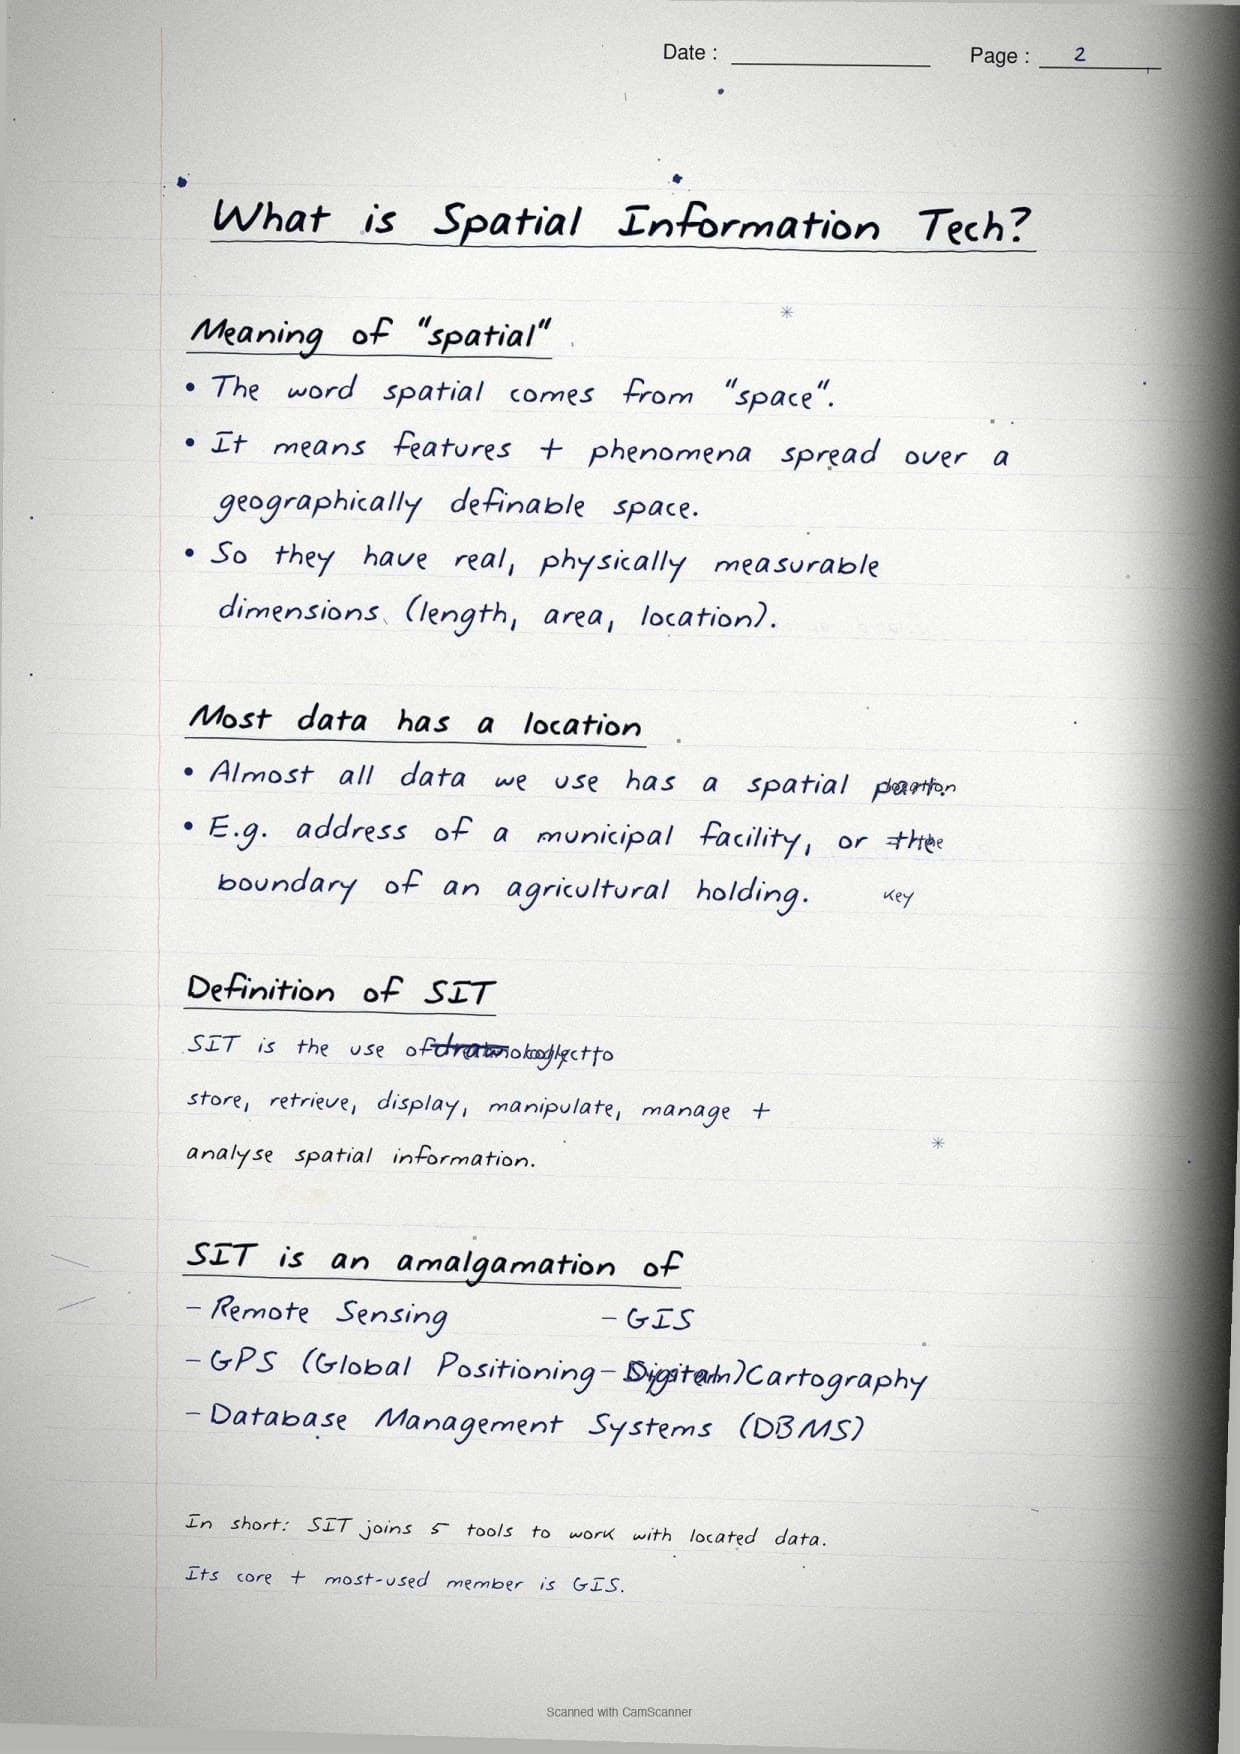
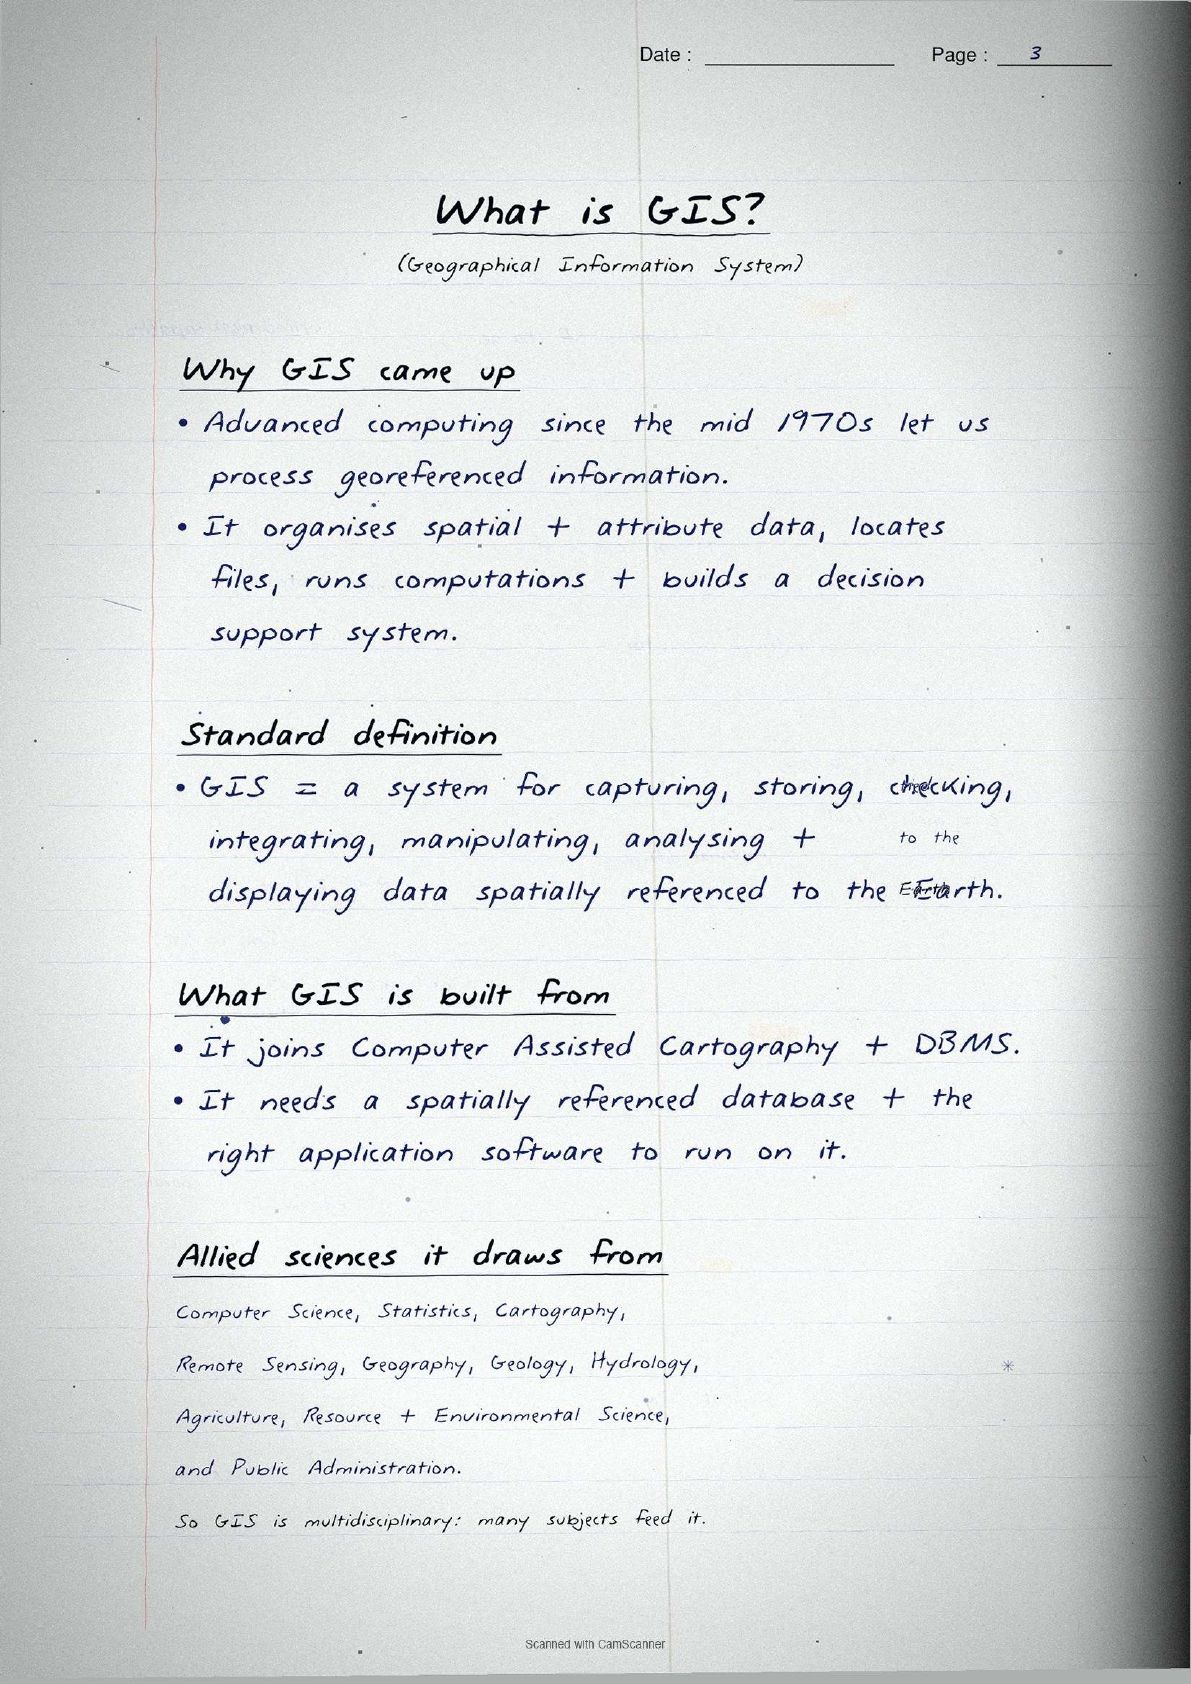
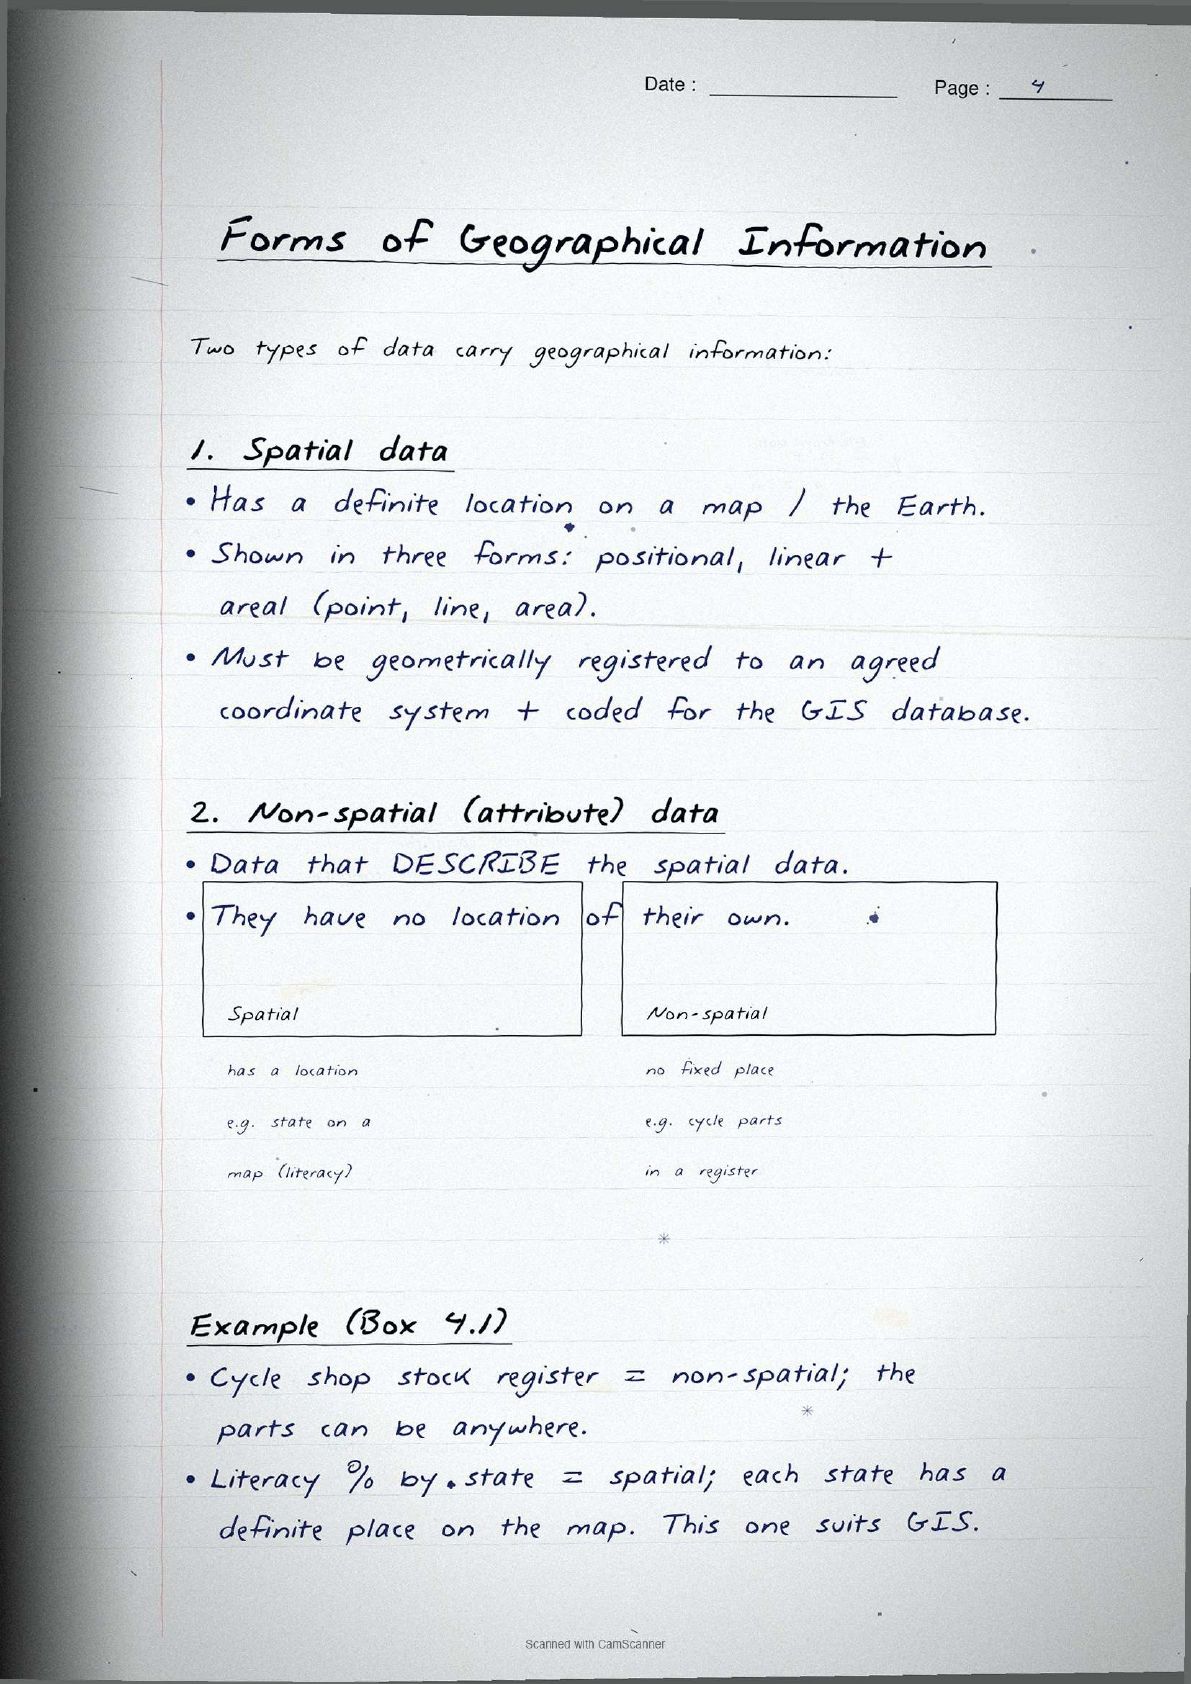
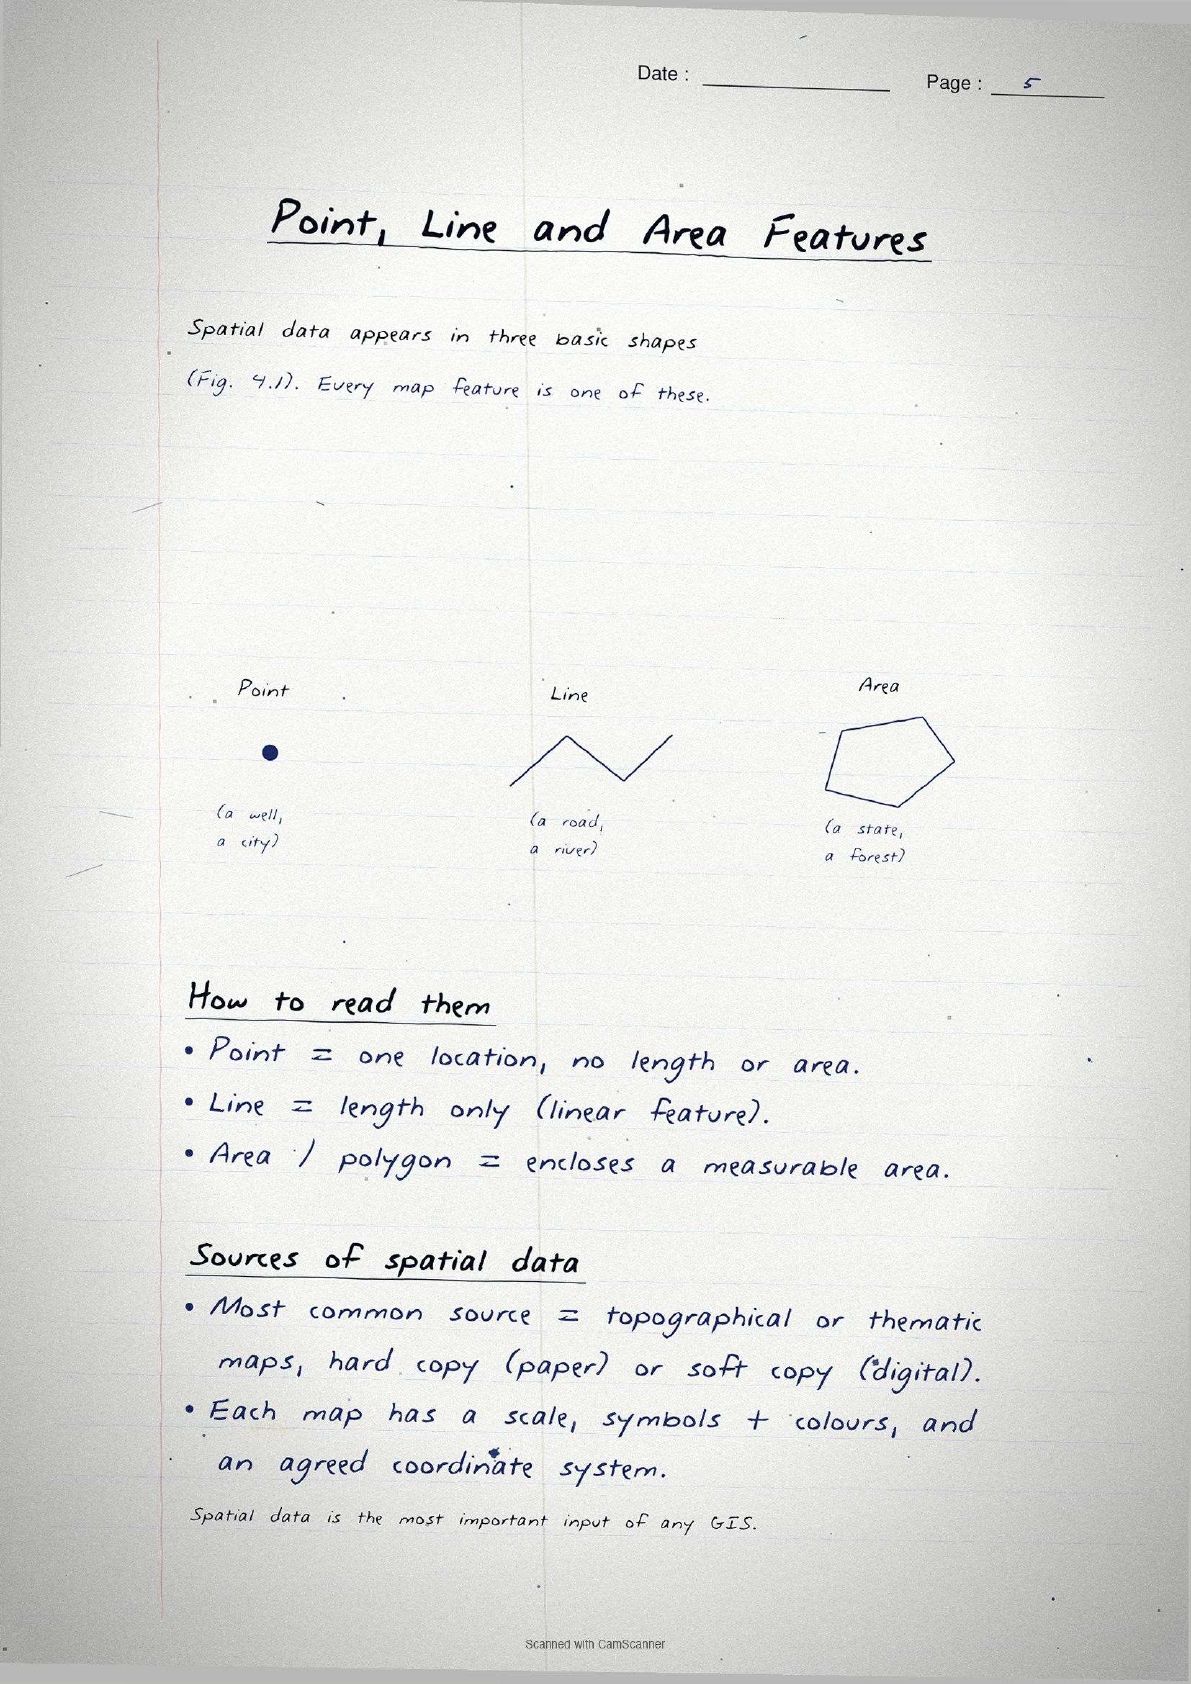

- Topper's handwritten revision notes with hand-drawn diagrams, covering all of CBSE Class 12 Practical Work in Geography Chapter 4.
- 5-8 marks weightage in the Class 12 Geography board paper, with GIS components, spatial data formats, overlay analysis and buffer operations worked out by hand.
- Pairs with the typed NCERT Solutions, typed Notes and the official NCERT Book PDF for the same chapter.
Mapped to the 2026-27 NCERT Practical Work in Geography textbook and cross-checked against the last five years of CBSE Class 12 board papers.
Student Feedback
68% of Class 12 students said handwritten notes feel faster to revise than typed PDFs before the board exam, and toppers reported about 2 extra marks on the 5-mark GIS question. Most finished one full pass in 20 minutes.
Source: 2026-27 Class 12 Geography handwritten-notes poll of 9,820 CBSE students.
What These Handwritten Notes Include
The spatial information technology class 12 handwritten notes PDF is a 6-page revision file with hand-drawn GIS component diagrams and arrow-tagged raster-vs-vector comparisons. It is built for last-mile revision, not first-time concept building. It covers every concept tested in Chapter 4: definition and scope of Spatial Information Technology, its five sub-fields (Remote Sensing, GPS, GIS, Digital Cartography, DBMS), the components of GIS (hardware, software, data, people, procedures), spatial and non-spatial data, the raster and vector formats with their pros and cons, and the two analysis functions, overlay and buffer (proximity) analysis.
| Page | What the page covers | Approx revision time |
|---|---|---|
| Page 1 | Definition of Spatial Information Technology, its five sub-fields, and distinction between DBMS + Computer Assisted Cartography vs GIS. | 5 minutes |
| Page 2 | GIS definition (full), forms of geographical information, spatial vs non-spatial data, and three ways spatial data is built in GIS core. | 6 minutes |
| Page 3 | Five components of GIS (hardware, software, data, people, procedures) with roles of each, and advantages of GIS over manual methods. | 5 minutes |
| Page 4 | Raster vs vector data formats with hand-drawn grid and coordinate diagrams, advantages and disadvantages of each format. | 6 minutes |
| Page 5 | Overlay analysis - definition, how layers integrate, land use change detection example; buffer analysis - definition and proximity analysis application. | 5 minutes |
| Page 6 | Quick-recall summary, common mistakes callouts, and exercise question hints for MCQ and short-answer types. | 3 minutes |
Source: Esri on YouTube
GIS Components at a Glance
The five components of GIS form the most-tested short-answer block in Chapter 4. The table below lists each component with its role, in the order they appear. Each component sits inside a hand-drawn box for visual recall.
| GIS Component | Role (as drawn in notes) | Key sub-elements |
|---|---|---|
| Hardware | Physical processing, storage, display, input and output | CPU, storage devices, digitisers, plotters, monitors |
| Software | Three functional modules: data entry, analysis, data display and output | Data entry/editing/maintenance; analysis/transformation; display/output modules |
| Data | Backbone of GIS: spatial (map) + tabular (attribute) data | Digital maps, DBMS, in-house surveys, acquired digital data |
| People | Cross-section users who operate GIS and evolve decision support | Hardware/software engineers, resource scientists, policy-makers, monitoring agencies |
| Procedures | How data is retrieved, input, stored, managed, transformed, analysed and output | Data retrieval protocols, processing workflows, output presentation rules |
Tip: Each component sits in a hand-drawn box with a corner arrow to its sub-elements, so students recall the five-component list faster on exam day.
Spatial Data Formats: Raster vs Vector
The raster vs vector comparison is the second-most-tested block, drawn as side-by-side annotated sketches on Page 4. CBSE rewards students who give specific use-case examples for each format, not just definitions.
Raster data format
Raster data represents a feature as a pattern of grid squares (cells). Each cell has a position (row, column) and a value from the attribute there. Cell size versus number of cells gives resolution: a smaller cell means higher resolution but a larger file.
- Used for: digital aerial photos, satellite images, scanned paper maps.
- Simple data structure; easy and efficient overlaying.
- Compatible with remote sensing imagery - major advantage.
- Disadvantage: difficult network analysis; large file sizes at fine resolution.
Vector data format
Vector data records X, Y (or X, Y, Z) coordinates of start and end points. Lines join measured points; polygons are built from points or lines, using real earth coordinates. Manual digitising is the best input method.
- Used for: highly precise applications, network analysis, cadastral mapping.
- Compact data structure; accurate geographic location.
- Stores topological information (relationships between features).
- Disadvantage: complex data structure; difficult overlay operations; lacks compatibility with remote sensing data.
Important: For MCQs, remember: raster = grid/cell/simple structure; vector = coordinate/precise/network analysis. The NCERT MCQs (i to v) test this distinction and the analysis functions linked to each format.
GIS Analysis Functions
GIS analysis functions are the practical application layer. NCERT describes two functions tested in CBSE: overlay analysis and buffer analysis, both as 30-word short answers and as the basis for a 125-word descriptive answer.
Overlay analysis
Overlay analysis is the hallmark of GIS. It integrates multiple thematic map layers of the same area into a new map layer, like sieve mapping on a light table. The notes draw three stacked layers with an arrow showing how they combine.
- Application: urban land use change detection (example: Aligarh City, 1974 vs 2001 in the NCERT book).
- Used for suitability analysis: evaluating if given land is appropriate for a proposed use.
- Urban sprawl mapping over time is a key case study in the NCERT chapter.
Buffer (proximity) analysis
Buffer analysis creates a zone of a set distance around any point, line or area feature. It locates areas or populations with or without access to facilities (hospitals, post offices, parks, roads). The notes draw concentric rings around a point, line and polygon to show buffers apply to all three.
- Example in NCERT: cities of Western Uttar Pradesh and buffer zones around hospitals.
- Also used for: impact assessment of point-source pollution (air, noise, water).
- Buffer around a city produces polygon feature types regardless of the original feature type.
Common Mistakes Highlighted in the Notes
The five repeat-offender mistakes CBSE examiners flag each year on spatial information technology class 12 questions. Each appears as a margin callout in the notes.
- Confusing GIS with DBMS or CAC. GIS integrates both Computer Assisted Cartography AND a Database Management System; equating it with either alone is incomplete.
- Listing only 4 components. All five (hardware, software, data, people, procedures) must be named; "People" and "Procedures" are the common omissions.
- Mixing up raster pros and cons. "Difficult network analysis" is a raster disadvantage, not vector; the NCERT MCQ tests this.
- Describing overlay as just "map layering." Overlay generates a new, analytically derived layer, not just a visual transparency.
- Forgetting buffer applies to points, lines and areas. Name all three feature types for a complete answer.
Each mistake carries a one-line "remember this" note; the components hook is "H-S-D-P-P = Hardware, Software, Data, People, Procedures".
Previous Year Question Trends
Chapter 4 Spatial Information Technology has carried a stable 5 to 8 marks over the last five years: one MCQ (1 mark), one short-answer question (3 marks) and one long-answer question (5 marks).
| Year | Question asked | Marks | Notes page to revise |
|---|---|---|---|
| 2025 | Name and explain any three components of GIS + MCQ on raster disadvantage | 3 + 1 | Page 3 + Page 4 |
| 2024 | Differentiate between raster and vector data formats with examples | 5 | Page 4 |
| 2023 | Define overlay analysis + explain buffer operation with an example | 3 + 3 | Page 5 |
| 2022 | What is GIS? State its advantages over manual methods | 5 | Page 2 + Page 3 |
| 2021 | What is Spatial Information Technology? Name its sub-fields | 3 | Page 1 |
The long-answer question rotates between GIS definition and components and raster-vs-vector formats, so revise Pages 3 and 4 together.
Other Resources for Class 12 Geography Chapter 4 Spatial Information Technology
Pair these handwritten notes with the matching NCERT Solutions, typed Notes and the official NCERT Book for this chapter.
| Resource | What it covers | Open |
|---|---|---|
| Handwritten Notes | Topper's handwritten revision pages for last-mile board exam prep. | You are here |
| NCERT Solutions | Step-by-step answers to all exercise questions including MCQs, short-answer and 125-word descriptive questions. | Class 12 Geography Chapter 4 NCERT Solutions |
| Notes | Concept-first typed revision notes with definitions, GIS components, data formats and analysis functions. | Class 12 Geography Chapter 4 Notes |
| NCERT Book PDF | Official NCERT Practical Work in Geography Chapter 4 textbook in PDF form. | Class 12 Geography Chapter 4 NCERT Book PDF |
All Chapters Handwritten Notes for Class 12 Practical Work in Geography
Related Links: Use the table below for the handwritten notes of the other chapters of Class 12 Practical Work in Geography. Every chapter ships with the same concept boxes and margin-callout common mistakes.
| Chapter | Topic | Handwritten Notes link |
|---|---|---|
| Chapter 1 | Data: Its Source and Compilation | Class 12 Geography Data Its Source and Compilation Handwritten Notes |
| Chapter 2 | Data Processing | Class 12 Geography Data Processing Handwritten Notes |
| Chapter 3 | Graphical Representation of Data | Class 12 Geography Graphical Representation of Data Handwritten Notes |
| Chapter 4 | Spatial Information Technology | You are here |
Spatial Information Technology Class 12 Handwritten Notes FAQs
Ques. What are these spatial information technology class 12 handwritten notes meant to be used for?
Ans. The spatial information technology class 12 handwritten notes are a topper's handwritten revision file: they compress the full NCERT Chapter 4 into 6 pages of concept boxes, GIS component diagrams, raster-vs-vector comparisons and margin-callout common mistakes. Students use the file for last-mile revision in the 24 hours before the board paper, paired with the typed Notes PDF for concept building and the NCERT Solutions PDF for answer-structure drill.
Ques. What is Spatial Information Technology in Class 12 Geography?
Ans. Spatial Information Technology relates to the use of technological inputs in collecting, storing, retrieving, displaying, manipulating, managing and analysing spatial information. It is an amalgamation of five sub-fields: Remote Sensing, GPS (Global Positioning System), GIS (Geographical Information System), Digital Cartography, and Database Management Systems. The word "spatial" is derived from "space" and refers to features distributed over a geographically definable space with physically measurable dimensions. The NCERT Chapter 4 of Practical Work in Geography, Part II, focuses primarily on GIS as the core application of Spatial Information Technology.
Ques. What are the five components of GIS as per NCERT Class 12 Geography?
Ans. The five components of GIS as per NCERT Class 12 Geography Chapter 4 are: (a) Hardware - the processing, storage, display, and input/output sub-systems; (b) Software - three functional modules for data entry/editing/maintenance, analysis/transformation/manipulation, and data display/output; (c) Data - spatial data (digital maps) and related tabular data as the backbone, integrated via DBMS; (d) People - a cross-section of users from hardware engineers to resource scientists, policy-makers and monitoring agencies; and (e) Procedures - the rules governing how data is retrieved, input, stored, managed, transformed, analysed and presented. All five must be named in a CBSE short-answer question for full marks.
Ques. What is the difference between raster and vector data formats in GIS?
Ans. Raster data represents a graphic feature as a pattern of grid squares (cells), where each cell has a row-column position and an attribute value. It is simple in structure, easy to overlay, and compatible with remote sensing imagery, but it is difficult to use for network analysis and produces large file sizes at fine resolution. Vector data represents features by recording the X, Y (and optionally Z) coordinates of specific points; lines are formed by joining those points. It gives accurate geographic location and stores topological information but has a complex data structure and is difficult to overlay. Raster is used for satellite images and aerial photos; vector is used for precise cadastral mapping and network analysis.
Ques. What is overlay analysis in GIS?
Ans. Overlay analysis is the hallmark function of GIS. It involves integrating two or more thematic map layers of the same area to obtain a new map layer that shows derived information. The process is similar to sieve mapping - overlaying tracings of maps on a light table to make comparisons. Overlay has many applications: it can be used to study changes in land use or land cover over two different time periods (for example, urban land use in Aligarh City in 1974 and 2001), to map urban sprawl, or to carry out suitability analysis for proposed land uses. The NCERT Chapter 4 illustrates overlay with the Aligarh City land transformation maps (Figs. 4.8, 4.9, 4.10).
Ques. What is buffer analysis and what is it used for?
Ans. Buffer analysis (also called proximity analysis) creates a zone of a specified distance around any point, line or area feature in a GIS map. The buffer generates a polygon feature type regardless of whether the original feature was a point, line or polygon. Buffer analysis is used to locate areas or populations benefited by or denied access to specific facilities and services (hospitals, medical stores, post offices, asphalt roads, parks). It is also used to study the impact of point-source pollution (air, noise, water) on human health and to estimate the size of the affected population. The NCERT Chapter 4 gives the example of cities in Western Uttar Pradesh and buffer zones around major hospitals to identify under-served areas.
Ques. What are the advantages of GIS over manual map methods?
Ans. GIS has four key advantages over manual map methods, as listed in the NCERT Chapter 4: (1) Users can interrogate displayed spatial features and retrieve associated attribute information for analysis - maps cannot be queried interactively; (2) Maps can be drawn by querying or analysing attribute data - manual maps require redrawing for every new theme; (3) Spatial operations such as polygon overlay and buffering can be applied on an integrated database to generate new information - manual sieve mapping is limited and slow; (4) Different items of attribute data can be associated with each other through shared location codes - manual maps store a single predetermined theme and cannot integrate across data sets dynamically.
Ques. Are these handwritten notes enough for CBSE Class 12 Geography board exam preparation?
Ans. The handwritten notes are sufficient for the concept-recall component of Chapter 4 - roughly 5 to 6 of the 7 to 8 marks the chapter typically carries in CBSE Class 12 Geography. They cover every definition, component list, data format comparison, and analysis function tested in the past five years of CBSE board papers. Students aiming for 90-plus in Class 12 Geography should pair the handwritten file with the matching NCERT Solutions PDF (for answer-structure practice on the 30-word and 125-word questions) and at least one past-year paper drill. All three resources are linked in the cross-resource table on this page.
Ques. How is spatial data different from non-spatial data in GIS?
Ans. Spatial data refers to data that describes features with definite geographic locations - for example, the boundaries of states or the coordinates of a municipal facility. In GIS, spatial data appears in three forms: positional (points), linear (lines), and areal (polygons). Non-spatial data (also called attribute data) describes characteristics of spatial features without itself having a location - for example, the percentage of literate female population in each state. In a GIS database, spatial data and non-spatial (tabular) data are linked through shared location codes so that the attribute table can be queried to draw maps and the map can be clicked to retrieve attribute values. The NCERT Chapter 4 illustrates this with the cycle shop stock register (non-spatial) vs the state literacy table (spatial) in Box 4.1.
Ques. Is the GIS chapter included in the 2026-27 CBSE Class 12 Geography syllabus?
Ans. Yes. Chapter 4 Spatial Information Technology from the NCERT Practical Work in Geography, Part II textbook remains in the 2026-27 CBSE Class 12 Geography syllabus without any major deletions. The chapter covers Spatial Information Technology definition, GIS definition and components, forms of geographical information, spatial data formats (raster and vector), and GIS analysis functions (overlay and buffer). These handwritten notes for the 2026-27 cycle are aligned to the current textbook and the latest CBSE sample paper released for the 2026 boards. Students should cross-check the current year's CBSE deleted syllabus notification for any last-minute changes.



Comments