




These Class 12 Geography Chapter 1 Data Its Source and Compilation notes cover every NCERT definition, primary and secondary data sources, classification and tabulation, and index numbers, all aligned to the 2026-27 syllabus, built to take students back to chapter-fluency in about half an hour before the exam.
- Concept-first revision: what data is, why geography needs it, and how primary and secondary sources differ.
- Every key term, including tabulation, classification, tally marks, frequency distribution, ogive and index numbers.
- Cross-pointers to the matching NCERT Solutions, Handwritten Notes and NCERT Book PDF.
Written by Collegedunia geography subject experts, mapped to the 2026-27 NCERT Practical Work in Geography Part II textbook, and checked against recent CBSE board papers and CUET Geography patterns.
Student Feedback
71% of Class 12 students said telling primary from secondary data was the most-confused area, and 3 out of 4 rated classification and tabulation as the part most worth revising from a printable sheet. Pairing these notes with the NCERT Solutions PDF added 2 to 3 marks per answer in mock tests.
Source: 2026-27 Class 12 Geography student poll. Sample of 9,200 students from CBSE schools across 12 states.
Quick Concept Recap: Data and Geography at a Glance
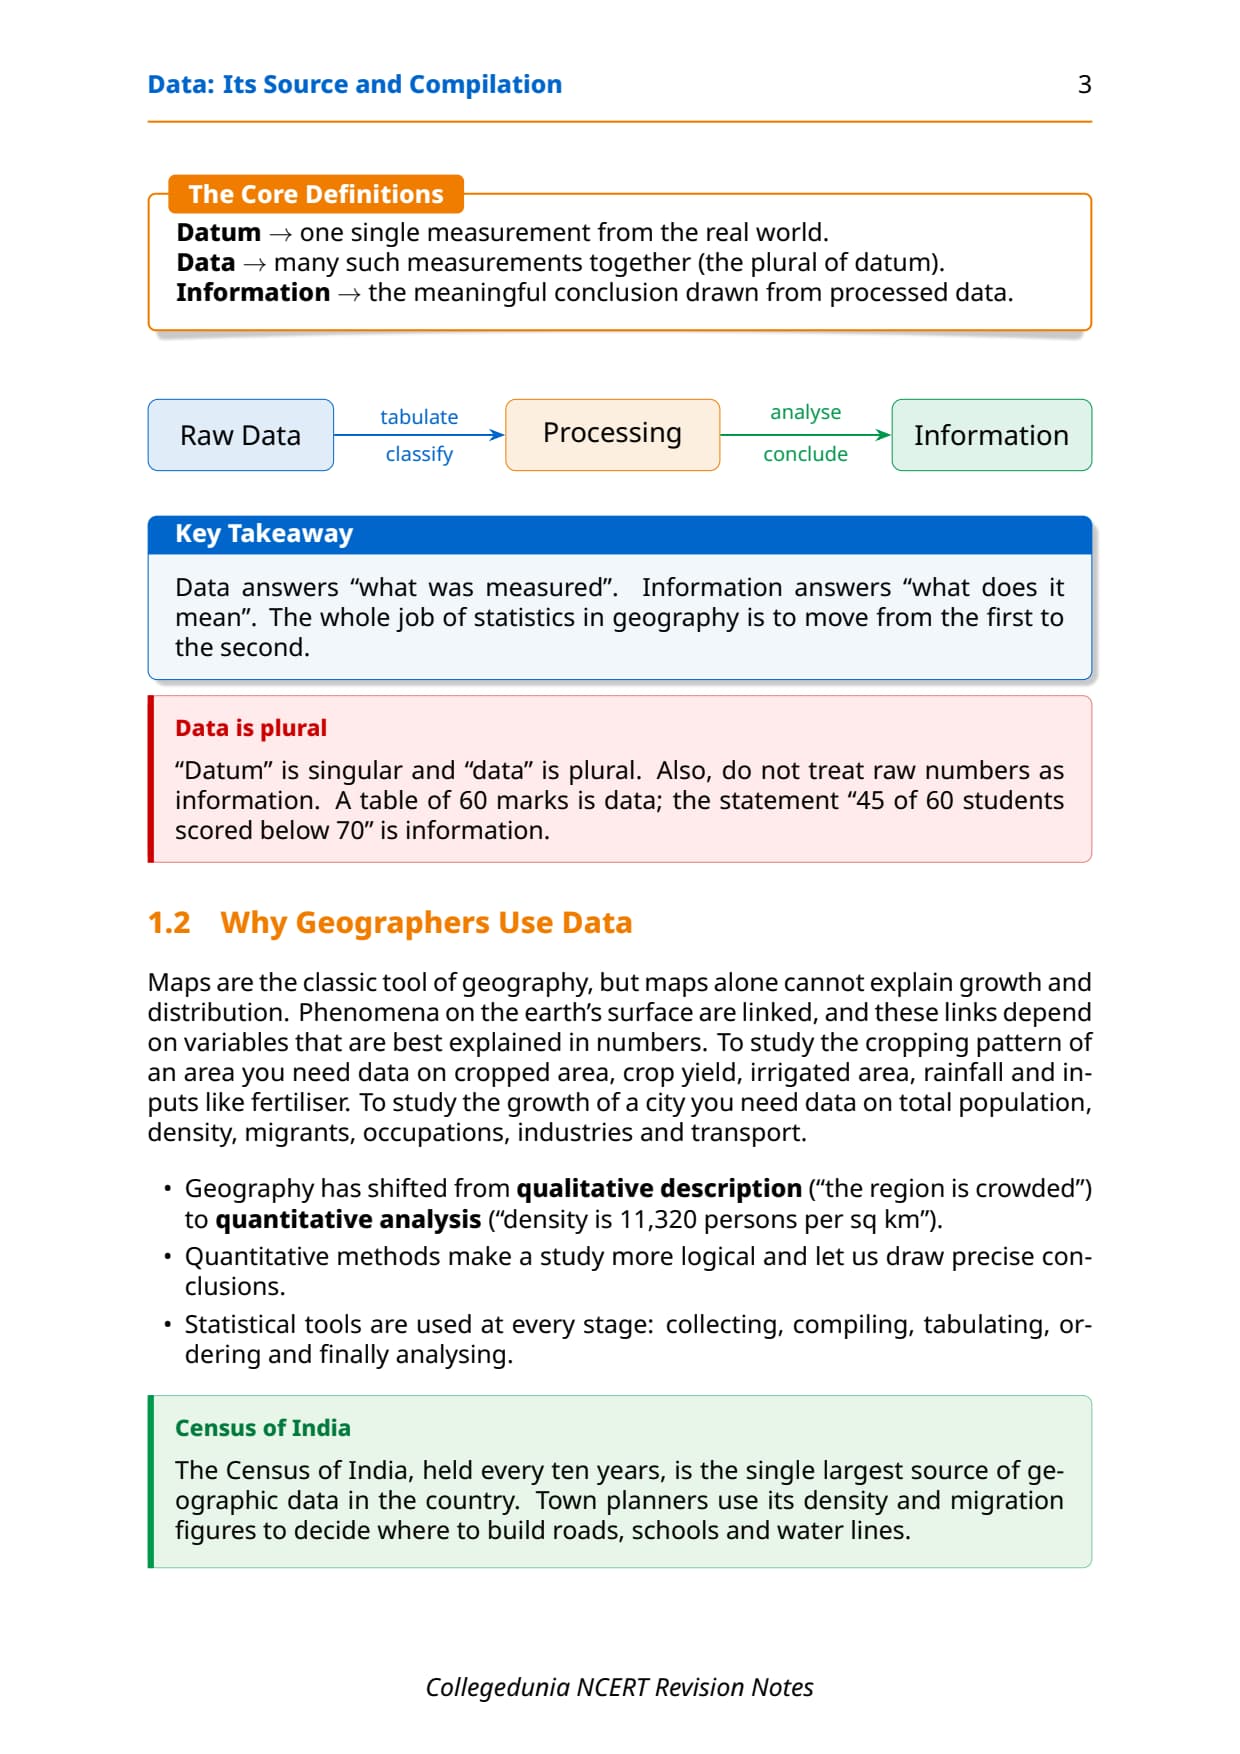
Data are numbers representing real-world measurements; a single measurement is a datum. Geography needs data because spatial phenomena like population density, crop yield and rainfall can only be compared when expressed numerically.
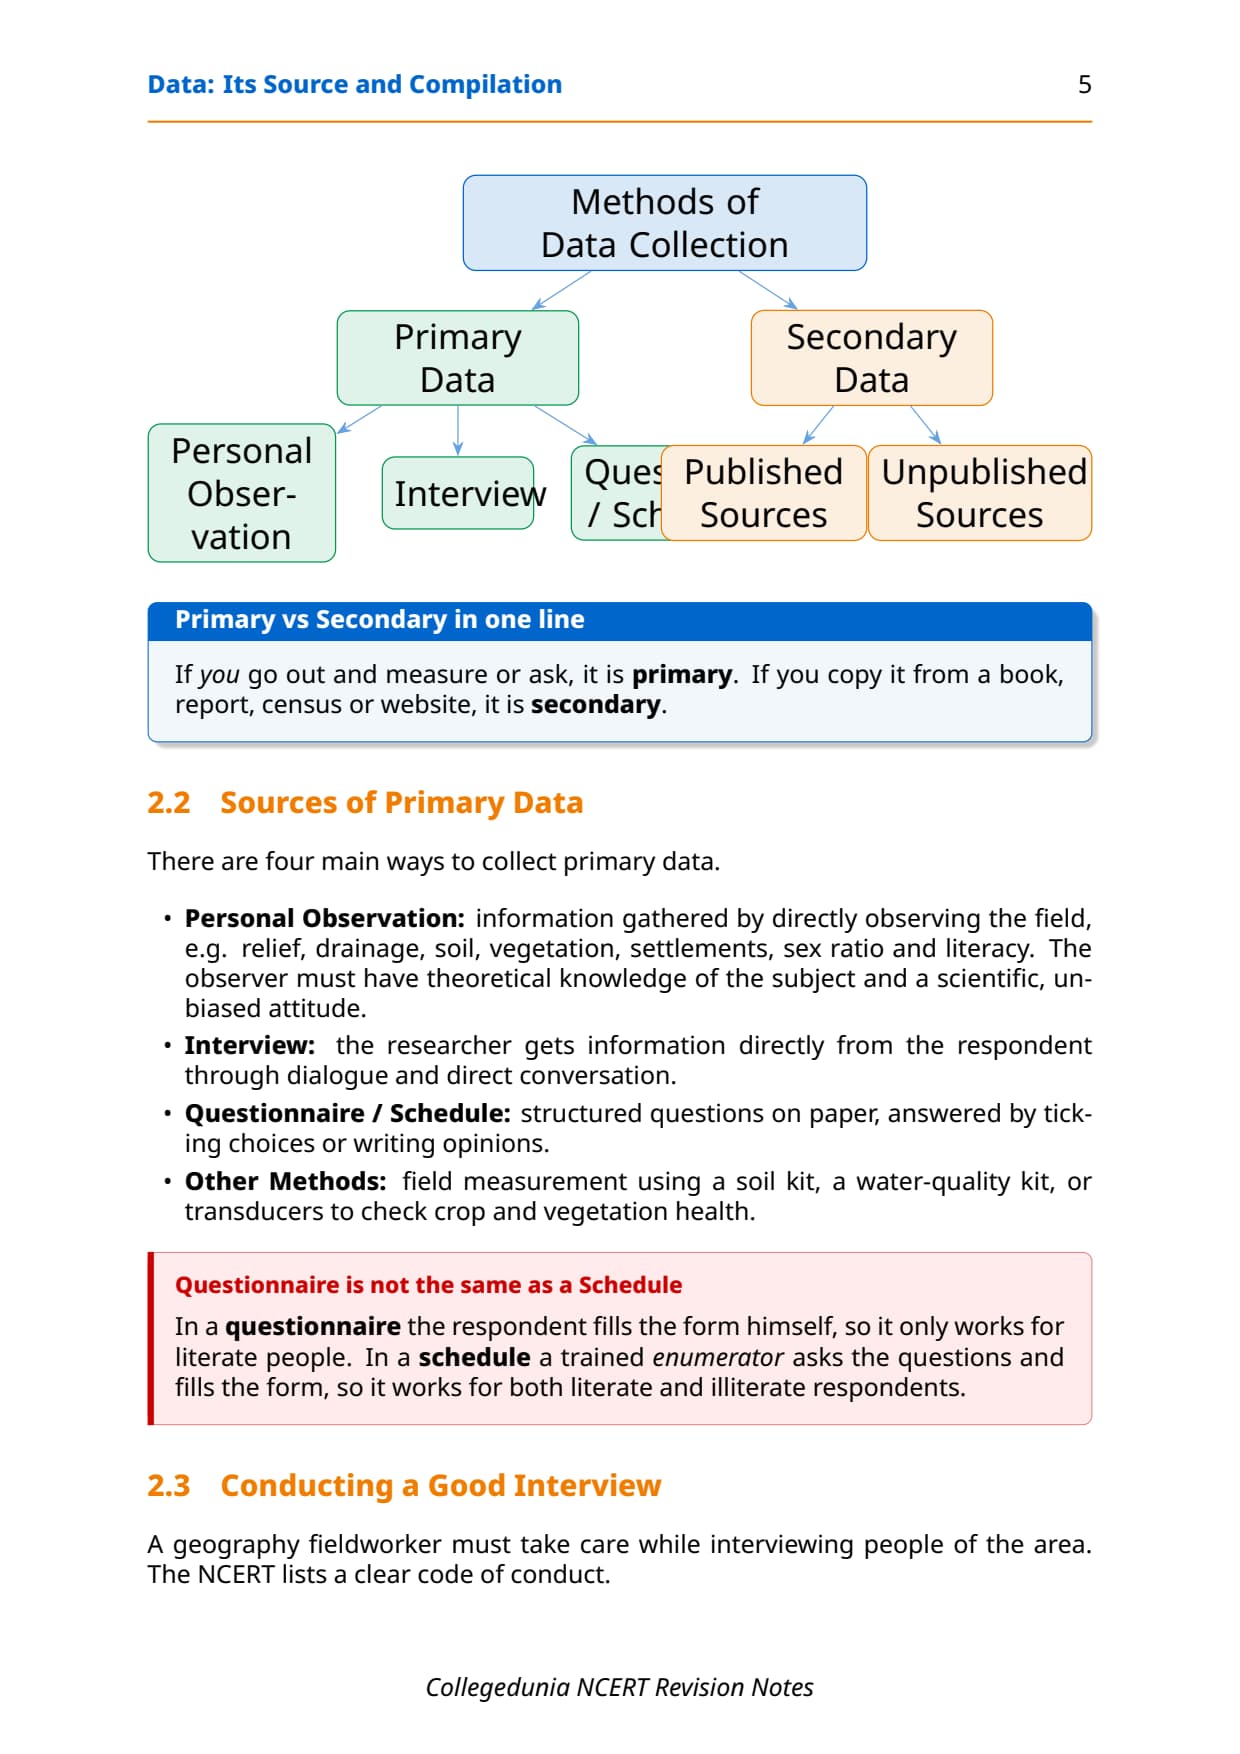
- Two categories of data: primary (collected first-hand) and secondary (from records compiled by someone else).
- Four primary methods: personal observation, interview, questionnaire or schedule, and field methods like soil kits and transducers.
- Processing pipeline: raw data is classified, tabulated into frequency distributions, presented as absolute values, percentages or index numbers, then analysed.
Read these notes first, then use the matching NCERT Solutions for Class 12 Geography Chapter 1 for the exercise drill.
Source: Examrace (UPSC, NET, NCERT, ICSE ...) on YouTube
Key Definitions for Data Its Source and Compilation Class 12
Every short-answer question begins with a definition. The definitions below are written in the exact one-line form CBSE markers expect.
| Term | One-line definition | NCERT section pointer |
|---|---|---|
| Data | Numbers that represent measurements from the real world; a single measurement is called a datum. | Section 1.1 |
| Information | A meaningful answer to a query, derived algorithmically or logically from multiple data points. | Section 1.1 |
| Primary Data | Data collected for the first time by an individual, institution or group of individuals through direct field work. | Section 1.2 |
| Secondary Data | Data obtained from any published or unpublished source compiled by someone other than the current user. | Section 1.2 |
| Personal Observation | Collection of information by direct field survey about relief, drainage, soil, vegetation or population characteristics. | Section 1.2 |
| Questionnaire | A printed set of questions with possible answers, filled in by the survey participant; useful for literate populations over large areas. | Section 1.2 |
| Schedule | Similar to a questionnaire but filled in by a trained enumerator; can capture data from both literate and illiterate survey participants. | Section 1.2 |
| Raw Data | Data in their original unprocessed form, presenting a jumble of figures with little immediate meaning. | Section 1.3 |
| Statistical Table | A systematic arrangement of data in rows and columns that simplifies presentation and facilitates comparisons. | Section 1.3 |
| Index Number | A statistical measure designed to show changes in a variable or group of related variables with respect to time, location or other characteristics, relative to a base period set at 100. | Section 1.3 |
These ten definitions cover roughly 8 of 10 short-answer questions CBSE has asked since 2021.
Primary Sources of Data in Geography
Primary sources collect information directly from the field, so the researcher controls its accuracy. NCERT describes four main methods.
- Personal Observation: recording relief, drainage, soil, vegetation, settlement, sex ratio or literacy through fieldwork. First-hand and accurate, but slow and limited to accessible areas.
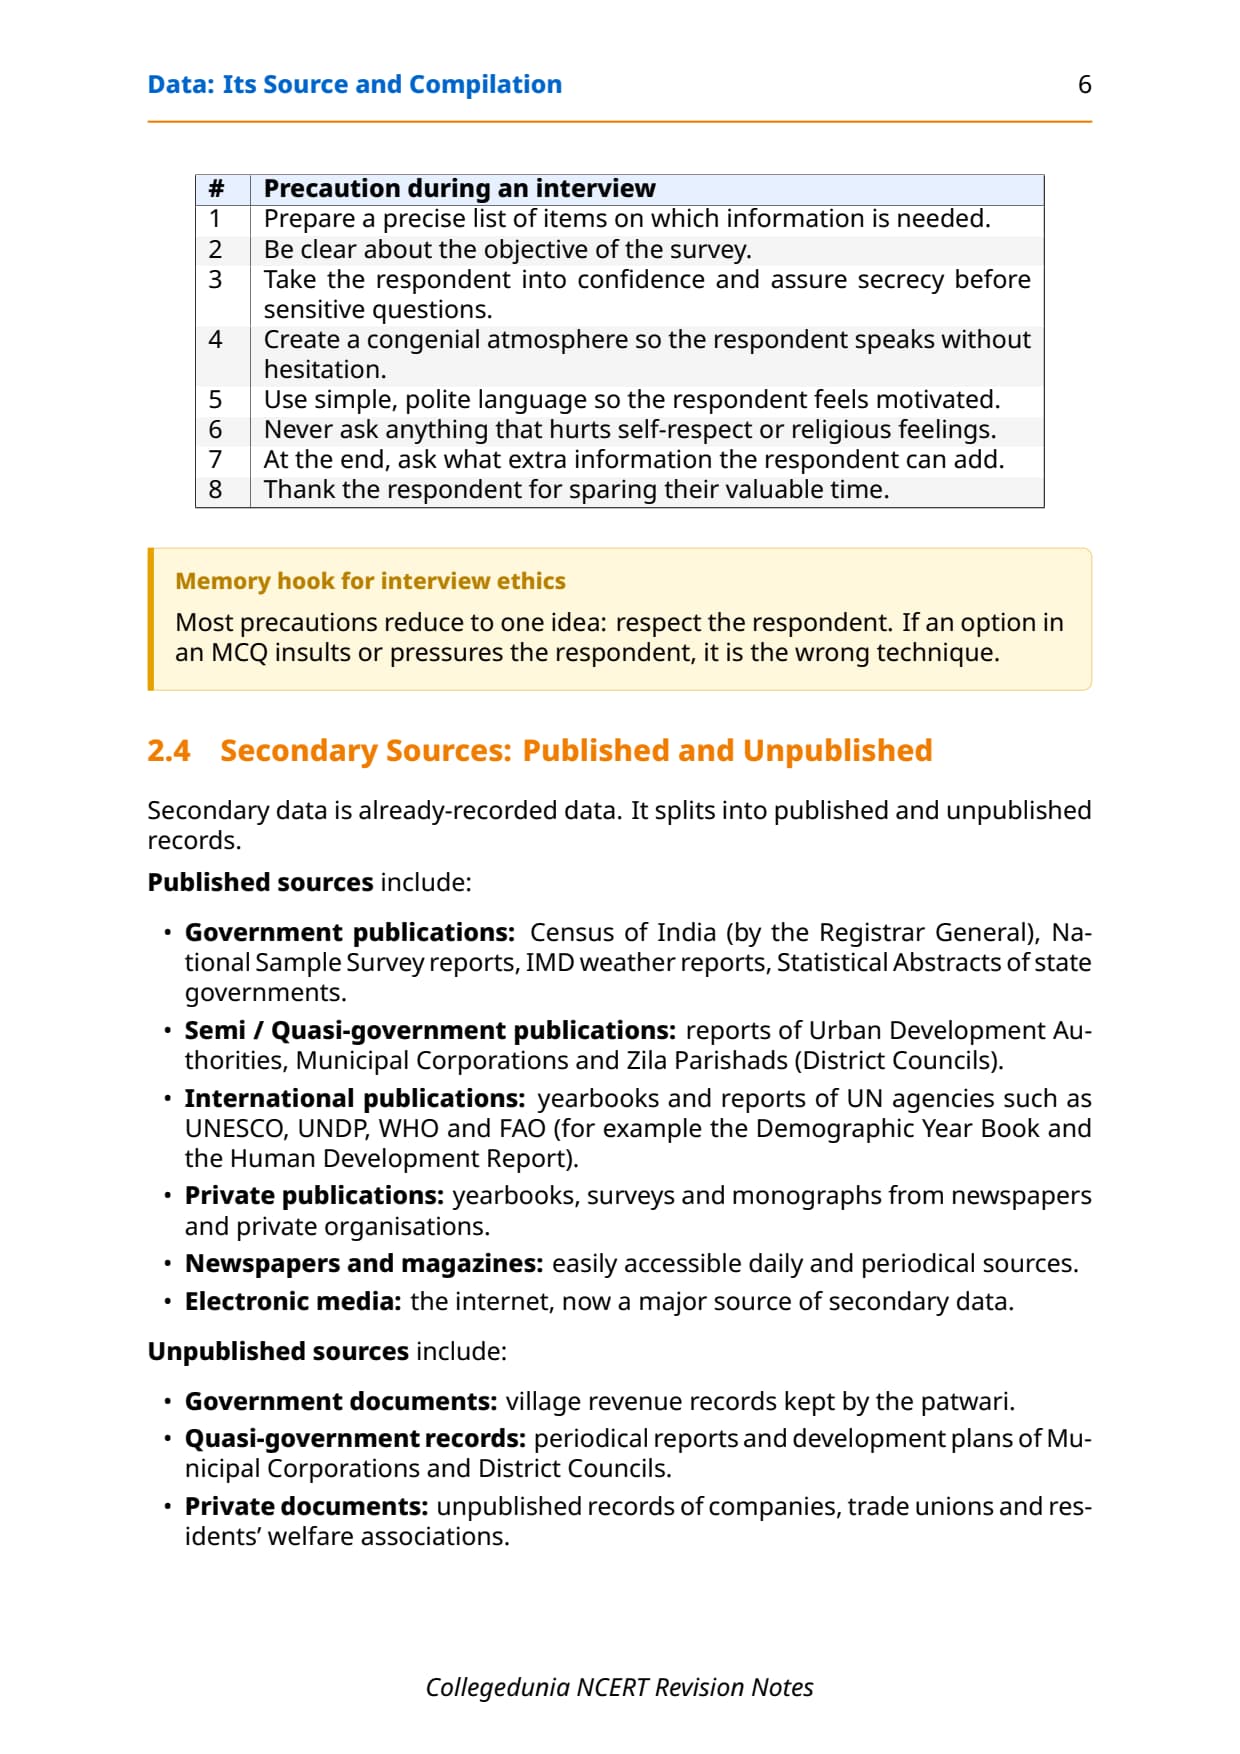
- Interview: direct dialogue. Prepare items in advance, take the interviewee into confidence, use simple polite language, avoid questions that hurt religious feelings, and thank them at the end.
- Questionnaire: printed questions filled in by the survey participant directly; can reach far places by mail, but only literate people can use it.
- Schedule: same form, but filled in by a trained enumerator who asks aloud, so it also captures data from illiterate people. This distinction is a CBSE favourite.
- Other field methods: soil and water quality kits and transducers give quantitative readings directly in the field and reduce interviewer bias.
Secondary Sources of Data in Geography
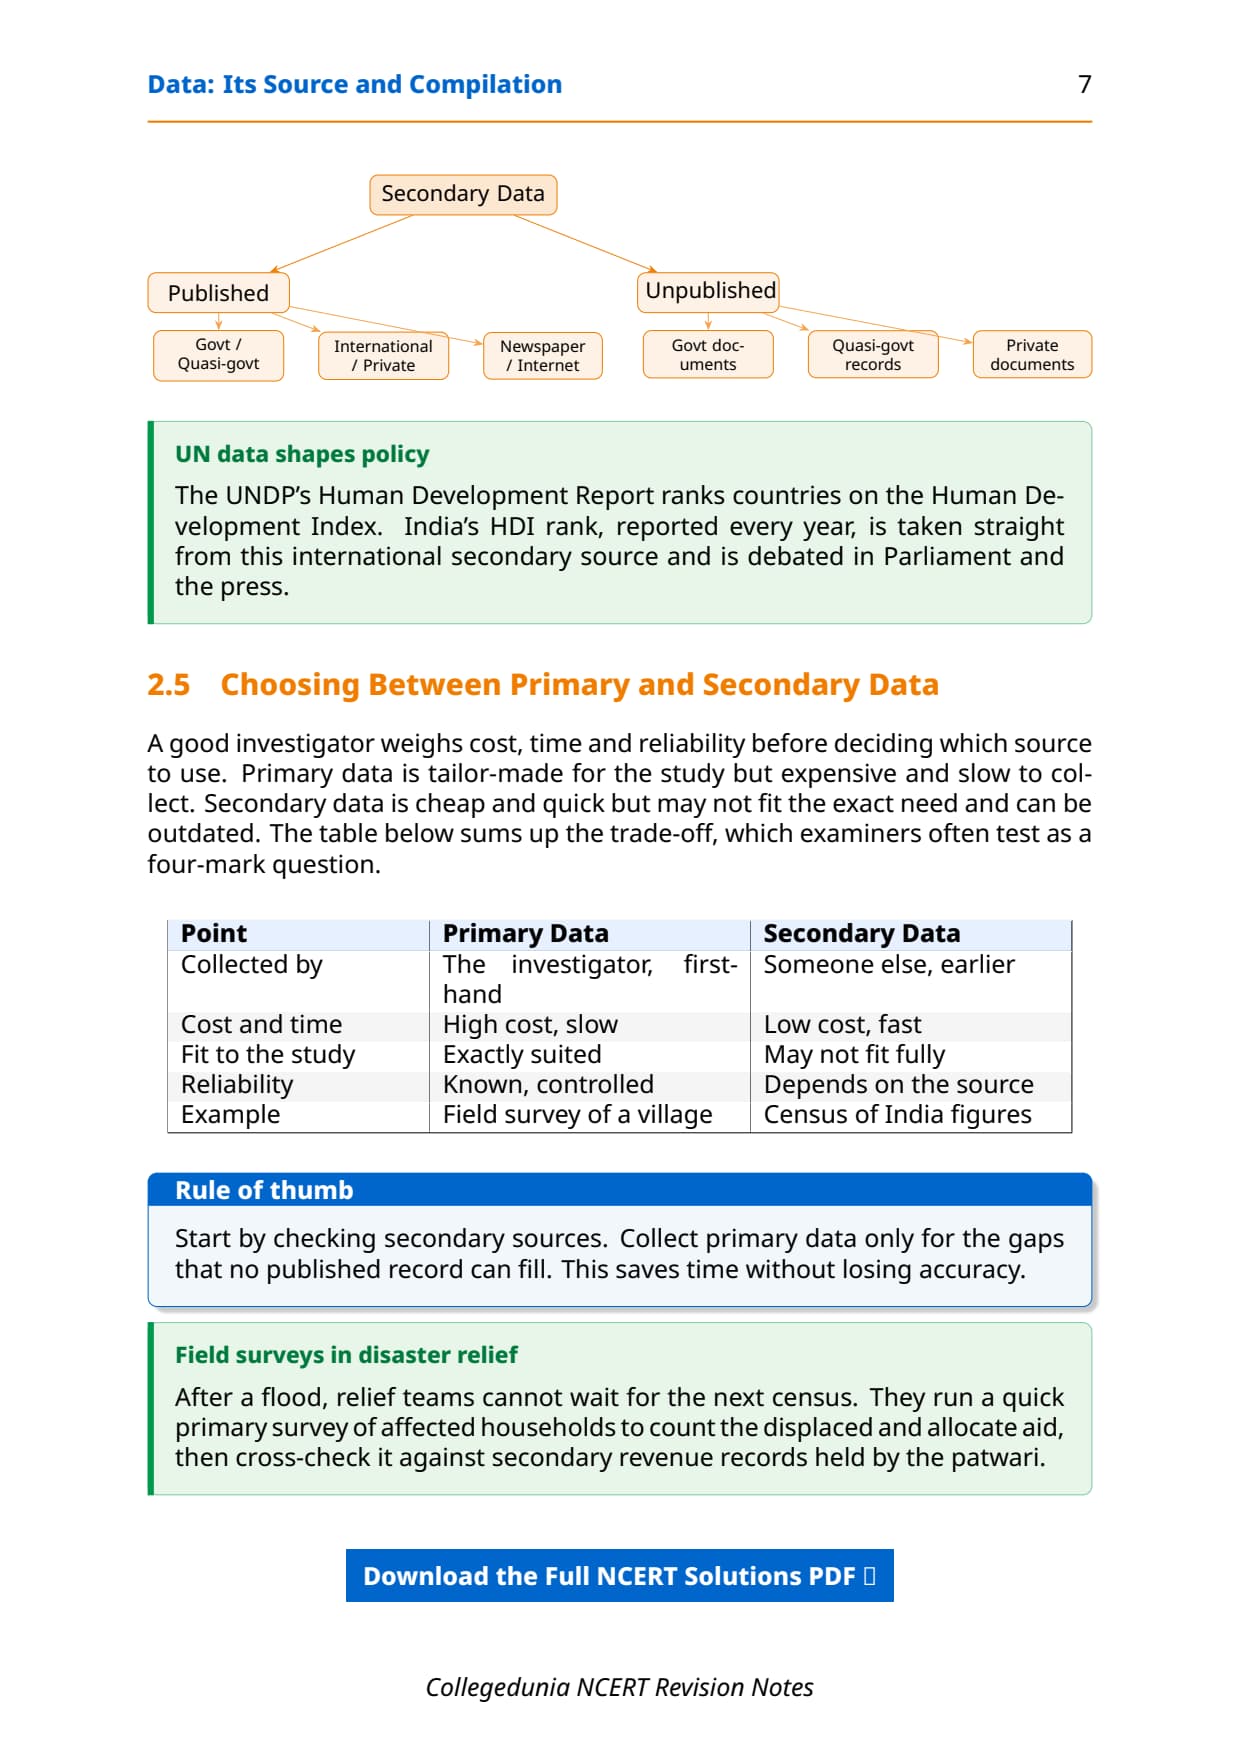
Secondary sources are data already collected by another agency. NCERT divides them into published and unpublished sources; students are often asked to name three or five in the 3-mark format.
Published Sources
- Government publications: Census of India (Registrar General), National Sample Survey reports, IMD Weather Reports, and state Statistical Abstracts. The Census is the most frequently cited source in CBSE questions.
- Semi/Quasi-government publications: Urban Development Authorities, Municipal Corporations, Zila Parishads and District Councils.
- International publications: UN agencies (UNESCO, UNDP, WHO, FAO), especially the Demographic Year Book, Statistical Year Book and Human Development Report.
- Private publications: yearbooks, surveys and research reports from newspapers and private organisations.
- Newspapers and magazines, and electronic media (the internet), which must be named as a separate category in the 5-mark answer.
Unpublished Sources
- Government documents: unpublished reports and records such as village revenue records kept by the patwari.
- Quasi-government records: reports and development plans of Municipal Corporations, District Councils and Civil Services departments.
- Private documents: unpublished reports of companies, trade unions, organisations and residents' welfare associations.
Tabulation, Classification and Data Processing
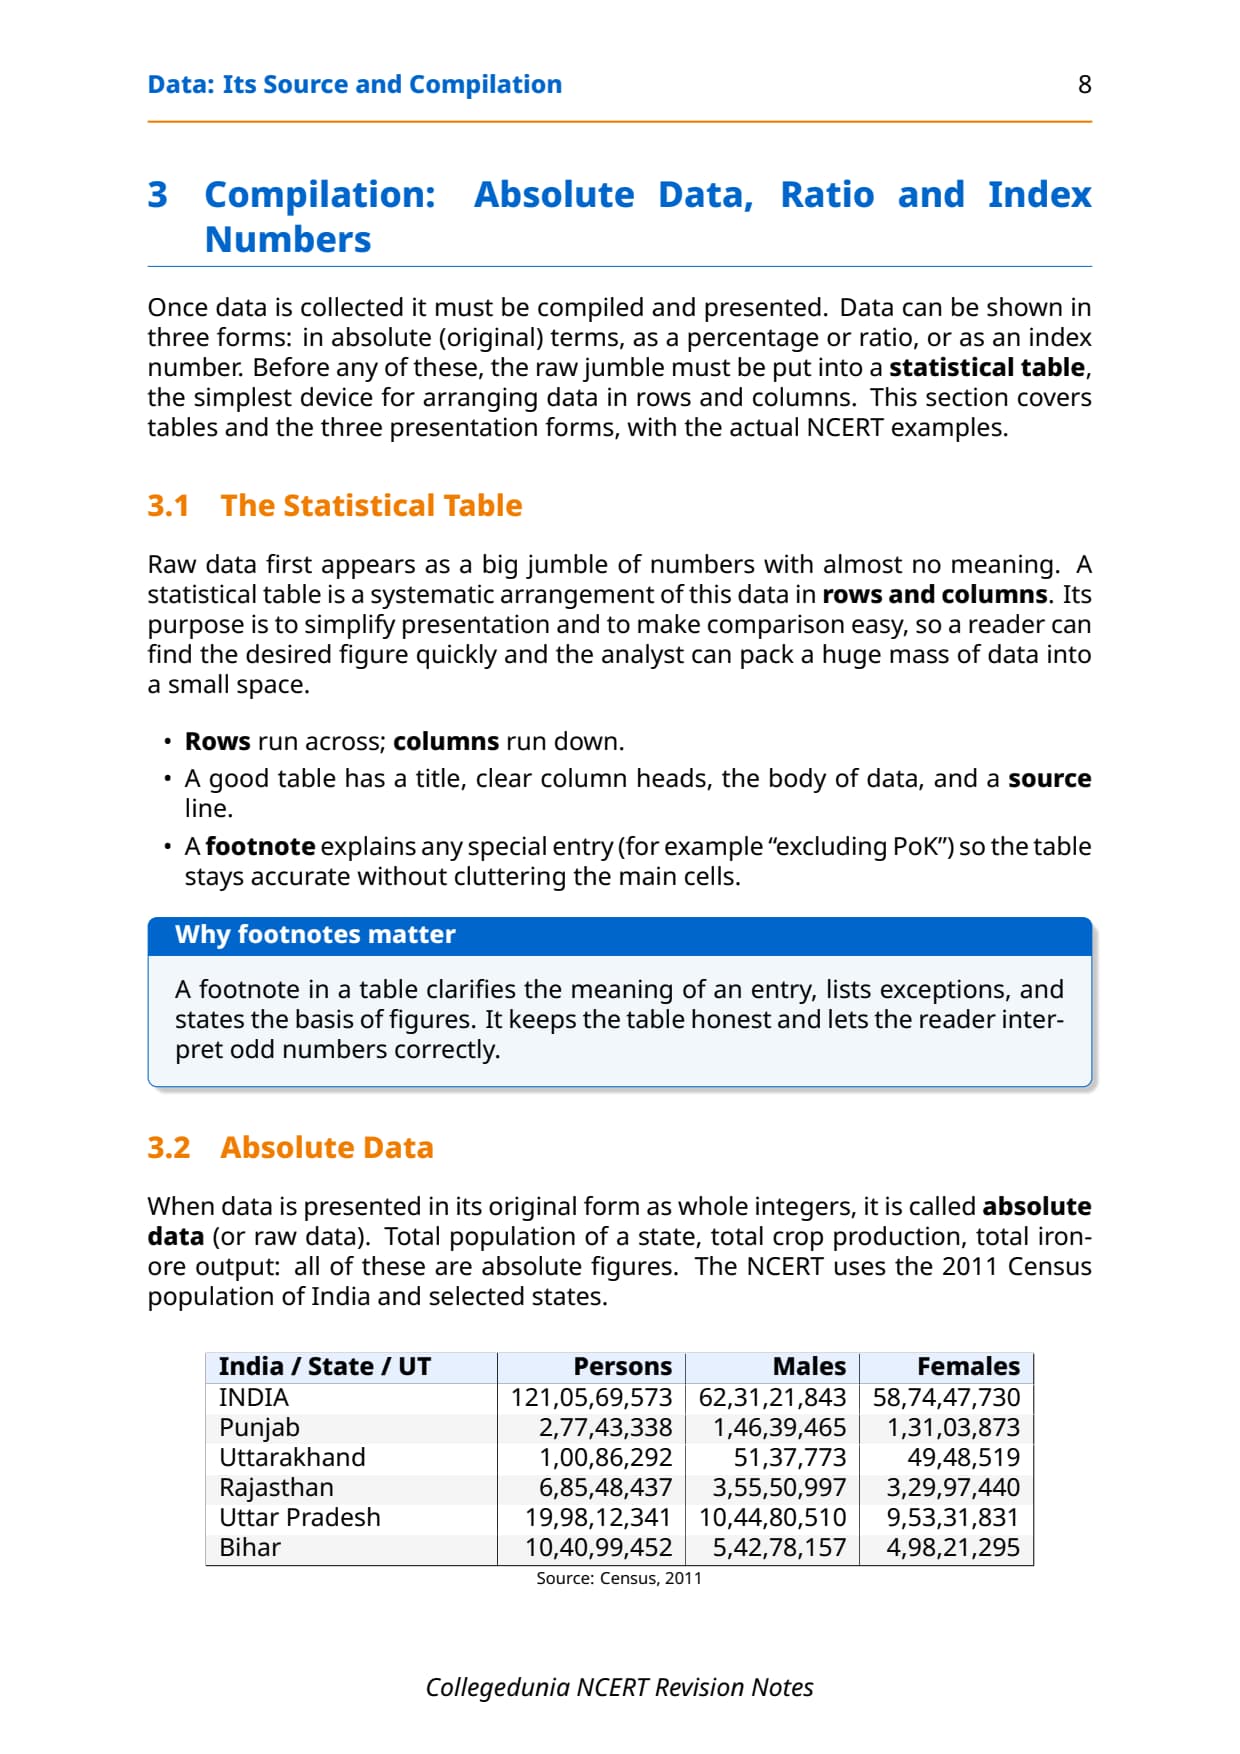
Raw data must be tabulated and classified to mean anything. NCERT teaches three presentation forms plus frequency distribution.
Three Forms of Data Presentation
- Absolute data: original integer form, e.g. total population of a state or crop production.
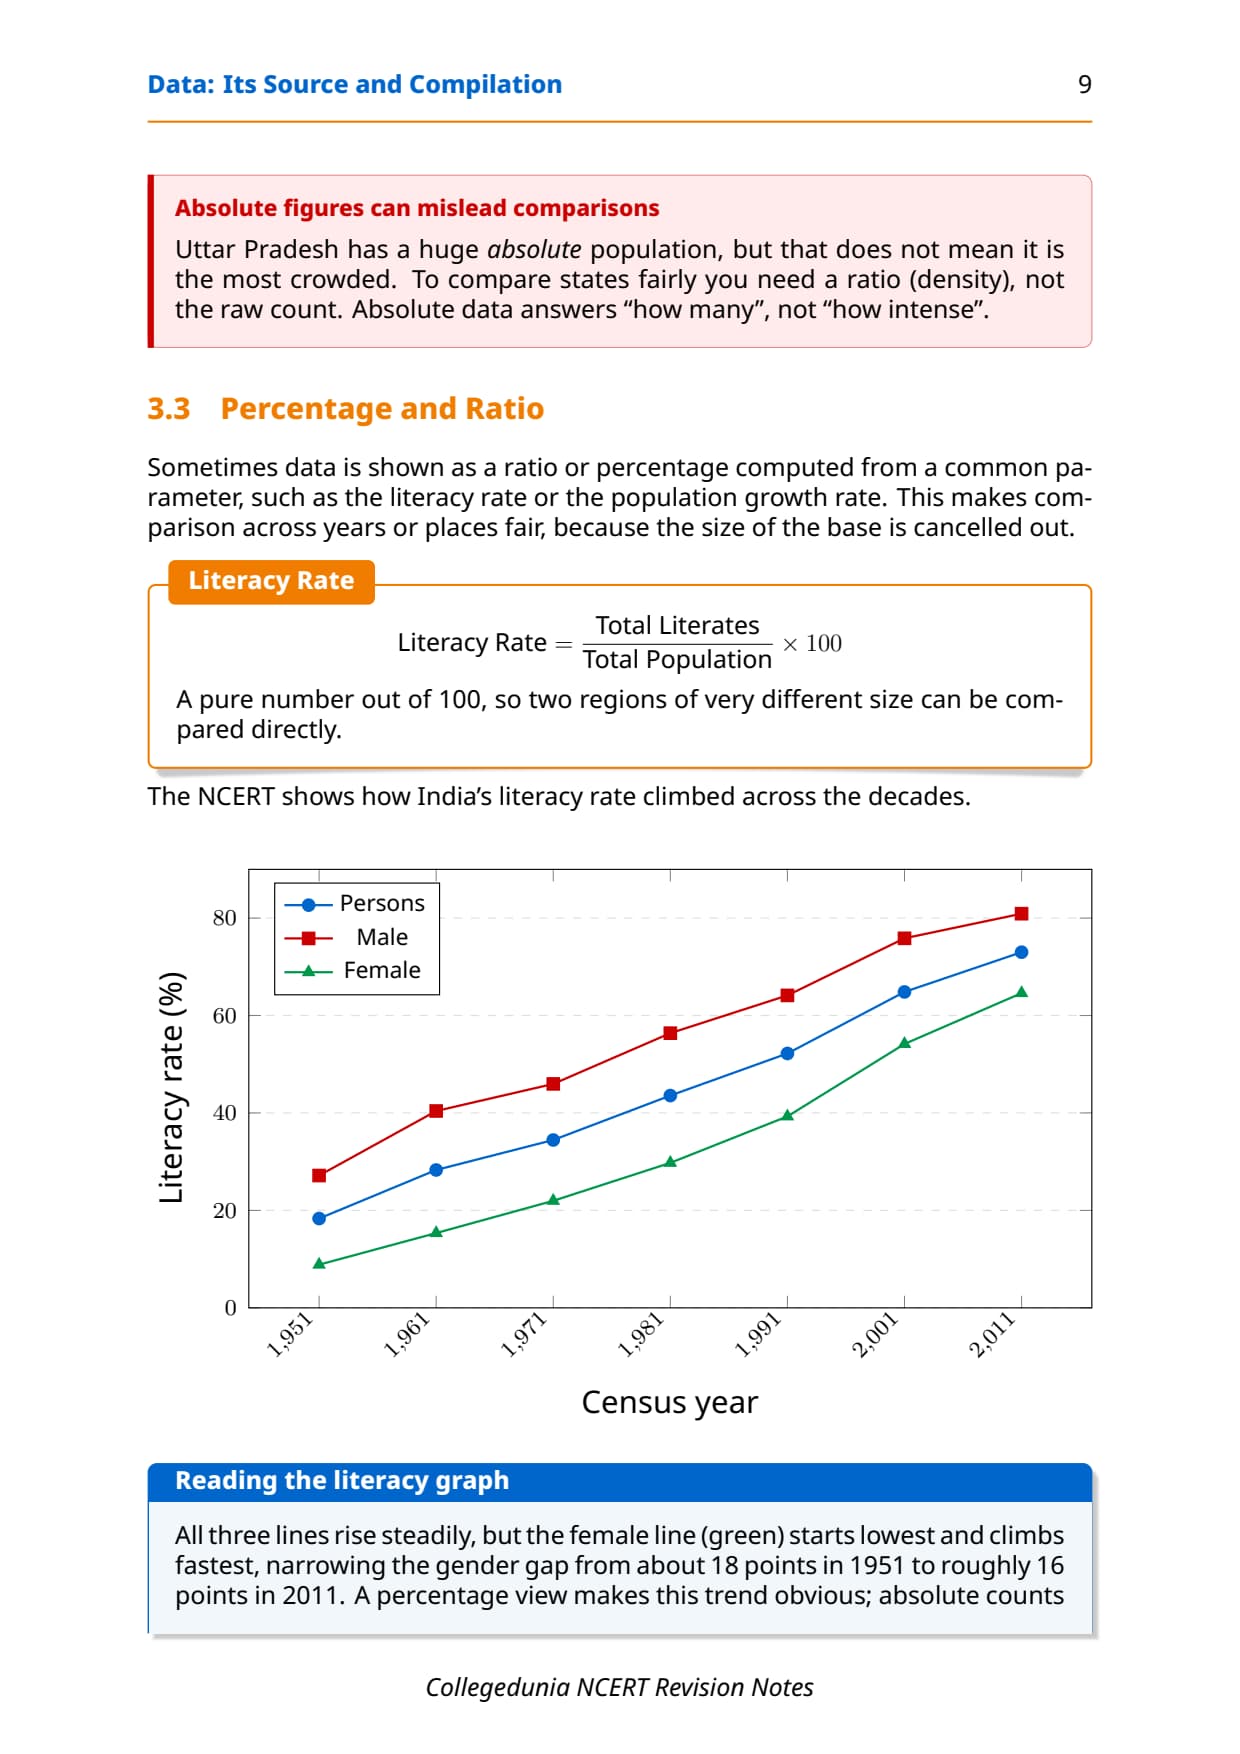
- Percentage or ratio data: computed from a common parameter, e.g. literacy rate = (Total Literates / Total Population) x 100.
- Index numbers: show change in a variable relative to a base year set at 100 (see below).
Frequency Distribution and Tally Marks
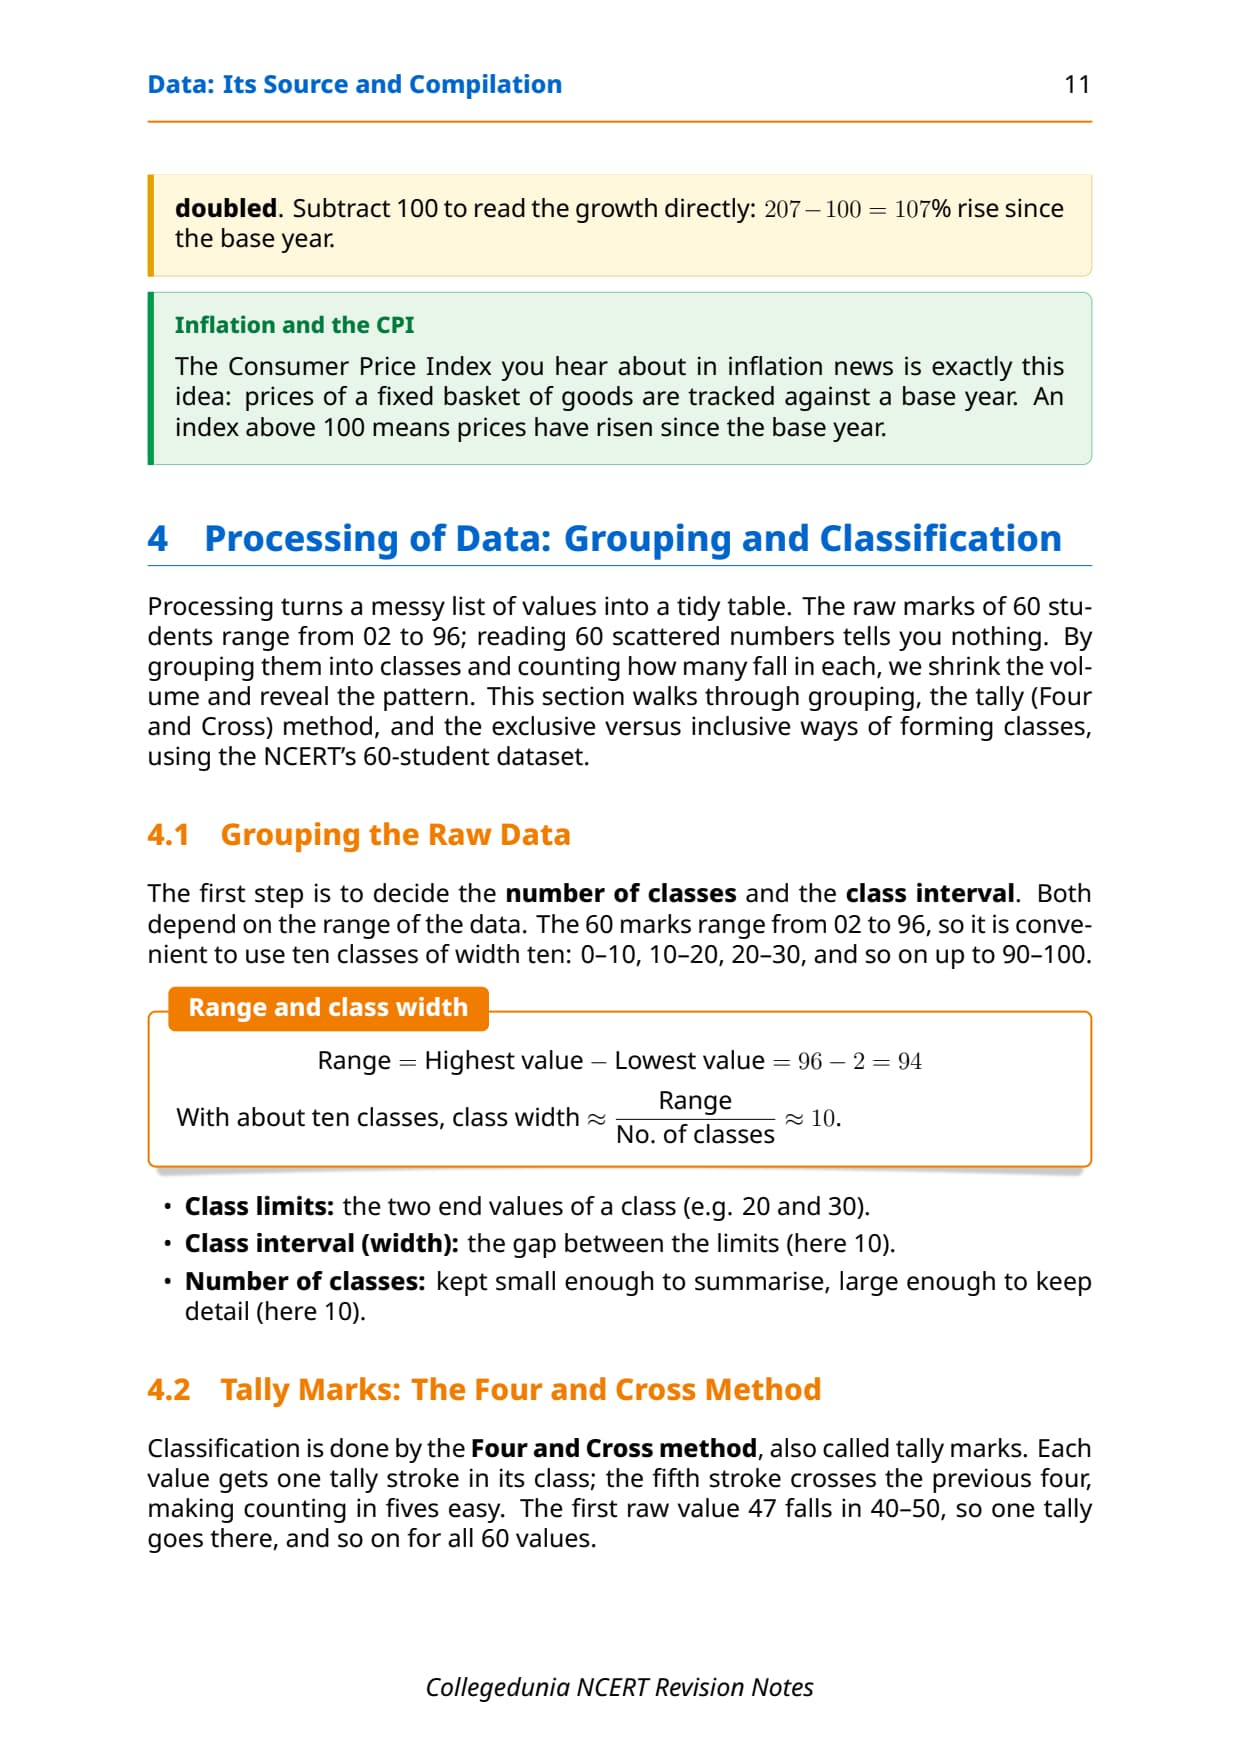
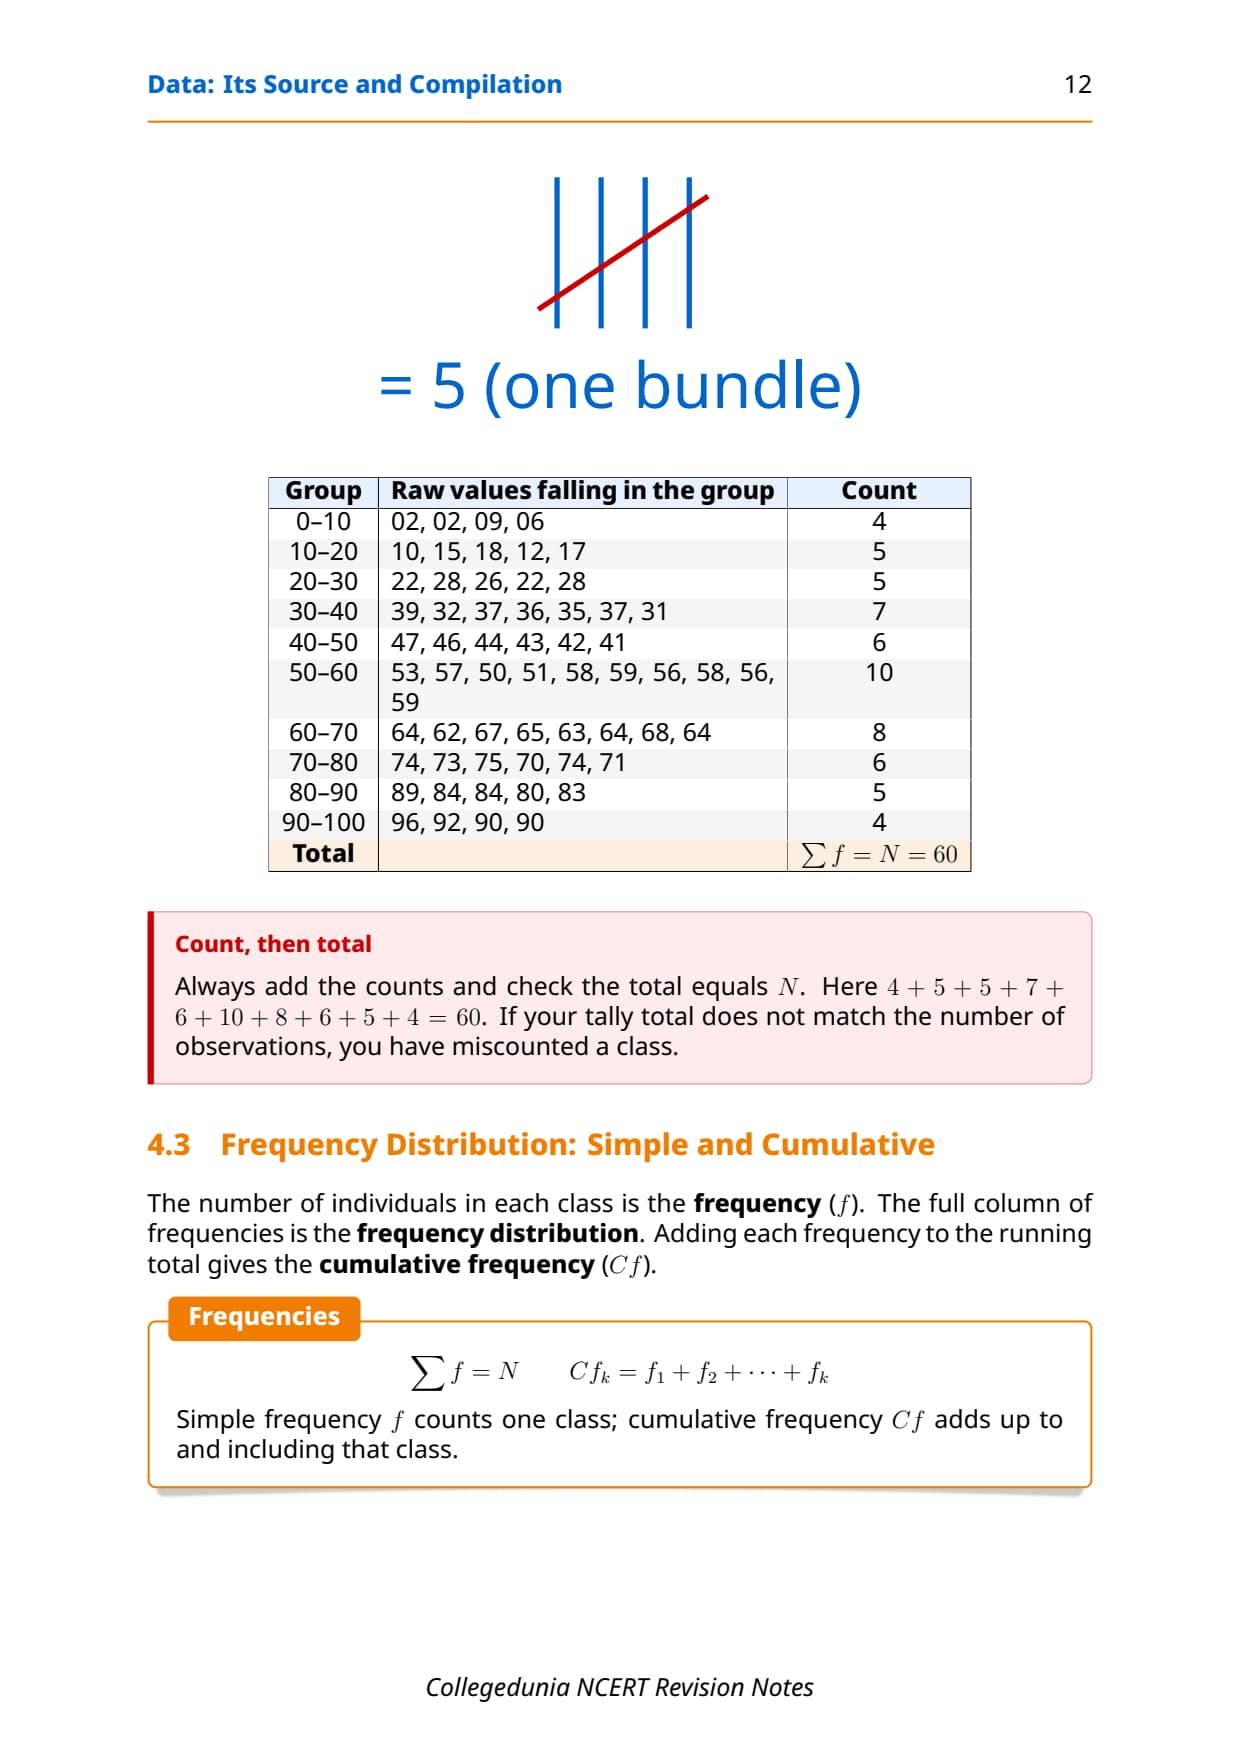
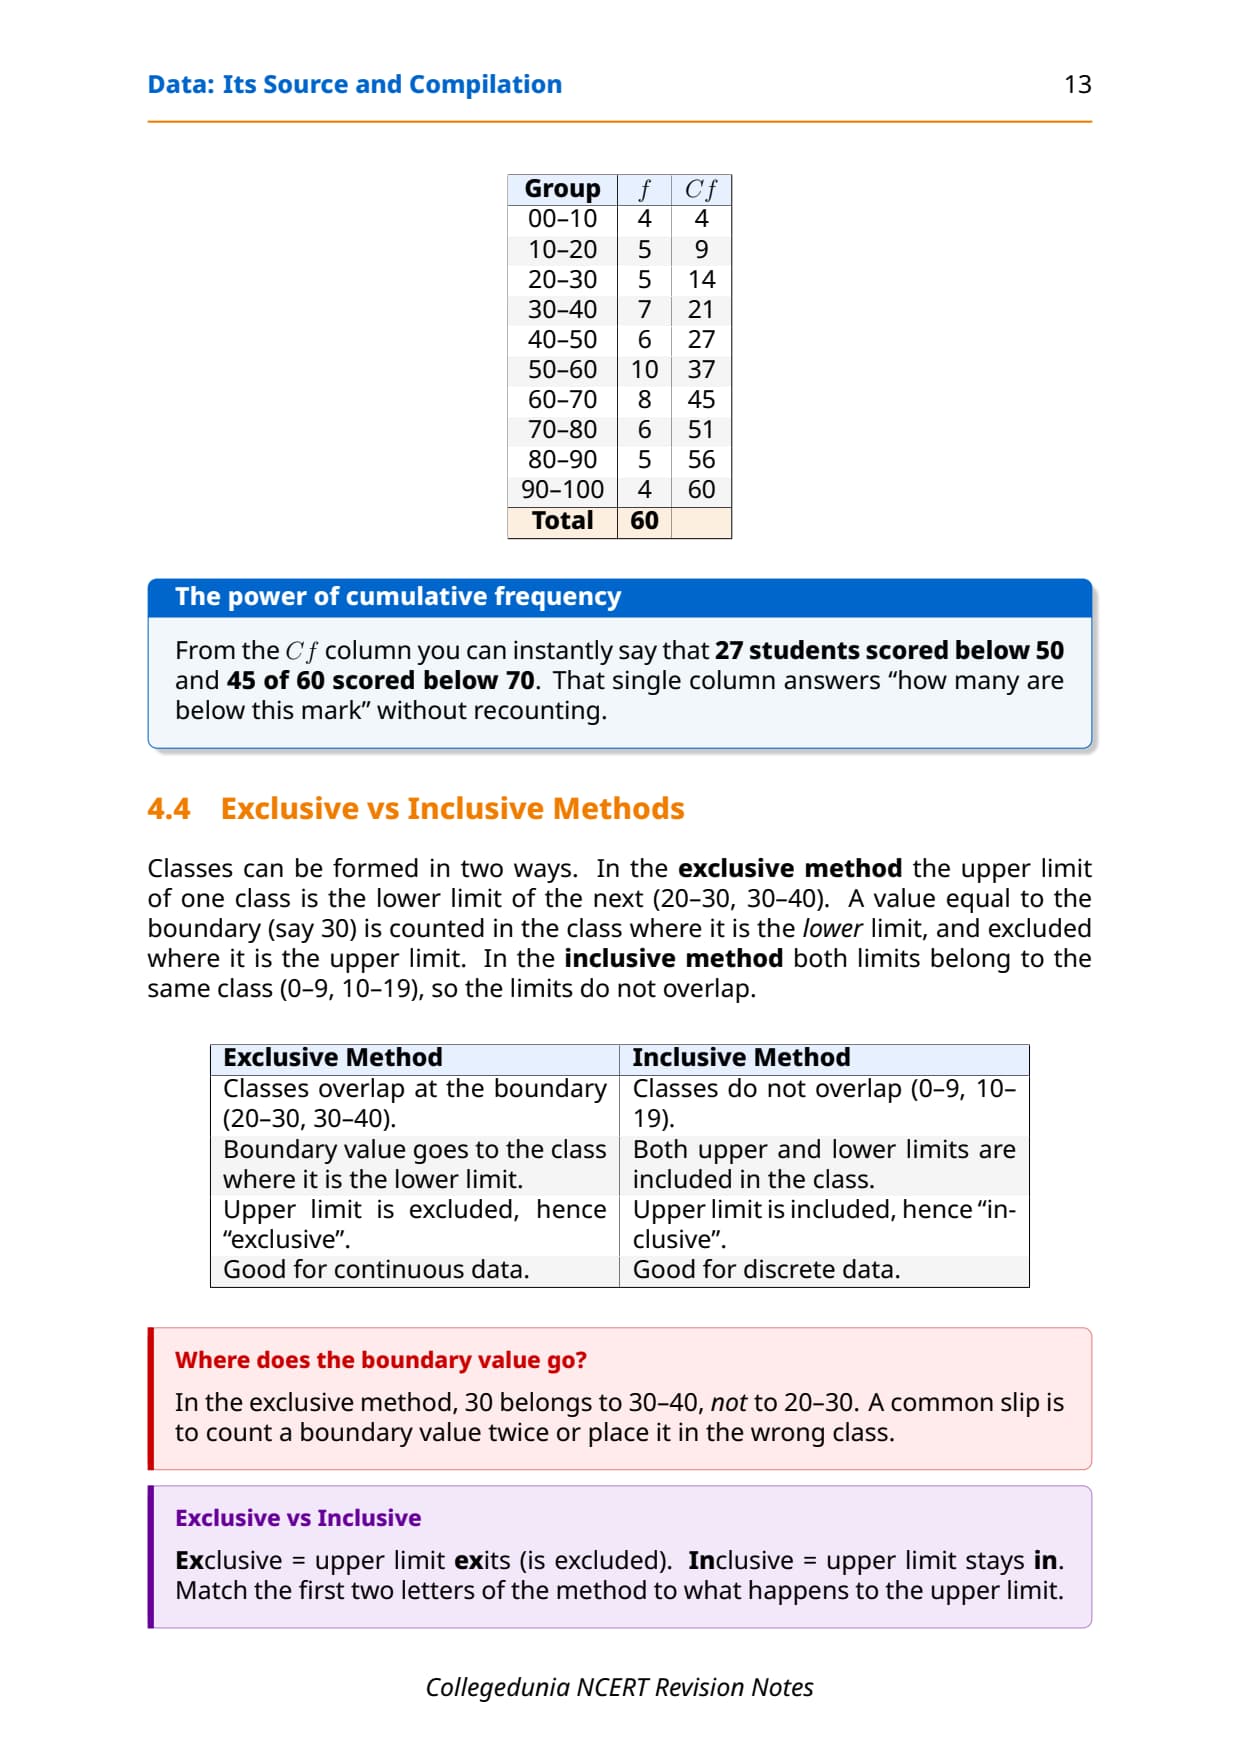
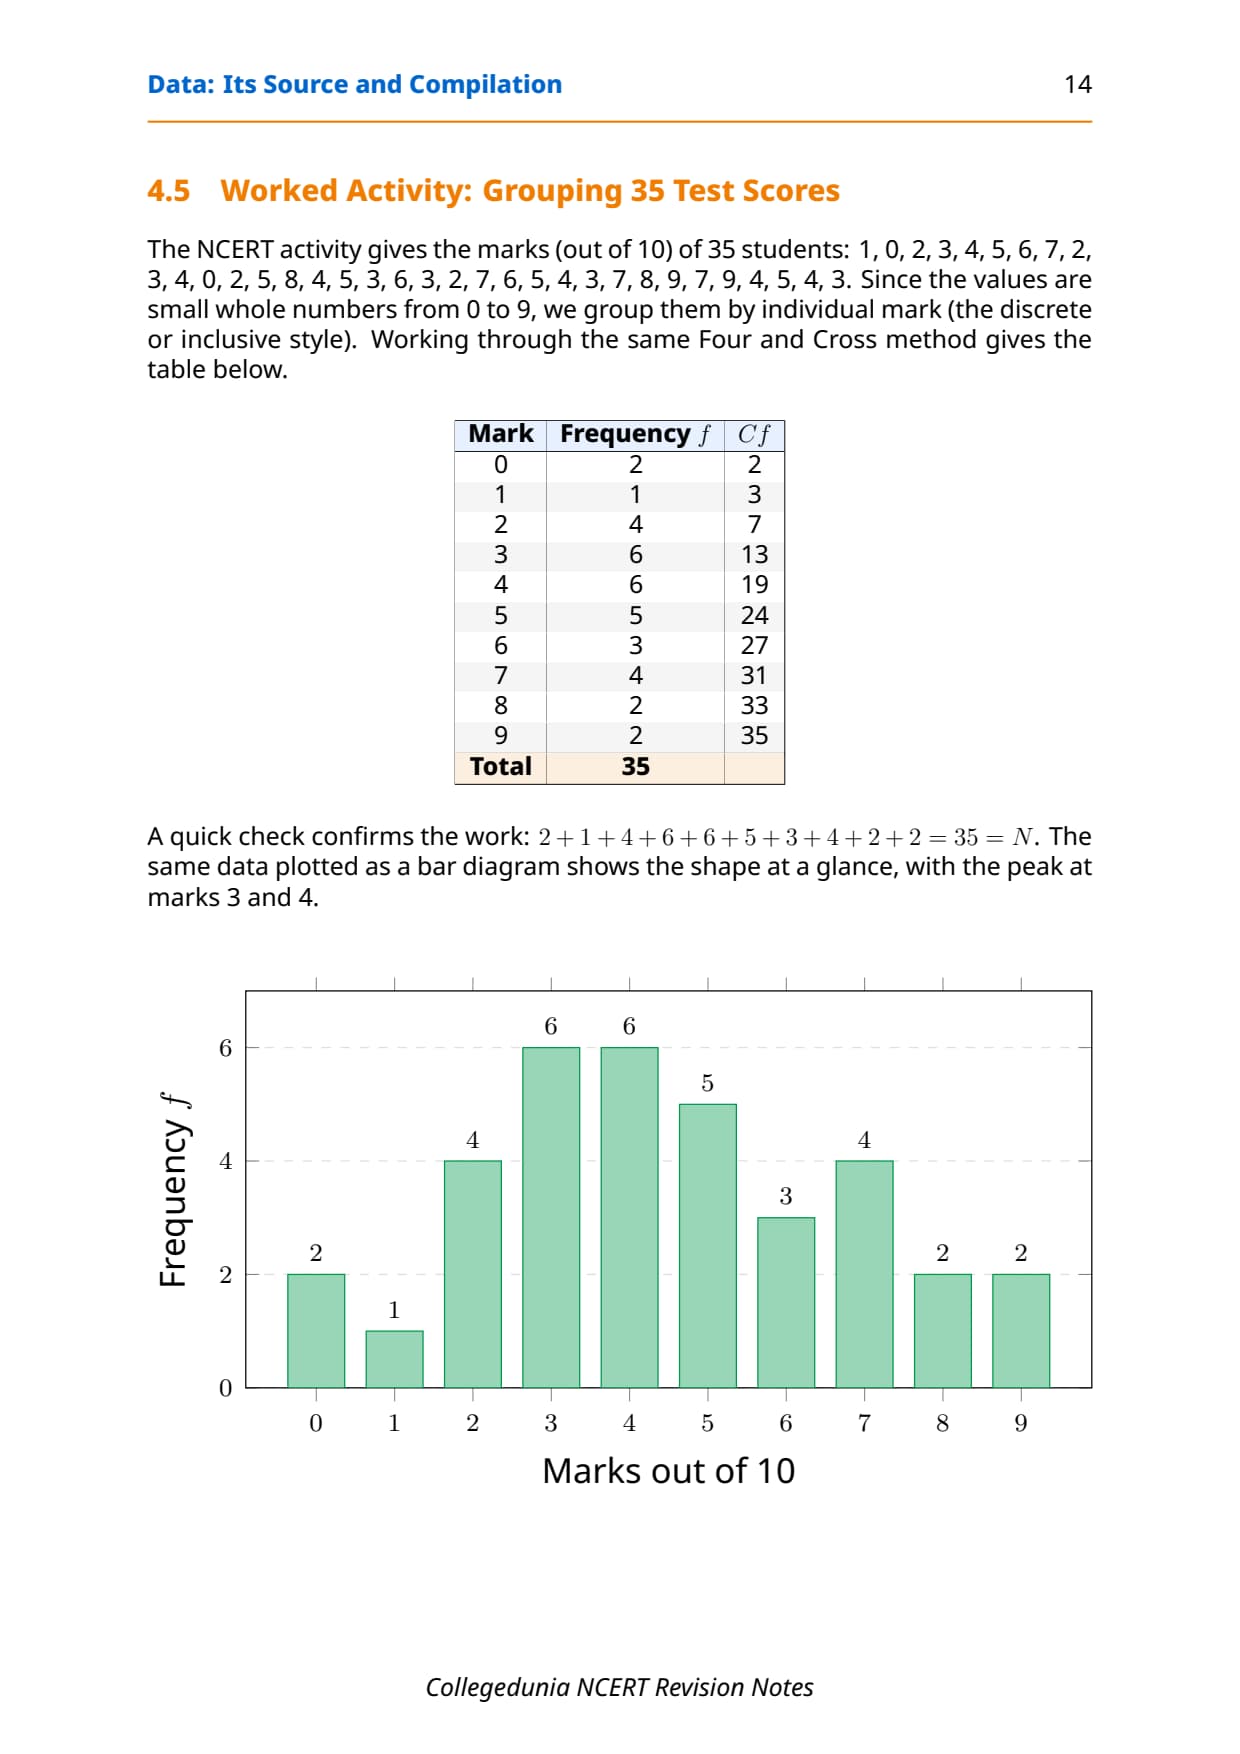
Data is grouped into class intervals and the frequency in each is recorded. The tally mark (Four-and-Cross) method counts in fives: four vertical strokes, then a fifth crossing stroke. It is the most-asked MCQ in the NCERT exercise.
| Term | What it means | Exam pointer |
|---|---|---|
| Class interval | The width of each group in a frequency distribution (e.g. 0-10, 10-20) | MCQ on inclusive vs exclusive method |
| Exclusive method | Upper limit of one class = lower limit of the next; the upper value belongs to the next class | Most common in geography data |
| Inclusive method | Both ends of the class interval are included in that class; last digit of lower class equals last digit of upper | Used for discrete data like marks |
| Cumulative frequency | Running total of frequencies from the first class up to the current class | Basis for ogive curves |
| Ogive | A graph of cumulative frequency; "less than" ogive slopes upward, "more than" ogive slopes downward | Direct definition MCQ in NCERT exercise |
Key tip: the intersection of the "less than" and "more than" ogives gives the median, the most-tested ogive application in short answers.
Index Numbers: Concept and Calculation
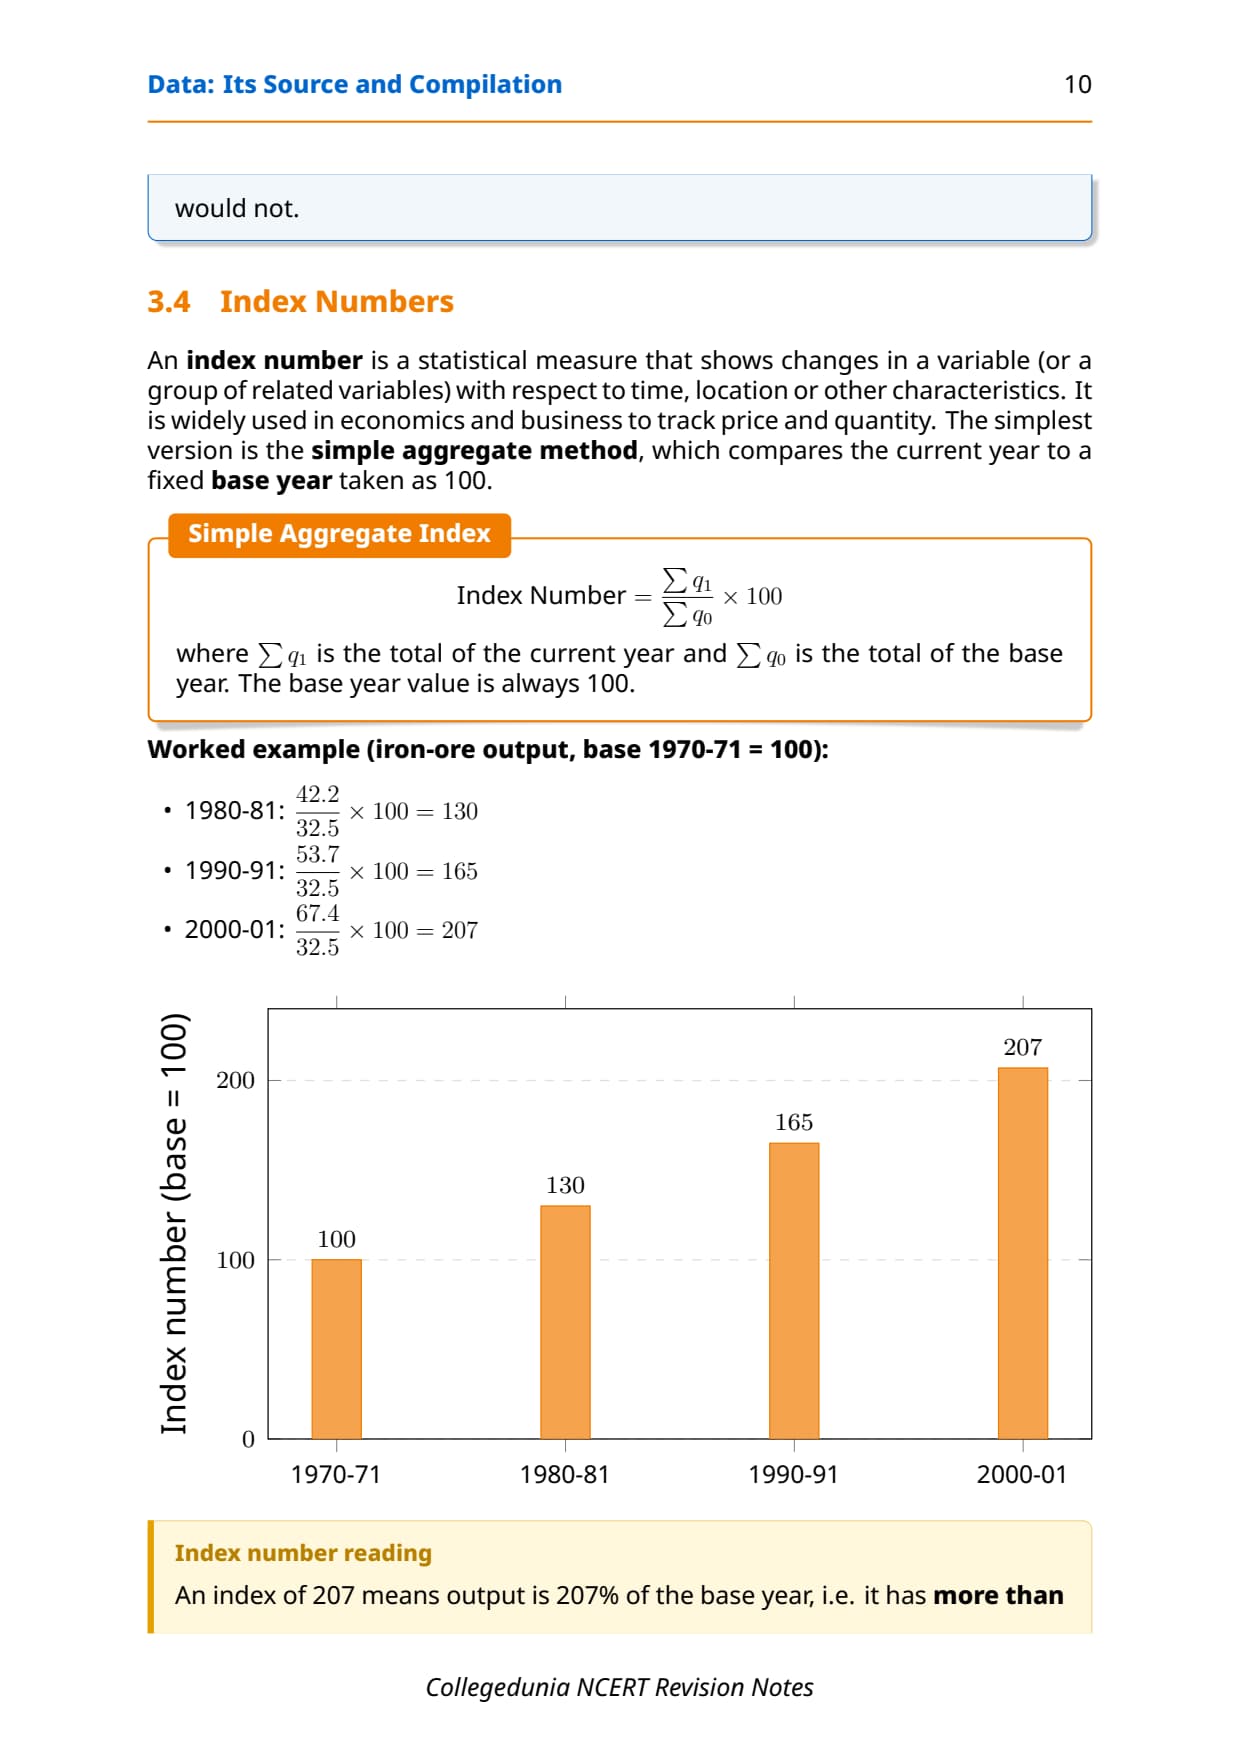
An index number shows how a variable changed relative to a base period set at 100. Above 100 means an increase, below 100 a decrease. It tracks production, prices and population over time.
Simple Aggregate Method
The most common method in Class 12 Geography uses this formula:
Index Number = (Sum of current year values / Sum of base year values) x 100
Example: with iron ore production, taking 1970-71 as base (32.5 mt), the index for 2000-01 (67.4 mt) is about 207, so production more than doubled.
Memory hook: the base year is always 100. An index of 207 means the current value is 207% of the base, or about 2.07 times it. Given both values, one division and multiplication is all you need.
These appear regularly as 3-mark activity-based questions. Lock in the formula, the example and the base-year rule.
Common Mistakes Students Make in Data Chapter
Five repeat-offender mistakes CBSE examiners report each year:
- Questionnaire vs schedule: the enumerator fills the schedule; the participant fills the questionnaire. This is the most-tested item in the chapter.
- Missing electronic media (internet) as a separate secondary source.
- Using one ogive for the median: the median is where both ogives intersect; a single ogive cannot give it.
- Forgetting the base year in index calculations; always confirm it is set at 100 or lose a method mark.
- Treating raw data as absolute data: raw data is unprocessed and jumbled; absolute data is raw data tabulated in integer form.
Previous Year Question Trends from Chapter 1 Geography
Chapter 1 questions follow a stable pattern. The table below maps what the board has asked over the last four years.
| Year | Question type asked | Marks | Notes section to revise |
|---|---|---|---|
| 2025 | Distinguish between questionnaire and schedule + name five secondary sources | 3 + 3 | Primary Sources + Secondary Sources |
| 2024 | Define index number + calculate index for given production data | 2 + 3 | Index Numbers section |
| 2023 | MCQ on tally mark method + define ogive | 1 + 2 | Tabulation and Classification |
| 2022 | Name four primary sources of data + define secondary data | 4 + 2 | Key Definitions + Primary Sources |
The chapter carries an effective weight of 8 to 10 marks per year.
Other Resources for Class 12 Geography Chapter 1 Data Its Source and Compilation
Pair these notes with the matching Solutions, handwritten notes and NCERT book chapter, all linked below.
| Resource | What it covers | Open |
|---|---|---|
| Notes | Concept-first revision notes covering definitions, primary/secondary sources, tabulation and index numbers. | You are here |
| NCERT Solutions | Step-by-step answers to all MCQs and 30-word/125-word exercise questions with expert solutions. | Class 12 Geography Chapter 1 NCERT Solutions |
| Handwritten Notes | Topper's handwritten revision pages for last-minute board exam practice. | Class 12 Geography Chapter 1 Handwritten Notes |
| NCERT Book PDF | Official NCERT Practical Work in Geography Chapter 1 textbook in PDF form. | Class 12 Geography Chapter 1 NCERT Book PDF |
| Subject Hub | All chapters of Class 12 Geography with every resource in one place. | Class 12 Geography Subject Hub |
All Chapters Notes for Class 12 Practical Work in Geography
Related Links: Use the table below for the Notes for other chapters of Class 12 Practical Work in Geography.
| Chapter | Topic | Notes link |
|---|---|---|
| Chapter 1 | Data: Its Source and Compilation | You are here |
| Chapter 2 | Data Processing | Class 12 Geography Data Processing Notes |
| Chapter 3 | Graphical Representation of Data | Class 12 Geography Graphical Representation of Data Notes |
| Chapter 4 | Spatial Information Technology | Class 12 Geography Spatial Information Technology Notes |
NCERT Notes Class 12 Geography Chapter 1 Data Its Source and Compilation FAQs
Ques. What is the difference between primary and secondary data in Class 12 Geography?
Ans. Primary data are collected for the first time by the researcher or their team through direct field methods such as personal observation, interview, questionnaire or schedule. Secondary data are obtained from published or unpublished records compiled by another agency, such as the Census of India, UN Demographic Year Book or private organisation reports. The key distinction is who collected the data originally: if you collected it, it is primary; if someone else compiled it and you are using it, it is secondary.
Ques. What is the difference between a questionnaire and a schedule in data collection?
Ans. A questionnaire is filled in by the survey participant directly, which means it works only with literate people who can read and write. A schedule is identical in form but is filled in by a trained enumerator who asks the questions aloud and writes down the answers, which means it can capture data from both literate and illiterate people. CBSE Class 12 Geography boards ask this distinction almost every year as a 2-mark or 3-mark short answer.
Ques. What is an index number and how is it calculated?
Ans. An index number is a statistical measure that shows how a variable has changed relative to a base period, which is always set at 100. The simple aggregate method formula is: Index Number equals (Sum of current year values divided by Sum of base year values) multiplied by 100. For example, if iron ore production was 32.5 million tonnes in the base year 1970-71 and 67.4 million tonnes in 2000-01, the index for 2000-01 is (67.4 divided by 32.5) multiplied by 100, which equals approximately 207. This means production was 207% of the base year value.
Ques. What is the difference between an ogive and a frequency polygon?
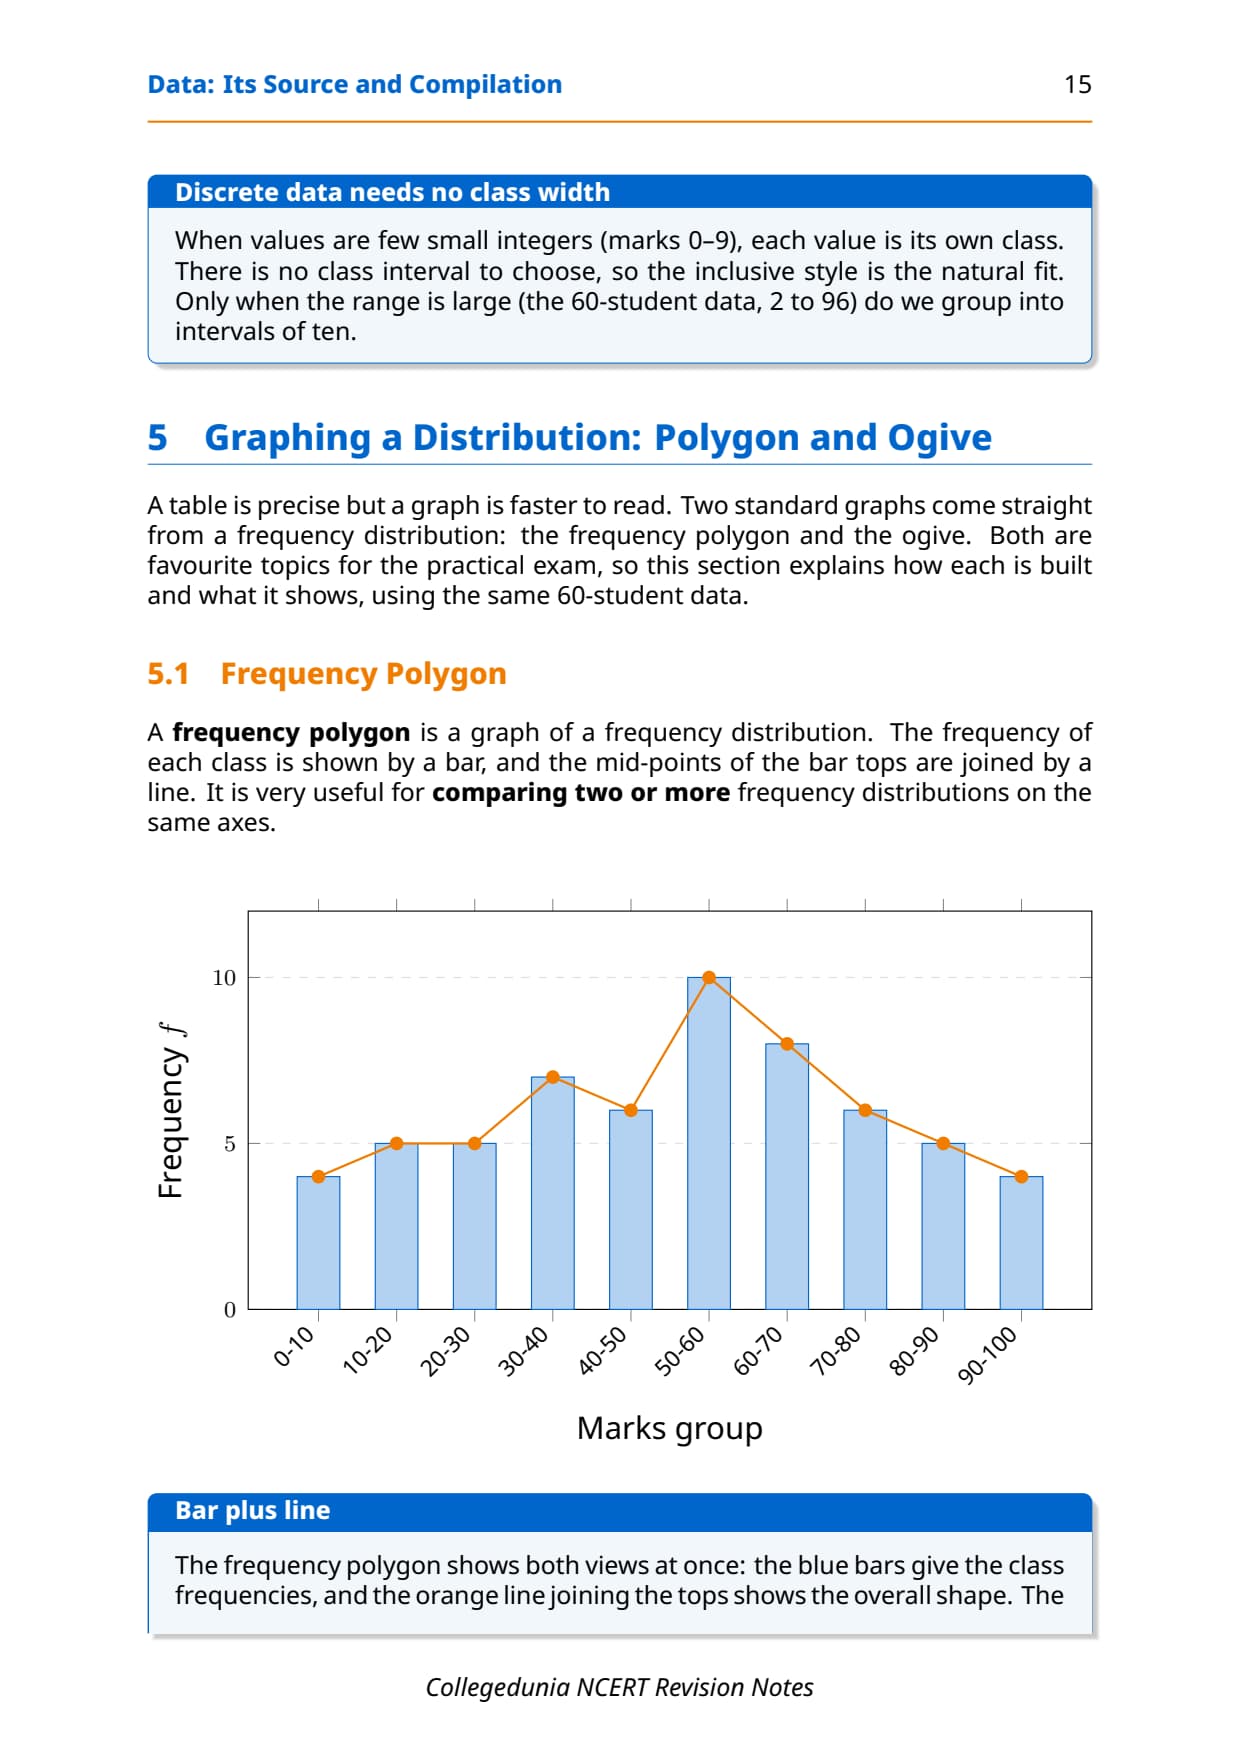
Ans. An ogive is a graph of cumulative frequency plotted against class intervals. A "less than" ogive uses cumulative frequency from below (upward sloping) and a "more than" ogive uses cumulative frequency from above (downward sloping). Their intersection gives the median. A frequency polygon, by contrast, plots simple (non-cumulative) frequency against class midpoints and gives the shape of the distribution. CBSE Class 12 Geography defines ogive as the correct answer to MCQ (iv) in the NCERT exercise.
Ques. Name five secondary sources of data used in geography.
Ans. Five secondary sources of data in geography are: (1) Government publications such as the Census of India and National Sample Survey reports; (2) Semi/Quasi-government publications from Municipal Corporations and Zila Parishads; (3) International publications from UN agencies such as the Demographic Year Book and Human Development Report; (4) Private publications including yearbooks and research reports from newspapers and private organisations; (5) Electronic media, particularly the internet. Newspapers and magazines form a sixth source frequently included in longer answers.
Ques. What is the Four-and-Cross method in data tabulation?
Ans. The Four-and-Cross method, also called the tally mark method, is used to count frequencies when organising raw data into a frequency distribution. Four vertical strokes are drawn for the first four values in a class, and a fifth diagonal stroke crosses all four for the fifth value, making a group of five. This makes counting and checking easy. The NCERT exercise MCQ (iii) asks about this method directly, and the answer is "Tally Marking Method".
Ques. Why is data important in geographical analysis?
Ans. Geography studies phenomena that vary over space and time, such as population density, crop yield, rainfall and transport networks. These phenomena interact through many variables that are best understood in quantitative terms. Without data, a geographer can only give qualitative descriptions. With data, they can measure, compare, map and model spatial patterns with precision. The NCERT textbook gives the example of studying cropping patterns: without statistical information on cropped area, yield, rainfall and fertiliser use, no scientific analysis is possible.
Ques. What is statistical fallacy and what does it tell us about data presentation?
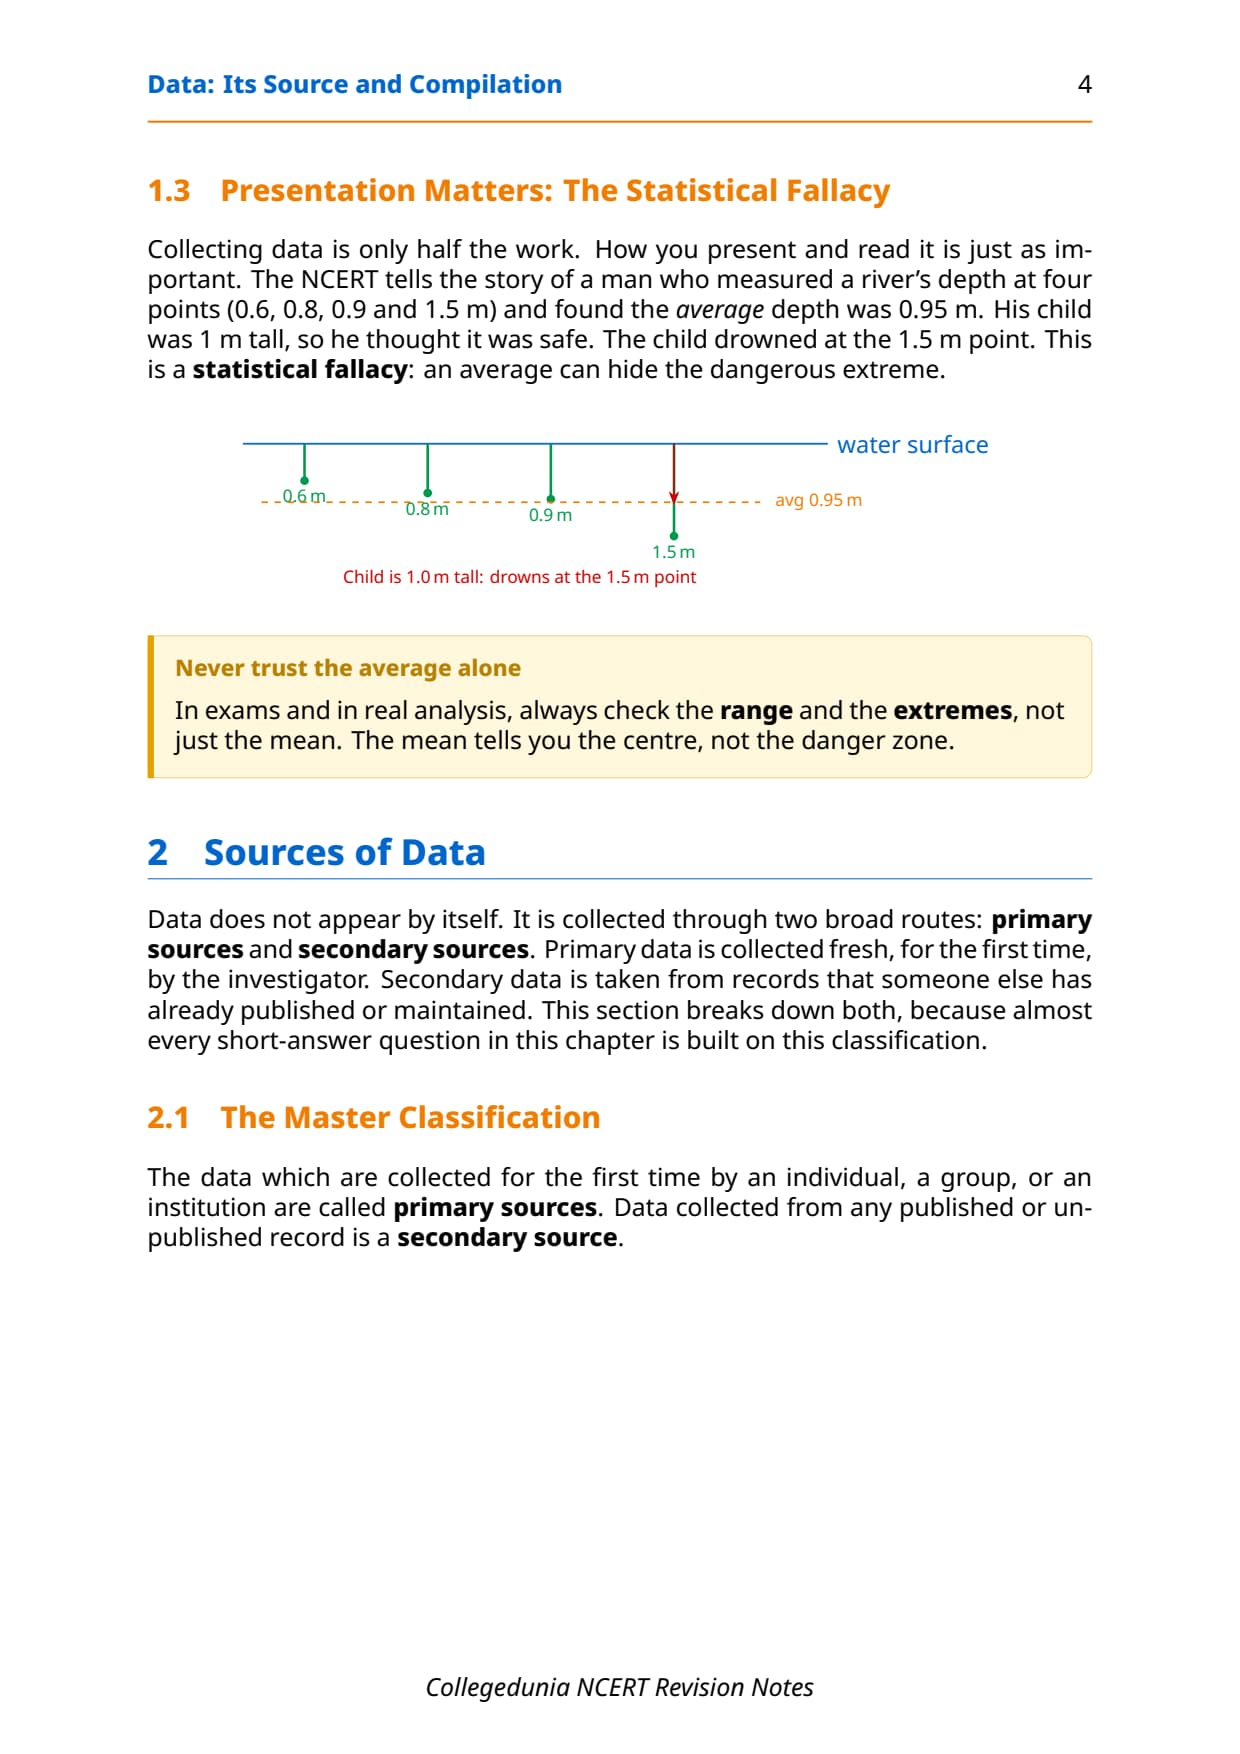
Ans. Statistical fallacy is the error of drawing incorrect conclusions from correctly calculated statistics, usually because the statistic hides important variation. The NCERT textbook illustrates this with the story of a child who drowned in a river whose average depth was calculated as 0.95 metres: the average was correct but the river had a deep point of 1.5 metres that killed the child. This story teaches that it is not enough to collect and calculate data; how data is presented and interpreted matters just as much as the numbers themselves.
Ques. What is the inclusive method of frequency grouping?
Ans. In the inclusive method, both the lower and upper limits of each class interval are included in that class. For example, the class 10-19 includes both 10 and 19. This method is typically used for discrete data like marks or scores, where values are whole numbers and there is no overlap between adjacent classes. The exclusive method, by contrast, includes the lower limit but excludes the upper limit, so a value equal to the upper boundary falls into the next class. CBSE MCQ (v) in the NCERT exercise asks about this directly.
Ques. How are these Class 12 Geography data notes aligned to the 2026-27 NCERT syllabus?
Ans. These data its source and compilation class 12 Geography notes are aligned to the 2026-27 reprint of the NCERT Practical Work in Geography Part II textbook, Chapter 1. The textbook content for this chapter has not changed in the current cycle. Every definition, source category, tabulation method and index number example in these notes is drawn directly from the 2026-27 NCERT text, and the Previous Year Question table above cross-references recent CBSE board papers to confirm continued relevance.
Ques. Is Chapter 1 of Practical Work in Geography important for CUET?
Ans. Yes. CUET Geography includes questions from the Class 12 NCERT syllabus, and Chapter 1 of Practical Work in Geography is a source of direct definition-type and application-type questions. Students preparing for CUET alongside CBSE boards should focus on the Key Definitions table, the primary vs secondary data distinction, the questionnaire vs schedule difference and the index number formula, as all four are well within the CUET Geography scope and can appear as single-correct or assertion-reason questions.



Comments