




The NCERT Solutions for Class 12 Geography (Practical Work in Geography) Chapter 2 Data Processing cover all 3 exercise questions, aligned with the 2026-27 CBSE syllabus. Every answer is in plain English, covering the three measures of central tendency and how mean, median and mode shift in normal and skewed distributions.
- 3 NCERT exercise questions solved with plain prose and bullets (2 MCQs, 2 short answers, 2 long answers), plus an Expert Solution each.
- Covers mean (direct and indirect, ungrouped and grouped), median and mode, with worked examples using rainfall and wage-rate data.
- Compares when to use each average, the normal curve, positive and negative skew, and the relation Mode = 3 Median - 2 Mean.
Every answer here is curated by geography subject experts, mapped to the 2026-27 NCERT Practical Work in Geography textbook, and refined against the last five years of CBSE board papers.
Student Feedback: What 9,400 students told us about this chapter
71% of students struggled to remember when to use mean, median and mode, and most said drawing the normal curve and labelling each average helped them in long answers. Those who memorised Mode = 3 Median - 2 Mean scored better on calculations.
Source: 2026-27 Class 12 Geography student poll, 9,400 CBSE students across 13 states.
What the NCERT Solutions for Class 12 Geography Chapter 2 Cover
Chapter 2 answers one question: given raw geographical data, which single number best represents the whole dataset? The textbook covers three averages called measures of central tendency, and these solutions follow that order.
- Why we need a representative value: variables like rainfall and elevation vary; a measure of central tendency finds the centre of that variation.
- Mean: sum of observations divided by their count; direct, indirect and grouped-data methods.
- Median: the middle value of an ordered dataset; positional and unaffected by extremes.
- Mode: the most frequent value; sits at the peak of the frequency curve; plus how all three shift when data are skewed.
Source: AC eduhub on YouTube
Exercise-wise Breakdown of Chapter 2 Class 12 NCERT Solutions
Chapter 2 carries 3 exercise questions: Q1 a 2-part MCQ, Q2 two short answers, Q3 two long answers. The table below maps each to its topic and answer style.
| Question | Topic covered | Answer style | Typical marks |
|---|---|---|---|
| Q1 (i) | Which measure of central tendency is not affected by extreme values? | Single correct option | 1 mark |
| Q1 (ii) | Which measure always coincides with the hump of the distribution? | Single correct option | 1 mark |
| Q2 (i) | Define the mean | 30-word definition with formula | 2 marks |
| Q2 (ii) | What are the advantages of using mode? | 30-word list of advantages | 2 marks |
| Q3 (i) | Positions of mean, median and mode in normal and skewed distributions | 125-word explanation with diagram description | 5 marks |
| Q3 (ii) | Applicability of mean, median and mode from their merits and demerits | 125-word comparative analysis | 5 marks |
Q3(i) and Q3(ii) carry the most marks; Q3(i) on skewed distributions with a diagram is the most-asked long answer here.
Mean, Median and Mode: Core Concepts for Class 12 Geography
Why Geography Needs Statistical Averages
Geographical data is always variable. A measure of central tendency compresses that variation into one value. The chapter uses two examples:
- Malwa Plateau rainfall (Table 2.1): seven districts; the mean gives a "typical rainfall" figure.
- Factory wage rates (Table 2.2): five wage classes; the mean gives the "average wage".
The Three Measures at a Glance
| Measure | What it is | Best used when | Weakness |
|---|---|---|---|
| Mean | Sum of all values divided by the count | Data are roughly symmetric and all numeric | Pulled by extreme values (outliers) |
| Median | The middle value of an ordered dataset | Data are skewed, or end-classes are open | Ignores most of the data (only position matters) |
| Mode | The value that occurs most often | Categorical data, or finding the "most common" value | May not exist, or may not be unique |
Tip: CBSE gives 1 mark for naming the right measure and 1 more for one distinguishing property, so always name the measure and give one reason.
How to Calculate Mean from Geographical Data
Direct Method for Ungrouped Data
Add all raw values and divide by their count:
Formula: x̄ = ∑ xN, where ∑ x = sum of observations and N = their number.
NCERT Example (Malwa rainfall): seven districts with ∑ x = 6484 and N = 7, so x̄ = 6484 ÷ 7 = 926.29 mm.
Indirect Method for Ungrouped Data
When values are large, use the indirect (deviation) method: pick an assumed mean A, use d = x - A, and add the mean of d back. Formula: x̄ = A + ∑ dN. With the Malwa data and A = 800, ∑ d = 884, so x̄ = 926.29 mm, matching the direct method.
Direct Method for Grouped Data
For a frequency table, multiply each class midpoint (x) by its frequency (f), sum to get ∑ fx, and divide by N = ∑ f: x̄ = ∑ fxN. The wage-rate example (Table 2.2) gives x̄ = 101 Rs/day.
Median and Mode: Formulas and Worked Examples
Median and mode each use a different formula for grouped versus ungrouped data, and getting it wrong is the most common error in this chapter.
Median for Ungrouped Data
Arrange the values in order. If N is odd, the median is the middle value; if N is even, it is the average of the two middle values.
Example: eight peak heights arranged ascending, with N = 8 (even), give median = (8,201 + 8,485)/2 = 8,343 m.
Median for Grouped Data
Use the interpolation formula M = l + if(N2 - c), where l = lower limit of the median class, i = class interval, f = its frequency, N = total observations, c = cumulative frequency of the previous class.
Tip: The median class is the first class whose cumulative frequency exceeds N/2. Write this step explicitly; CBSE awards 1 mark for identifying it correctly.
Mode for Ungrouped and Grouped Data
For ungrouped data, sort and find the most-repeated value. One mode is unimodal, two is bimodal:
- Unimodal: 61 appears three times, so mode = 61.
- Bimodal: both 11 and 82 appear three times, so mode = 11 and 82.
The Normal Curve and Skewed Distributions
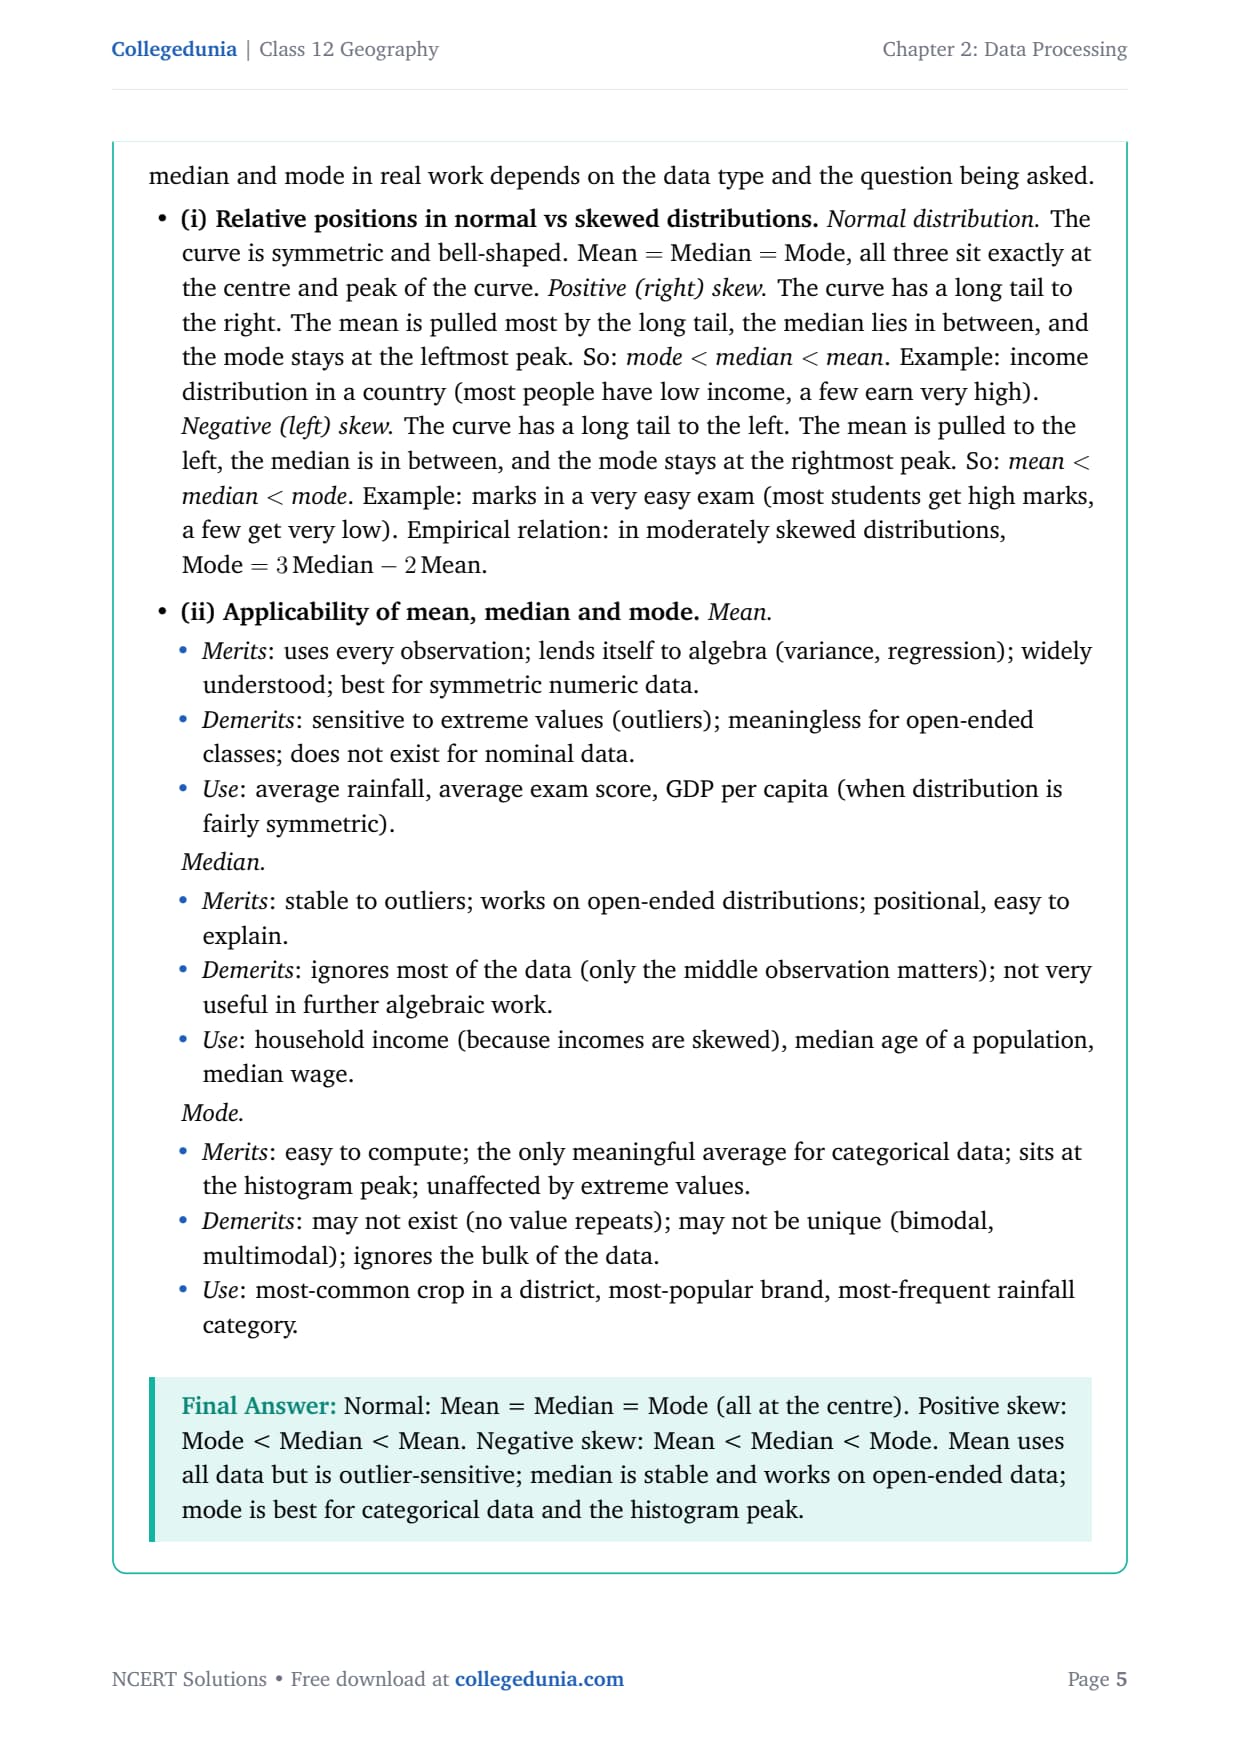
In a normal (bell-shaped) distribution all three coincide: Mean = Median = Mode. In positive skew (tail to the right) the mean is pulled farthest right: Mode < Median < Mean. In negative skew (tail to the left) it reverses: Mean < Median < Mode. The empirical relation for moderate skew is Mode = 3 Median - 2 Mean.
Common Mistakes Students Make in This Chapter
The repeat-offender mistakes in Chapter 2 answers:
- Wrong median formula for even N: average the two middle values, do not just pick one.
- Forgetting to sort before median or mode: both are positional, so always write "Arranged in ascending order:" first.
- Confusing bimodal with no mode: two values tied for highest frequency is bimodal; a modeless set has no repeats at all.
- Reversing the skew direction: positive skew is Mode < Median < Mean; negative skew is Mean < Median < Mode. Draw the curve first.
- Skipping the diagram in Q3(i): a rough bell curve plus two skewed curves with the averages labelled earns 1 to 2 marks.
Previous Year Question Trends from Chapter 2
Data Processing is tested in a predictable pattern. The table below shows the question types across recent board papers.
| Year | Question type asked | Marks |
|---|---|---|
| 2025 | Explain mean, median and mode with their relative positions in a skewed distribution and a diagram | 5 |
| 2024 | What is mode? Explain bimodal and unimodal distributions with examples | 3 |
| 2023 | Calculate mean from the given grouped frequency table of rainfall; show direct and indirect methods | 5 |
| 2022 | Distinguish between mean and median with one advantage of each; state when to prefer median over mean | 3 |
| 2021 | What is a normal distribution curve? How does positive skew change the positions of mean, median and mode? | 3 |
Also Check: The full solutions PDF is in the download above, updated for the 2026-27 CBSE and CUET syllabus.
Other Resources for Class 12 Geography Chapter 2 Data Processing
Pair this with the matching notes, handwritten notes and the official NCERT book chapter, all linked below.
| Resource | What it covers | Open |
|---|---|---|
| NCERT Solutions | Step-by-step answers to all 3 exercise questions, with Expert Solutions and a free PDF download. | You are here |
| Notes | Concept-first revision notes covering mean, median, mode, skewed distributions and the empirical relation. | Class 12 Geography Chapter 2 Notes |
| Handwritten Notes | A topper's genuine handwritten revision pages for last-minute board practice. | Class 12 Geography Chapter 2 Handwritten Notes |
| NCERT Book PDF | Official NCERT Practical Work in Geography Chapter 2 textbook in PDF form. | Class 12 Geography Chapter 2 NCERT Book PDF |
| Subject Hub | All chapters of Class 12 Geography with every resource in one place. | Class 12 Geography Subject Hub |
Practical Work in Geography: All Chapters NCERT Solutions
Related Links: Use the table below for the NCERT Solutions of the other Class 12 Practical Work in Geography chapters, each with the same step-by-step style, PDF and FAQ.
| Chapter | Topic | NCERT Solutions link |
|---|---|---|
| Chapter 1 | Data: Its Source and Compilation | NCERT Solutions for Class 12 Geography Data: Its Source and Compilation |
| Chapter 2 | Data Processing | You are here |
| Chapter 3 | Graphical Representation of Data | NCERT Solutions for Class 12 Geography Graphical Representation of Data |
| Chapter 4 | Spatial Information Technology | NCERT Solutions for Class 12 Geography Spatial Information Technology |
NCERT Solutions for Class 12 Geography Chapter 2: Step-by-Step Answers
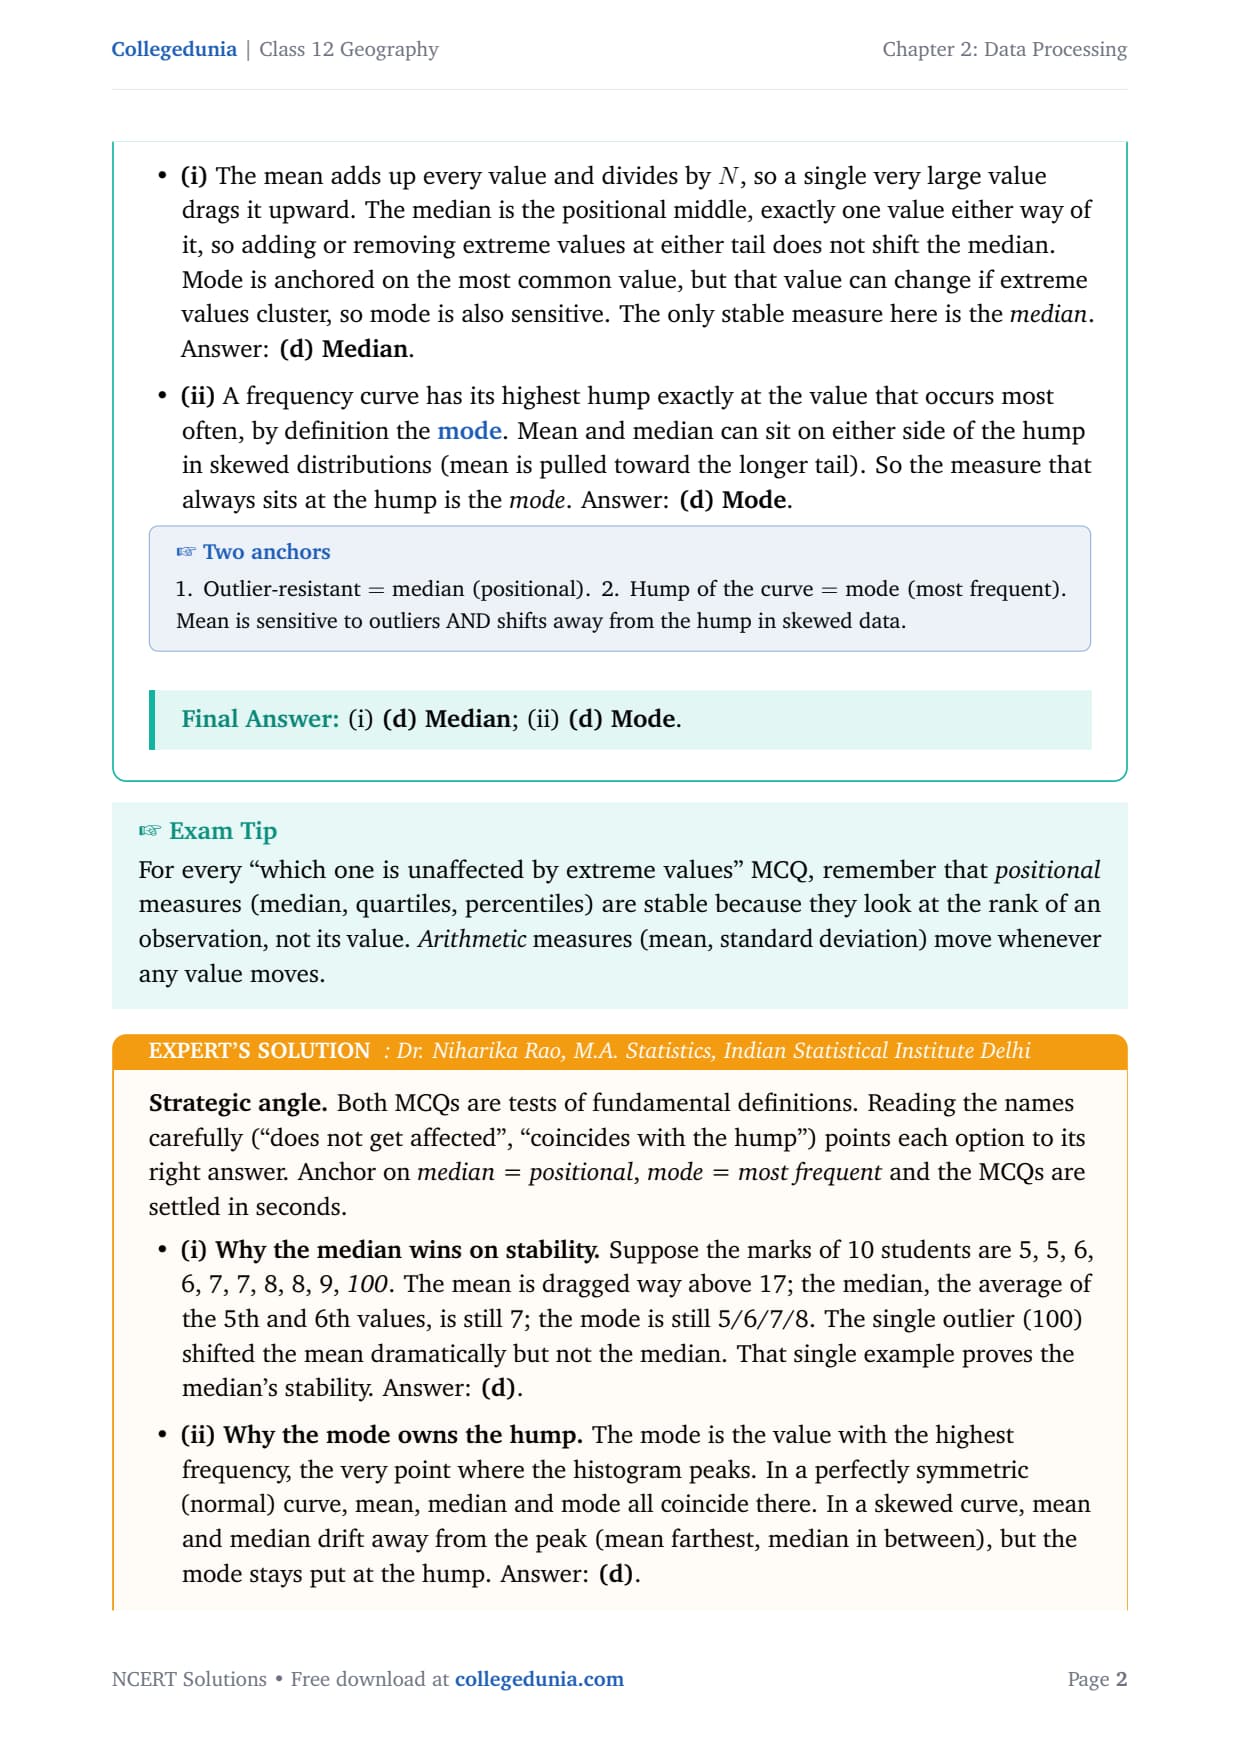
Choose the correct answer from the four alternatives given below:
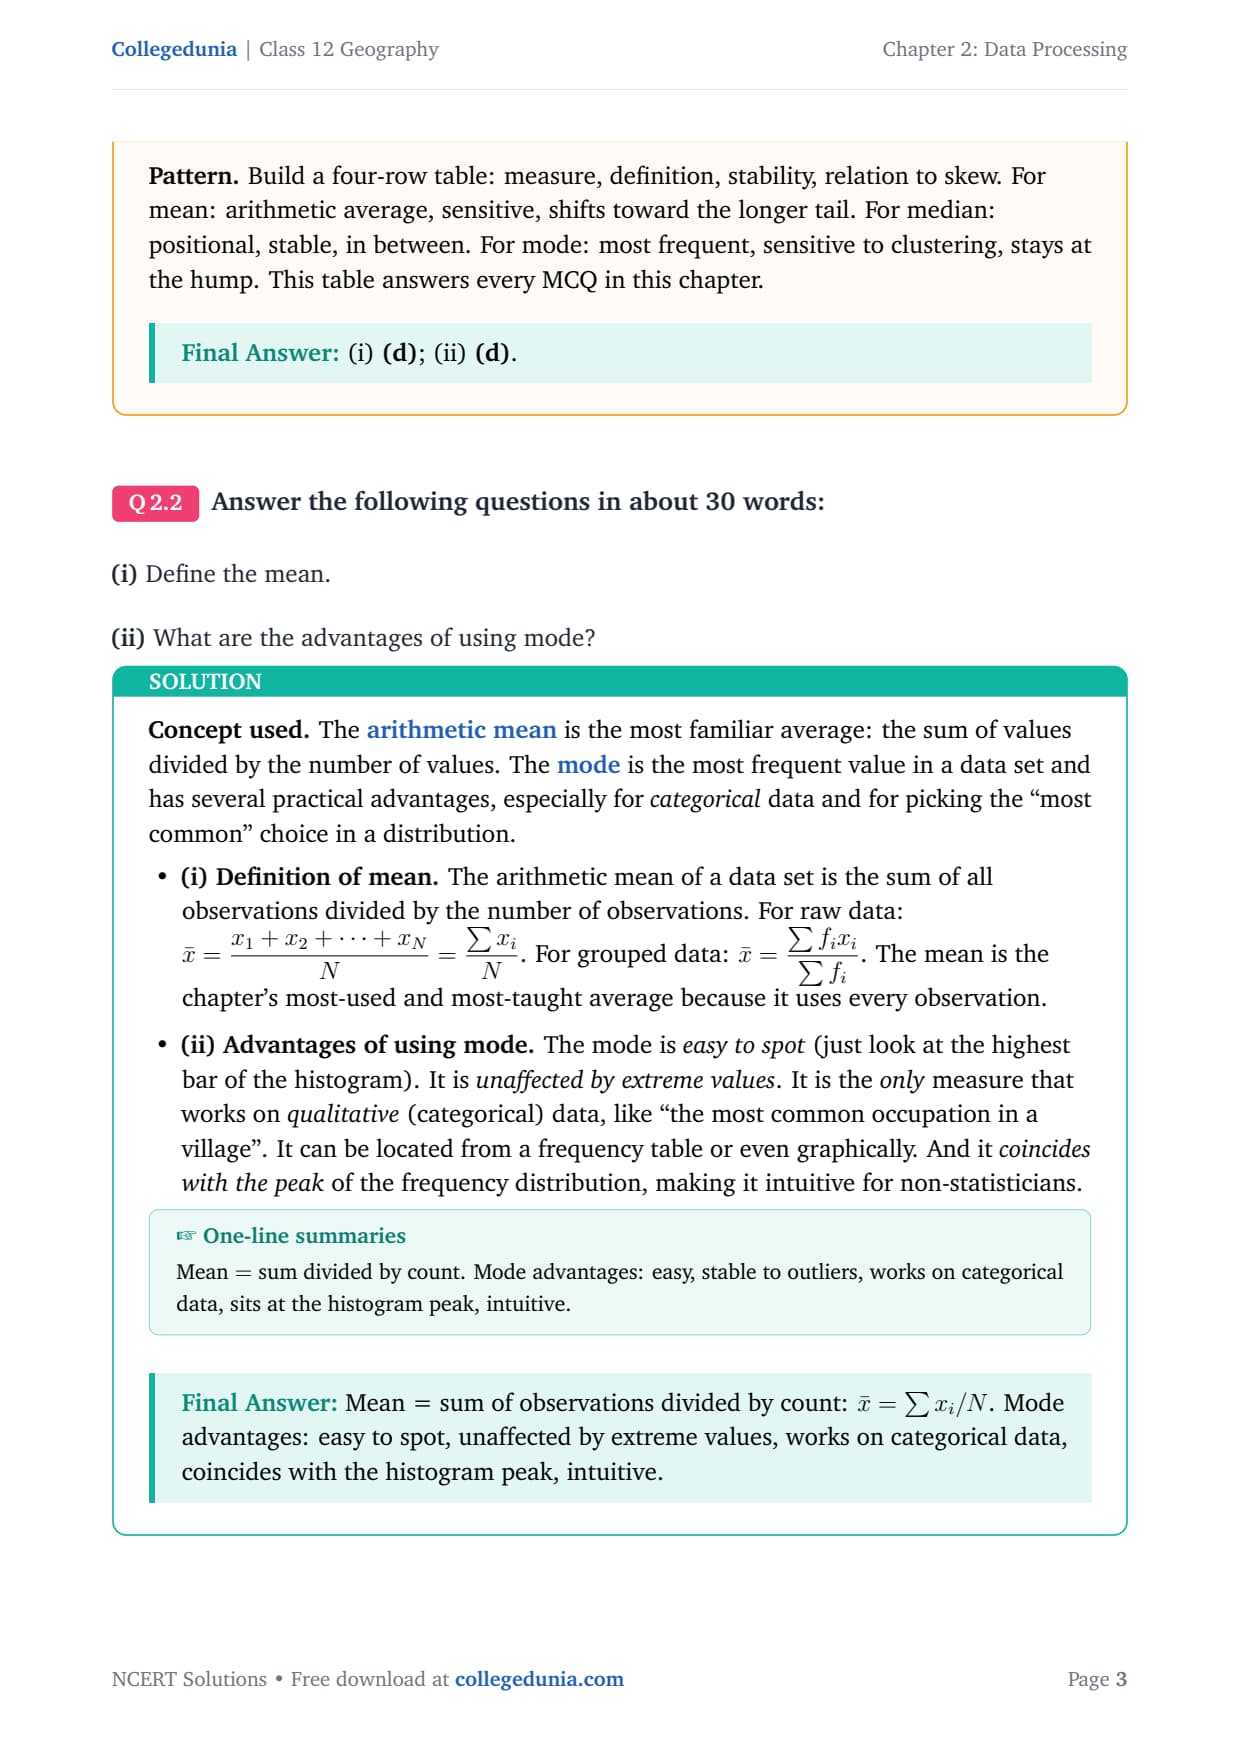
Answer the following questions in about 30 words:
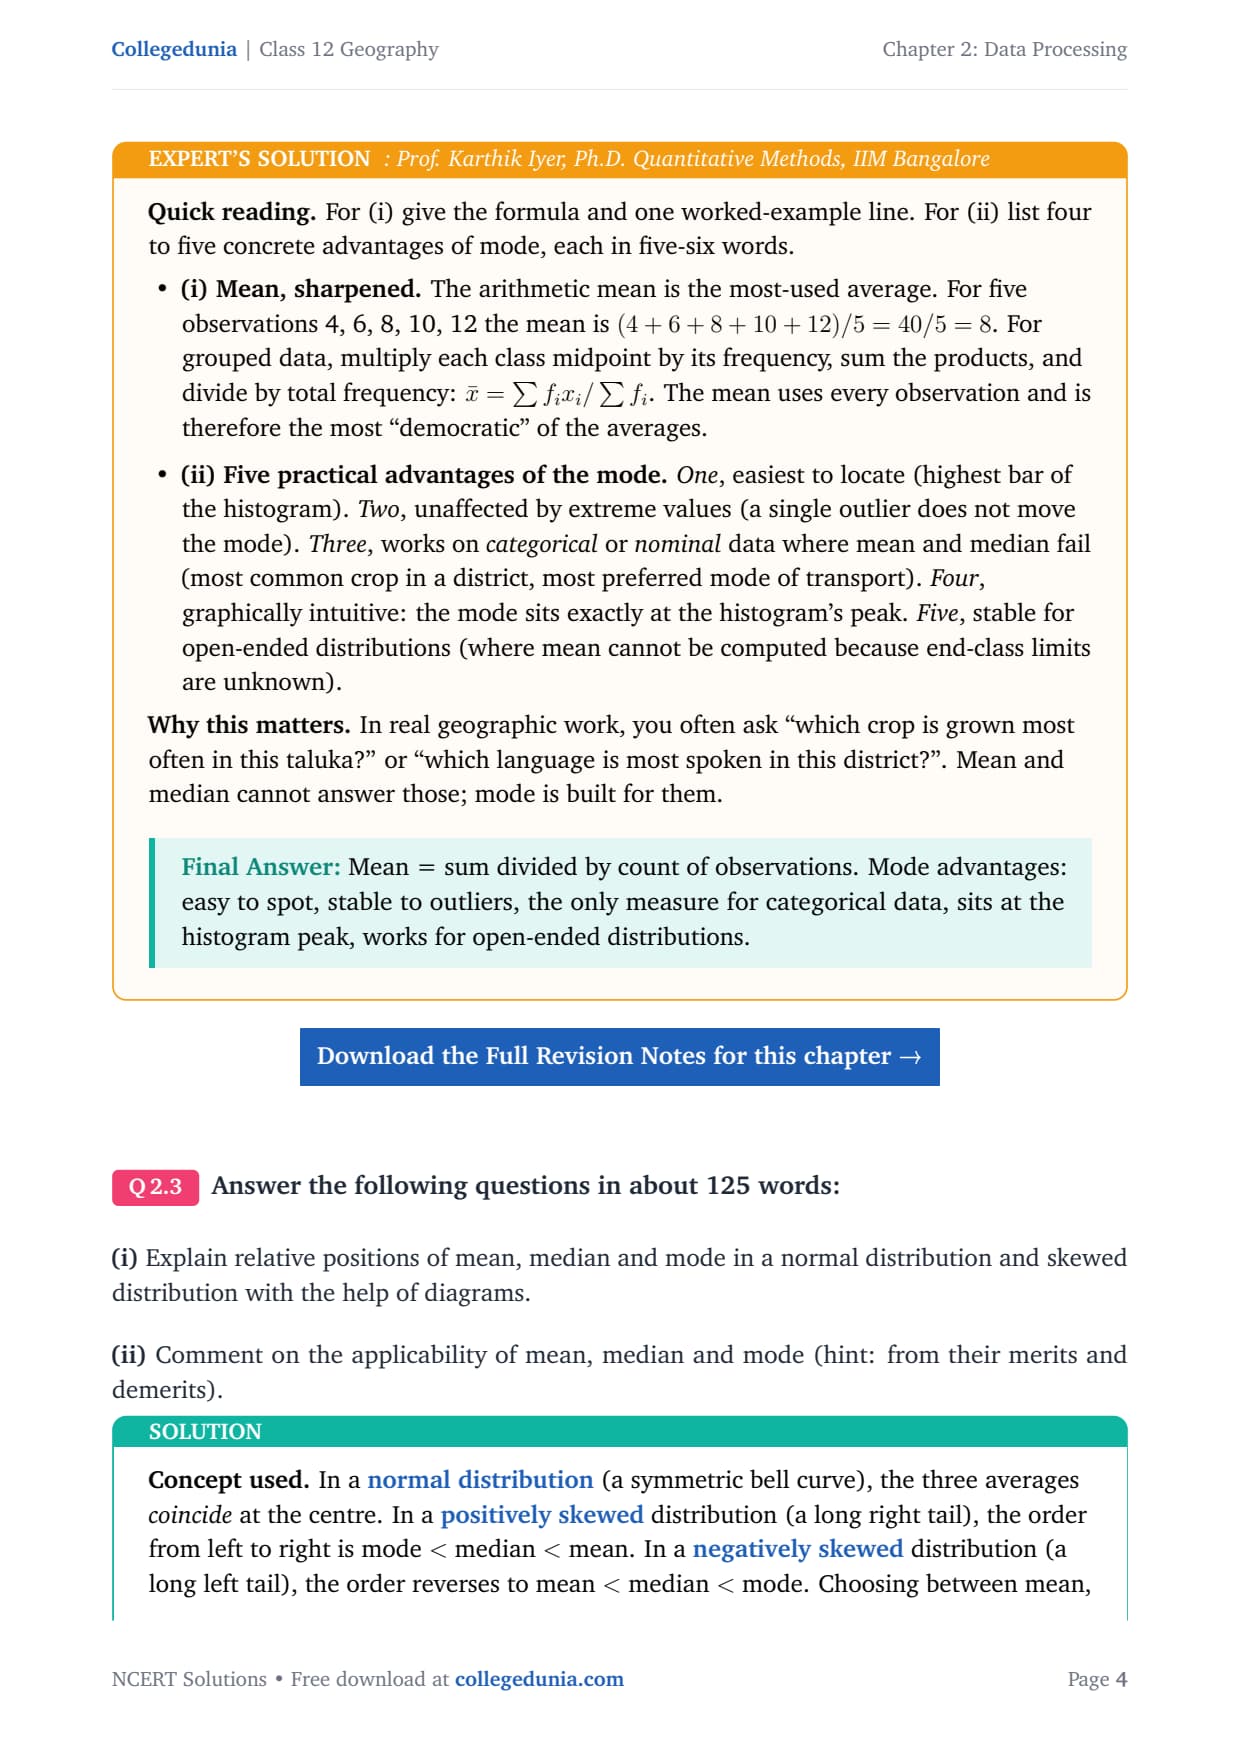
Answer the following questions in about 125 words:
NCERT Solutions Class 12 Geography Chapter 2 Data Processing FAQs
Ques. How many questions are there in NCERT Class 12 Geography Chapter 2 Practical Work in Geography?
Ans. There are 3 end-of-chapter exercise questions in NCERT Class 12 Geography Chapter 2 Data Processing. Question 1 has 2 MCQ sub-parts, Question 2 has 2 short-answer sub-parts (about 30 words each), and Question 3 has 2 long-answer sub-parts (about 125 words each). All questions are solved with full plain-English working and Expert Solutions in our data processing class 12 ncert solutions PDF.
Ques. What is the difference between mean, median and mode in Class 12 Geography?
Ans. All three are measures of central tendency, meaning they give a single representative value for a dataset. The mean is the arithmetic average: sum of all values divided by the count. It uses every observation but is sensitive to extreme values. The median is the middle value of an ordered dataset; it is positional and not affected by outliers. The mode is the value that occurs most often; it always sits at the peak (hump) of the frequency curve and is the only measure that works on categorical data. The NCERT chapter covers direct and indirect methods of computing the mean for both ungrouped and grouped data.
Ques. What are the relative positions of mean, median and mode in a normal distribution?
Ans. In a normal (symmetric bell-shaped) distribution, Mean = Median = Mode. All three coincide at the centre of the curve. In a positively skewed distribution (long tail to the right), the order is Mode less than Median less than Mean, with the mean pulled furthest toward the long tail. In a negatively skewed distribution (long tail to the left), the order reverses: Mean less than Median less than Mode. The empirical relation for moderately skewed distributions is Mode = 3 Median - 2 Mean. In a CBSE board answer for Q3(i), always draw all three curves and label the averages on each for full marks.
Ques. What are the advantages of using the mode in geographical analysis?
Ans. The mode has five practical advantages in geography: (1) it is the easiest average to locate - just find the value with the highest frequency; (2) it is not affected by extreme values, so one unusually high rainfall year does not distort it; (3) it is the only average that works on categorical data, for example "most common crop in a district" or "most frequent wind direction" - questions that mean and median cannot answer; (4) it sits exactly at the histogram peak, making it the most intuitive average for visual data; and (5) it can be used even when end-class limits are open and the mean cannot be computed. These five advantages are the expected answer to NCERT Q2(ii).
Ques. How do you calculate the median for grouped data in Class 12 Geography?
Ans. For grouped data, use the interpolation formula: M = l + (i/f)(N/2 - c), where M is the median, l is the lower limit of the median class, i is the class interval, f is the frequency of the median class, N is the total number of observations, and c is the cumulative frequency of the class before the median class. To identify the median class: compute N/2, then scan the cumulative frequency column and find the first class whose cumulative frequency exceeds N/2. Always write the identified median class explicitly in your answer before substituting into the formula, as CBSE markers award a separate step mark for this.
Ques. What is the empirical relation between mean, median and mode?
Ans. The empirical relation is: Mode = 3 Median - 2 Mean. This relation holds approximately for moderately skewed distributions. It means if you know any two of the three averages, you can estimate the third. For example, if Mean = 50 and Median = 45, then Mode = (3 x 45) - (2 x 50) = 135 - 100 = 35. This relation is directly implied by the positions of the three averages on the frequency curve: in a positively skewed curve, the mean is largest, then median, then mode, and this formula maintains that gap relationship. It appears as a 1-mark or 2-mark question in CBSE board papers for this chapter.
Ques. What is a normal distribution curve and why does the NCERT chapter discuss it?
Ans. A normal distribution curve is a bell-shaped, symmetric frequency curve where most observations cluster around the central value and frequency decreases equally on both sides. In a perfect normal distribution, Mean = Median = Mode, all three coincide at the apex. The NCERT chapter (Fig. 2.1) introduces it as a reference shape because many natural phenomena in geography (temperatures across a region, heights across a population) roughly follow this distribution. The chapter then introduces positive skew (Fig. 2.2) and negative skew (Fig. 2.3) as departures from this symmetric ideal, and explains how the three averages separate in each case. Understanding the normal curve is the foundation for answering Q3(i) correctly.
Ques. What is the indirect method of computing the mean, and when is it used?
Ans. The indirect (or deviation) method of computing the mean is used when raw values are large and adding them directly is tedious. You choose an assumed mean (A), compute the deviation d = x - A for each observation, find the mean of the deviations, and add it back to A. Formula: Mean = A + (Sum of d / N). The NCERT chapter uses the Malwa Plateau rainfall data with A = 800 mm as an example, giving the same result (926.29 mm) as the direct method. The indirect method is faster for large datasets and is also extended to grouped data using a step-deviation variant with a coding factor. Both the direct and indirect methods must give identical answers, which is the expected verification check in a board exam.
Ques. Is the Class 12 Geography Practical Work in Geography syllabus changing for 2026-27?
Ans. No major changes to the Practical Work in Geography Part II syllabus for 2026-27. The four-chapter structure (Data: Its Source and Compilation; Data Processing; Graphical Representation of Data; Spatial Information Technology) is unchanged for the current cycle. Chapter 2 Data Processing continues to cover the three measures of central tendency (mean, median, mode) using both ungrouped and grouped data methods. CBSE marking continues to reward formula-then-substitution layout, explicitly labelled median class identification, and diagrams for skewed-distribution questions. Our class 12 geography chapter 2 ncert solutions for 2026-27 are aligned to the unchanged textbook and the latest CBSE sample paper released for the 2026 boards.



Comments