




These Class 12 Geography Chapter 2 Data Processing notes cover every NCERT definition and the mean, median and mode formulas for ungrouped and grouped data, aligned to the 2026-27 syllabus. They are built for a quick, full-chapter revision the night before the exam.
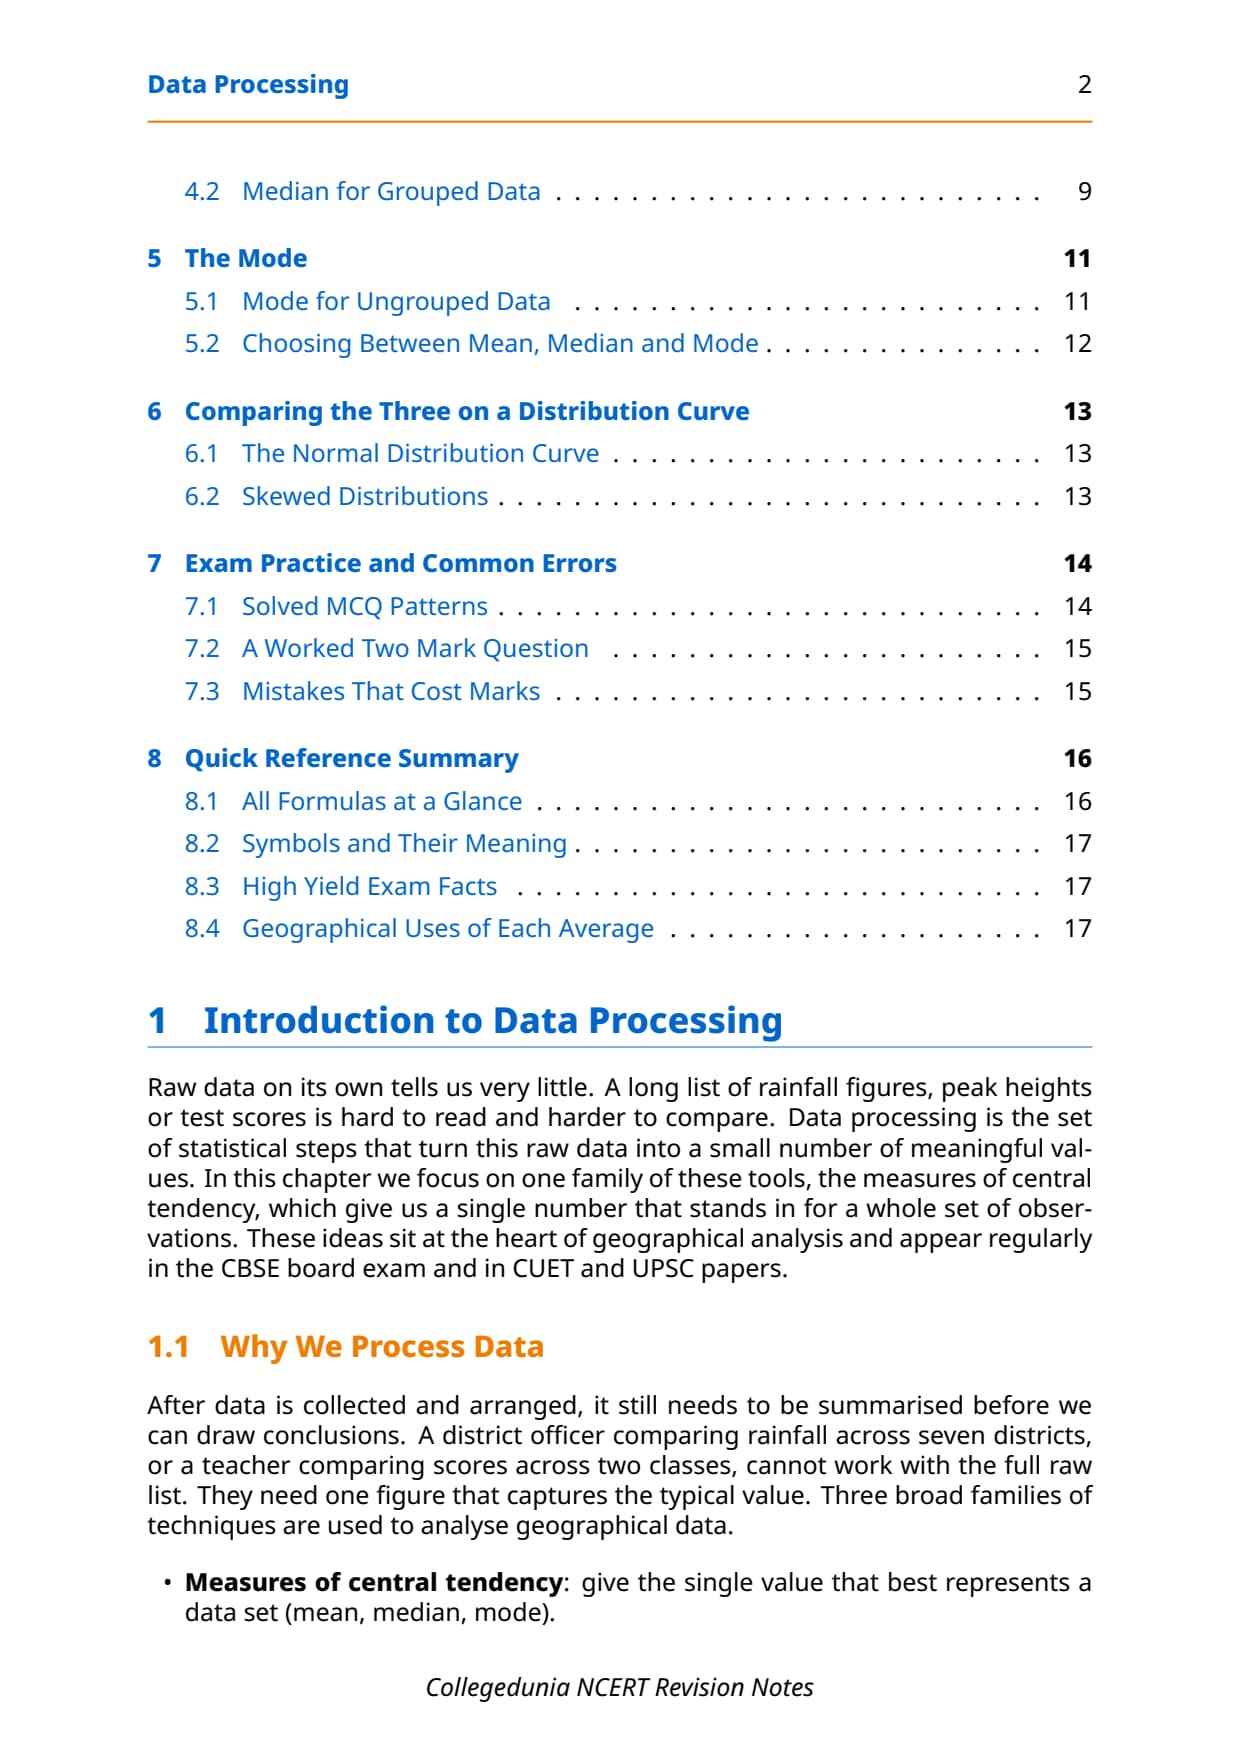
- Concept-first revision: measures of central tendency, direct and indirect methods for mean, median and mode, normal distribution and skewness.
- Every formula laid out as a printable one-glance sheet, matching the NCERT textbook structure.
- Common mistake alerts mapped to the errors CBSE and CUET examiners flag most often, plus cross-pointers to the matching NCERT Solutions, Handwritten Notes and NCERT Book PDF.
Written by Collegedunia geography subject experts, mapped to the 2026-27 NCERT Practical Work in Geography (Part II) textbook and checked against five years of CBSE and CUET Geography papers.
Student Feedback
72% of Class 12 Geography students found the direct vs indirect method of computing mean the most confusing part of this chapter; most finished a full revision from these notes in about 28 minutes.
Source: 2026-27 Class 12 Geography student poll, 9,200 CBSE students.
Quick Concept Recap: Data Processing at a Glance
Chapter 2 of NCERT Class 12 Practical Work in Geography teaches students to summarise raw geographical data using measures of central tendency: mean, median and mode. Picking the right measure for the right data type is the key skill this chapter tests.
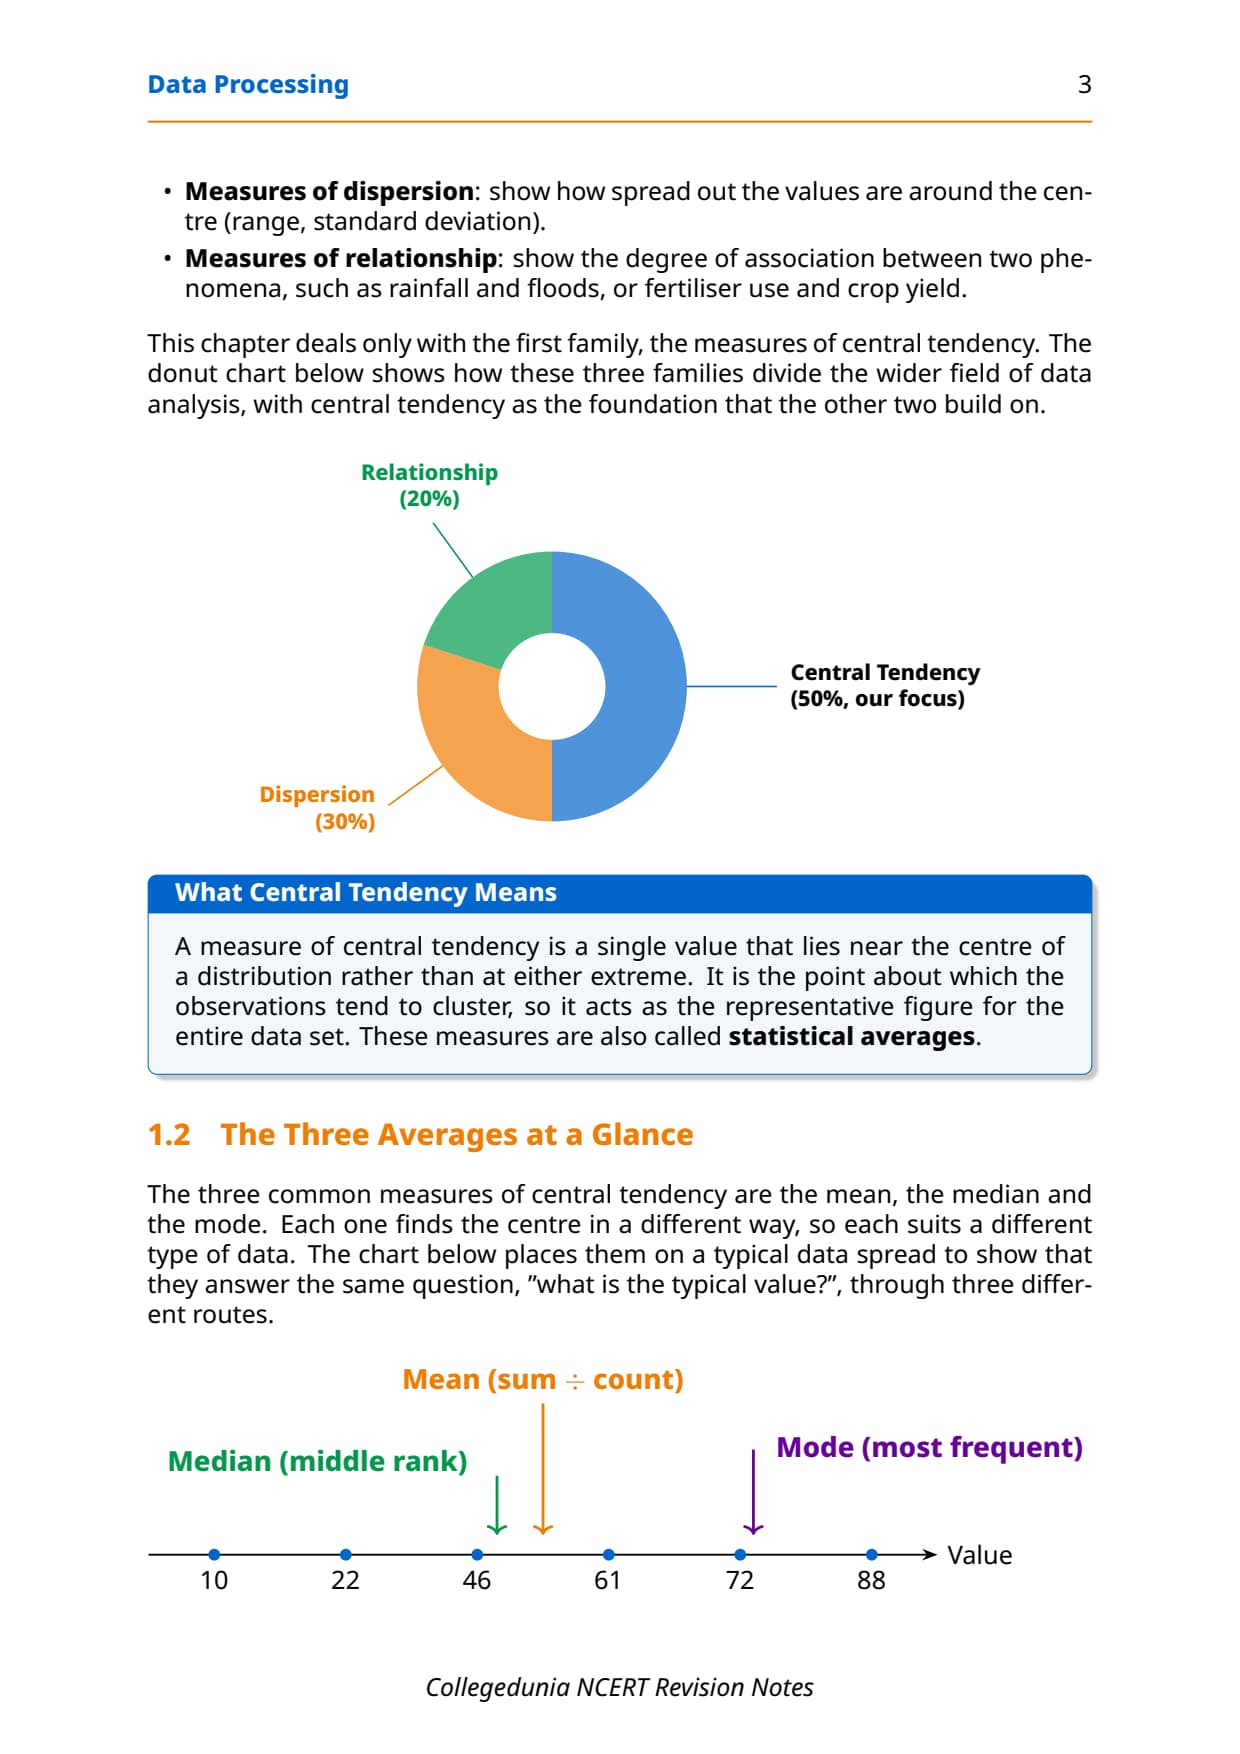
- Three measures: mean (arithmetic average), median (middle value after ranking), mode (most frequent value).
- Two contexts, two methods for mean: ungrouped or grouped data, calculated by the direct or the indirect (assumed mean) method.
- Normal distribution and skewness: a symmetrical curve has mean = median = mode; skewed data pull the three apart.
Read these notes first, then use the matching NCERT Solutions for Class 12 Geography Chapter 2 for the worked drill.
Source: Examrace on YouTube
Measures of Central Tendency: Key Definitions
Every theory question in CBSE Class 12 Geography practicals starts with a definition. These match the vocabulary used in the downloadable PDF version of these notes.
| Term | One-line definition | NCERT chapter pointer |
|---|---|---|
| Central Tendency | A single value that best represents all observations in a dataset; it lies near the centre of a distribution rather than at either extreme. | Opening section |
| Mean | The arithmetic average: the sum of all values divided by the total number of observations. | Mean section |
| Median | The value of the middle-ranking item when all observations are arranged in ascending or descending order; it divides the series into two equal halves. | Median section |
| Mode | The value that occurs most frequently in a distribution; symbolised as Z or M0. | Mode section |
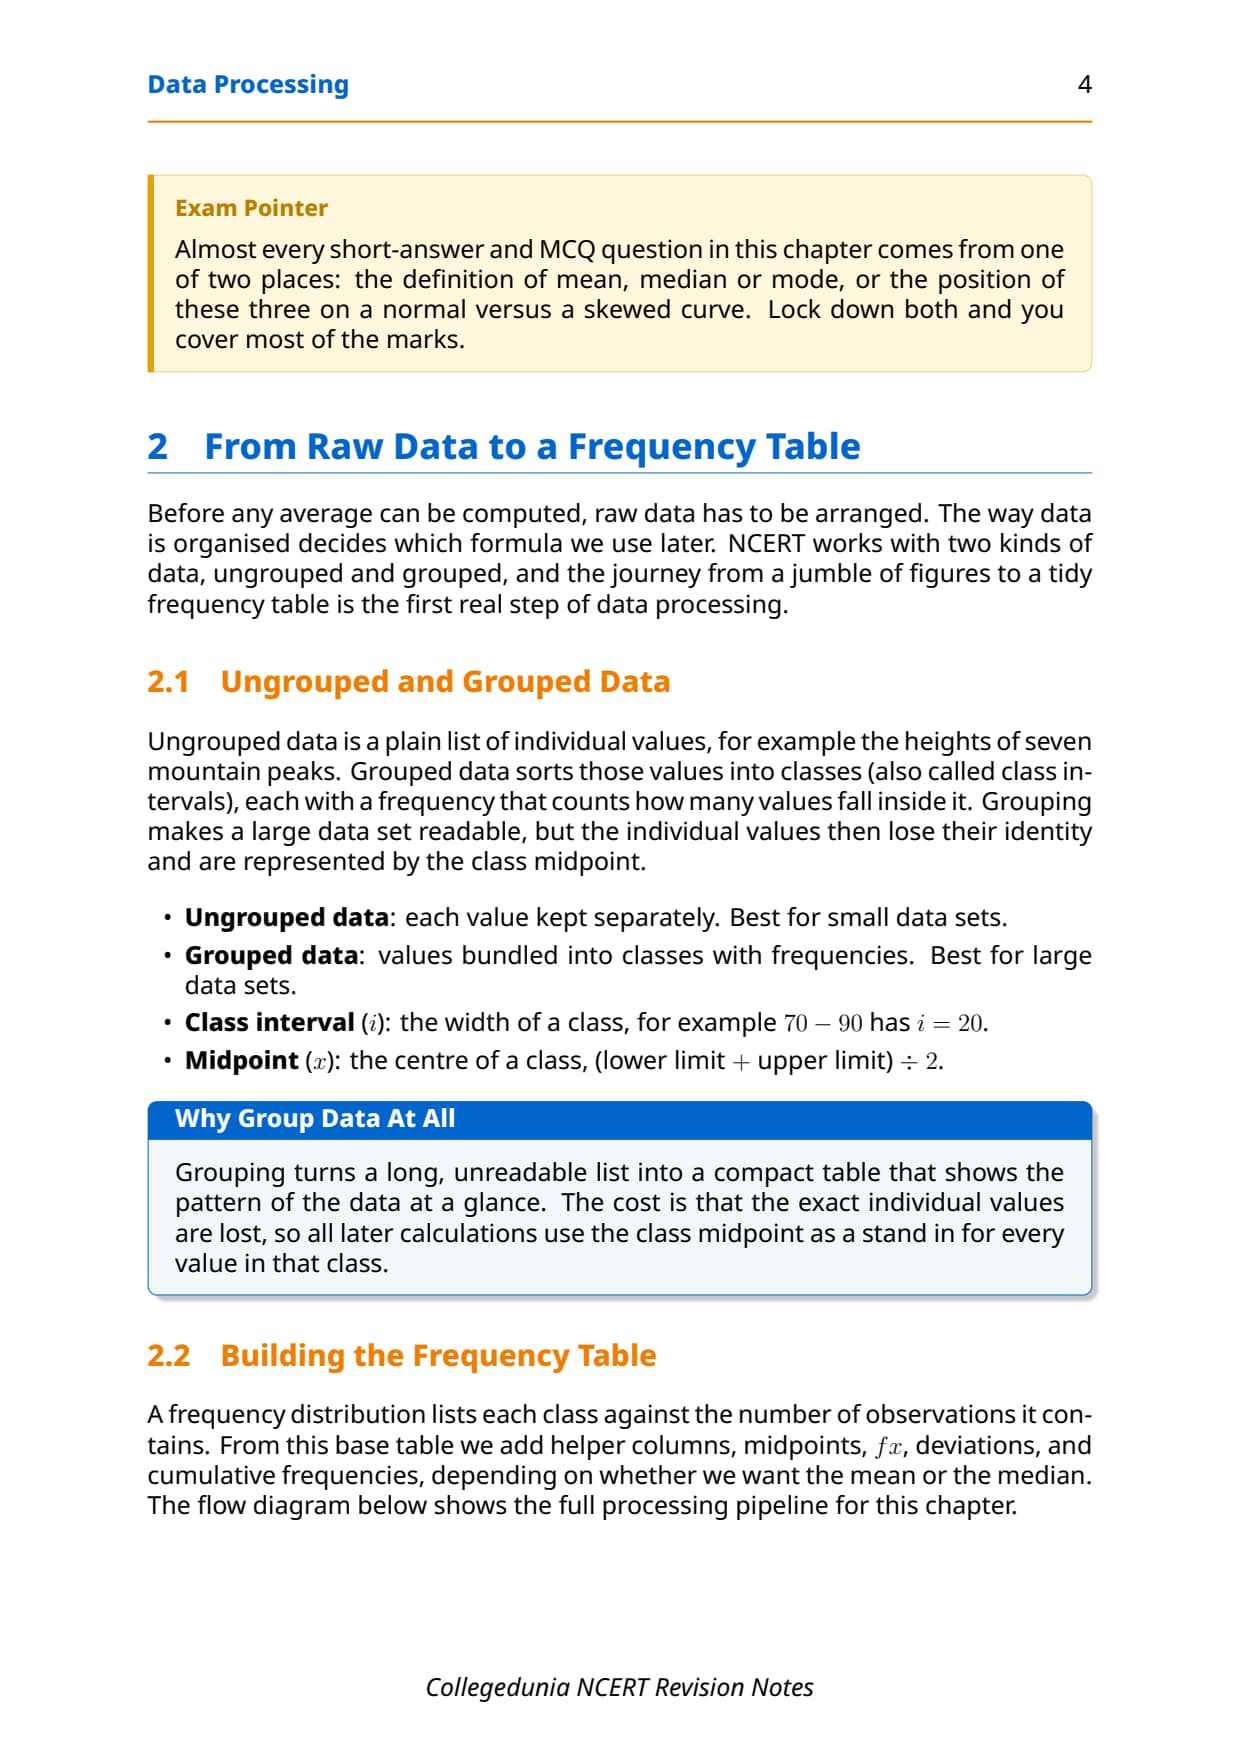
| Ungrouped Data | Raw scores that have not been arranged into a frequency distribution; each individual value is used directly in calculation. | Computing Mean |
| Grouped Data | Data arranged into class intervals with corresponding frequencies; individual values lose their identity and are represented by class midpoints. | Grouped Mean section |
| Assumed Mean (A) | A constant subtracted from each value in the indirect method to reduce computation; ideally chosen near the middle of the distribution. | Indirect Method |
| Median Class | The class interval in a grouped frequency distribution that contains the N/2-th observation; used as the base for the grouped median formula. | Grouped Median section |
| Unimodal / Bimodal | A distribution with one mode is unimodal; two equally frequent values give a bimodal distribution; three or more give a multimodal distribution. | Mode section |
| Normal Distribution | A symmetrical bell-shaped frequency curve where mean, median and mode all coincide at the centre of the distribution. | Comparison section |
These ten definitions cover most of the one-mark and 3-mark theory questions CBSE and CUET have asked on this chapter since 2021, so learn them first.
Mean: Direct and Indirect Methods with Formulas
NCERT teaches four routes to the mean, direct and indirect for both ungrouped and grouped data. All four give the same final answer.
Mean from Ungrouped Data
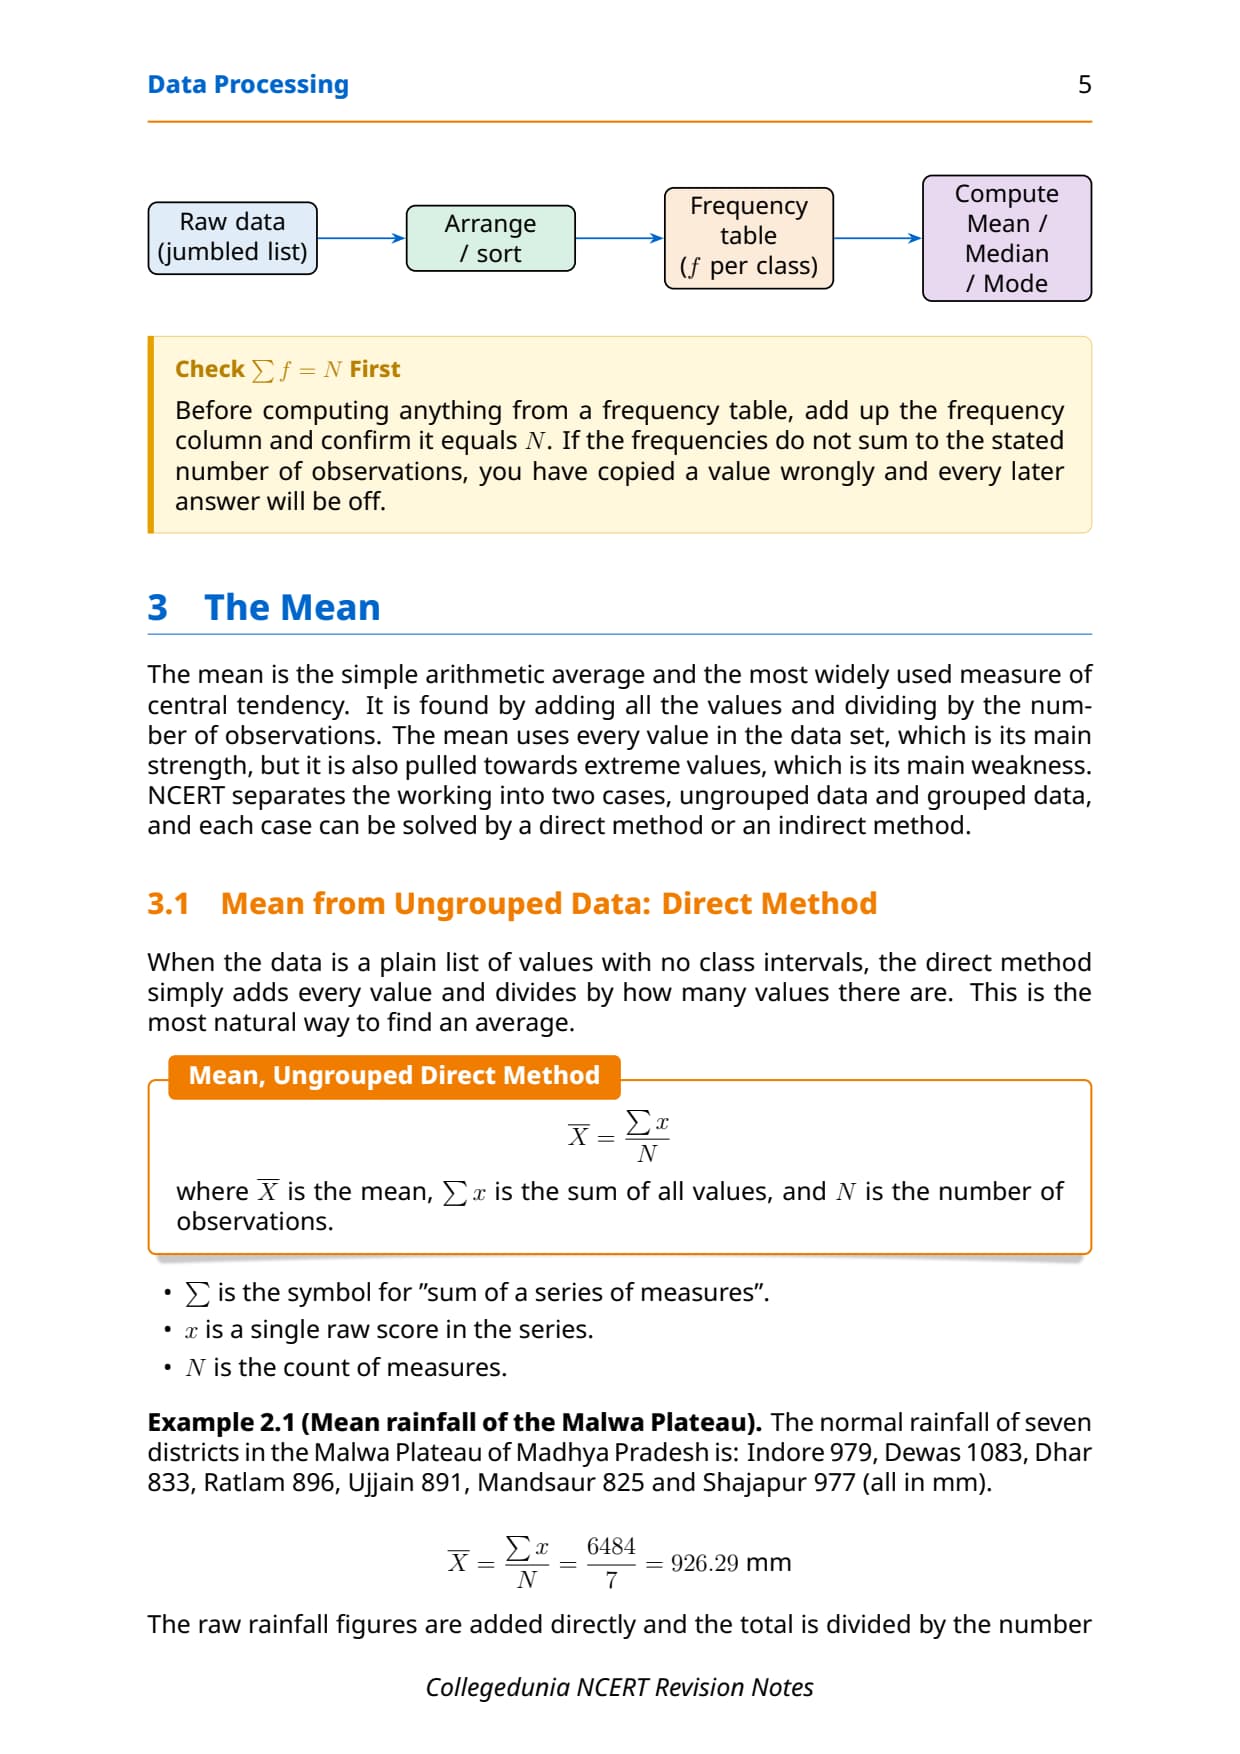
Direct method: Mean (X) = Sum of all observations / N. Example 2.1: rainfall for 7 Malwa Plateau districts sums to 6,484 mm, so Mean = 6,484 / 7 = 926.29 mm.
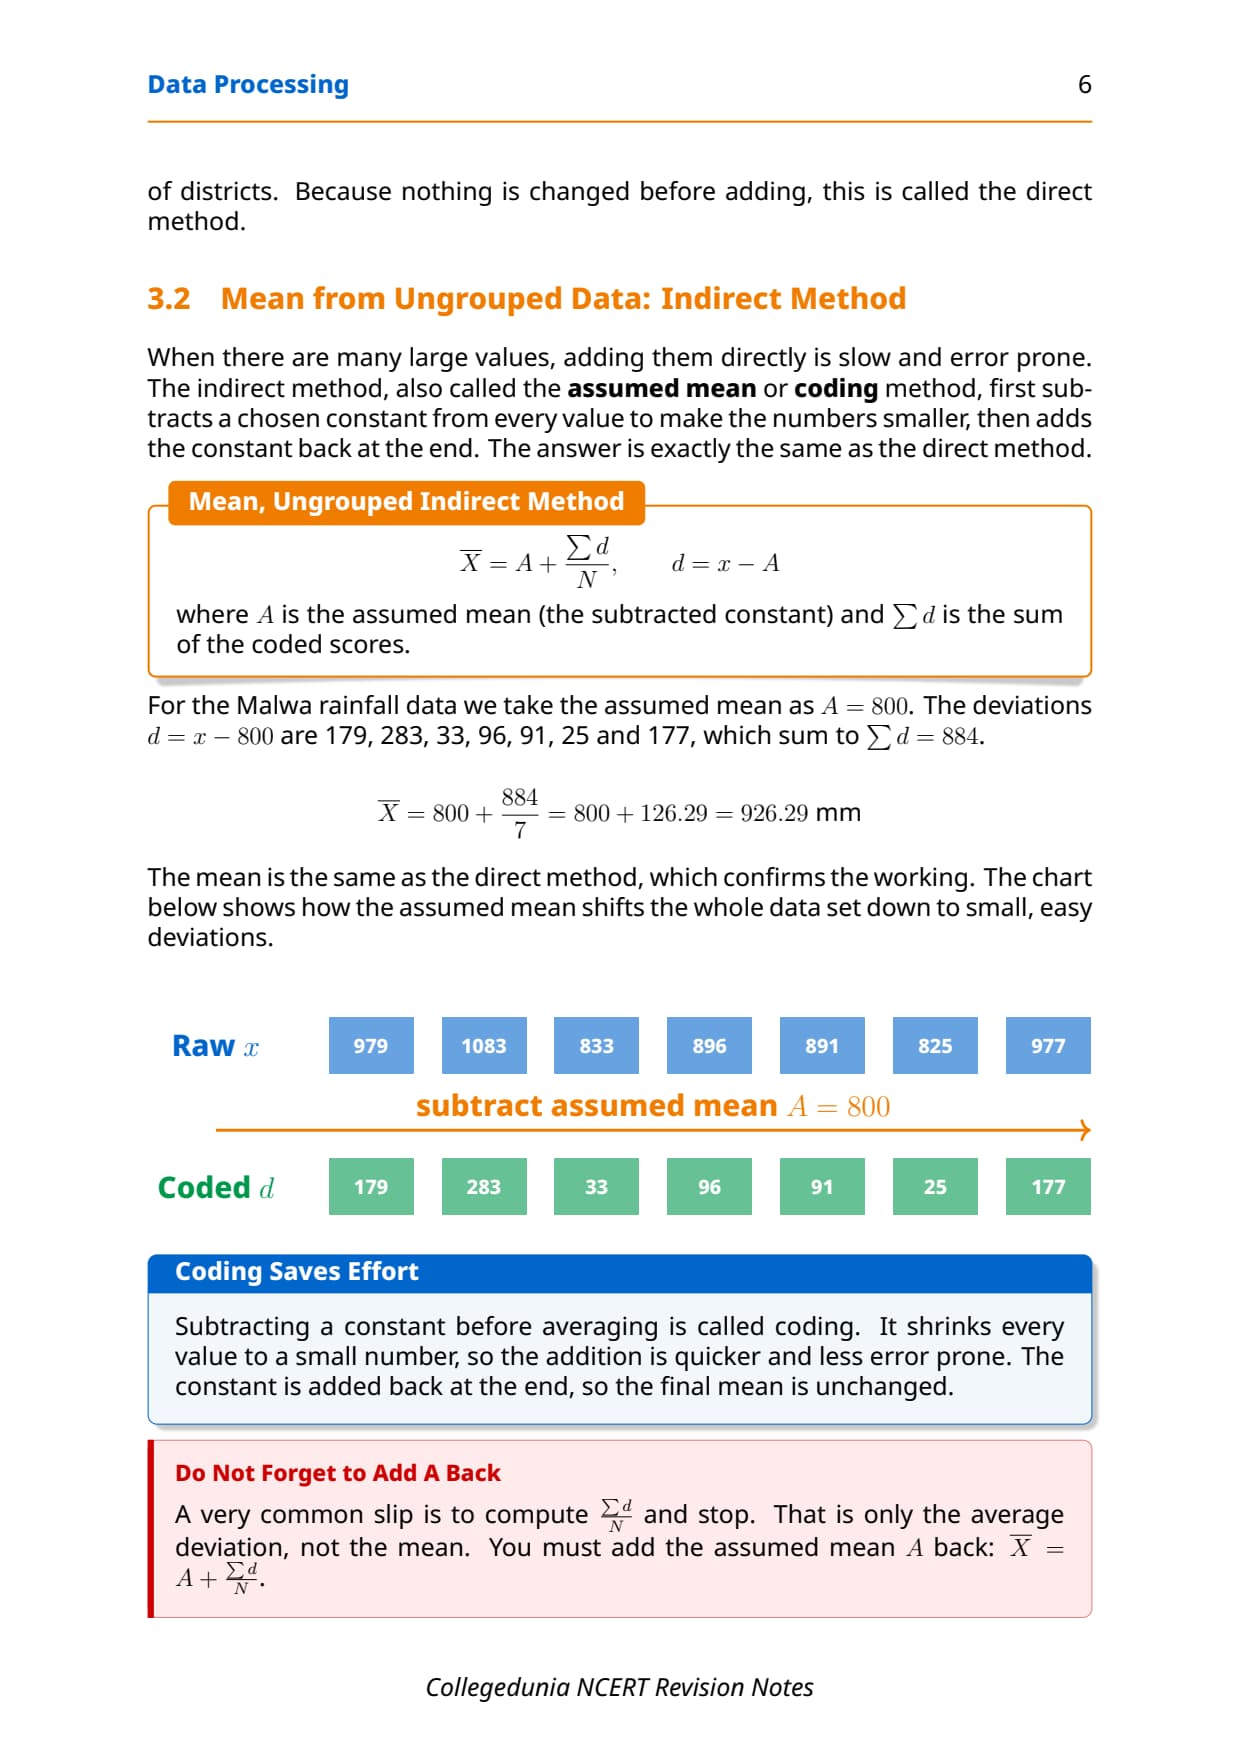
Indirect method: choose an assumed mean (A), find deviations (d), then Mean (X) = A + (Sum of deviations / N). Using A = 800, sum of deviations = 884, so Mean = 800 + (884/7) = 926.29 mm, same as the direct method.
Mean from Grouped Data
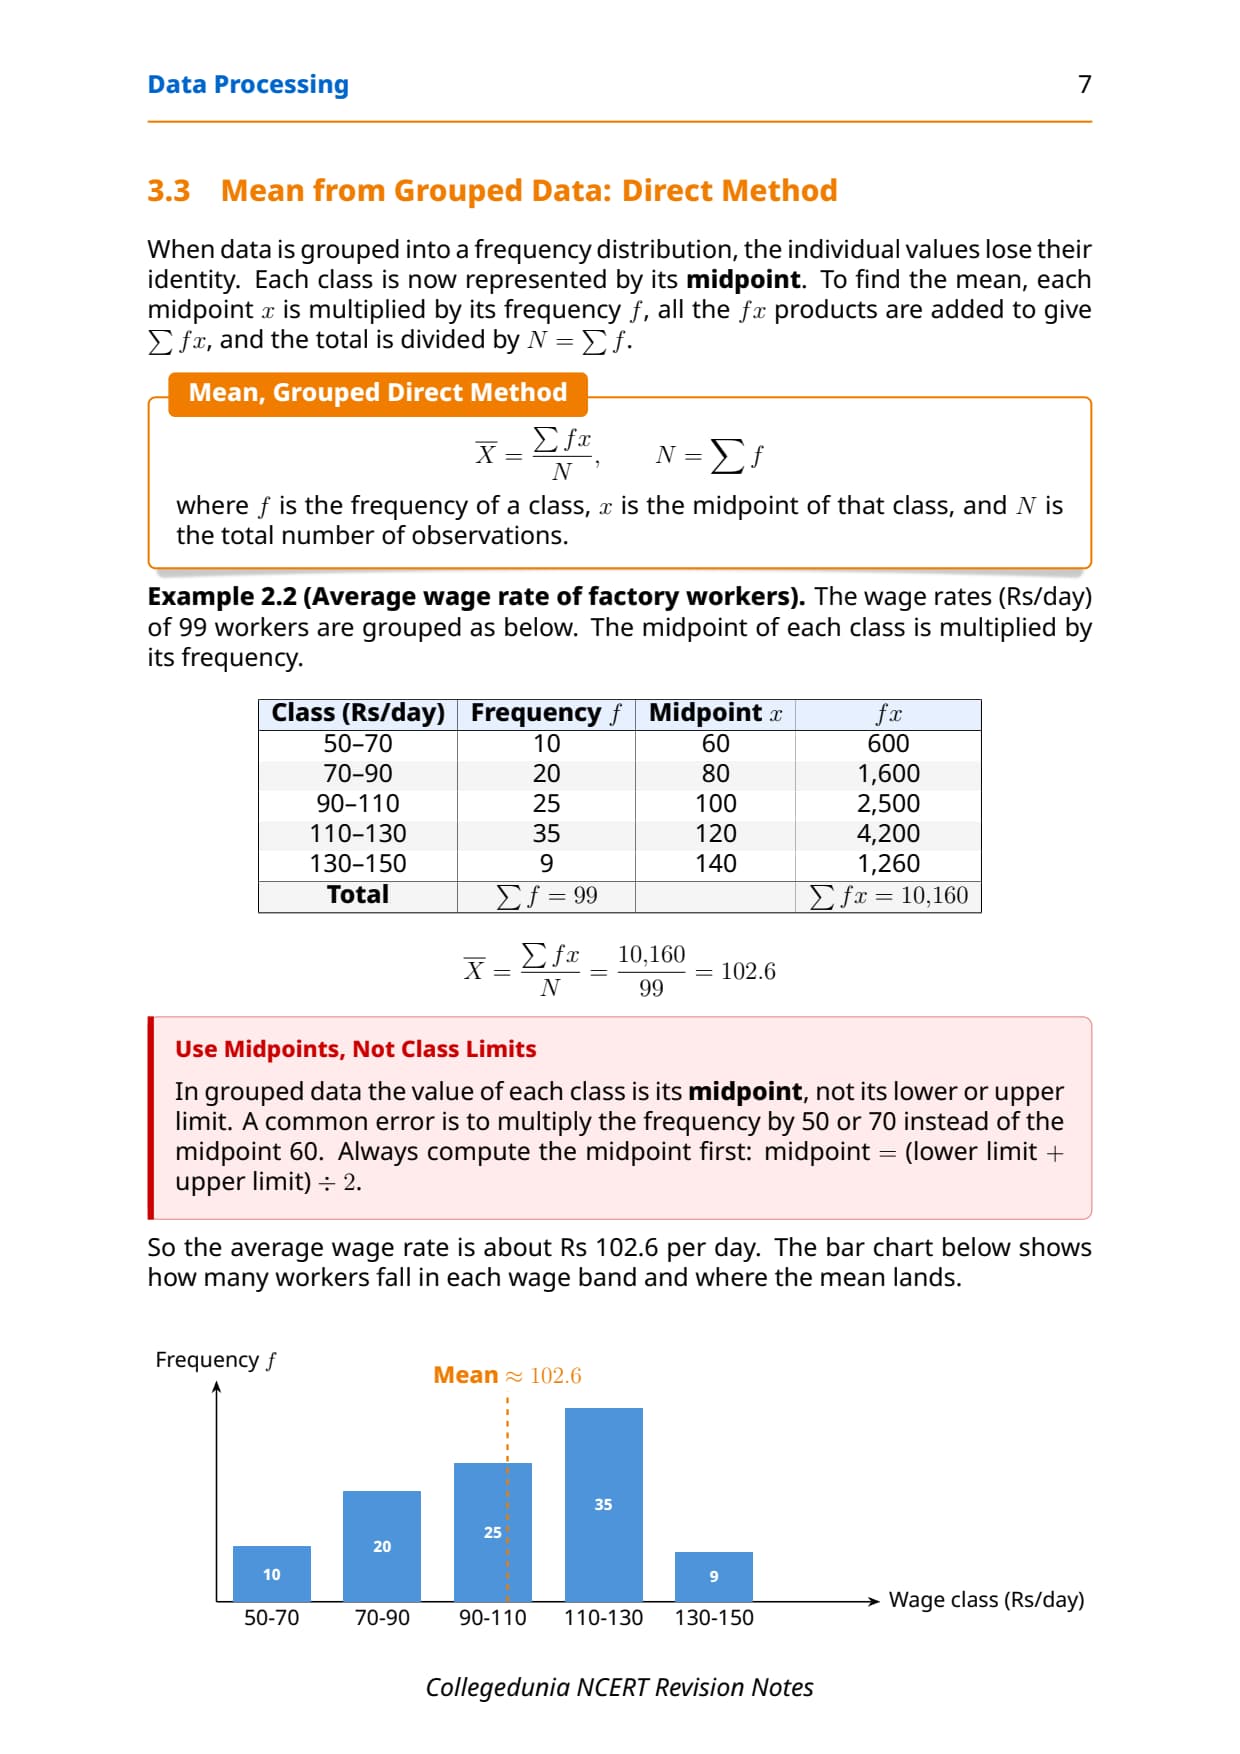
Direct method: multiply each class midpoint (x) by its frequency (f), sum the fx values, and divide by N: Mean (X) = Sum of (f times x) / N.
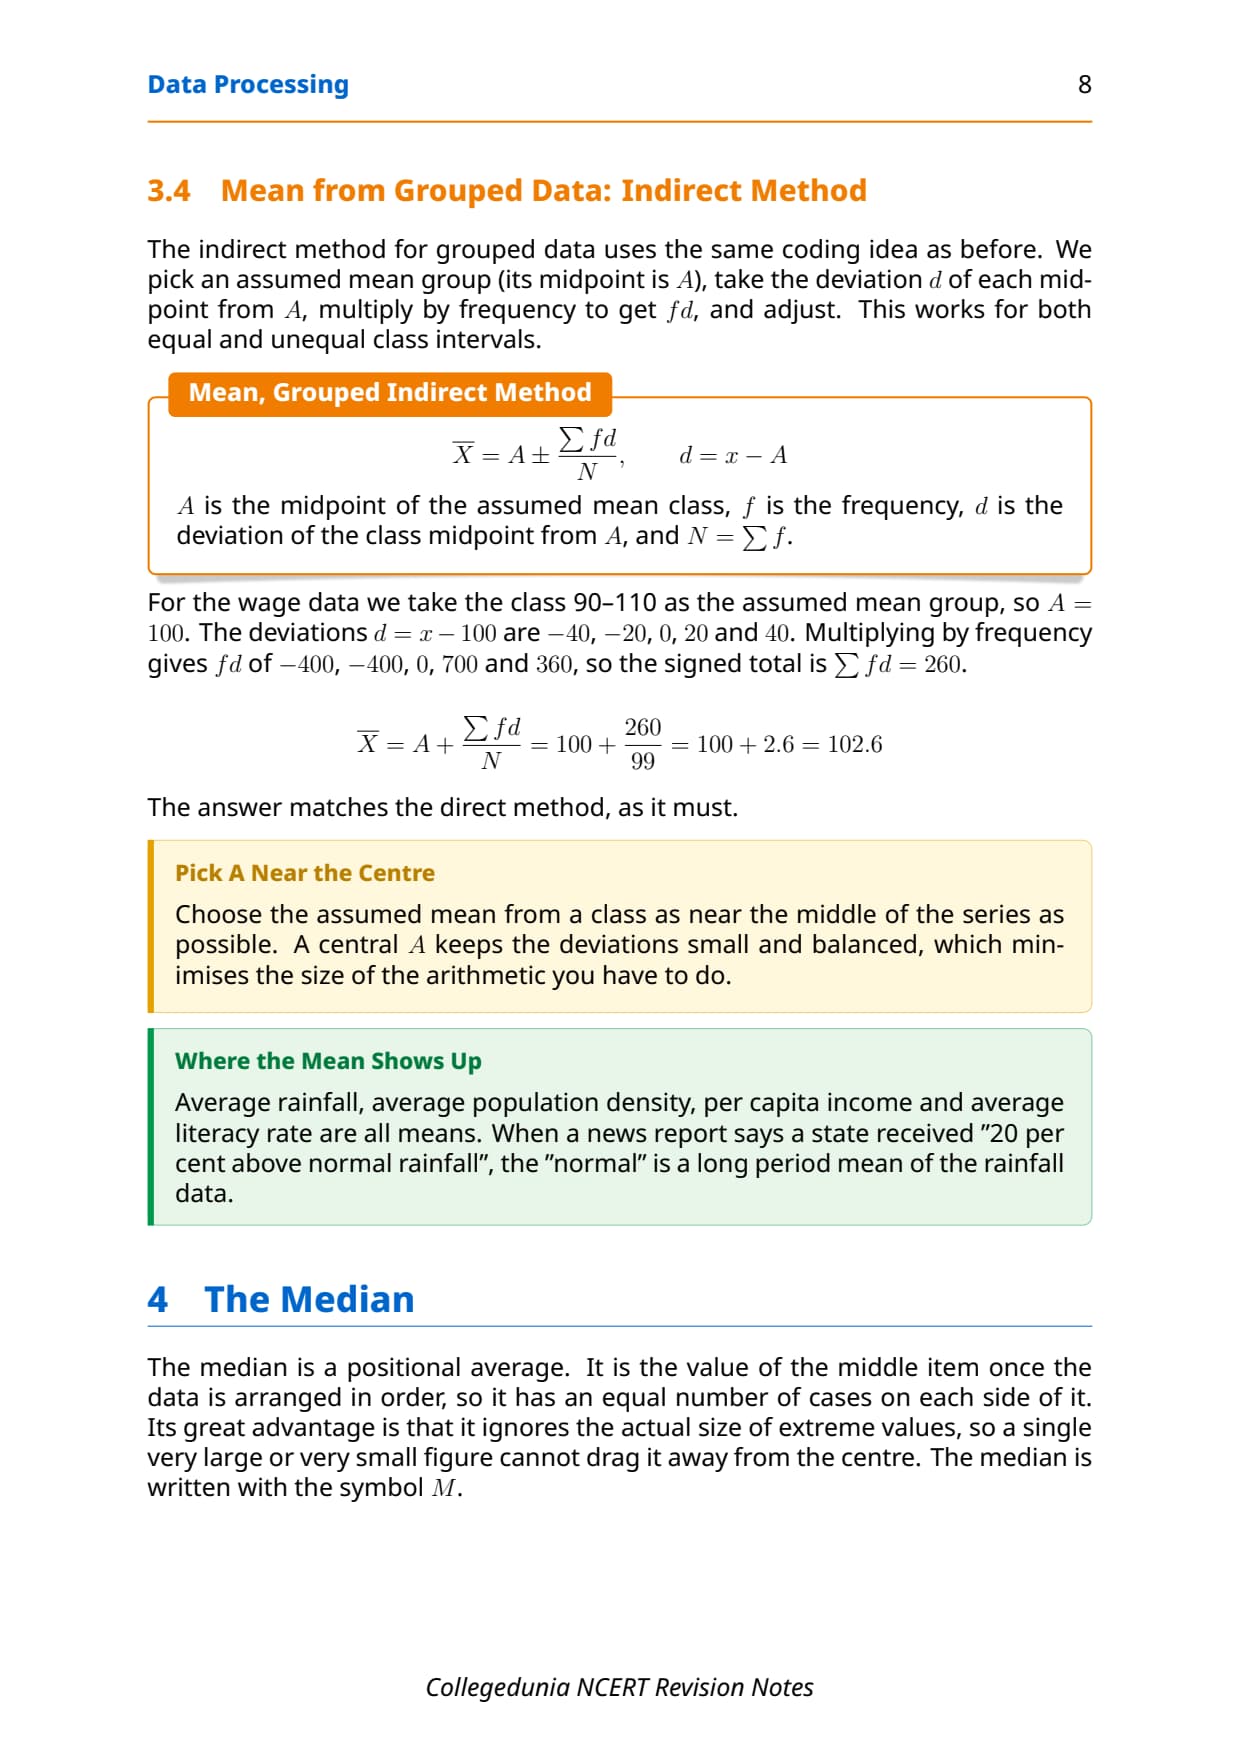
Indirect method: pick a midpoint near the centre as A, find deviations from it, and apply Mean (X) = A + (Sum of fd / N). It works well for unequal class intervals too.
Memory hook: indirect method just adds one coding step (subtract an assumed mean) before the same calculation.
Median: Ungrouped and Grouped Data Formulas
The median is a positional average: it uses rank, not magnitude, which makes it the best measure when extreme values would distort the mean.
Median from Ungrouped Data
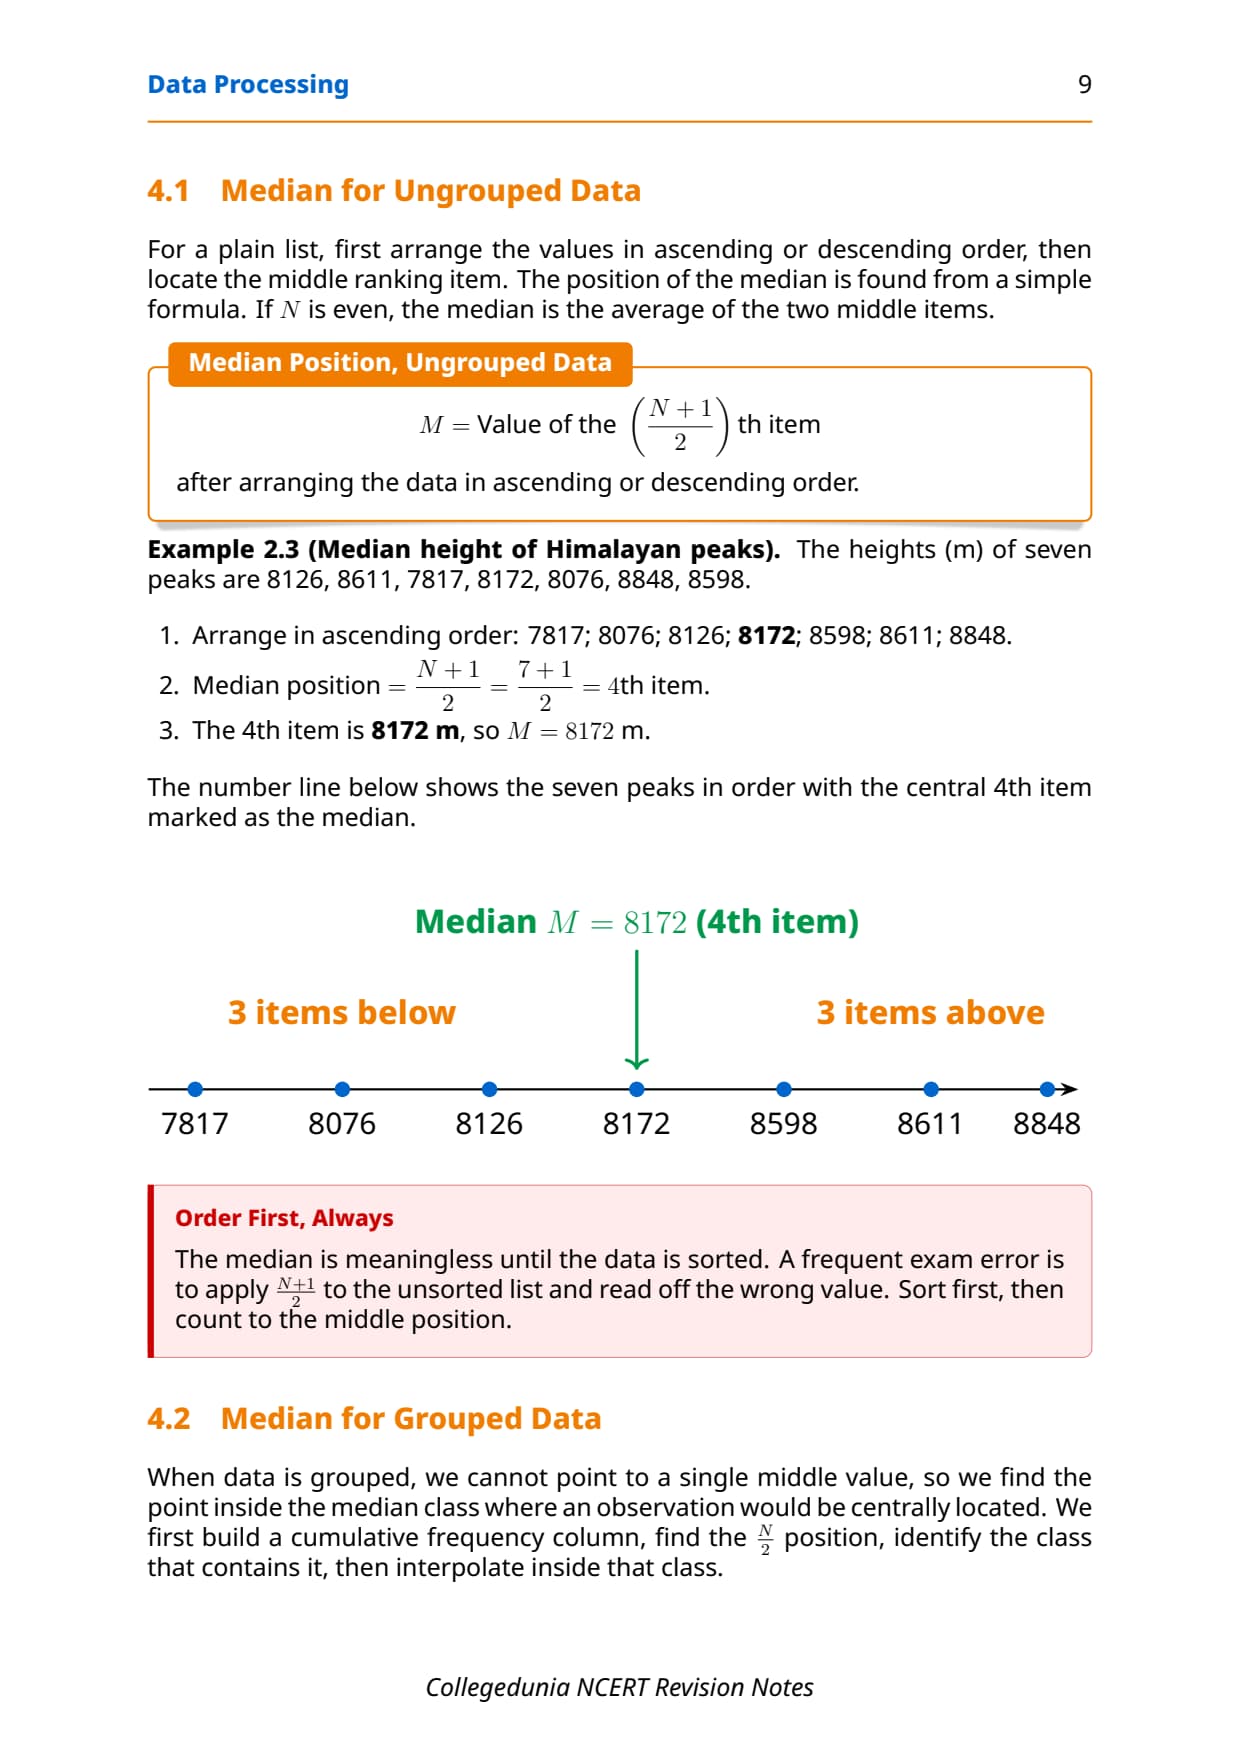
Formula: Median position = (N + 1) / 2 th item in the sorted series (average of the two middle values if N is even). Example 2.3: for 7 sorted Himalayan peak heights, position = (7+1)/2 = 4th item, giving Median = 8,172 m.
Median from Grouped Data
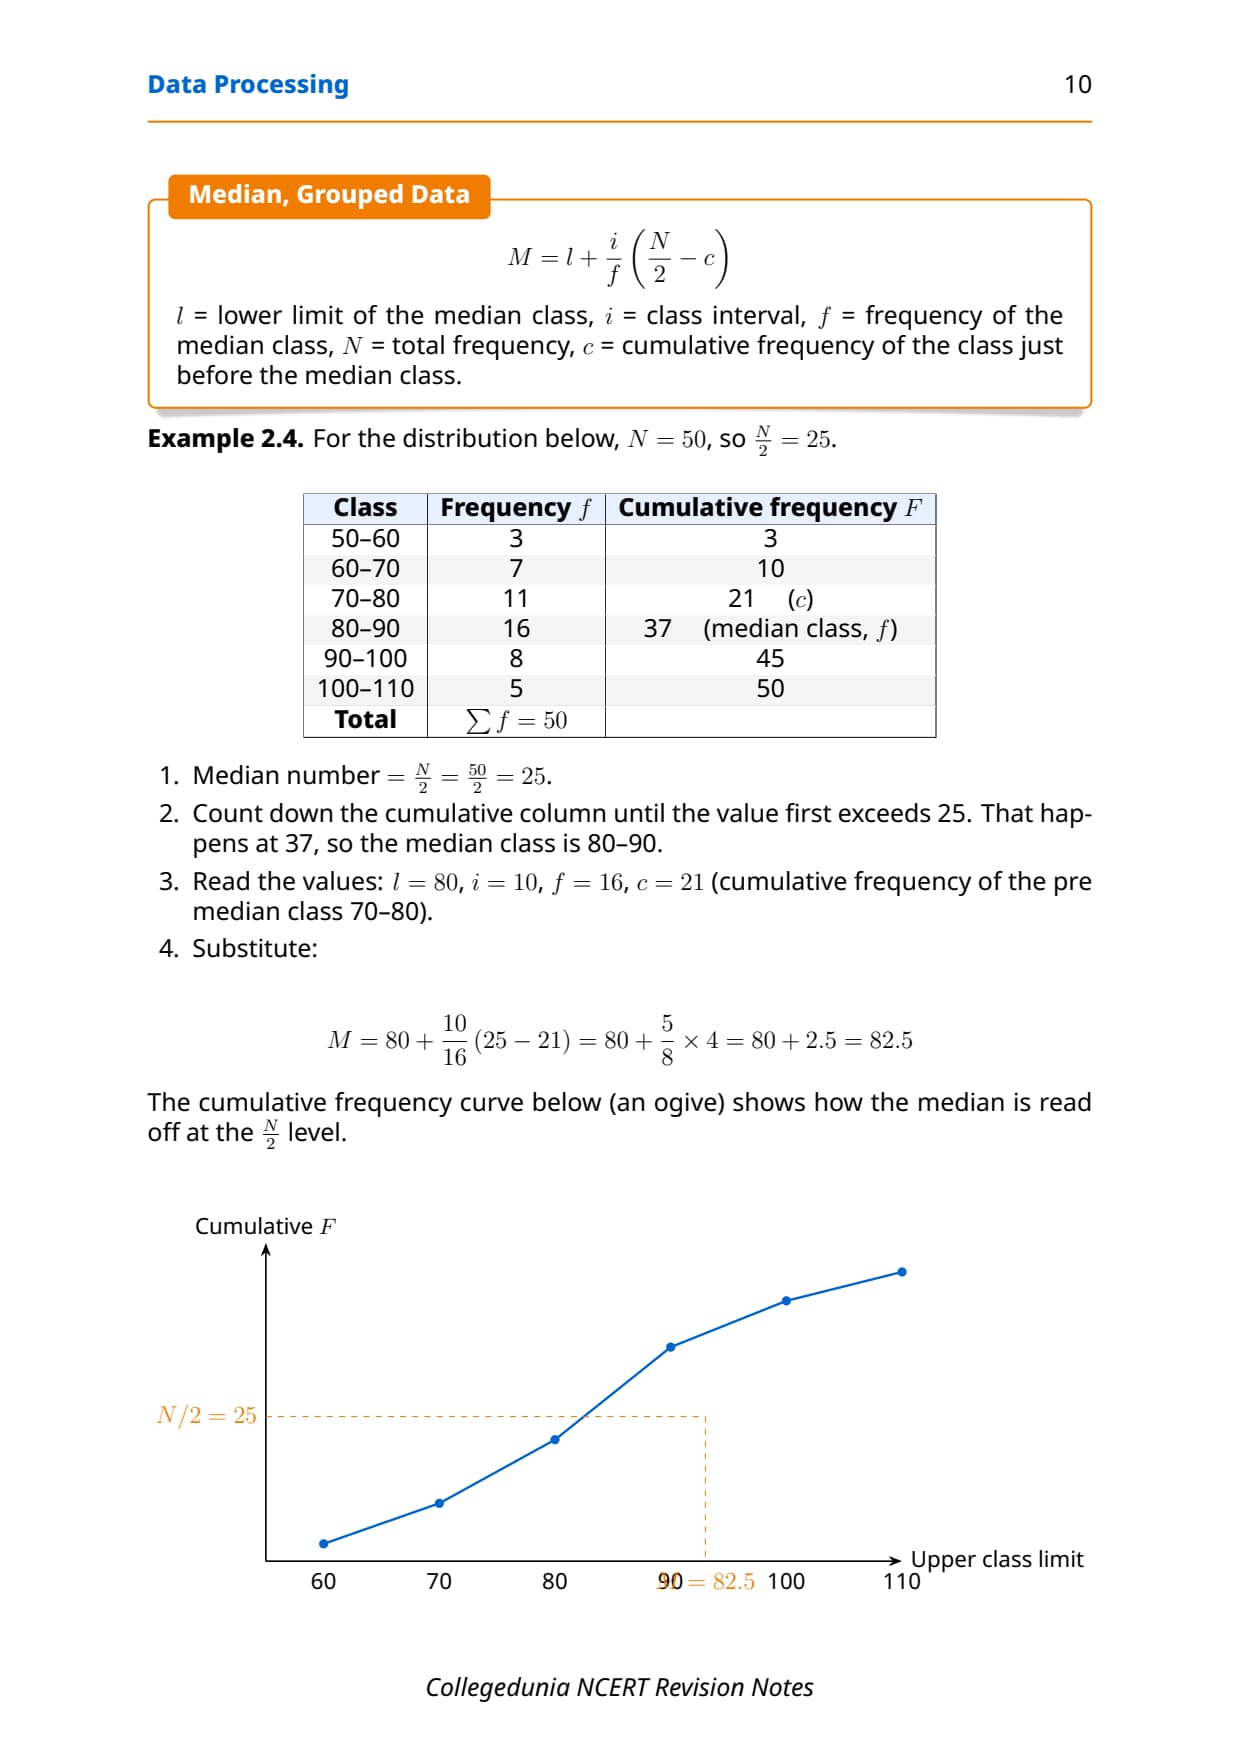
Build a cumulative frequency table; the median class is where cumulative frequency first exceeds N/2. Formula: Median (M) = l + (i / f) times (N/2 minus c), where l = lower limit, i = class width, f = frequency of the median class, c = cumulative frequency before it.
Example 2.4: with N = 50, the median class is 80-90, so M = 80 + (10/16) times (25 minus 21) = 82.5.
Mode: Ungrouped Data and Types of Mode
Mode is the value that appears most often in a dataset, symbolised as Z or M0. It ignores extreme values entirely and is most useful for categorical data.
Mode from Ungrouped Data
Sort the data and identify the most frequent value by inspection; no formula is needed.
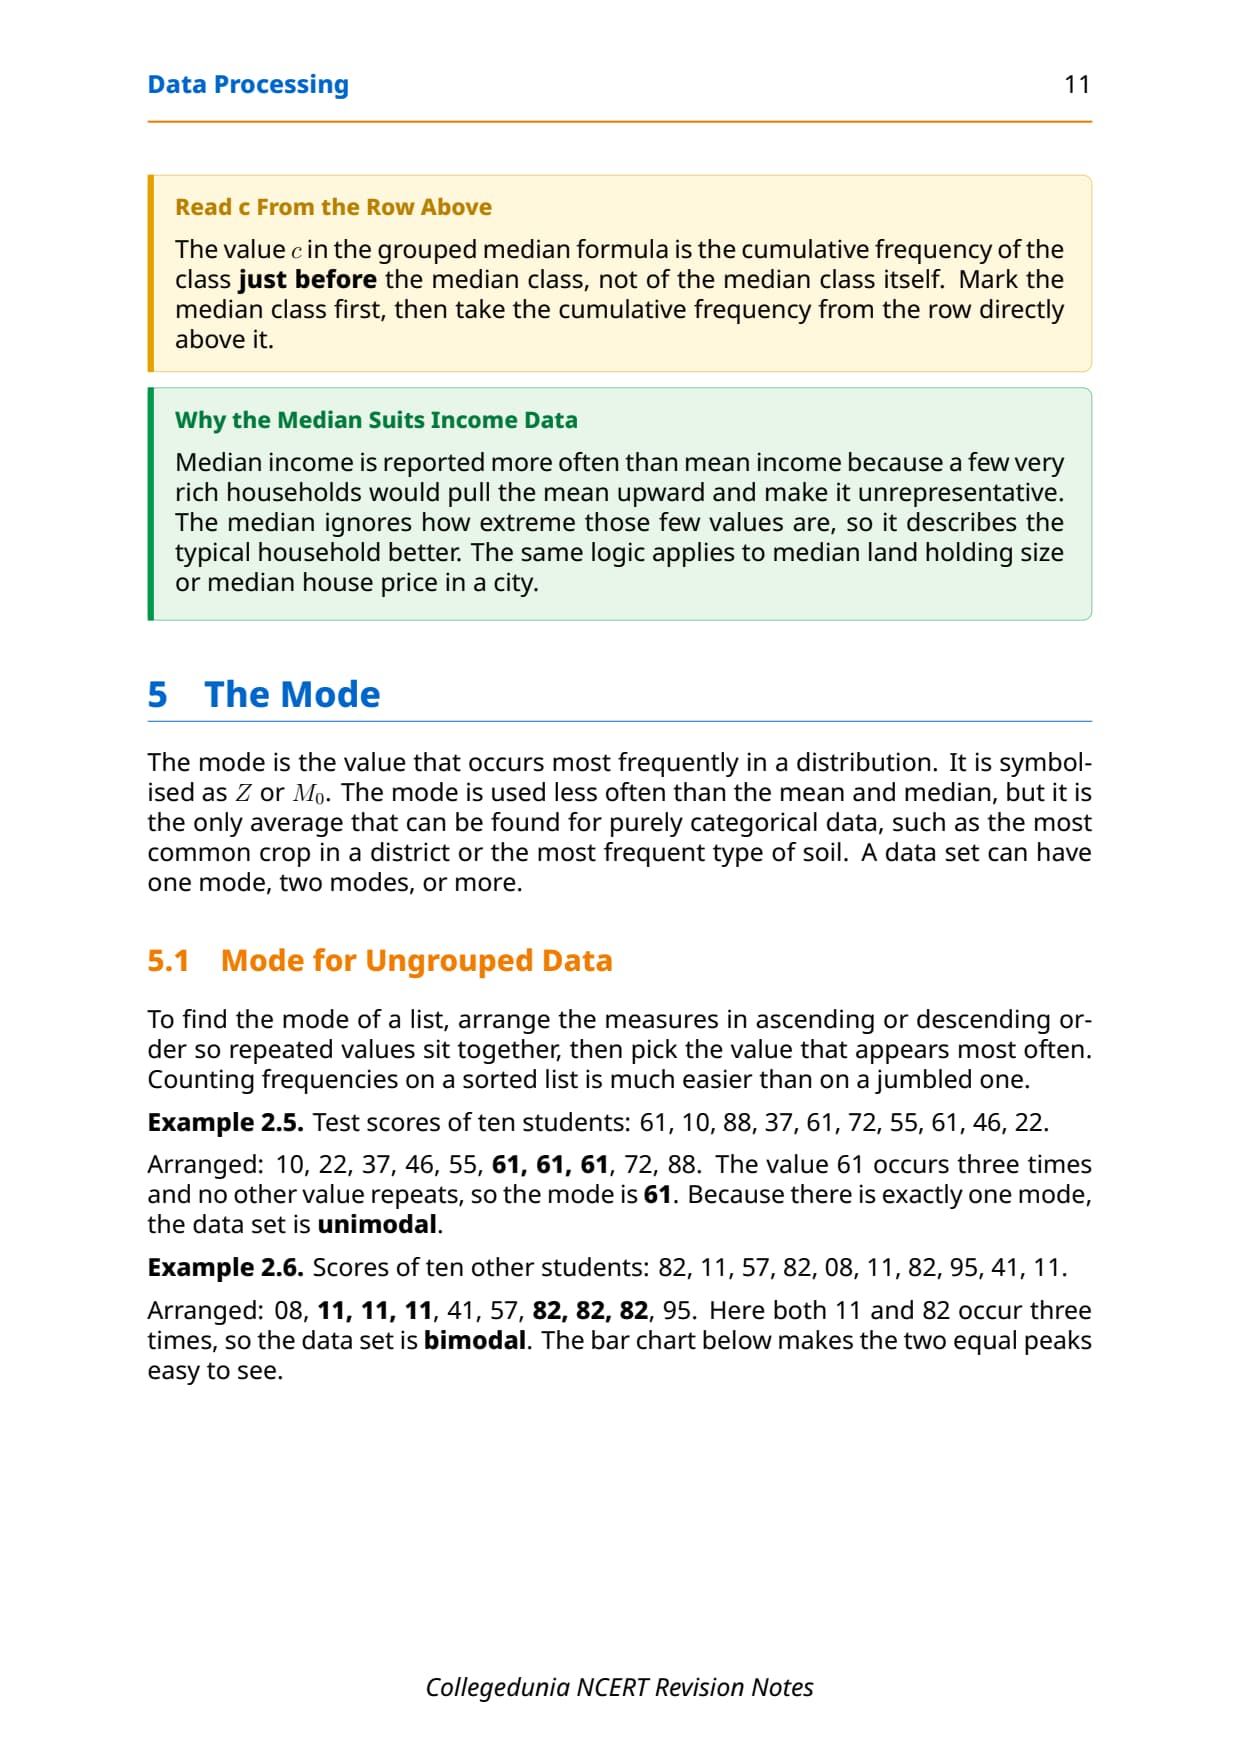
NCERT worked examples: Example 2.5 has 61 repeating three times, so Mode = 61 (unimodal). Example 2.6 has both 11 and 82 repeating three times, giving a bimodal dataset.
Types of mode
- Unimodal: exactly one value occurs most often.
- Bimodal: two values tied for highest frequency.
- Trimodal / Multimodal: three or more equally frequent values.
- No mode: no value repeats; every observation is unique.
Comparison of Mean, Median and Mode
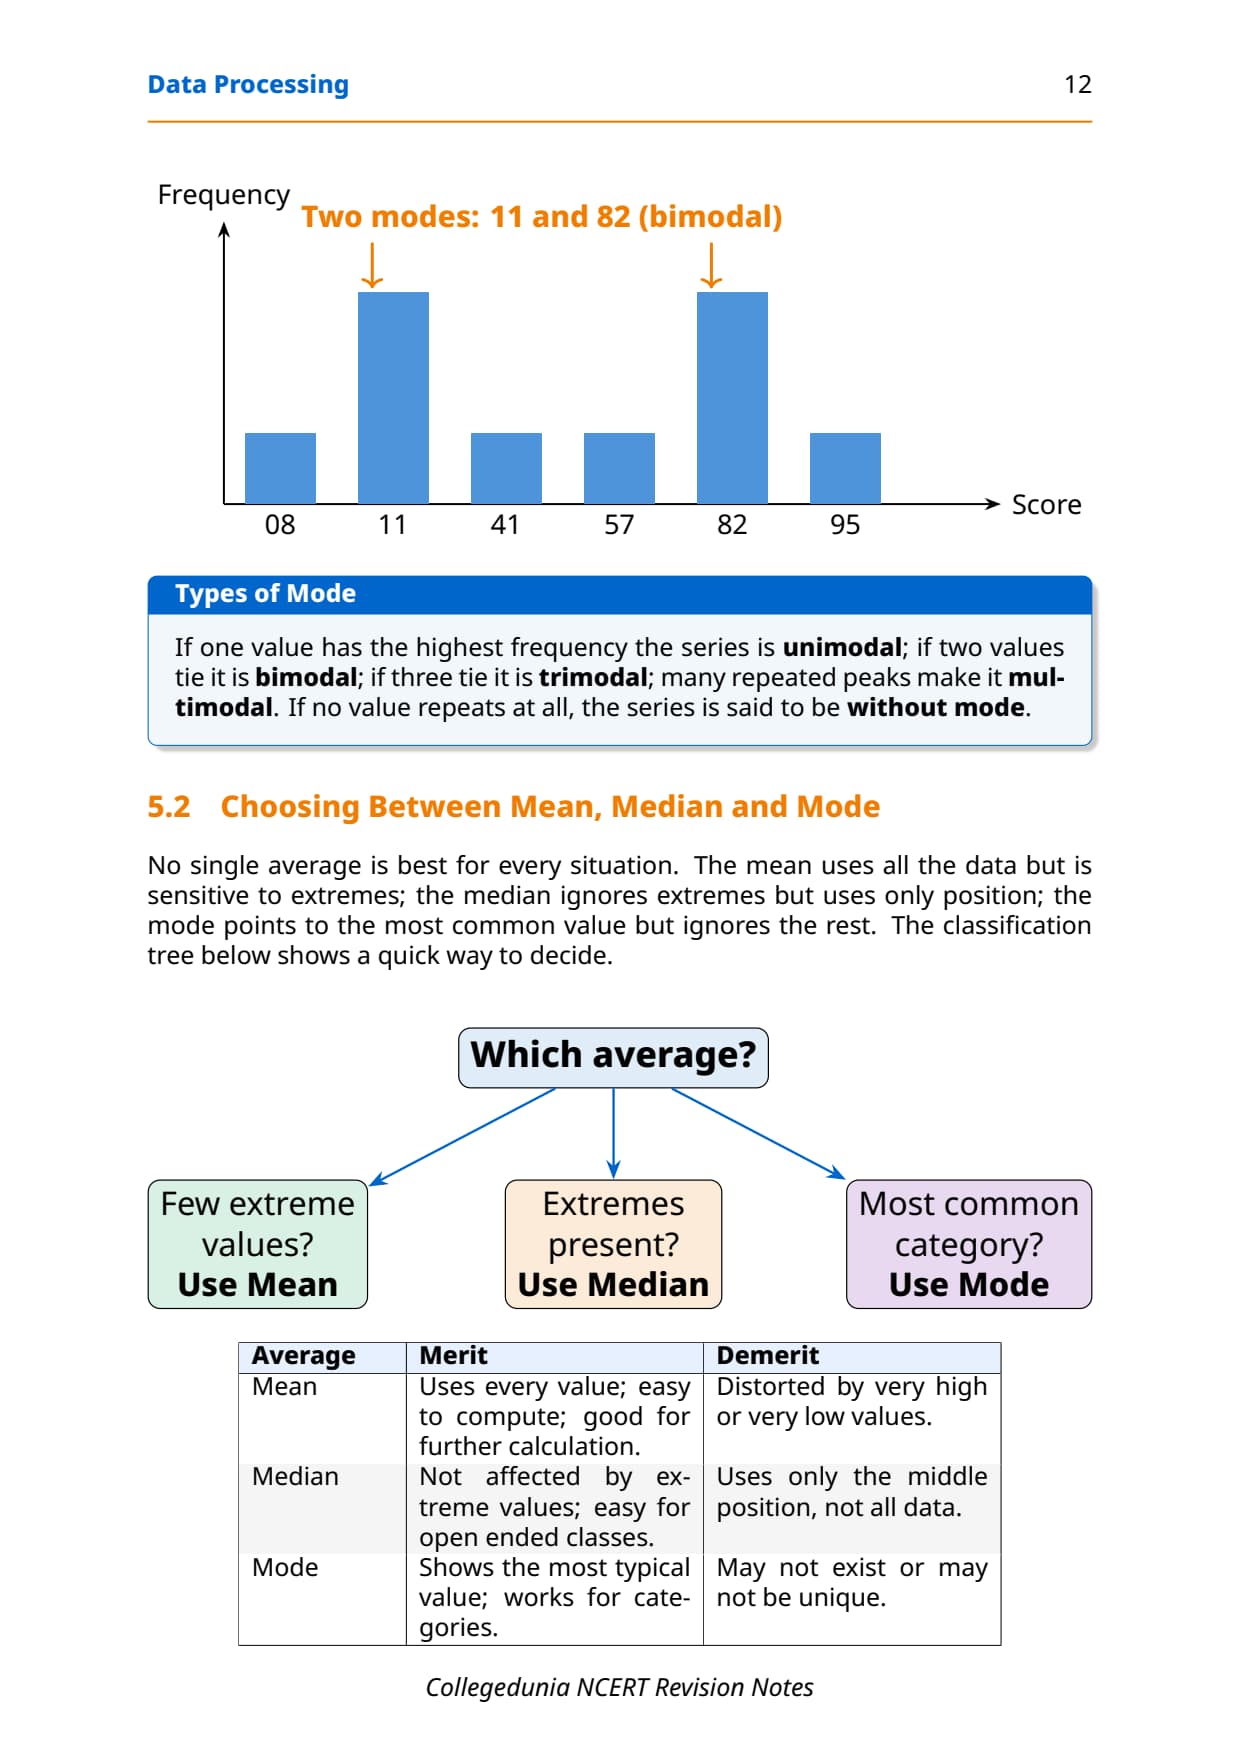
All three measures represent the centre of a distribution, but behave very differently when data are asymmetrical, which is exactly what CBSE tests in its 3-mark theory questions.
| Feature | Mean | Median | Mode |
|---|---|---|---|
| Based on | All values in the dataset | Rank/position only | Frequency of occurrence |
| Affected by extreme values? | Yes (pulled toward outliers) | No (rank-based, ignores magnitude) | No (depends only on frequency) |
| Best used when | Data are roughly symmetrical with no major outliers | Data contain extreme values or open-ended classes | The most common value matters (e.g. shoe sizes, most common rainfall band) |
| Unique value? | Always | Always | Not always (bimodal / multimodal possible) |
| In normal distribution | Mean = Median = Mode | Mean = Median = Mode | Mean = Median = Mode |
| In positive skew | Highest | Middle | Lowest |
| In negative skew | Lowest | Middle | Highest |
Key takeaway for board papers: Median is the only measure that is not affected by extreme values, which is why CBSE regularly asks students to identify the correct measure when rainfall data for a district includes one anomalously high or low year.
Normal Distribution and Skewness
Normal distribution curve
A normal distribution is a symmetrical, bell-shaped curve where most observations cluster near the middle. Its key property: mean = median = mode, all coinciding at the peak.
Positive and negative skew
A long right tail is positive skew: the mean is pulled up, so Mode < Median < Mean (common in income data). A long left tail is negative skew: Mean < Median < Mode (common when an easy test gives most students high scores).
Memory hook: the mean always chases the tail. Median sits in between; mode stays at the hump.
Common Mistakes Students Make in Data Processing
Five repeat-offender mistakes CBSE examiners report each year:
- Forgetting to sort data before finding median or mode.
- Using individual values instead of class midpoints in grouped-data mean.
- Picking the wrong median class: it is where cumulative frequency first exceeds N/2, not the highest-frequency class.
- Choosing an assumed mean far from the centre, which increases arithmetic errors.
- Calling a bimodal dataset "no mode": a dataset has no mode only when every value is unique.
Previous Year Question Trends from Data Processing Class 12
| Year | Question type asked | Marks | Notes section to revise |
|---|---|---|---|
| 2025 | Calculate median for grouped data + define measures of central tendency | 4 + 2 | Median section + Key Definitions |
| 2024 | Mean by indirect method from ungrouped data + compare mean and median | 4 + 3 | Mean section + Comparison table |
| 2023 | Identify mode from ungrouped dataset + explain skewness with diagram | 2 + 3 | Mode section + Normal Distribution section |
| 2022 | Compute mean for grouped data by direct method + state merits of median | 4 + 2 | Mean section + Comparison table |
| 2021 | Distinguish normal distribution from skewed distribution + calculate median | 3 + 4 | Normal Distribution section + Median section |
The chapter carries an effective weight of 6 to 8 marks per year across theory and practical numericals combined.
Other Resources for Class 12 Geography Chapter 2 Data Processing
| Resource | What it covers | Open |
|---|---|---|
| Notes | Concept-first revision notes covering definitions, mean/median/mode formulas, normal distribution and common mistakes. | You are here |
| NCERT Solutions | Step-by-step answers to all exercise questions with Expert's Solution alternatives for every numerical. | Class 12 Geography Chapter 2 NCERT Solutions |
| Handwritten Notes | Topper's handwritten revision pages for last-minute board exam practice. | Class 12 Geography Chapter 2 Handwritten Notes |
| NCERT Book PDF | Official NCERT Practical Work in Geography Chapter 2 textbook in PDF form. | Class 12 Geography Chapter 2 NCERT Book PDF |
| Subject Hub | All chapters of Class 12 Geography with every resource in one place. | Class 12 Geography Subject Hub |
All Chapters Notes for Practical Work in Geography Class 12
Related Links: Use the table below to navigate to the Notes for the other chapters of Class 12 Practical Work in Geography (Part II).
| Chapter | Topic | Notes link |
|---|---|---|
| Chapter 1 | Data: Its Source and Compilation | Class 12 Geography Data Source and Compilation Notes |
| Chapter 2 | Data Processing | You are here |
| Chapter 3 | Graphical Representation of Data | Class 12 Geography Graphical Representation Notes |
| Chapter 4 | Spatial Information Technology | Class 12 Geography Spatial Information Technology Notes |
NCERT Notes Class 12 Geography Chapter 2 Data Processing FAQs
Ques. What are the data processing class 12 geography notes meant to be used for?
Ans. The data processing class 12 geography notes are a concept-first revision file: they compress the entire NCERT Chapter 2 of Practical Work in Geography (Part II) into a printable study guide, with definitions, formulas for mean, median and mode, and common mistake callouts laid out for a single sitting. Students typically use these notes for a 30-minute first-pass revision and a 20-minute night-before pass; the worked numericals live in the matching NCERT Solutions PDF, not in this Notes file.
Ques. What are the three measures of central tendency in Class 12 Geography?
Ans. The three measures of central tendency covered in Class 12 Geography Chapter 2 are mean, median and mode. Mean is the arithmetic average of all values. Median is the middle value when all observations are arranged in order. Mode is the value that appears most frequently. Each measure is suited to a different type of data: mean works best for symmetrical data without extreme values, median is best when outliers are present, and mode is best when the most commonly occurring value matters most.
Ques. What is the difference between the direct and indirect method of calculating mean?
Ans. In the direct method, you add all raw values (or multiply class midpoints by frequencies for grouped data) and divide by the total number of observations. In the indirect method, you subtract an assumed mean (A) from each value to get deviations (d), sum the deviations, divide by N, and add the result back to A. The indirect method reduces arithmetic by working with smaller numbers. Both methods give the same final mean value, as confirmed by NCERT Example 2.1 (mean = 926.29 mm in both cases).
Ques. How do you find the median for grouped data in Class 12 Geography?
Ans. Build a cumulative frequency table. Find N/2 (half the total observations). Identify the median class: the class interval where cumulative frequency first exceeds N/2. Apply the formula: Median = l + (i/f) times (N/2 minus c), where l is the lower limit of the median class, i is the class interval width, f is the frequency of the median class, N is the total number of observations and c is the cumulative frequency of the class before the median class. NCERT Example 2.4 uses this formula to get Median = 82.5 from a distribution with N = 50.
Ques. What is the normal distribution curve and why does it matter for CBSE Geography?
Ans. A normal distribution is a symmetrical, bell-shaped frequency curve where most observations cluster near the centre and very high or very low values are equally rare on both sides. Its key property is that mean, median and mode all coincide at the peak of the curve (the score with the highest frequency). For CBSE Geography, the normal distribution matters because NCERT Chapter 2 uses it as the baseline for explaining skewness: when data are skewed, the three measures pull apart, and students are tested on the direction and order of divergence.
Ques. What is positive skew and negative skew in data processing class 12?
Ans. In a positively skewed distribution, the tail of the curve stretches toward the right (higher values) and the order is Mode less than Median less than Mean. The mean is pulled up by the extreme high values. In a negatively skewed distribution, the tail stretches toward the left (lower values) and the order is Mean less than Median less than Mode. A useful memory hook: the mean always chases the tail. In a normal distribution, all three coincide at the centre.
Ques. When should students use mode instead of mean or median in geography practicals?
Ans. Mode is the best measure when you need to identify the most frequently occurring value rather than an average. In geographical analysis, this matters when studying the most common wind direction, the most frequently occurring rainfall band in a region, or the most common soil type across districts. Mode is also the only measure that can be used for categorical (non-numerical) data. Its main limitation is that a dataset can have more than one mode (bimodal, multimodal) or no mode at all, which makes it less stable than mean or median for continuous data.
Ques. Is the data processing chapter in CBSE Class 12 Geography practical important for CUET?
Ans. Yes. CUET Geography includes questions from the Class 12 NCERT syllabus, and the statistics section of Practical Work in Geography is tested under the skills and applications component of the paper. Measures of central tendency, skewness and the properties of normal distribution are all recurring question types. Students preparing for CUET Geography should focus on the comparison table of mean, median and mode (which measure is affected by extreme values, which coincides with the hump of a distribution) and the two skewness diagrams in the NCERT textbook.
Ques. How long does it take to revise these data processing class 12 geography notes?
Ans. The full notes file is designed for a 25 to 30 minute first-pass revision and a 15 to 20 minute night-before pass. Students who already have the chapter under their belt finish the file in about 20 minutes; first-time revisers take closer to 35 minutes. The formula blocks for mean, median and the Common Mistakes box alone take about 8 minutes to revise and cover the bulk of the marks the chapter carries in the CBSE board paper.
Ques. Which measure of central tendency is not affected by extreme values?
Ans. Median is the measure of central tendency that is not affected by extreme values. This is because median depends only on the rank or position of observations, not their actual magnitude. A single very high or very low value changes the sum (and therefore the mean) but does not change which value sits in the middle of a sorted series. Mode is also unaffected by extreme values because it depends only on frequency, not magnitude. The NCERT Chapter 2 exercise asks this as a direct one-mark question: the correct answer is Median (option d in the textbook).
Ques. Is the Class 12 Geography syllabus for this chapter changing in 2026-27?
Ans. No major reductions in 2026-27. The Practical Work in Geography Part II textbook chapter structure is unchanged for the current cycle. Chapter 2 Data Processing continues to cover all three measures of central tendency for both ungrouped and grouped data, the normal distribution curve and skewness diagrams. These data processing class 12 geography notes for 2026-27 are fully aligned to the unchanged textbook and the latest CBSE sample paper released for the 2026 boards.



Comments