




These Class 12 Geography Chapter 4 Spatial Information Technology notes cover every NCERT definition, the GIS components, raster and vector data formats, the sequence of GIS activities and the main spatial analysis operations, aligned to the 2026-27 syllabus for a quick night-before revision.
- Concept-first revision: what spatial information technology is, how GIS works, and why it beats manual mapping.
- Key terms: GIS, raster format, vector format, overlay analysis, buffer analysis and data linkages.
- Cross-pointers to the matching Solutions, Handwritten Notes and NCERT Book PDF.
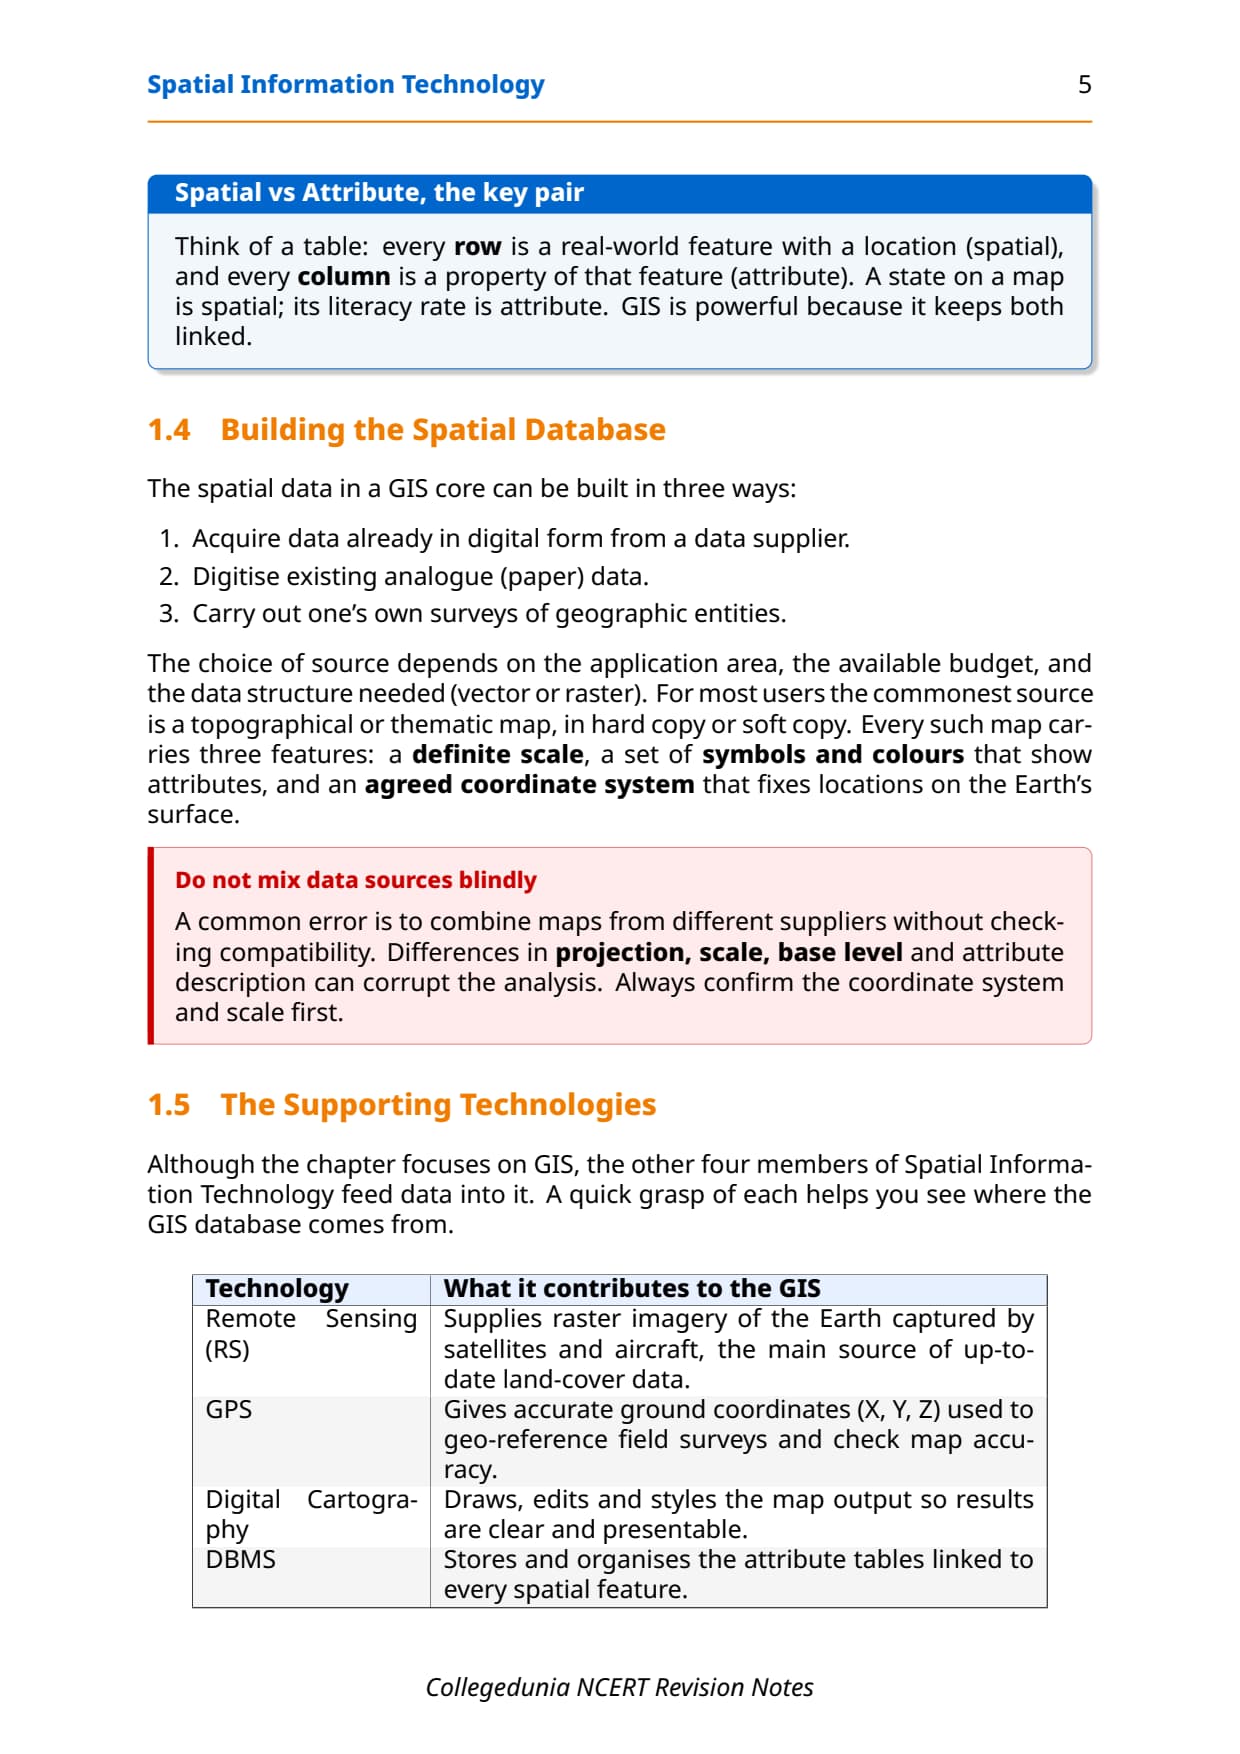
Every line in these spatial information technology class 12 Geography notes is written by Collegedunia geography experts, mapped to the 2026-27 NCERT Practical Work in Geography Part II textbook, and checked against recent CBSE Class 12 board papers and CUET Geography patterns.
Student Feedback
74% of students found telling raster from vector formats apart the most-confused part, and 3 out of 4 rated the GIS components and overlay analysis section as most worth revising.
Source: 2026-27 Class 12 Geography student poll, 8,600 students.
Quick Concept Recap: Spatial Information Technology at a Glance
Spatial Information Technology is a set of computer tools that capture, store, analyse and display location-based data. Most real-world data has a spatial part (an address, a boundary, a coordinate), and a system that processes those parts together with their attributes is far more powerful than a paper map.
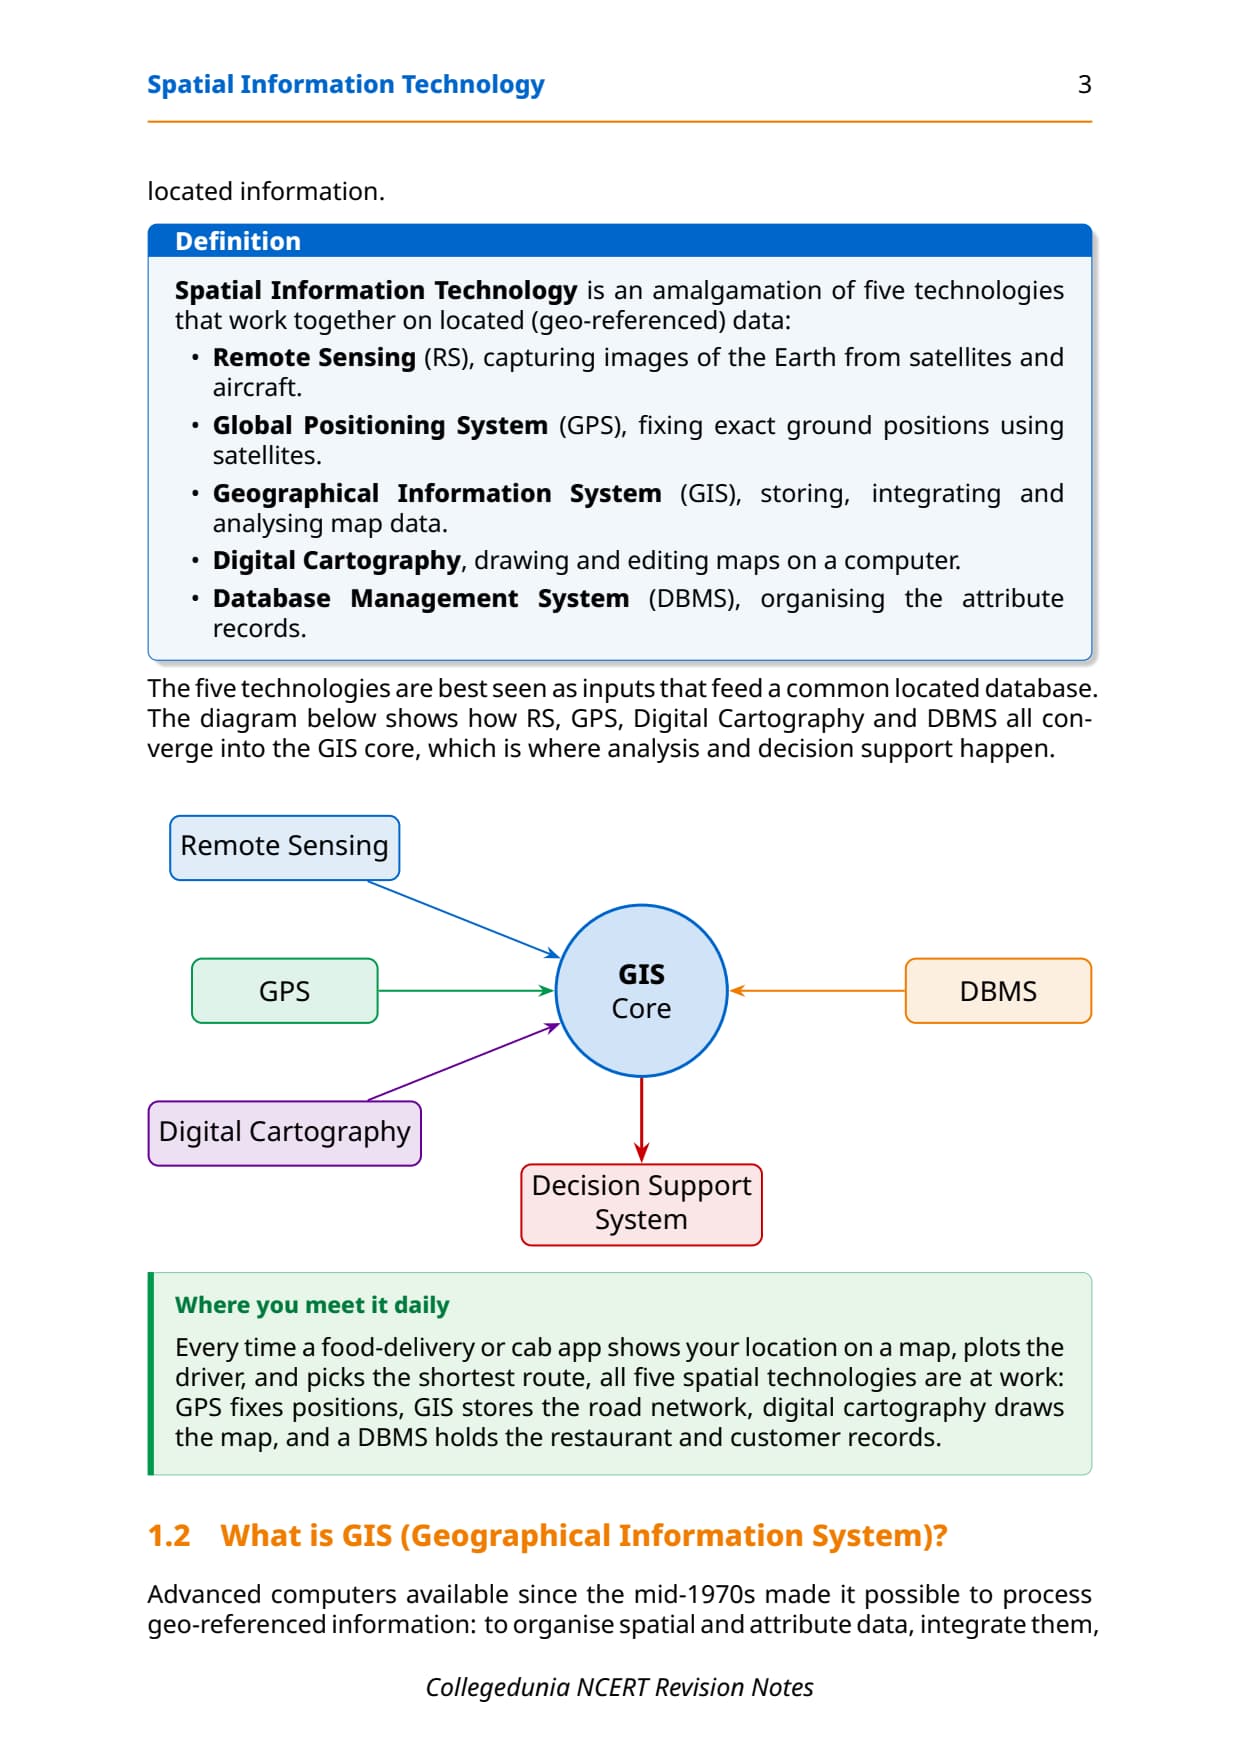
- Spatial Information Technology is an amalgamation of Remote Sensing, GPS, GIS, Digital Cartography and DBMS, all working on georeferenced data.
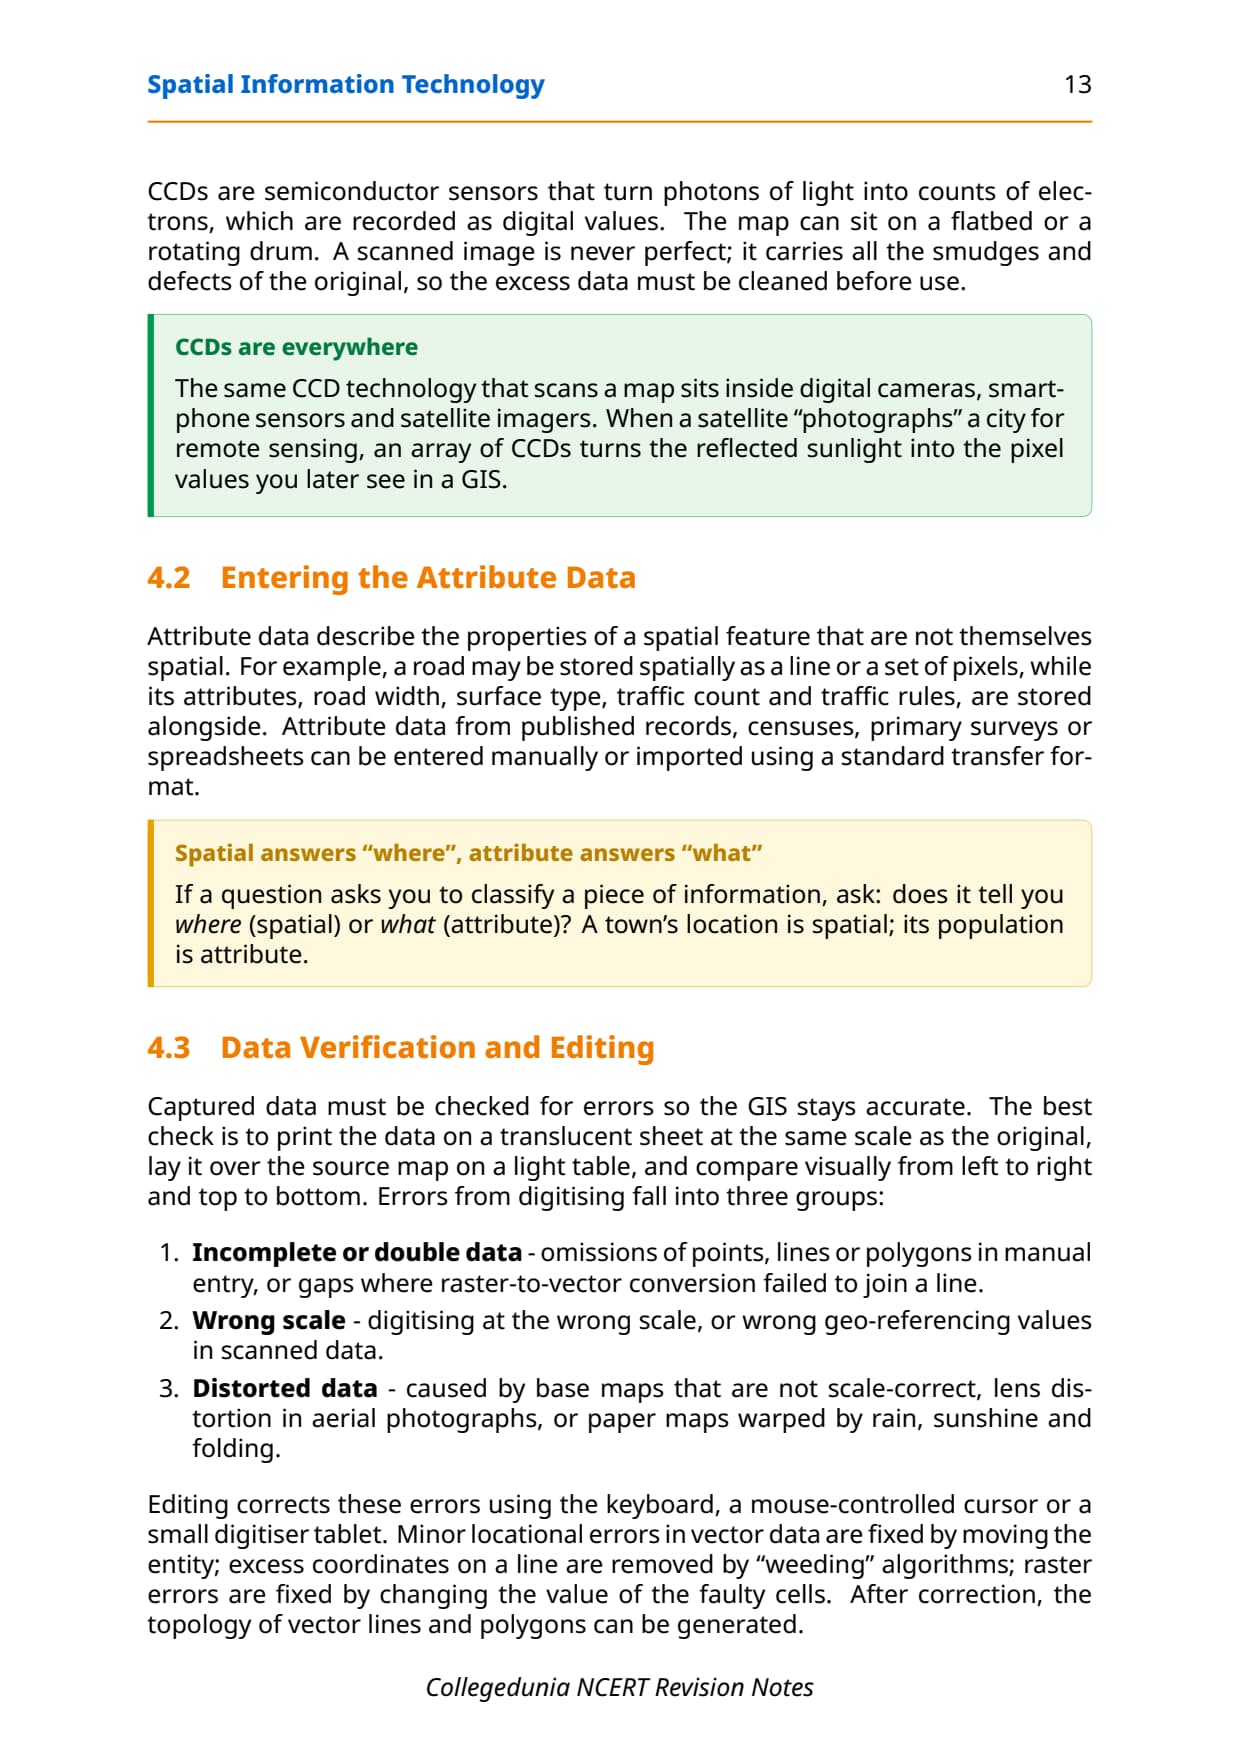
- GIS (Geographic Information System) captures, stores, integrates, analyses and displays data referenced to the Earth: a decision support system, not just a mapping tool.
- Two data formats: raster is a grid of cells; vector uses coordinate-defined points, lines and polygons.
Read these notes first, then use the NCERT Solutions for Chapter 4 for exercise practice.
Source: Magnet Brains on YouTube
Key Definitions for Spatial Information Technology Class 12
Every short-answer question starts with a definition. The ones below are in the form CBSE markers expect.
| Term | One-line definition | NCERT section pointer |
|---|---|---|
| Spatial Information Technology | The use of technological inputs in collecting, storing, retrieving, displaying, manipulating, managing and analysing spatial information; an amalgamation of Remote Sensing, GPS, GIS, Digital Cartography and DBMS. | Opening section |
| GIS (Geographic Information System) | A system for capturing, storing, checking, integrating, manipulating, analysing and displaying data that are spatially referenced to the Earth, supported by a georeferenced computer database and appropriate application software. | What is GIS? |
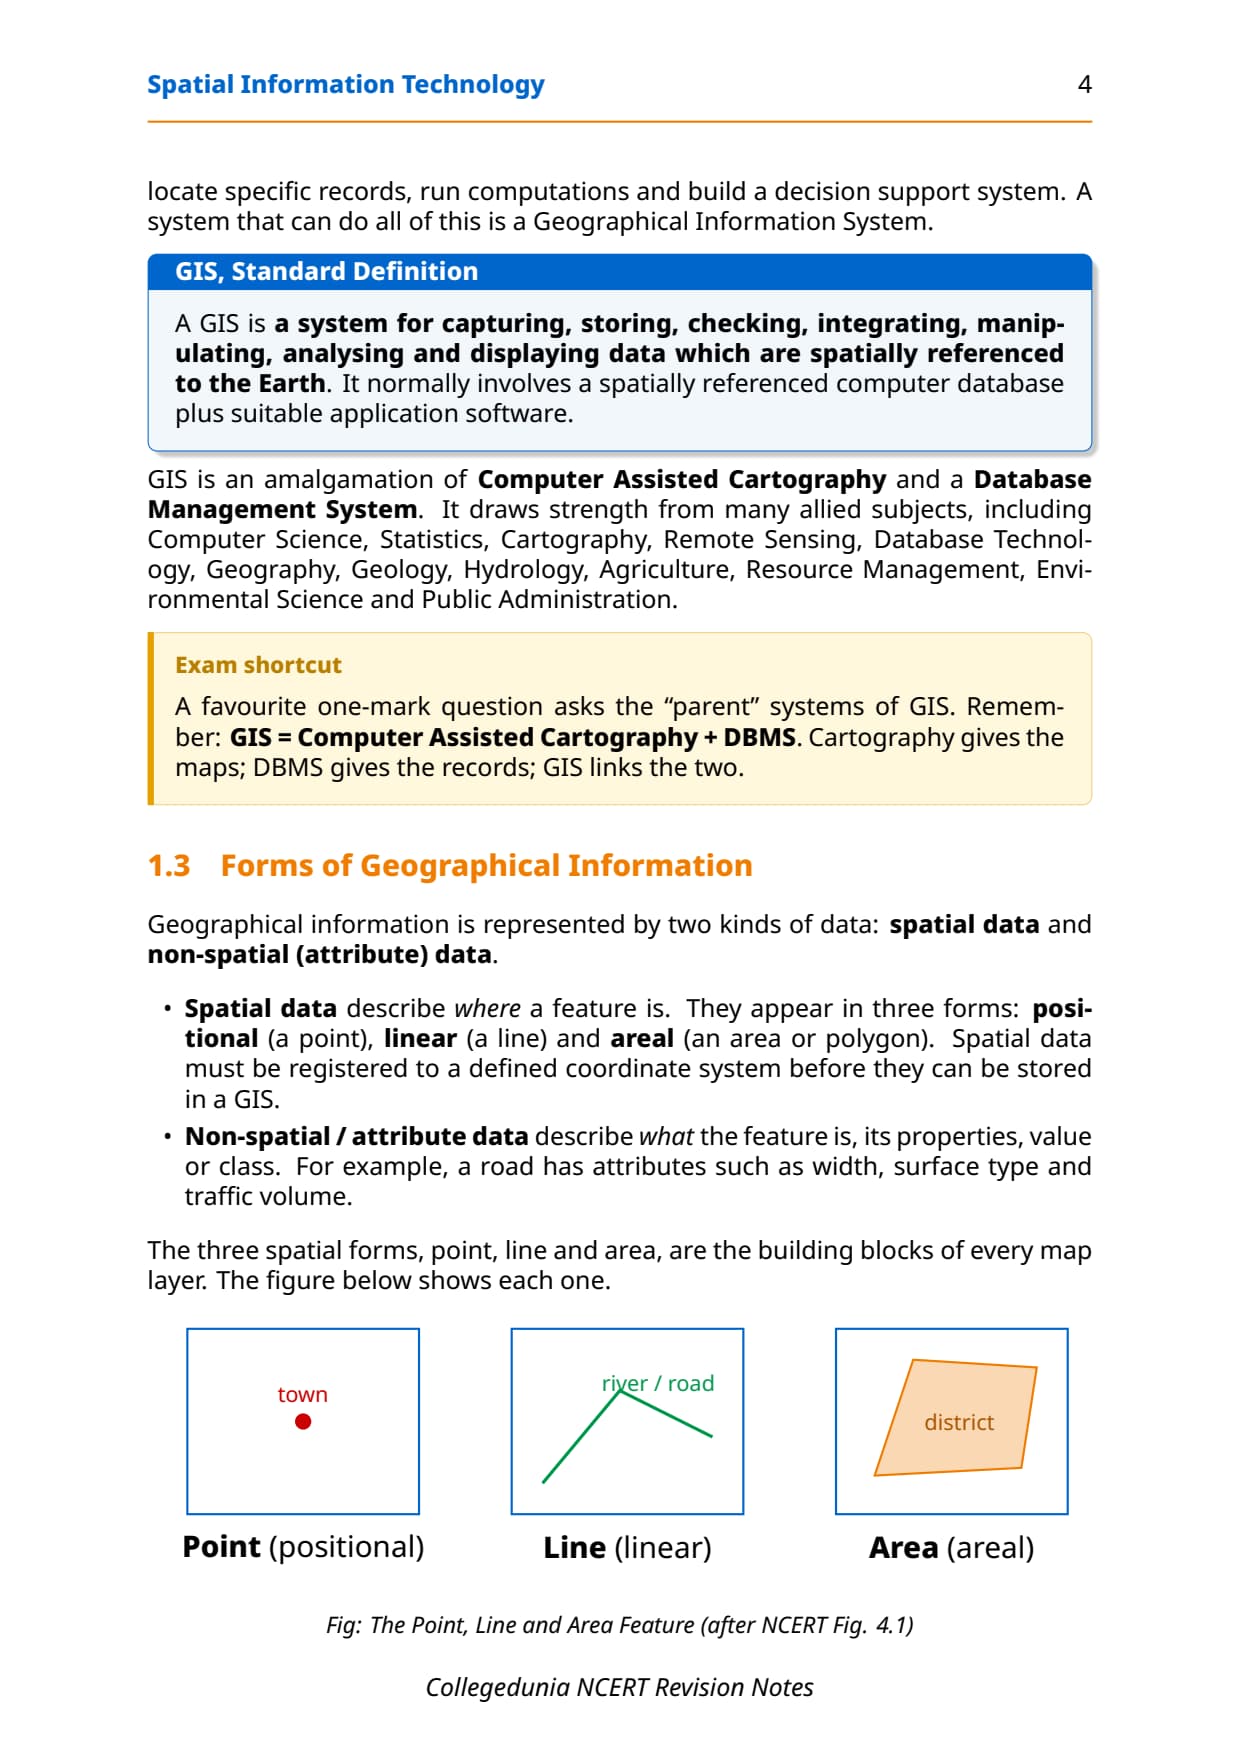
| Spatial Data | Data characterised by their positional, linear and areal forms of appearance, geometrically registered to a defined coordinate system. | Forms of Geographical Information |
| Non-spatial (Attribute) Data | Data that describe the properties of a spatial entity but are not spatial themselves; for example, the width, surface type and traffic count of a road. | Forms of Geographical Information |
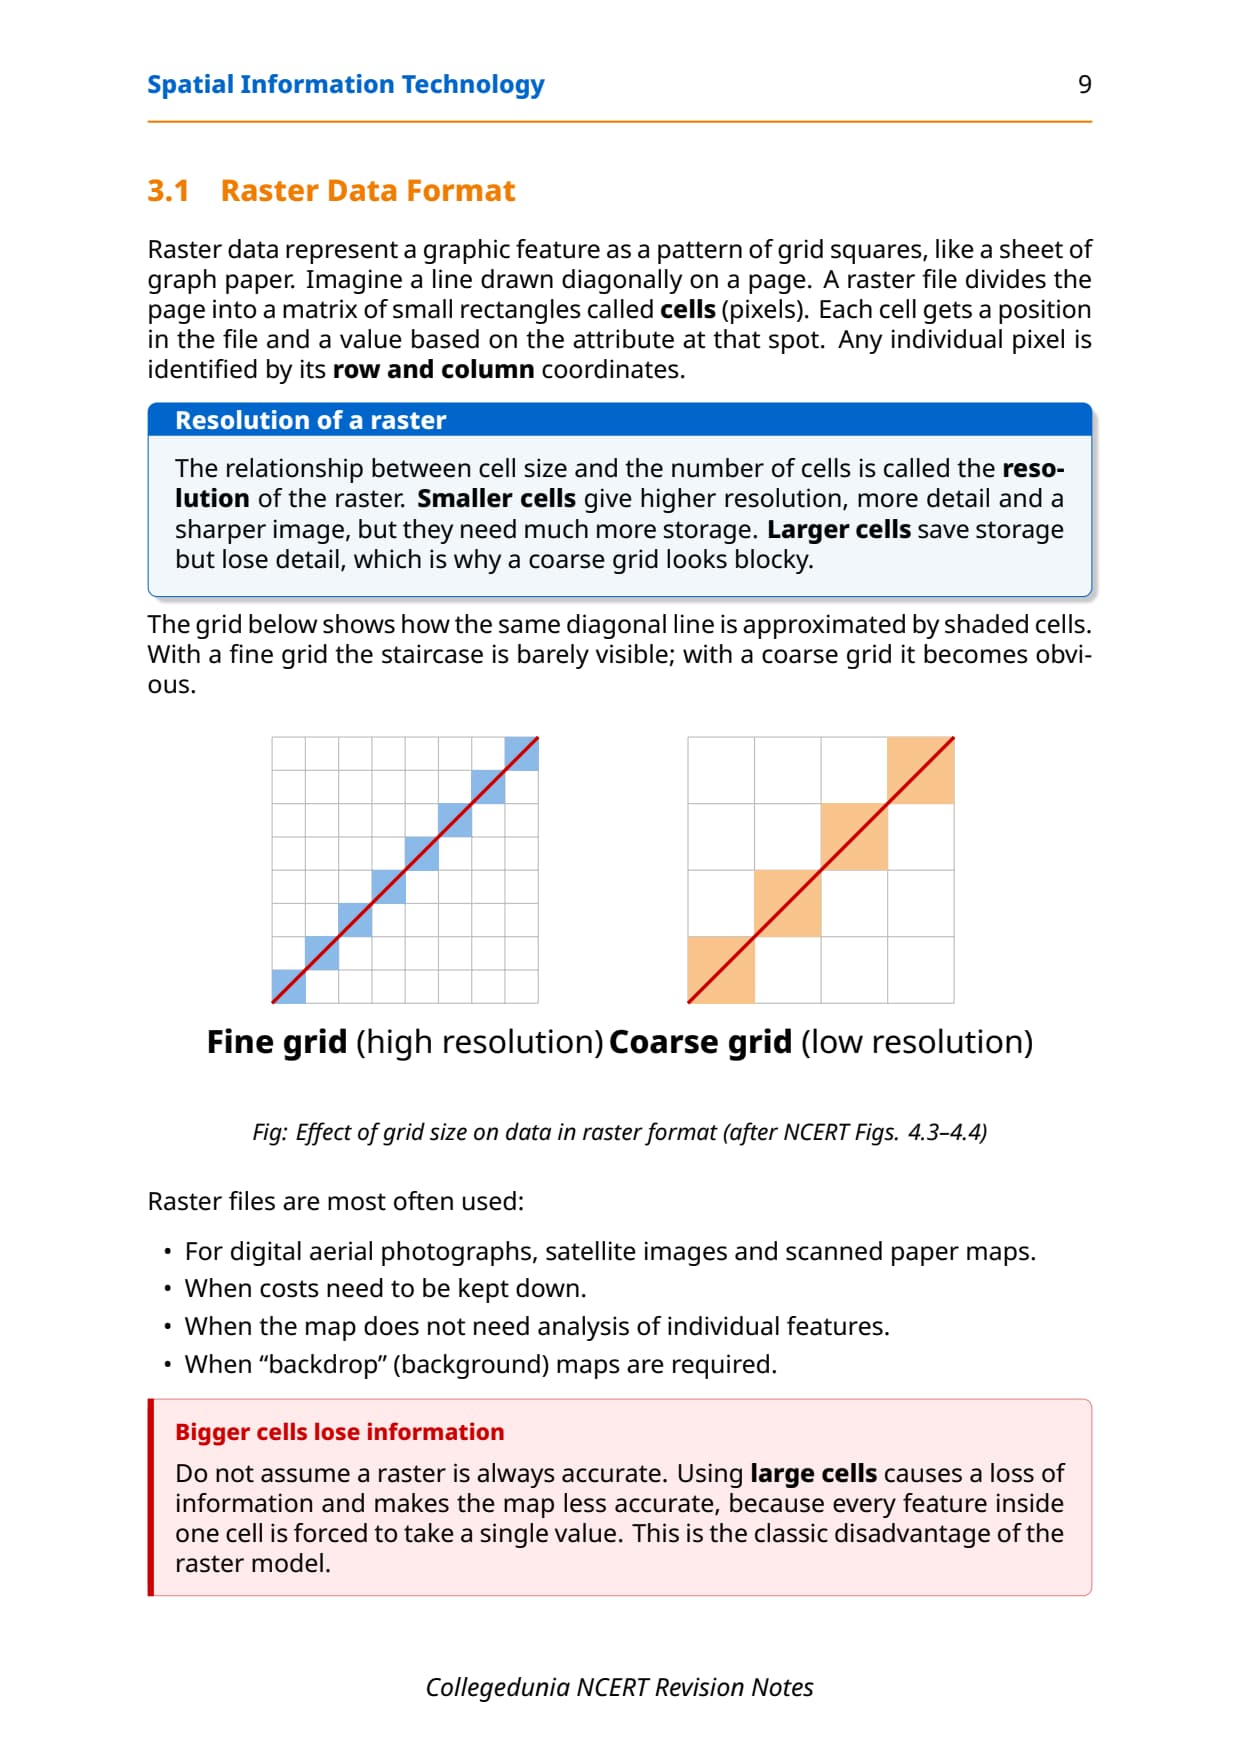
| Raster Data Format | A data format that represents a graphic feature as a pattern of grid squares (cells), where each cell is assigned a position and a value based on the attribute at that location. | Spatial Data Formats |
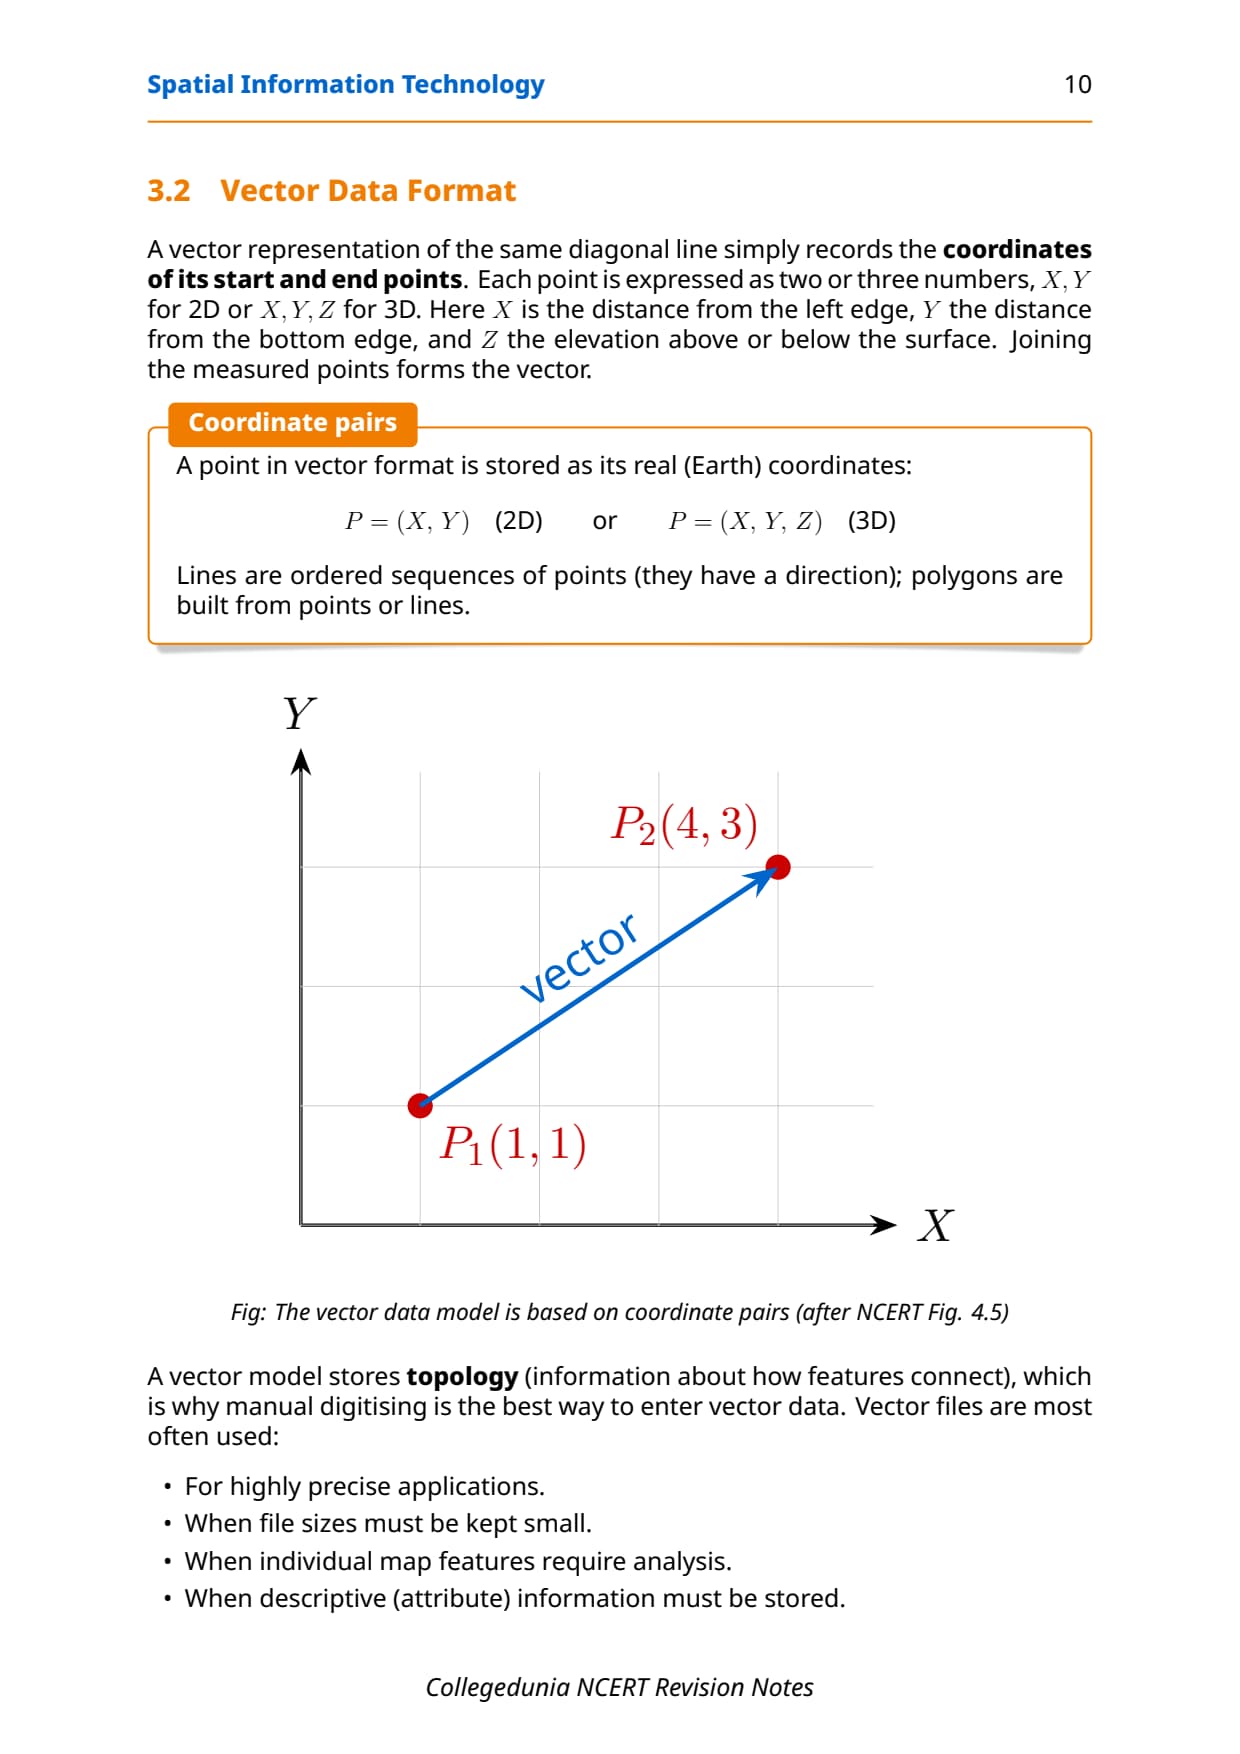
| Vector Data Format | A data format that represents geographic objects using coordinate pairs (X, Y or X, Y, Z) to define points, lines and polygons, storing information about topology. | Spatial Data Formats |
| Resolution (Raster) | The relationship between cell size and the number of cells in a raster image; smaller cell size means higher resolution and greater spatial detail. | Spatial Data Formats |
| Overlay Analysis | A GIS operation that integrates two or more thematic map layers of the same area to obtain a new map layer showing combined spatial information. | Spatial Analysis |
| Buffer Analysis | A GIS proximity analysis operation that creates a zone of specified distance around a point, line or area feature to study the population or area affected by that feature. | Spatial Analysis |
| Digitisation | The process of converting analogue map data into digital format by tracing map features with a digitiser tablet, creating points, lines and polygons in the GIS database. | Spatial Data Input |
These cover roughly 8 of the 10 short-answer and MCQ questions CBSE has asked since 2021. Learn them first.
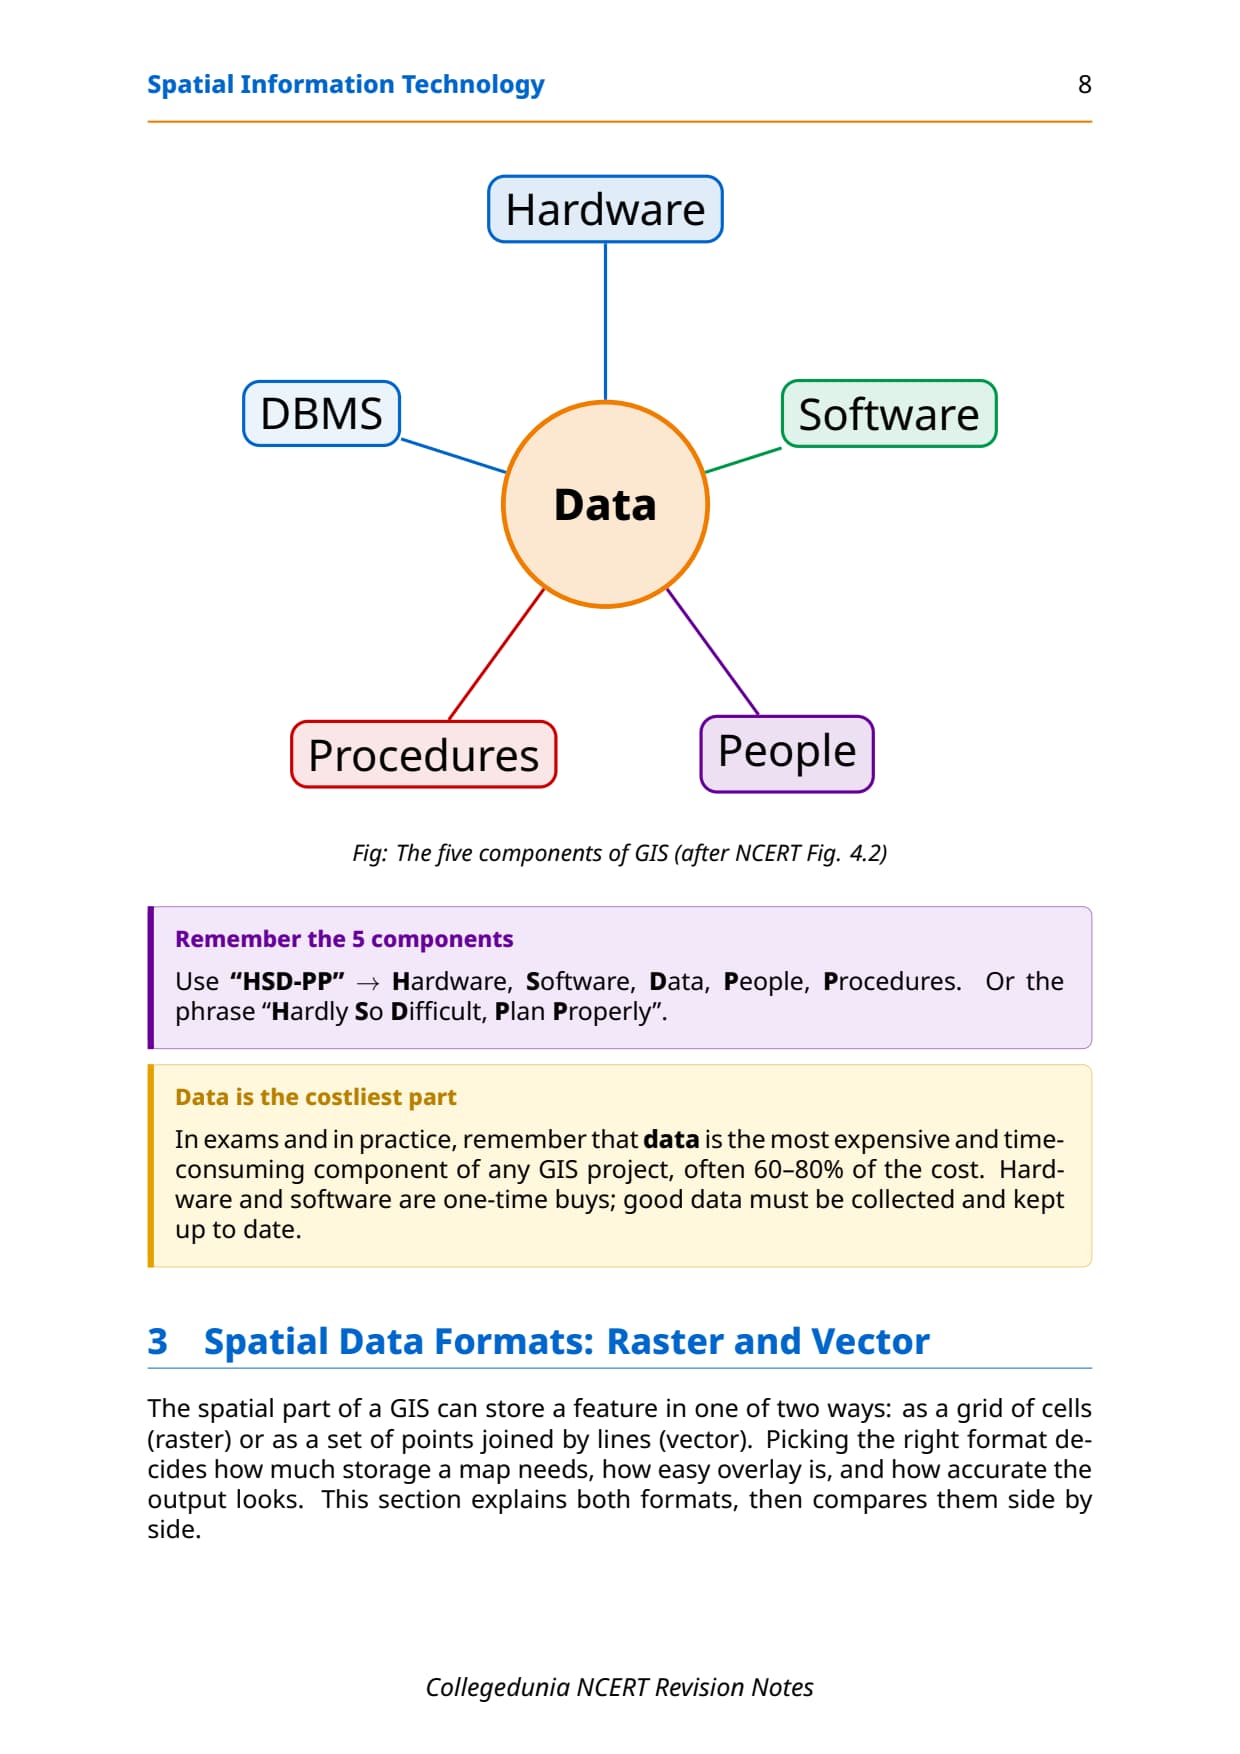
Components of GIS: Hardware, Software, Data, People, Procedures
NCERT lists five GIS components. Exam questions often ask students to name all five or describe one.
- Hardware: processing, storage, display and input/output devices like digitiser tablets, scanners and GPS receivers.
- Software: three module types: data entry and editing, analysis and manipulation (overlay, buffer, network), and display and output.
- Data: spatial data (digital maps) plus non-spatial attribute tables, queried through a Database Management System (DBMS).
- People: trained users from scientists to policy-makers who run the decision support system.
- Procedures: the rules for how data is input, stored, managed, analysed and presented. Poor procedures cause most GIS errors.
Raster vs Vector Data Formats: Comparison Table
NCERT gives a full section (Box 4.2) to these points because they come up as MCQ and short-answer questions almost every alternate year.
| Feature | Raster Format | Vector Format |
|---|---|---|
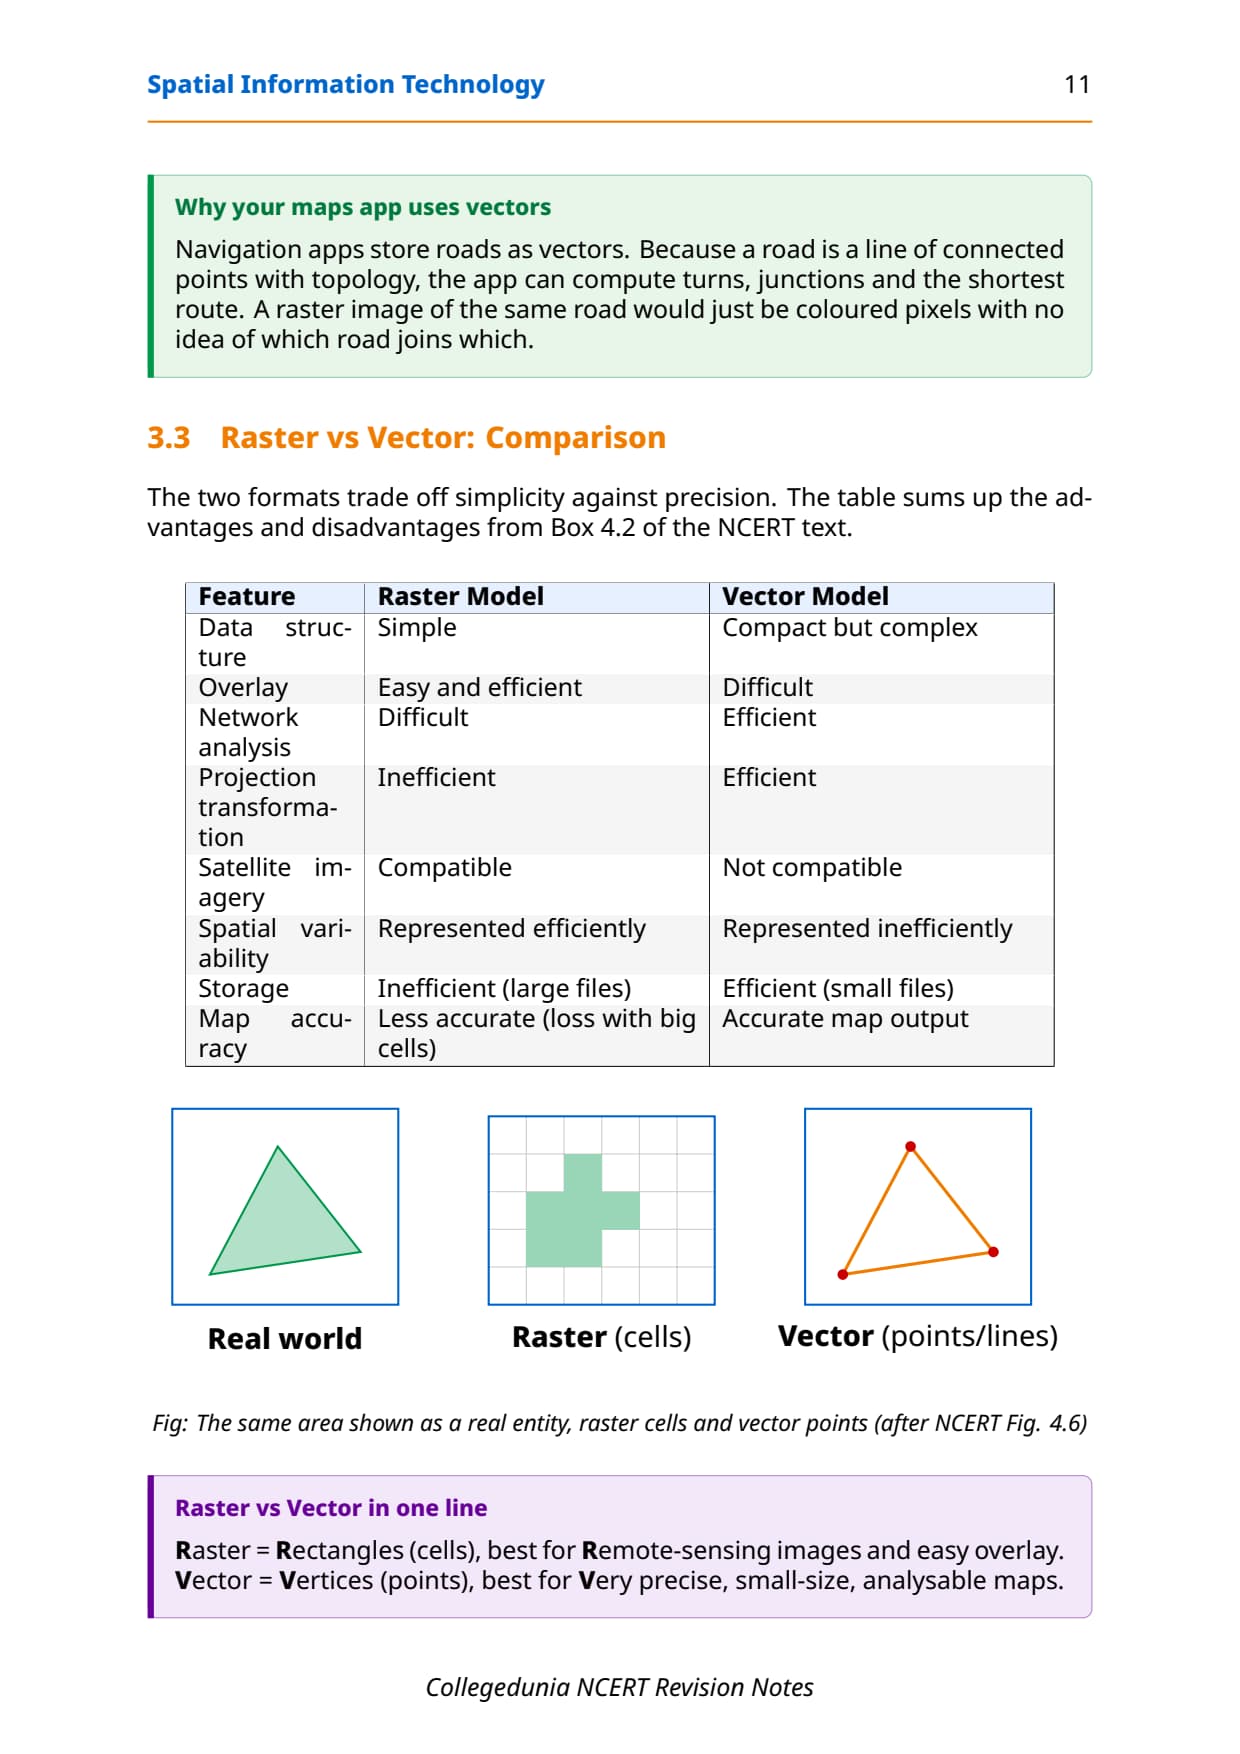
| How space is represented | Grid of cells; each cell has a value | Points, lines, polygons defined by coordinate pairs |
| Data structure | Simple | Complex |
| Overlay operations | Easy and efficient | Difficult |
| Network analysis | Difficult | Efficient |
| Projection transformation | Inefficient | Efficient |
| Storage | Inefficient (large file sizes) | Compact |
| Compatibility with satellite imagery | Compatible | Not compatible |
| Map accuracy | Less accurate; large cells lose detail | Accurate map output |
| High spatial variability | Efficiently represented | Inefficiently represented |
| Best used for | Aerial photos, satellite images, scanned maps, backdrop maps | Precise applications, network analysis, descriptive attribute storage |
Tip: The most-asked MCQ is the raster disadvantage: difficult network analysis. The paired MCQ asks for a vector advantage: compact data structure. Memorise both.
Sequence of GIS Activities: Data Input to Spatial Analysis
NCERT describes five stages every GIS project goes through. CBSE asks students to list them.
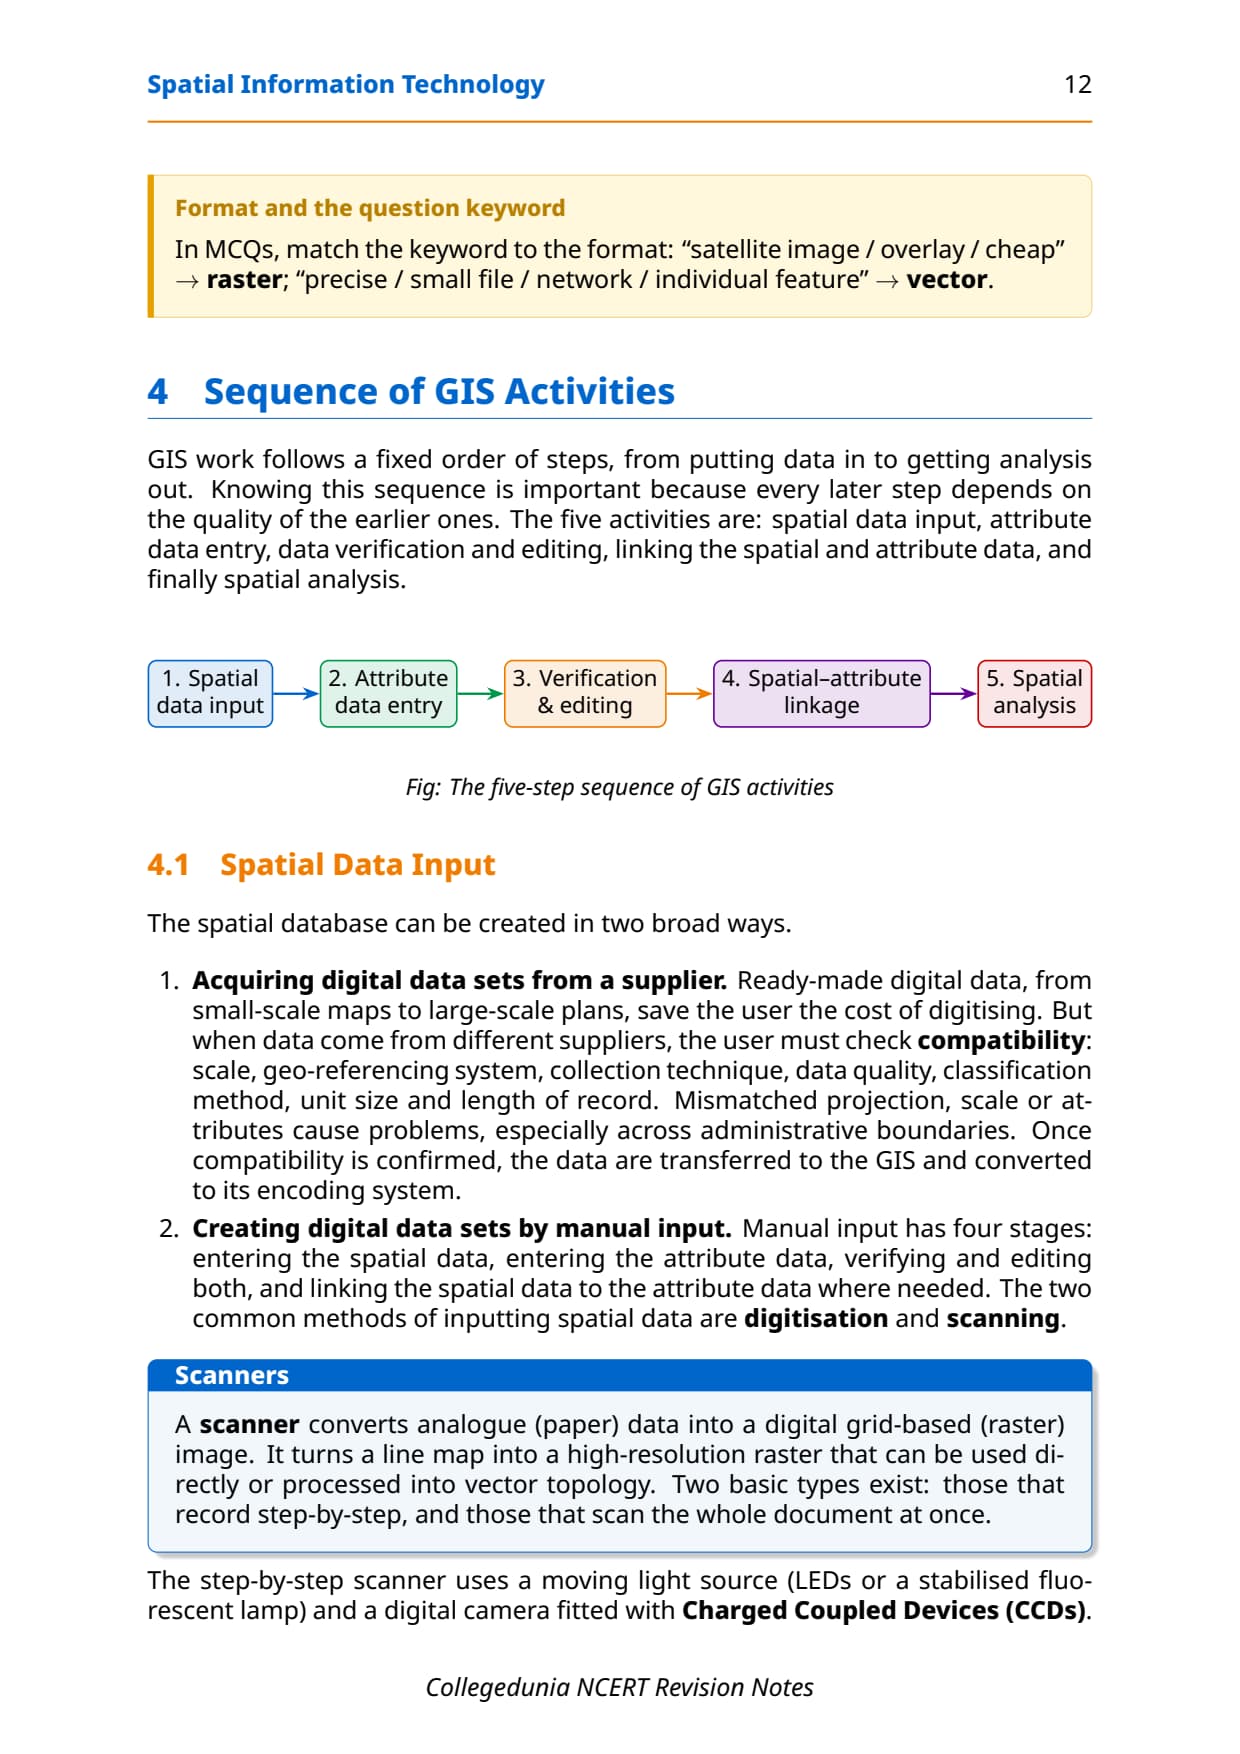
- Stage 1: Spatial Data Input. Buy ready datasets, or create them by digitisation (tracing features with a tablet cursor) or scanning (paper maps to raster). Every map needs a definite scale, symbols and a coordinate system.
- Stage 2: Entering Attribute Data. The non-spatial properties of a feature (a road's width, surface type, traffic count), typed in or imported from records, census data or spreadsheets.
- Stage 3: Data Verification and Editing. Fixing digitising/scanning errors: omissions, under-shoots, over-shoots and distortion. Vector errors are moved or stretched; raster errors are fixed by changing cell values.
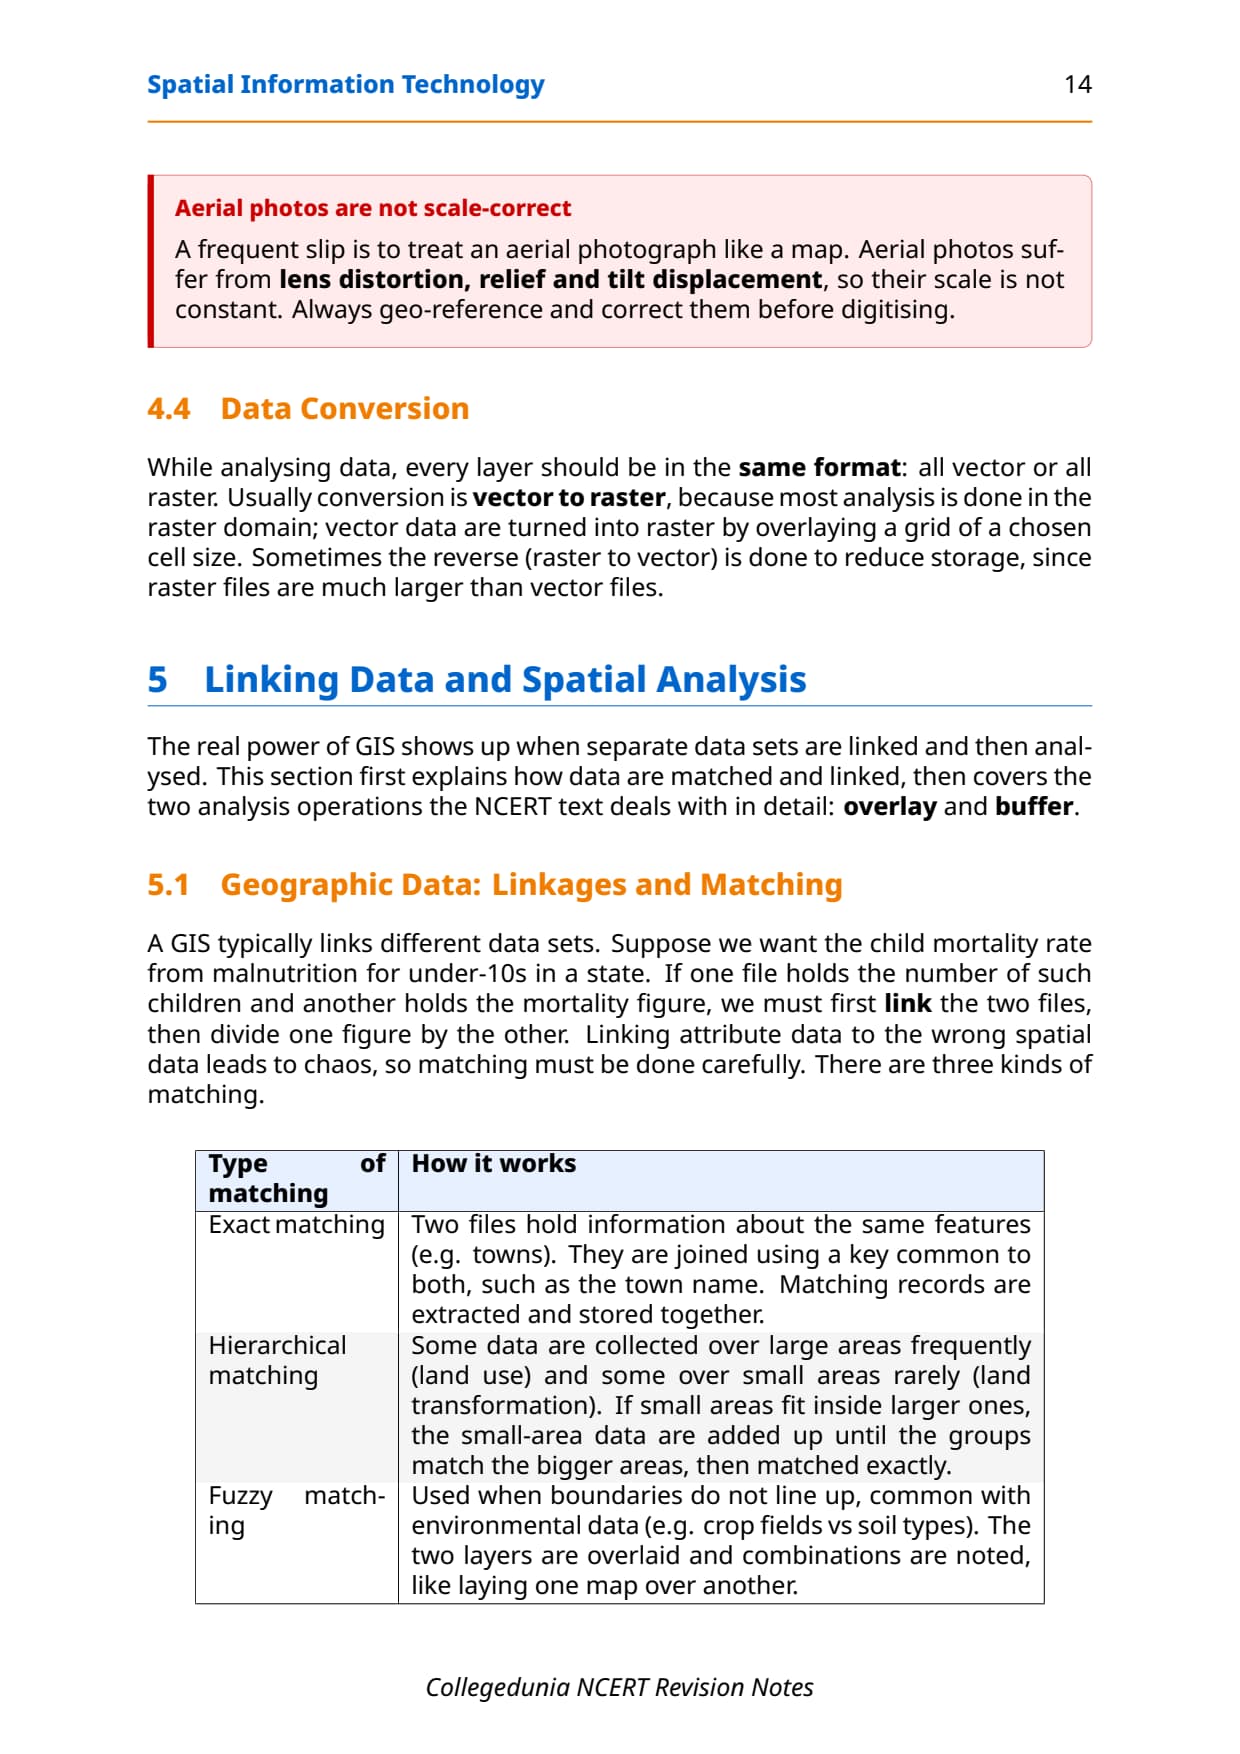
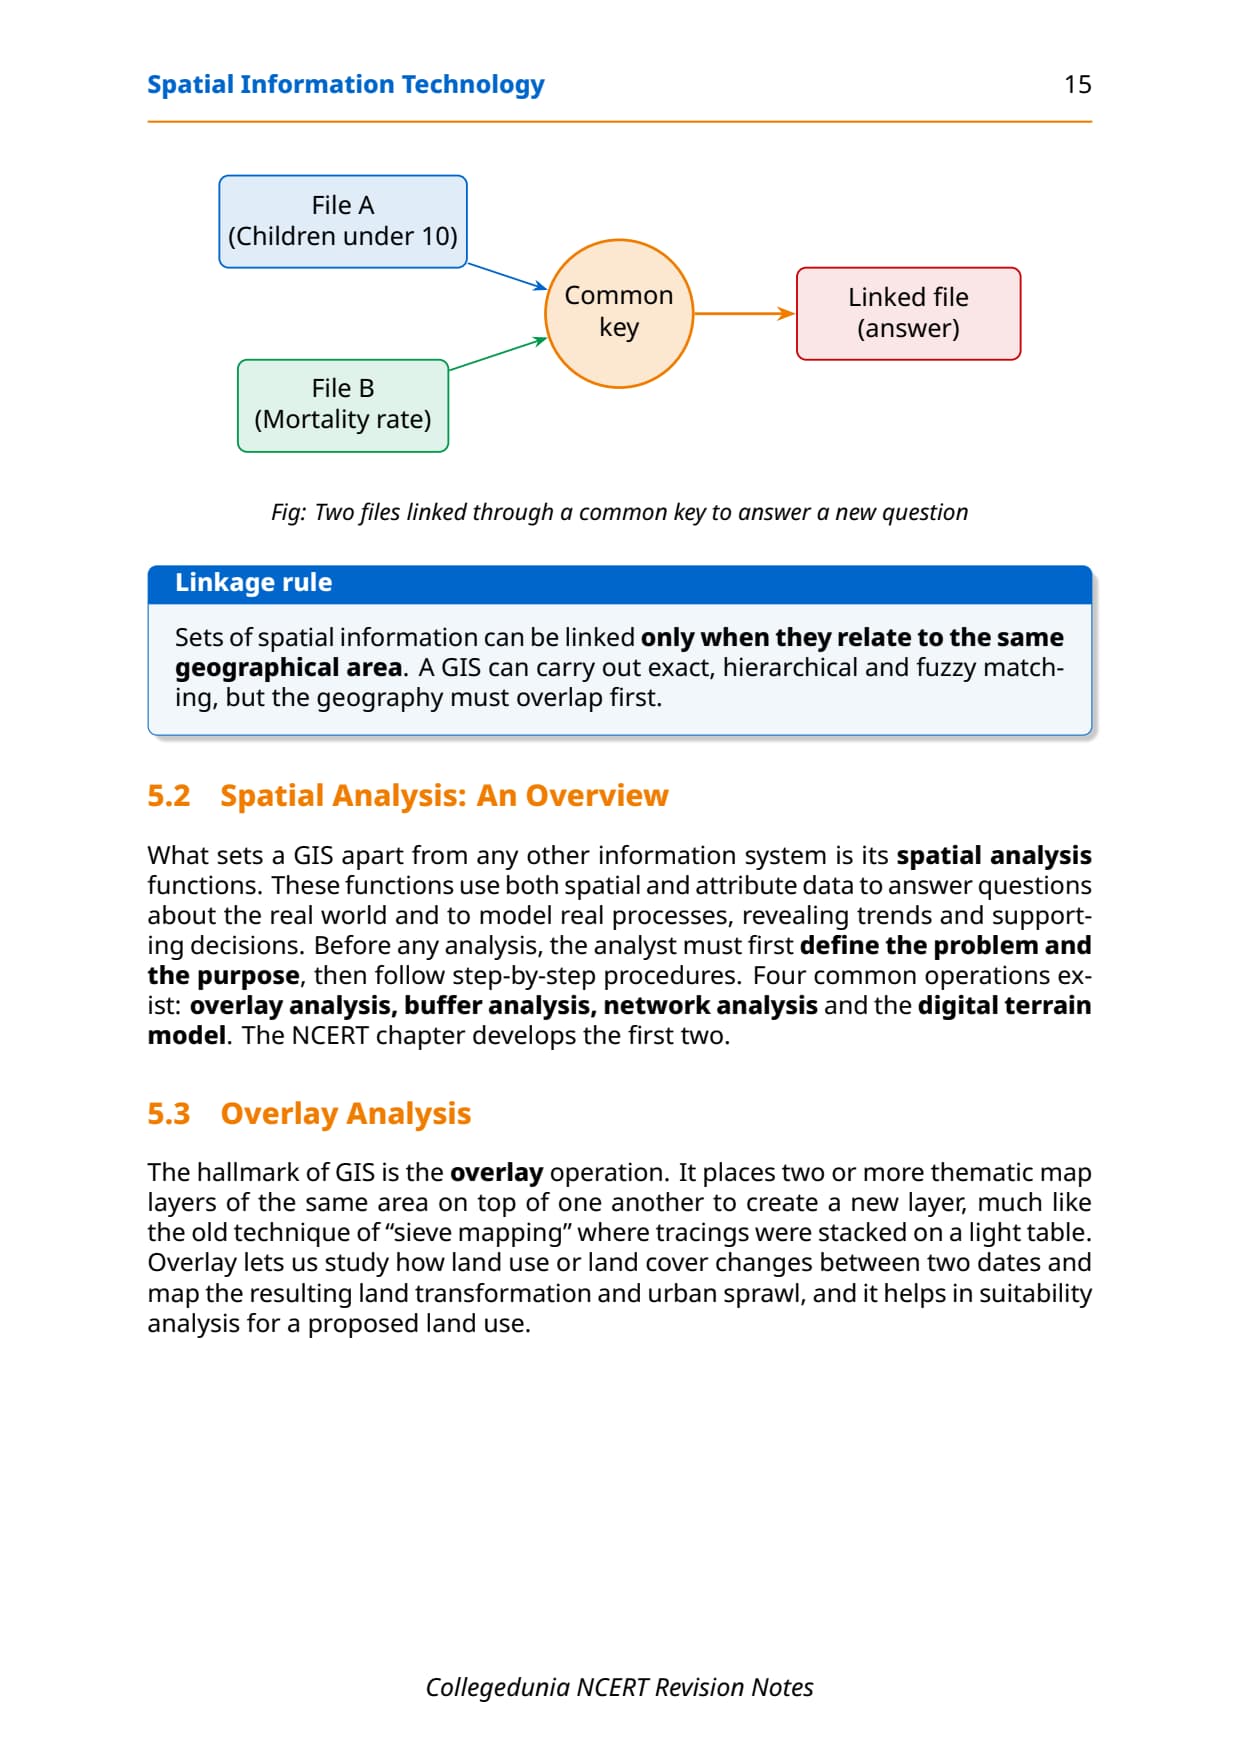
- Stage 4: Spatial and Attribute Data Linkages. Layers join to attribute tables by exact matching (a shared key like town name), hierarchical matching or fuzzy matching.
- Stage 5: Spatial Analysis. The real power of GIS. NCERT lists overlay, buffer, network analysis and Digital Terrain Modelling; overlay and buffer are the two the board tests.
Overlay Analysis and Buffer Analysis in GIS
The two spatial analysis operations CBSE tests most are overlay analysis and buffer analysis.
Overlay Analysis
Overlay analysis integrates two or more thematic layers of the same area into a new output map holding the combined attributes of both. It is like stacking tracing-paper maps, but done digitally and precisely.
Application: NCERT overlays a 1974 and a 2001 urban land use map of Aligarh City to show where land use changed and where urban sprawl occurred. The same technique drives suitability analysis for a proposed land use.
Memory hook: overlay stacks one map on another to find change or combinations; the output is a NEW layer. If CBSE asks which operation detects urban change, the answer is overlay, not buffer.
Buffer Analysis
Buffer analysis creates a zone of specified distance around any point, line or area feature. The output is always a polygon. It is a proximity analysis, measuring how near or far things are from a feature.
Applications listed in NCERT:
- Finding the population within a set distance of a hospital, post office or school.
- Studying the impact of point-source pollution on nearby population.
- Mapping under-served areas using multi-ring buffers around cities with major hospitals.
Case study: Cities of western Uttar Pradesh were given multi-ring buffers (2, 4, 6, 8, 10 km) around those with major hospitals. Areas near the cities are well served, while people far away travel long distances for care. ArcGIS, Geomedia and Quantum GIS all offer ready buffer modules.
Common Mistakes Students Make in Spatial Information Technology
Repeat-offender mistakes CBSE examiners flag each year:
- Swapping raster and vector advantages: raster is SIMPLE (easy overlay) but BAD at network analysis; vector is COMPLEX but GOOD at network analysis and compact storage.
- Calling GIS only a mapping tool: it is a decision support system that answers "What is where?" Half the marks in a definition question come from this analytical function.
- Listing only 3 components: all five (add people and procedures) must be listed.
- Confusing overlay and buffer: overlay stacks two maps to find change; buffer makes a distance zone around one feature.
- Missing the spatial vs non-spatial split: a cycle shop's stock register is non-spatial; a table of literacy rates by state is spatial (Box 4.1).
Previous Year Question Trends from Chapter 4 Geography
The table maps what CBSE has asked over the last four years.
| Year | Question type asked | Marks | Notes section to revise |
|---|---|---|---|
| 2025 | Describe buffer analysis with an example + name three software for GIS | 4 + 2 | Overlay and Buffer Analysis |
| 2024 | MCQ on raster disadvantage + define GIS | 1 + 3 | Key Definitions + Raster vs Vector table |
| 2023 | List five components of GIS + distinguish spatial from non-spatial data | 5 + 3 | GIS Components + Key Definitions |
| 2022 | Explain overlay analysis with an NCERT case study + list advantages of GIS over manual methods | 4 + 3 | Overlay Analysis + Advantages section |
The chapter carries roughly 8 to 10 marks per year across MCQs, short answers and activity-based questions.
Other Resources for Class 12 Geography Chapter 4 Spatial Information Technology
Pair these notes with the NCERT Solutions, Handwritten Notes and NCERT Book PDF below.
| Resource | What it covers | Open |
|---|---|---|
| Notes | Concept-first revision notes covering GIS definition, components, raster vs vector formats, spatial analysis operations and common mistakes. | You are here |
| NCERT Solutions | Step-by-step answers to all five MCQs and all 30-word and 125-word exercise questions with expert solutions. | Class 12 Geography Chapter 4 NCERT Solutions |
| Handwritten Notes | Topper's handwritten revision pages for last-minute board exam practice. | Class 12 Geography Chapter 4 Handwritten Notes |
| NCERT Book PDF | Official NCERT Practical Work in Geography Chapter 4 textbook in PDF form. | Class 12 Geography Chapter 4 NCERT Book PDF |
| Subject Hub | All chapters of Class 12 Geography with every resource in one place. | Class 12 Geography Subject Hub |
All Chapters Notes for Class 12 Practical Work in Geography
Related Links: Notes for the other chapters of Class 12 Practical Work in Geography.
| Chapter | Topic | Notes link |
|---|---|---|
| Chapter 1 | Data: Its Source and Compilation | Class 12 Geography Data Its Source and Compilation Notes |
| Chapter 2 | Data Processing | Class 12 Geography Data Processing Notes |
| Chapter 3 | Graphical Representation of Data | Class 12 Geography Graphical Representation of Data Notes |
| Chapter 4 | Spatial Information Technology | You are here |
NCERT Notes Class 12 Geography Chapter 4 Spatial Information Technology FAQs
Ques. What is Spatial Information Technology in Class 12 Geography?
Ans. Spatial Information Technology refers to the use of technological inputs in collecting, storing, retrieving, displaying, manipulating, managing and analysing spatial information. The word spatial means related to space; it covers features and phenomena distributed over a geographically definable space with physically measurable dimensions. Spatial Information Technology is an amalgamation of Remote Sensing, GPS, GIS, Digital Cartography and Database Management Systems. The NCERT textbook introduces it as the answer to questions like "What is where?", "Why is it there?" and "What will happen if it is shifted?" which ordinary DBMS or Computer Assisted Cartography cannot answer.
Ques. What is GIS and how is it defined in the NCERT Class 12 Geography textbook?
Ans. GIS stands for Geographic Information System. The NCERT Class 12 Geography textbook defines it as "a system for capturing, storing, checking, integrating, manipulating, analysing and displaying data, which are spatially referenced to the Earth." This definition is normally considered to involve a spatially referenced computer database and appropriate applications software. GIS is an amalgamation of Computer Assisted Cartography and Database Management Systems and draws strength from spatial and allied sciences such as Computer Science, Statistics, Cartography, Remote Sensing, Database Technology, Geography, Geology, Hydrology, Agriculture and Environmental Science. Students must use these exact phrases in a 5-mark definition question.
Ques. What are the five components of GIS in Class 12 Geography?
Ans. The five components of GIS as listed in the NCERT Class 12 Geography Chapter 4 textbook are: (1) Hardware, which covers processing, storage, display and input/output subsystems; (2) Software, which includes three module types: data entry and editing, analysis/transformation/manipulation, and data display and output; (3) Data, comprising spatial data (digital maps) and non-spatial tabular data stored in a DBMS; (4) People, ranging from engineers and scientists to policy-makers and monitoring agencies who use GIS to build decision support systems; and (5) Procedures, which define how data is retrieved, input, stored, managed, transformed, analysed and presented. All five must be listed in a complete CBSE answer.
Ques. What is the difference between raster and vector data formats in GIS?
Ans. Raster data represents a graphic feature as a pattern of grid squares called cells. Each cell is assigned a position and a value based on the attribute at that location. Raster is simple in structure, easy to overlay and compatible with satellite imagery but is inefficient in storage, poor at network analysis and loses accuracy with larger cells. Vector data represents geographic objects using coordinate pairs (X, Y or X, Y, Z) to define points, lines and polygons. Vector is compact, efficient for network analysis and gives accurate map output, but has a complex data structure, difficult overlay operations and is not compatible with satellite imagery. Raster is best for aerial photos and satellite images; vector is best for precise applications and network analysis.
Ques. What are the advantages of GIS over manual methods?
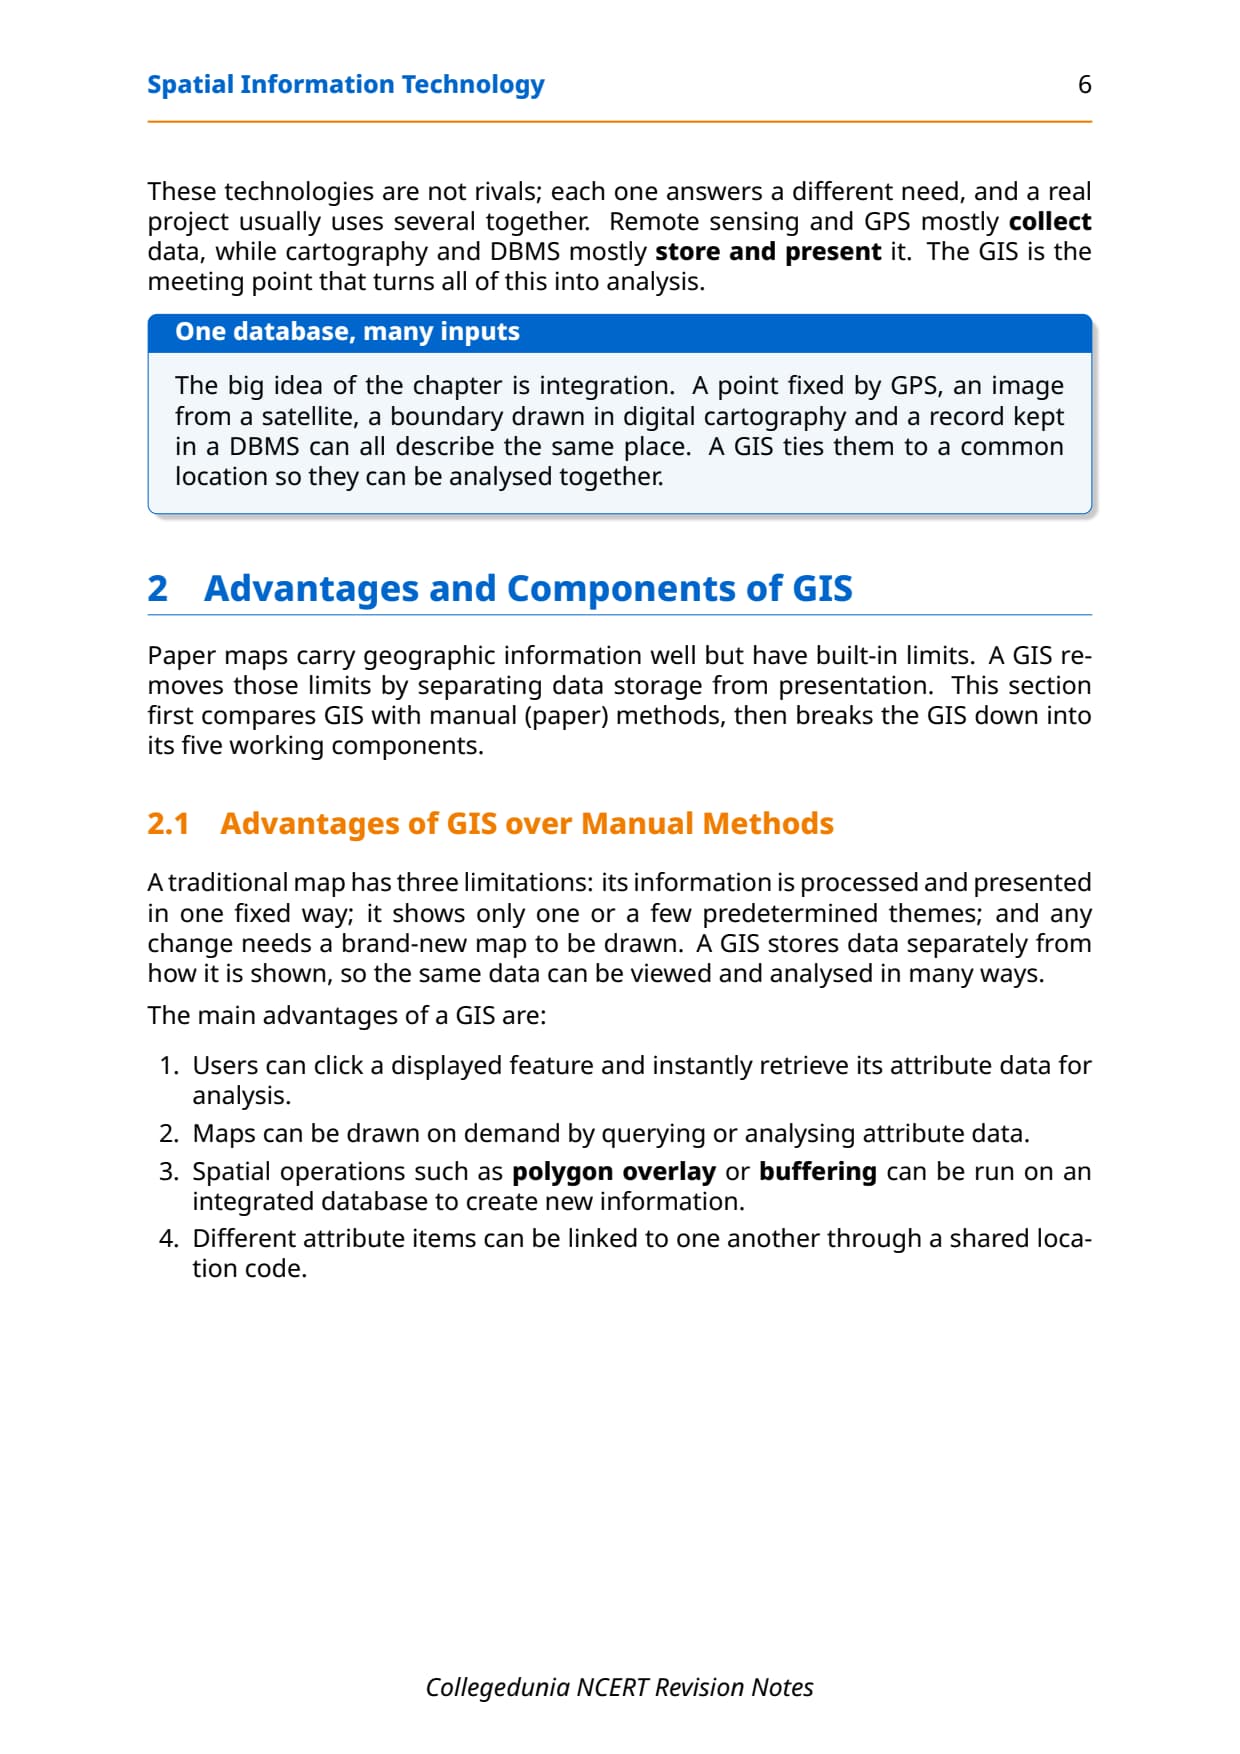
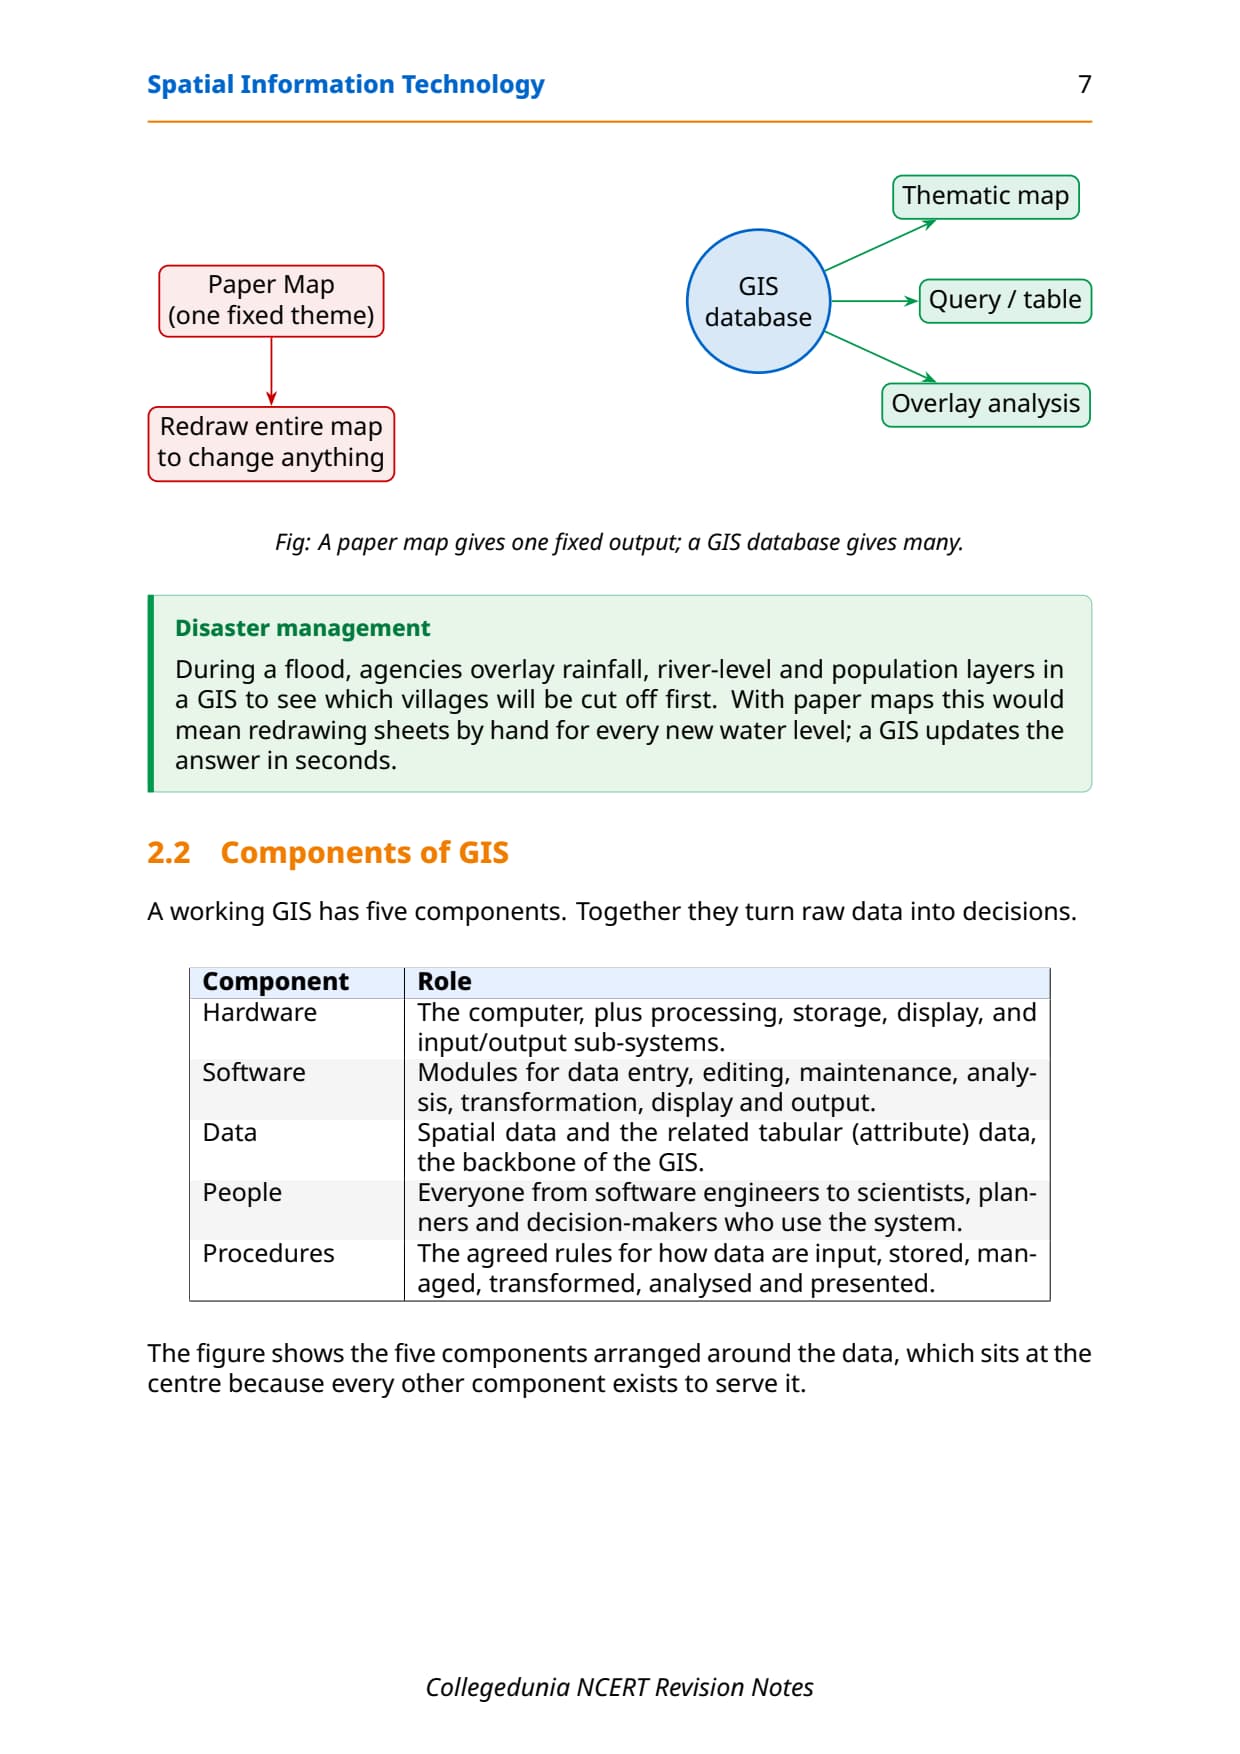
Ans. The NCERT textbook lists four key advantages of GIS over manual mapping methods. First, users can interrogate displayed spatial features and retrieve associated attribute information for analysis, which a paper map cannot do. Second, maps can be drawn by querying or analysing attribute data, so new thematic maps can be generated without redrawing from scratch. Third, spatial operations like polygon overlay or buffering can be applied on an integrated database to generate entirely new information sets. Fourth, different items of attribute data can be associated with each other through shared location codes, enabling multi-layer analysis that is impossible with paper maps.
Ques. What is overlay analysis in GIS and where is it used?
Ans. Overlay analysis is the hallmark GIS operation where two or more thematic map layers of the same area are integrated to produce a new output map layer containing the combined attributes of all input layers. It is similar to the manual method of placing tracing paper maps on a light table, but GIS does it digitally and precisely. Overlay analysis is used to study land use or land cover changes over two time periods, to detect urban sprawl, and to carry out suitability analysis for proposed land uses. The NCERT textbook illustrates this with the example of overlaying 1974 and 2001 urban land use maps of Aligarh City to detect changes and map urban expansion during that period.
Ques. What is buffer analysis and what is its use in GIS?
Ans. Buffer analysis creates a zone of specified distance (a buffer) around any point, line or area feature. The output is always a polygon, regardless of whether the input is a point, line or area. Buffer analysis is a form of proximity analysis and is used to: identify the population within a certain distance of a hospital, post office or school; study the impact of point-source pollution on surrounding populations; and locate areas with poor access to services. The NCERT textbook gives the example of creating 2, 4, 6, 8 and 10 km buffers around cities with major hospitals in western Uttar Pradesh to map which areas are well served and which are not. ArcGIS, Geomedia and Quantum GIS all provide ready buffer analysis modules.
Ques. What is the difference between spatial and non-spatial data in GIS?
Ans. Spatial data are characterised by their positional, linear and areal forms of appearance and are geometrically registered to a defined coordinate system. They describe the location and shape of geographic features. Non-spatial or attribute data describe the properties of spatial entities but are not themselves spatial. For example, a road captured as a line (spatial) has associated attributes like road width, surface type and traffic count (non-spatial). The NCERT textbook's Box 4.1 contrasts a cycle shop stock register (non-spatial, because cycle parts have no fixed location) with a literacy rate table by state (spatial, because states have defined map locations). This example appears in board MCQs and short answers.
Ques. What is data verification and editing in the context of GIS?
Ans. Data verification and editing is Stage 3 in the sequence of GIS activities. After spatial data is entered by digitisation or scanning, it must be checked for errors. Common errors include data omissions (missing features), under-shoots and over-shoots (lines that fall short of or cross a junction), wrong-scale digitising and spatially distorted data from damaged or folded maps. Verification is done by printing the digital data on translucent paper at the same scale as the original and overlaying the two on a light table to spot differences. Editing is done on-screen using a mouse, keyboard or digitiser tablet. Vector errors are corrected by moving, rotating, inserting or stretching graphical entities; raster errors by changing cell values.
Ques. How are these Class 12 Geography Spatial Information Technology notes aligned to the 2026-27 syllabus?
Ans. These spatial information technology class 12 Geography notes are aligned to the 2026-27 reprint of the NCERT Practical Work in Geography Part II textbook, Chapter 4. The textbook content for this chapter is unchanged in the current cycle. Every definition, GIS component, data format comparison, GIS activity sequence, overlay and buffer analysis description and NCERT case study in these notes is drawn directly from the 2026-27 NCERT text. The Previous Year Question table above cross-references recent CBSE board papers to confirm continued relevance of each section.
Ques. Is Chapter 4 of Practical Work in Geography important for CUET and UPSC?
Ans. Yes. For CUET Geography, Chapter 4 is directly within the Class 12 NCERT scope and can generate definition-type questions on GIS, raster vs vector data and spatial analysis operations. For UPSC Prelims and Mains (Geography optional), spatial information technology concepts including Remote Sensing, GPS and GIS are a recurring area in map-based and analytical questions. Students preparing for UPSC should go beyond the Class 12 notes and explore real-world applications like ISRO's Bhuvan platform and the National Remote Sensing Centre (NRSC) portal, both of which the NCERT textbook references as internet sources for further learning.



Comments