



Content Curator
Acceleration Time Graph is the graph that measures the velocity change in the given time interval. The area beneath the acceleration graph is marked as the change in velocity within a specified interval of time. Velocity is the measurement of the motion of an object. The rate of change of velocity with respect to time is called acceleration. The unit at which the acceleration is measured m2/sec.
| Table of Content |
Key Takeaways: Acceleration, Velocity, Time Interval, Displacement, Area, Change in Velocity
What is Acceleration Time Graph?
[Click Here for Sample Questions]
Acceleration Time graph can be well-explained with the help of these below figures:-

Fig-A
Fig A- In fig A time is plotted on the X-axis and acceleration is placed in the Y-axis. A line is drawn parallel to the timeline and the same indicates a constantly accelerated motion. It means time passes but the value of acceleration does not change.
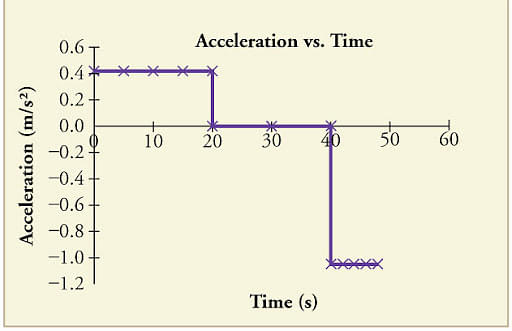
Fig-B
Fig B- In Fig B, the first time interval is 0 to 20 where the time is constant parallel to the timeline, then between 20 and 40 the acceleration is zero and beyond 40 the acceleration is -1. To interpret the same, for first the 20 seconds, the timeline is in the positive direction, between 20 to 40, the object was traveling at a constant velocity, and after 40 the object starts accelerating in the negative direction where the velocity decreases leading to deceleration.
Hence, by looking at an Acceleration graph, the positive and the negative velocity with time can be easily identified.
The video below explains this:
Acceleration Time Graph Detailed Video Explanation:
Read More:
| Related Articles | ||
|---|---|---|
| Third Law of Motion | Centre of Mass | Torque or Couple |
Common terms of Acceleration Time Graph
[Click Here for Sample Questions]
A Few common terms of an Acceleration Time Graph are listed below:-
Velocity- Velocity is the measurement of the motion of an object. Velocity can be defined with magnitude and direction. The velocity is generally termed as speed and it is measured by m/s unit.
Time Period- It is the given interval of time within which the motion of the object is measured. The object’s movement is measured within a specified time frame. The time is measured in seconds.

Velocity and Acceleration
Acceleration- The movement of an object is called acceleration. The rate of change in the motion of an object is called acceleration. Such change of velocity can be measured using Acceleration Time Graph. The unit at which the acceleration is measured m2/sec. It is the actual measure of the velocity of the object.
Read More: Radius of Gyration
Displacement- It is determined from the movement of the velocity curve and the time curve. The area between the two axes is called the displacement area. It can be both positive and negative depending on the motion of the object and its sign.
Mathematical Expressions:
Area (change in velocity) = ΔV
Change in acceleration = Δa
Change in Time = Δt
Hence, acceleration stands to be
Δa = ΔV/ Δt
Read More:
| Related Topics | ||
|---|---|---|
| Speed time Graph | Average Speed Formula | Path Length and Displacement |
Acceleration Time Graph For Uneven Object Motion
[Click Here for Sample Questions]
With the help of this image, the acceleration can be explained where the object has an uneven motion:-
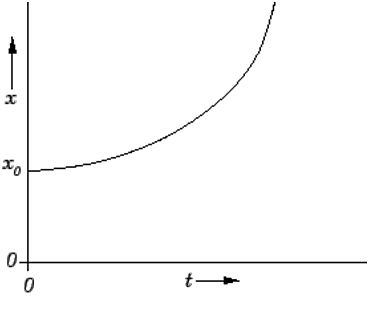
Acceleration time graph for uneven object motion
Here, Time is on the X-axis, and Velocity is plotted on the Y-axis. The area between the velocity curve and the timeline in the above fig is the area that the velocity curve covers with the time axis are called Displacement or Change in position
Relation between Displacement, Velocity and Time
For establishing a relation between the three, Displacement is denoted as ‘s’, Velocity is denoted as ‘v’, and time is denoted as ‘t’.
V= ds/dt
A= dv/dt
Therefore, the area will represent the change in velocity.
Read More:
| Relevant Articles | ||
|---|---|---|
| Magnetic Force | Mass and Weight | Motion in a straight line |
Examples Explaining The Accelerated Time Graph
[Click Here for Sample Questions]
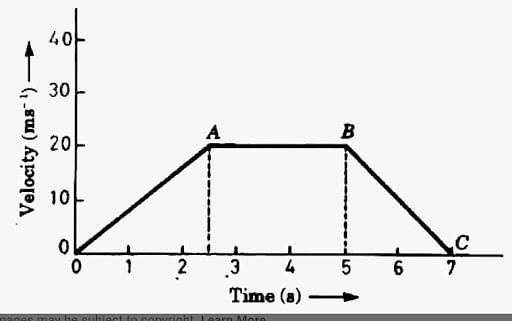
| Example 1: When the initial velocity (v0) is 0 which starts from the rest time i.e. (t0) and the acceleration time graph is shown in the below figure, then what will be the maximum velocity?
Ans. Here, the acceleration is positive till the end indicating that the velocity increases continuously but not constantly for 11 seconds. Hence, the area will represent the change in velocity (area). Area= ½ * 10*11 = 55 ΔV= 55 m/s. Hence, maximum velocity at V0= = 0m/s + 55m/s = 55m/s2. Example 2: Find out the velocity of the object if it starts a v = 5m/s?
Ans. In the above fig change in velocity (area)= ½*20*5+20*5+1/2*20*5= 200m/s2 Final Velocity= Initial velocity +Change in Velocity = 5+200= 205 m/s2 |

Read More:
| Relevant Topics | ||
|---|---|---|
| Gravity | Frictional Force | Banking of Roads |
Things to Remember
- The most important point of the acceleration time graph is to understand the unit given in the question. Otherwise, the absolute value cannot be measured.
- The graph allows measuring the change of velocity for a given interval and not a particular period of time.
- The object can accelerate in three directions- increasing direction, decreasing direction, and change in direction.
- The acceleration of an object can change due to two reasons- one is the force and the other is the mass change.
- The slope of the Acceleration Graph represents the jerk of the graph.
Sample Questions
Ques. How to measure the velocity at a specified time using Acceleration Time Graph? (3 marks)
Ans. It is not possible to determine the velocity of an object at any particular specified time. But, using Accelerated Time Graph the change in velocity or area can be measured. The initial velocity will be given in the question. Deduct the area calculated from the initial velocity and can get the velocity of the object at a specified time. Hence, it can only be calculated by the deduction method.
Ques. What is the magnitude of Displacement? (2 marks)
Ans. The displacement magnitude is 360m and it moves along the X-axis and is positive. When it moves towards a negative direction it becomes displaced. The path of the magnitude of displacement may vary. But it will never be zero as the object is always in motion. Motion is presented on the positive side of the graph. So the magnitude of displacement is marked (+).
Ques. What does slope state in a velocity graph? (2 marks)
Ans. The slope measures the acceleration of the object. With the change in slope, the change in velocity can be determined. When the slope is steeper, it means the velocity change rate is fast. Again, if the slope crosses the timeline, it indicates that the object is still in motion but has taken a negative direction.
Ques. How to calculate the distance in an accelerated time graph? (2 marks)
Ans. First, find out the velocity of the area below the line and then multiply the same with time. You will get the distance traveled by an object. The area should be calculated below the acceleration curve as it will provide the absolute figure.
Ques. Explain how to find out displacement from an acceleration time graph? (2 marks)
Ans. Displacement shows how the object's motion changes with time. There is a thin line between displacement and acceleration. When the acceleration turns negative it is called displacement. The area below the area of acceleration below the timeline is called displacement. The same can be determined by a displacement time graph.
Ques. What is a jerk in the acceleration time graph? (2 marks)
Ans. The quantity is called the jerk. The slope in the graph represents the quantity. The slope is drawn to measure the velocity of the object in motion. Based on its movements the slope changes in turn and determines the slope.
Ques. Explain the area of acceleration time graph in brief. (2 marks)
Ans. The change in velocity is called the area which represents the section under the graph. After determining the acceleration, multiply the same with the time taken, and the area below the curve is known. But only the area for that particular time interval is measured and not for a specified second. Generally, the area under the curve is represented by a rectangle when marked between the velocity and time.
Ques. Explain the slope of an acceleration time graph. (2 marks)
Ans. The slope of the graph is defined as the change in velocity divided by the change in time. It is called jerk. The vertical axis represents the velocity and the horizontal one represents the time graph. The slope is drawn according to these two.
Check-Out:



Comments