



Content Curator
P-value is the probability of attaining results as extreme as the actual results of a statistical hypothesis test, expecting that the null hypothesis is correct. It acts as a substitute to rejection points in order to give the least level of significance or importance at which the null hypothesis would be rejected. The smaller p-value shows that the alternative hypothesis is stronger.
Read Also: Theoretical Probability
| Table of Content |
Key Takeaways: P-Value, Null Hypothesis, Probability, Alpha Value, Statistics
What is P-Value?
[Click Here for Sample Questions]
P-value or probability value is a number, calculated from a statistical test. It depicts the probabilities of finding the observations if the null hypothesis is positive. They are used in hypothesis testing to aid the decision of either rejecting or accepting the null hypothesis. The level of statistical significance is represented as a p-value between 0 and 1. If the p-value is smaller, then the chances of getting a null hypothesis rejected is high.

P-Value
- A p-value ≤ 0.05 is considered as statistically significant. This is expressed as strong evidence against the null hypothesis, as the probability of identifying a null as correct is less than 5%. Hence the null hypothesis can be rejected by accepting the alternative hypothesis. If the p-value is below the threshold of significance or < 0.05, then the null hypothesis can be rejected. But it does not make the alternative hypothesis true and doesn't mean that there is 95% probability. The p-value depends upon the null hypothesis being true. But this is not related to the falsity or truth of the alternative hypothesis.
- If a p-value is > 0.05, then it is not statistically significant and expresses strong proof for the null hypothesis. So, reject the alternative hypothesis and retain the null hypothesis (Null hypothesis cannot be accepted. It can only be rejected or fail to reject). The statistically significant result cannot confirm that a research hypothesis is correct (this refers to 100% certainty). Instead, the results can be stated as ‘give evidence for’ or ‘provide support for’ the research hypothesis.

Graph showing rejection values of null hypothesis
Read Also:
How to Calculate p-Value?
[Click Here for Sample Questions]
The p-values are automatically calculated using statistical softwares (SPSS, R, etc). The p-values can also be found using spreadsheets or p-value tables. The calculations are made on the basis of known probability distribution of the definite statistic tested. The calculations are done from the deviation between the chosen reference value and observed value.
In mathematics, the p-value can be calculated with integral calculus from the field under the probability distribution curve. The calculation varies on the basis of the type of test performed. The types of tests that express the location on the probability distribution curve are two-sided test/ upper-tailed test, and lower-tailed test.
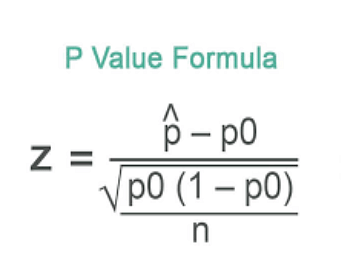
p-Value formula
Read Also:
Statistical Significance & p-Values
[Click Here for Sample Questions]
The p-values are commonly used by researchers to express whether a specific pattern measured is statistically significant or not. The statistical significance is one way to determine that the p-value of the test is small enough to reject the null hypothesis. The general threshold is p < 0.05, but it also depends on the field of study. Some areas prefer thresholds of 0.01, or even 0.001. The threshold value for determining the statistical significance is also called the alpha value.
Read Also: NCERT Solutions for class 10 Mathematics chapter 15 Probability
Things to Remember
[Click Here for Sample Questions]
- The p-value (Probability value) is a number, calculated from a statistical test. It considers the proximities of finding the observations if the null hypothesis is positive.
- The statistical significance level is represented as a p-value ranging between 0 and 1.
- When a p-value is smaller, the chances of a null hypothesis getting rejected becomes high.
- The p-value is calculated with integral calculus from the field under the probability distribution curve. The calculation differs based on the type of test performed.
Also Read:
| Independent Events in Probability | Multiplication Theory on Probability | Conditional Probability Formula |
Sample Questions
Ques. What is the null hypothesis? (2 marks)
Ans. It is a type of hypothesis in statistics which states that there are no differences between certain patterns or data generated processes. On the other hand, an alternative hypothesis proposes that there is a difference.
Ques. Define p-value? (2 marks)
Ans. A p-value, also known as probability value, is a number that shows how likely it is that the specific data would have occurred in the null hypothesis of a certain statistical test.
Ques. Define the statement p-value less than 0.05? (2 marks)
Ans. The p-value is less than 0.05 (p < 0.05) means the result is statistically significant. Hence, the null hypothesis can be rejected and an alternative hypothesis can be accepted.
Ques. What is a smaller p-value? (2 marks)
Ans. The smaller the p-value, the bigger the statistical significance. This results in the rejection of null hypothesis and acceptance of alternative hypothesis.
Ques. A hypothesis is being tested H0: μ = 120 by using the alternative hypothesis approach Hα: μ > 120 and assuming that α = 0.05. The sample values taken are n =40, σ = 32.17 and xÌ = 105.37. Elaborate the conclusion for this hypothesis? (3 marks)
Ans. We know σ¯x= σ/ √n
Substitute the given value,
σ¯x = 32.17/ √40 = 5.0865
As per the test static formula,
t = (105.37 – 120) / 5.0865, so t = -2.8762
With Z-score table, find the value of P(t > – 2.8762)
So, P (t < -2.8762)
= P(t > 2.8762) = 0.003
If P(t > -2.8762) =1 - 0.003 = 0.997
P- value =0.997 > 0.05
The value of p > 0.05, hence null hypothesis is accepted.
Question: Could there be a p-value which is greater than 1? (2 marks)
Ans. The p-value is known as probability value. It expresses the probability of achieving the result under a specific hypothesis. Since the value ranges between 0 and 1, the p-value cannot exceed 1.
Question. Define Z-Test? (3 marks)
Ans. It is a statistical test which is used to figure out whether two population means are distinct when the variances are known and the sample size is big. The test statistic could consist of a normal distribution and nuisance parameters like standard deviation must be known for the accurate assessment of the z-test.
Ques. What is alpha risk? (2 marks)
Ans. The term risk determines the chances of making an incorrect decision. In a statistical test, a null hypothesis could be rejected when it is actually positive or true. This type l error or false positive is known as the alpha risk.
Read Also:



Comments