




These Class 12 Geography Chapter 2 World Population Distribution Density and Growth notes cover every NCERT definition, the factors that shape population distribution, the three components of population change, demographic transition theory, and push-pull migration factors, all aligned to the 2026-27 syllabus for a quick night-before revision.


- Concept-first revision of distribution, density, factors, growth components, demographic transition and population control.
- CBSE-ready one-line definitions and formula cards for CBR, CDR and density of population.
- CBSE and CUET question trends, common mistake alerts, and cross-pointers to Solutions, Handwritten Notes and the NCERT Book PDF.
Every line in these world population distribution density and growth Class 12 notes is written by Collegedunia Geography subject experts, mapped to the 2026-27 NCERT Fundamentals of Human Geography textbook, and pressure-tested against the last five years of CBSE Class 12 board papers and CUET Geography question patterns.
Student Feedback
72% of students found the three stages of demographic transition the most-confused area, and 3 out of 4 rated push-pull factors as the part most worth revising from a notes sheet. Toppers said pairing these notes with the Solutions PDF added 2 to 3 marks per answer in mocks.
Source: 2026-27 Class 12 Geography student poll, 9,240 students.
Quick Concept Recap: World Population at a Glance
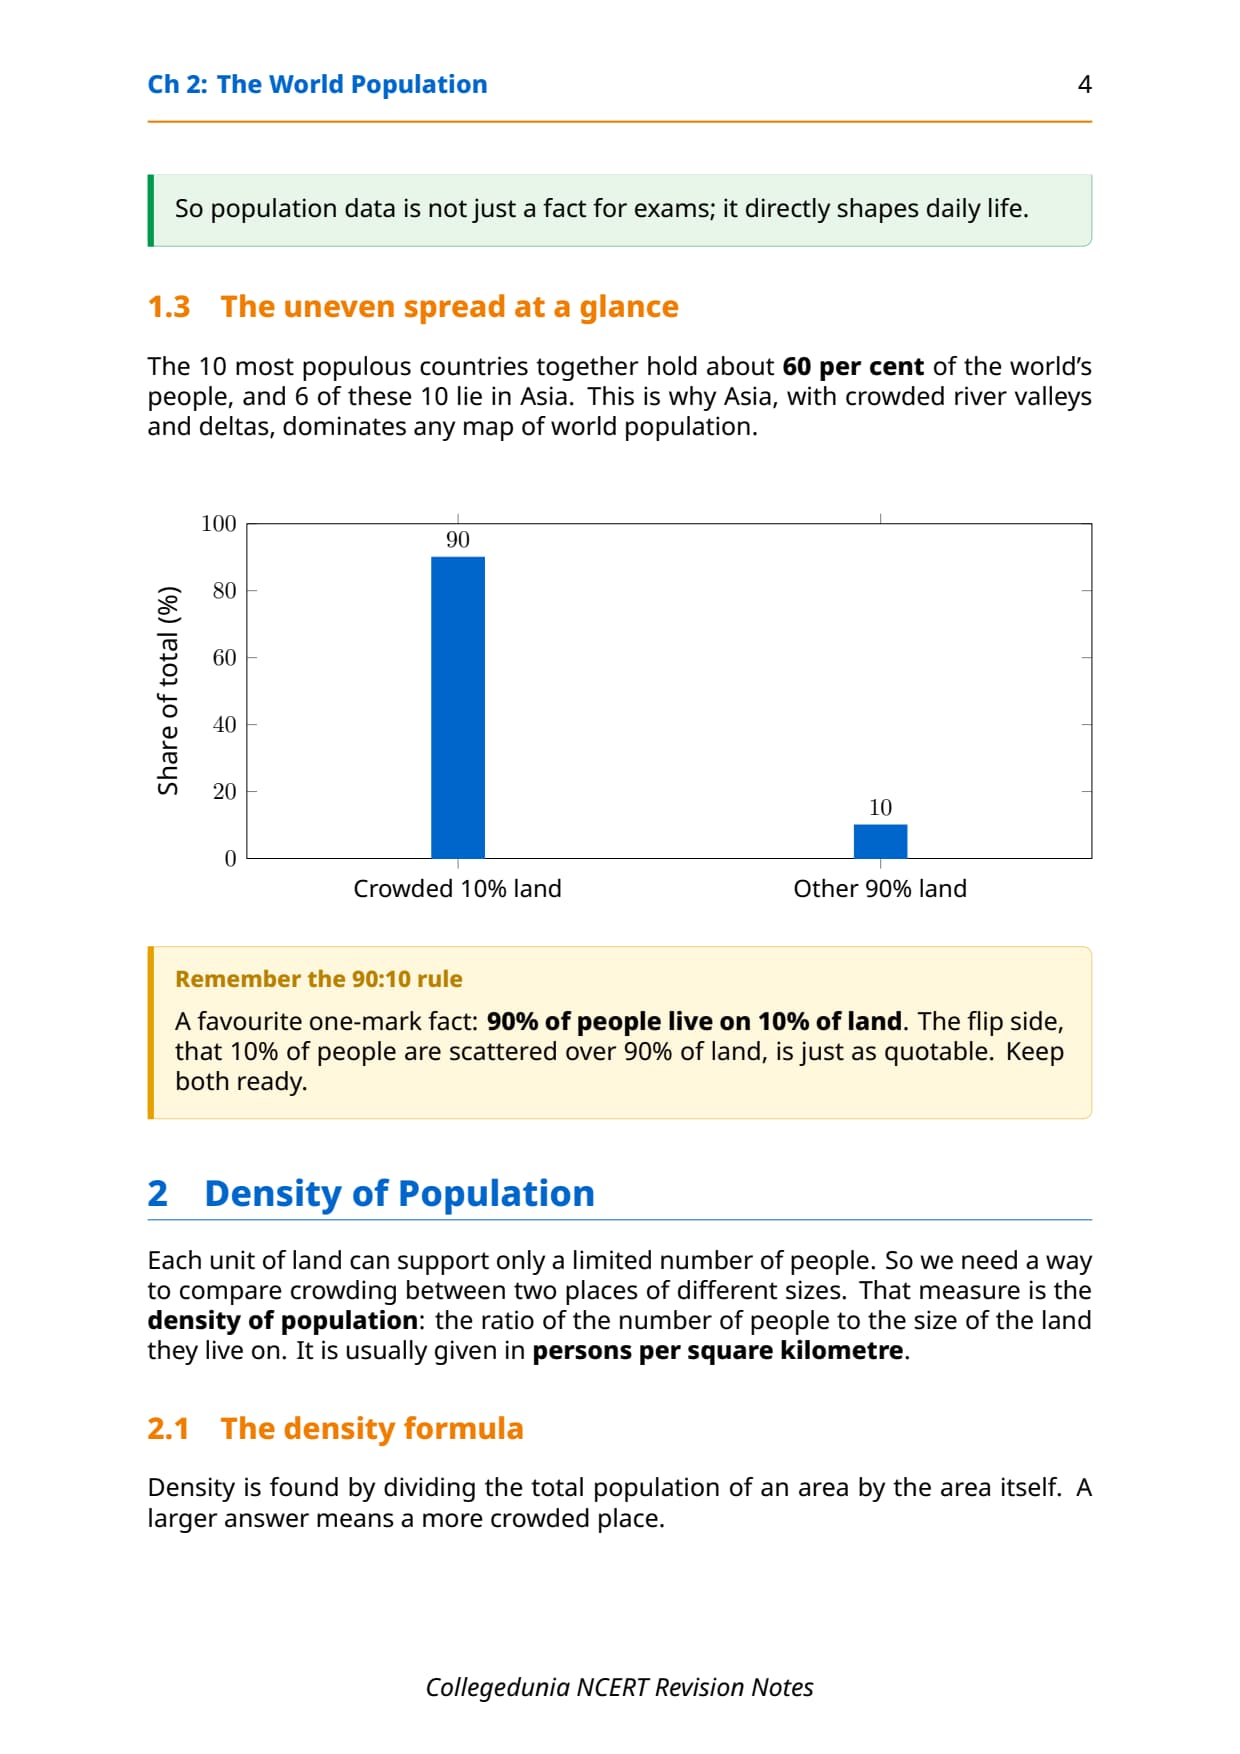
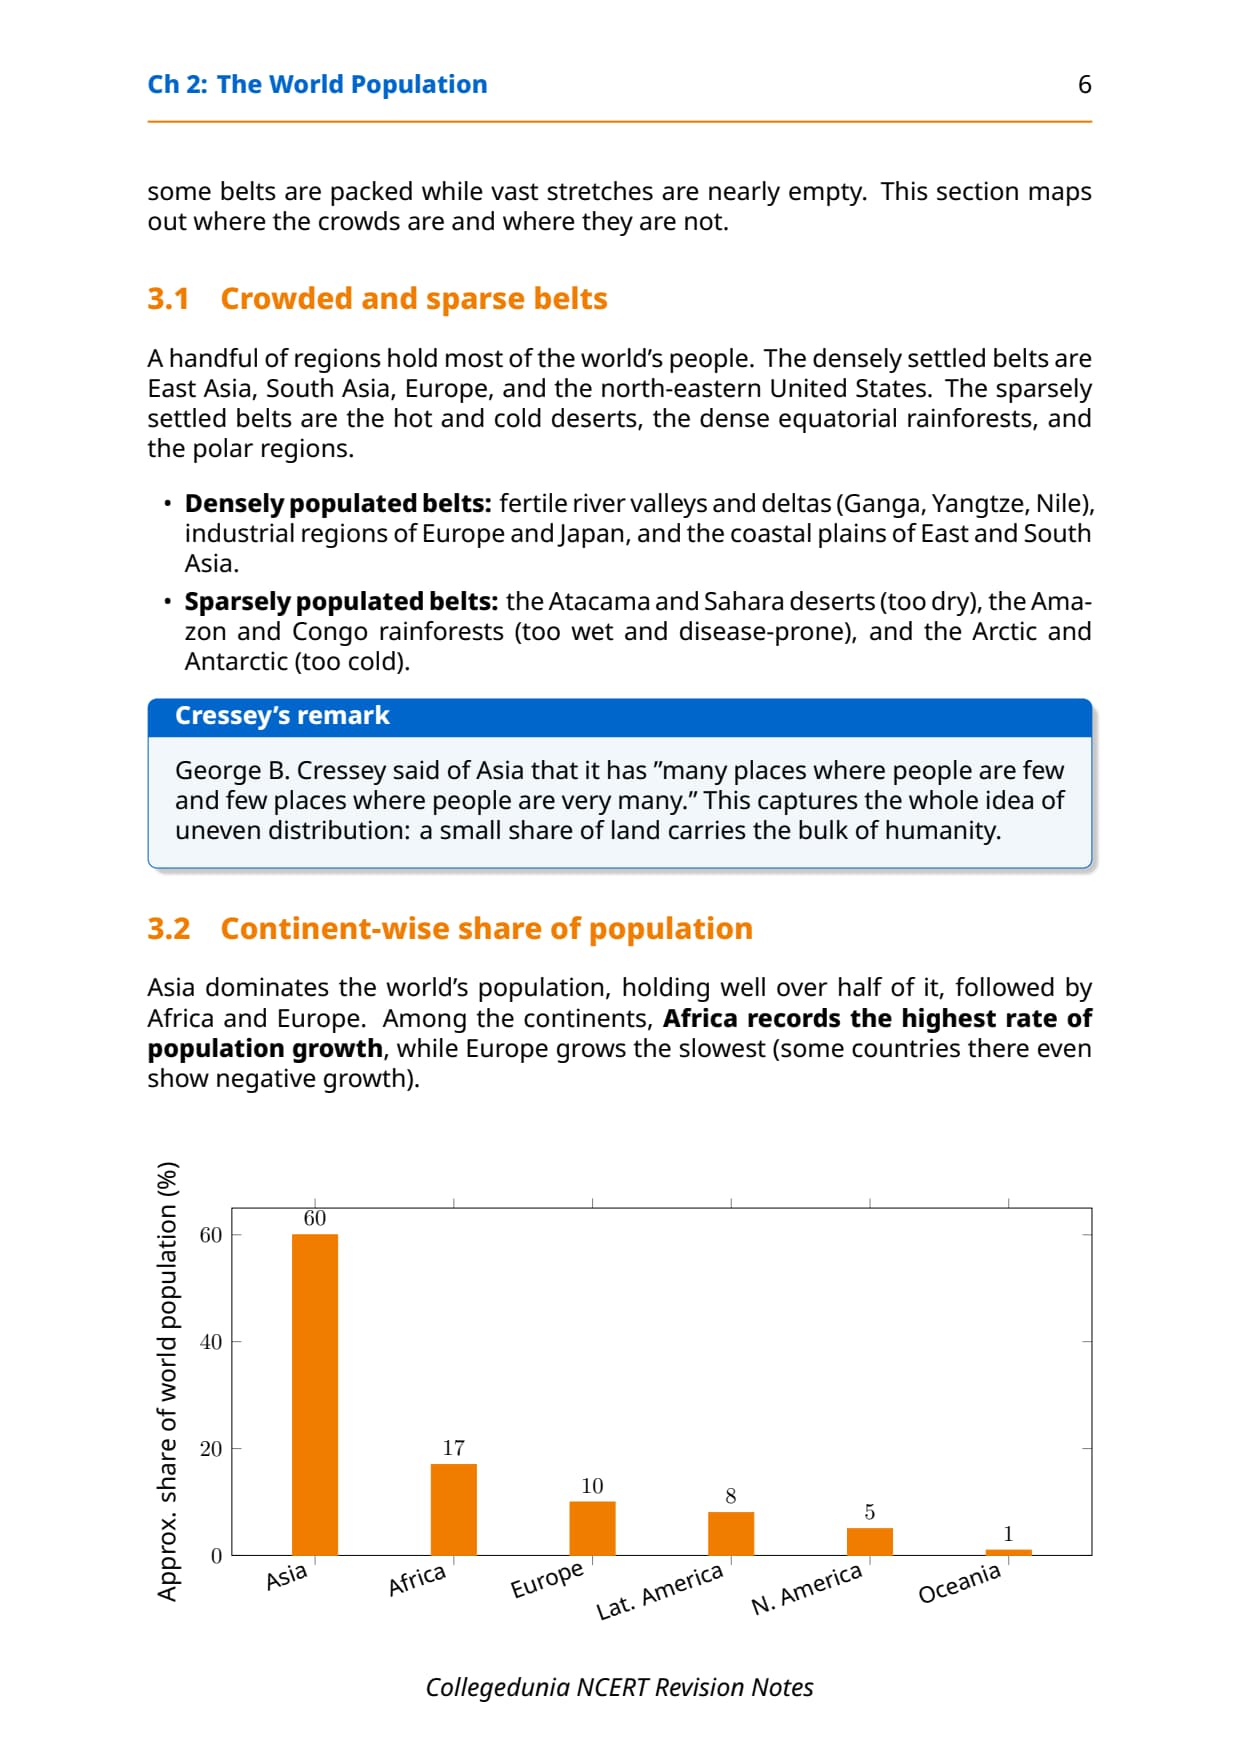
The world population crossed 6 billion at the start of the 21st century and is distributed very unevenly: 90 per cent of people live on just 10 per cent of the land area. That single fact sets up every other concept in the chapter.
- Distribution: the 10 most populous countries hold about 60 per cent of people, 6 of them in Asia.
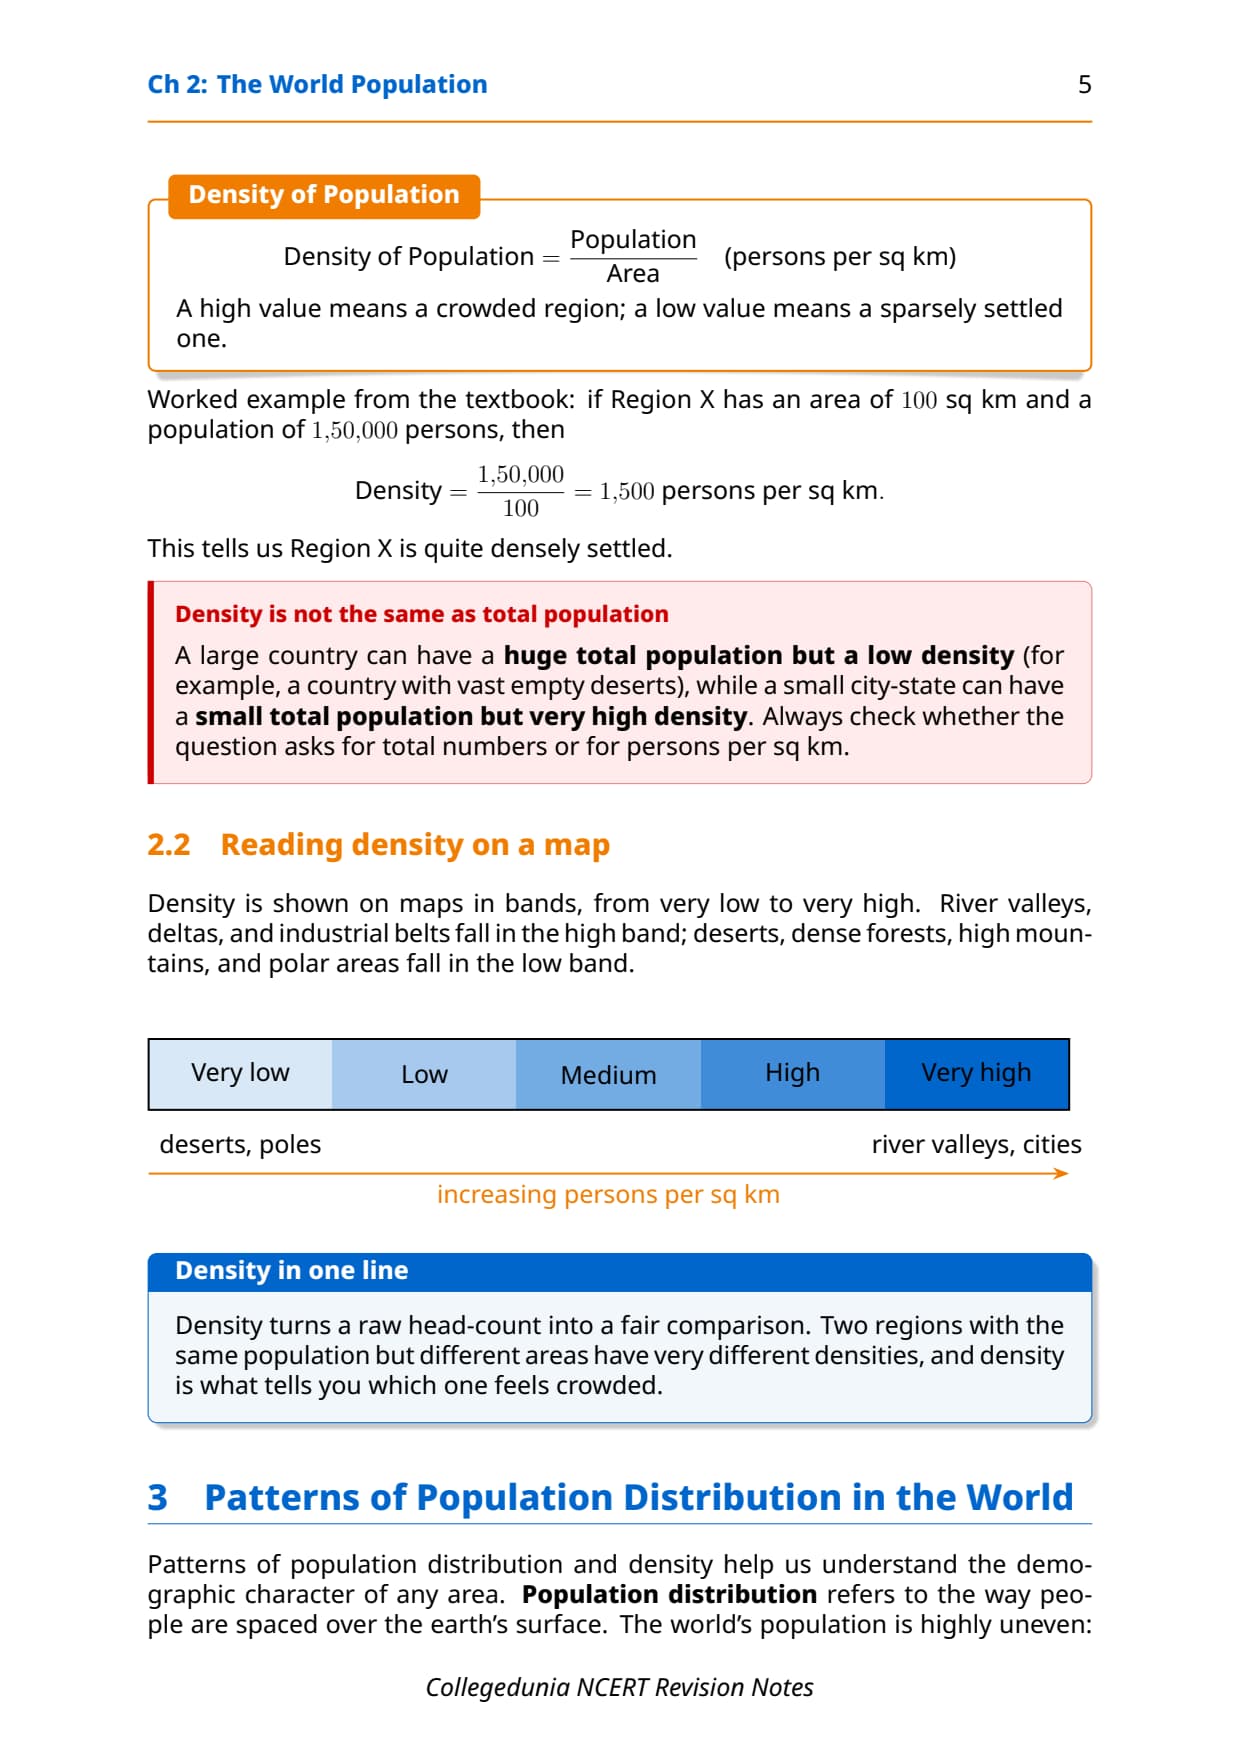
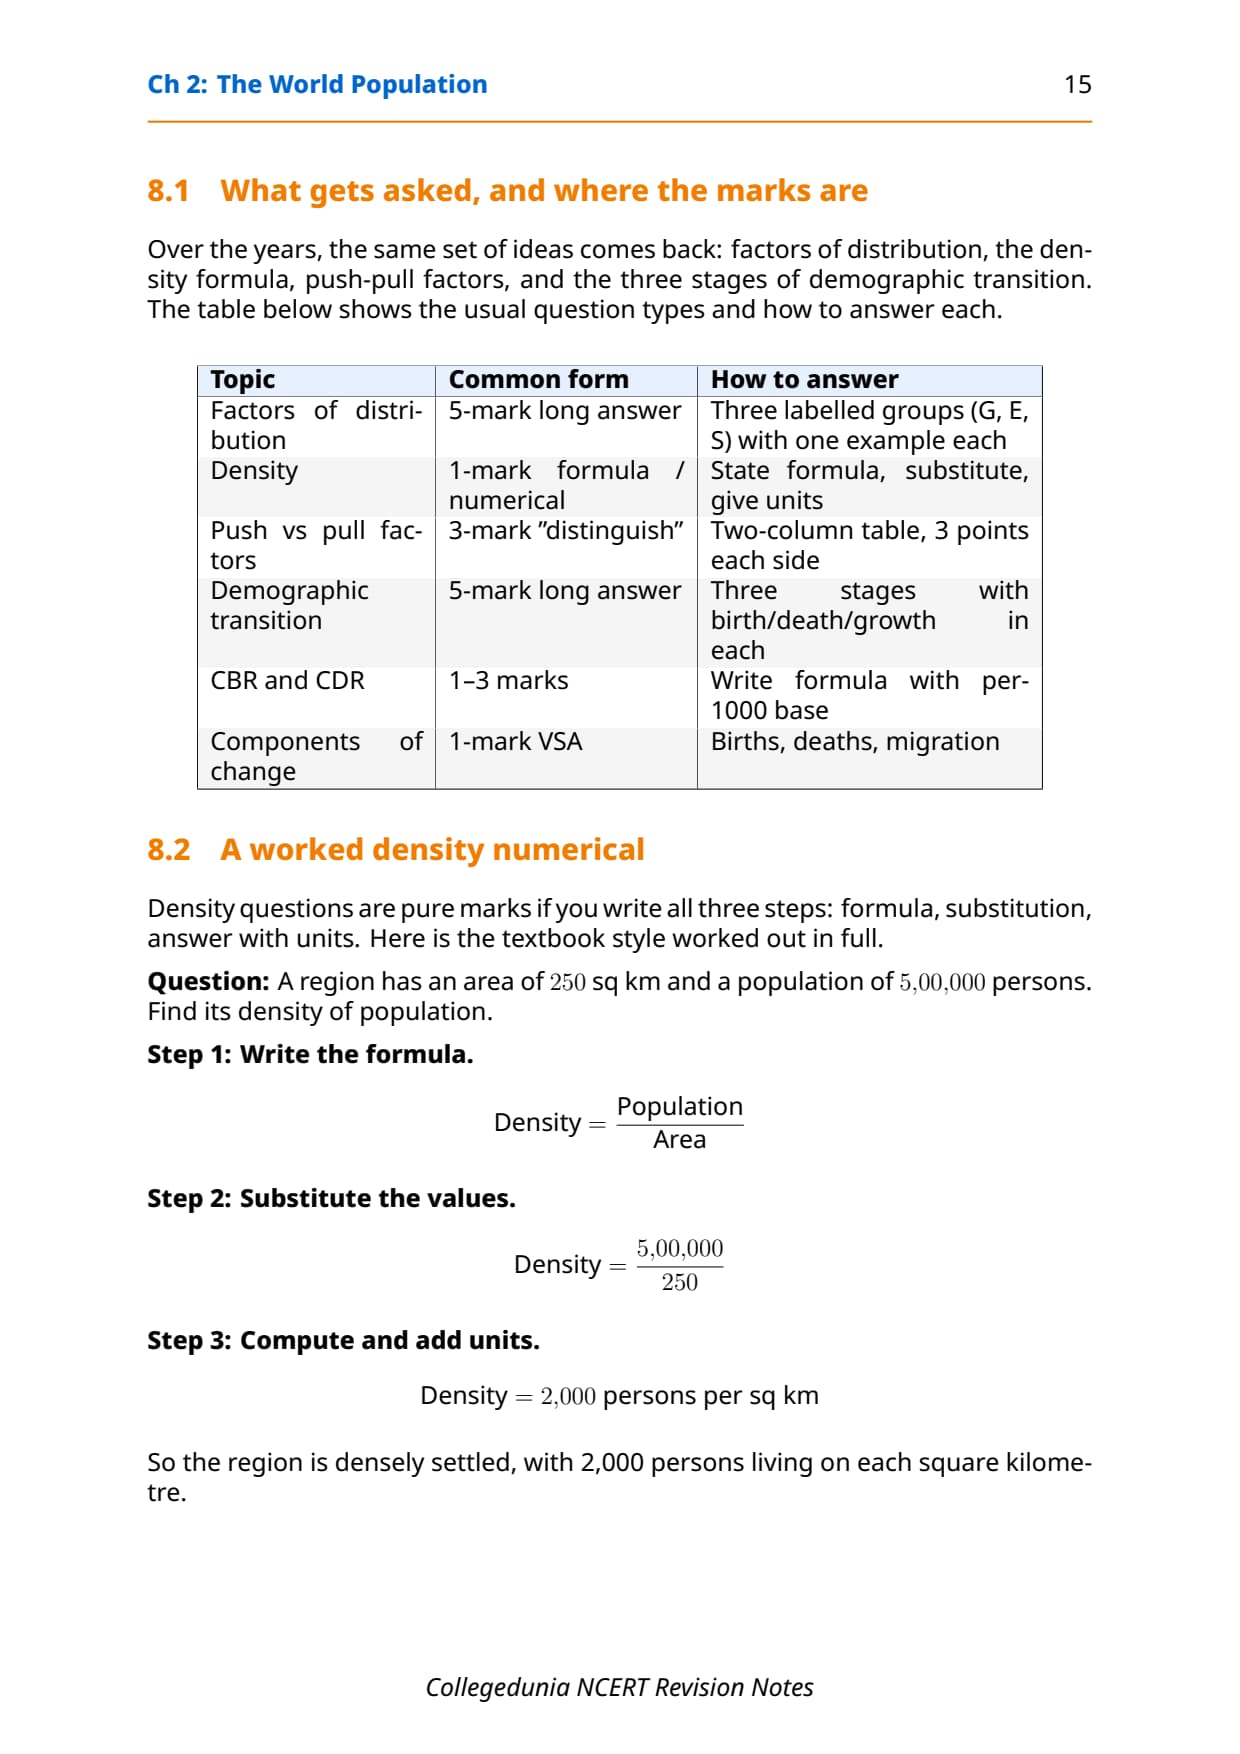
- Density: persons per sq km, i.e. total population divided by total area.
- Three components of change: births (CBR), deaths (CDR) and migration.
- Demographic transition: three stages from high births and deaths to low births and deaths.
Read these notes first, then use the NCERT Solutions for Chapter 2 for exercise practice.
Source: Humanities Wallah - Class 12th on YouTube
Key Definitions for World Population Class 12 Notes
Every theory question begins with a definition. The one-liners below are written in the exact form CBSE markers expect.
| Term | One-line definition | NCERT chapter pointer |
|---|---|---|
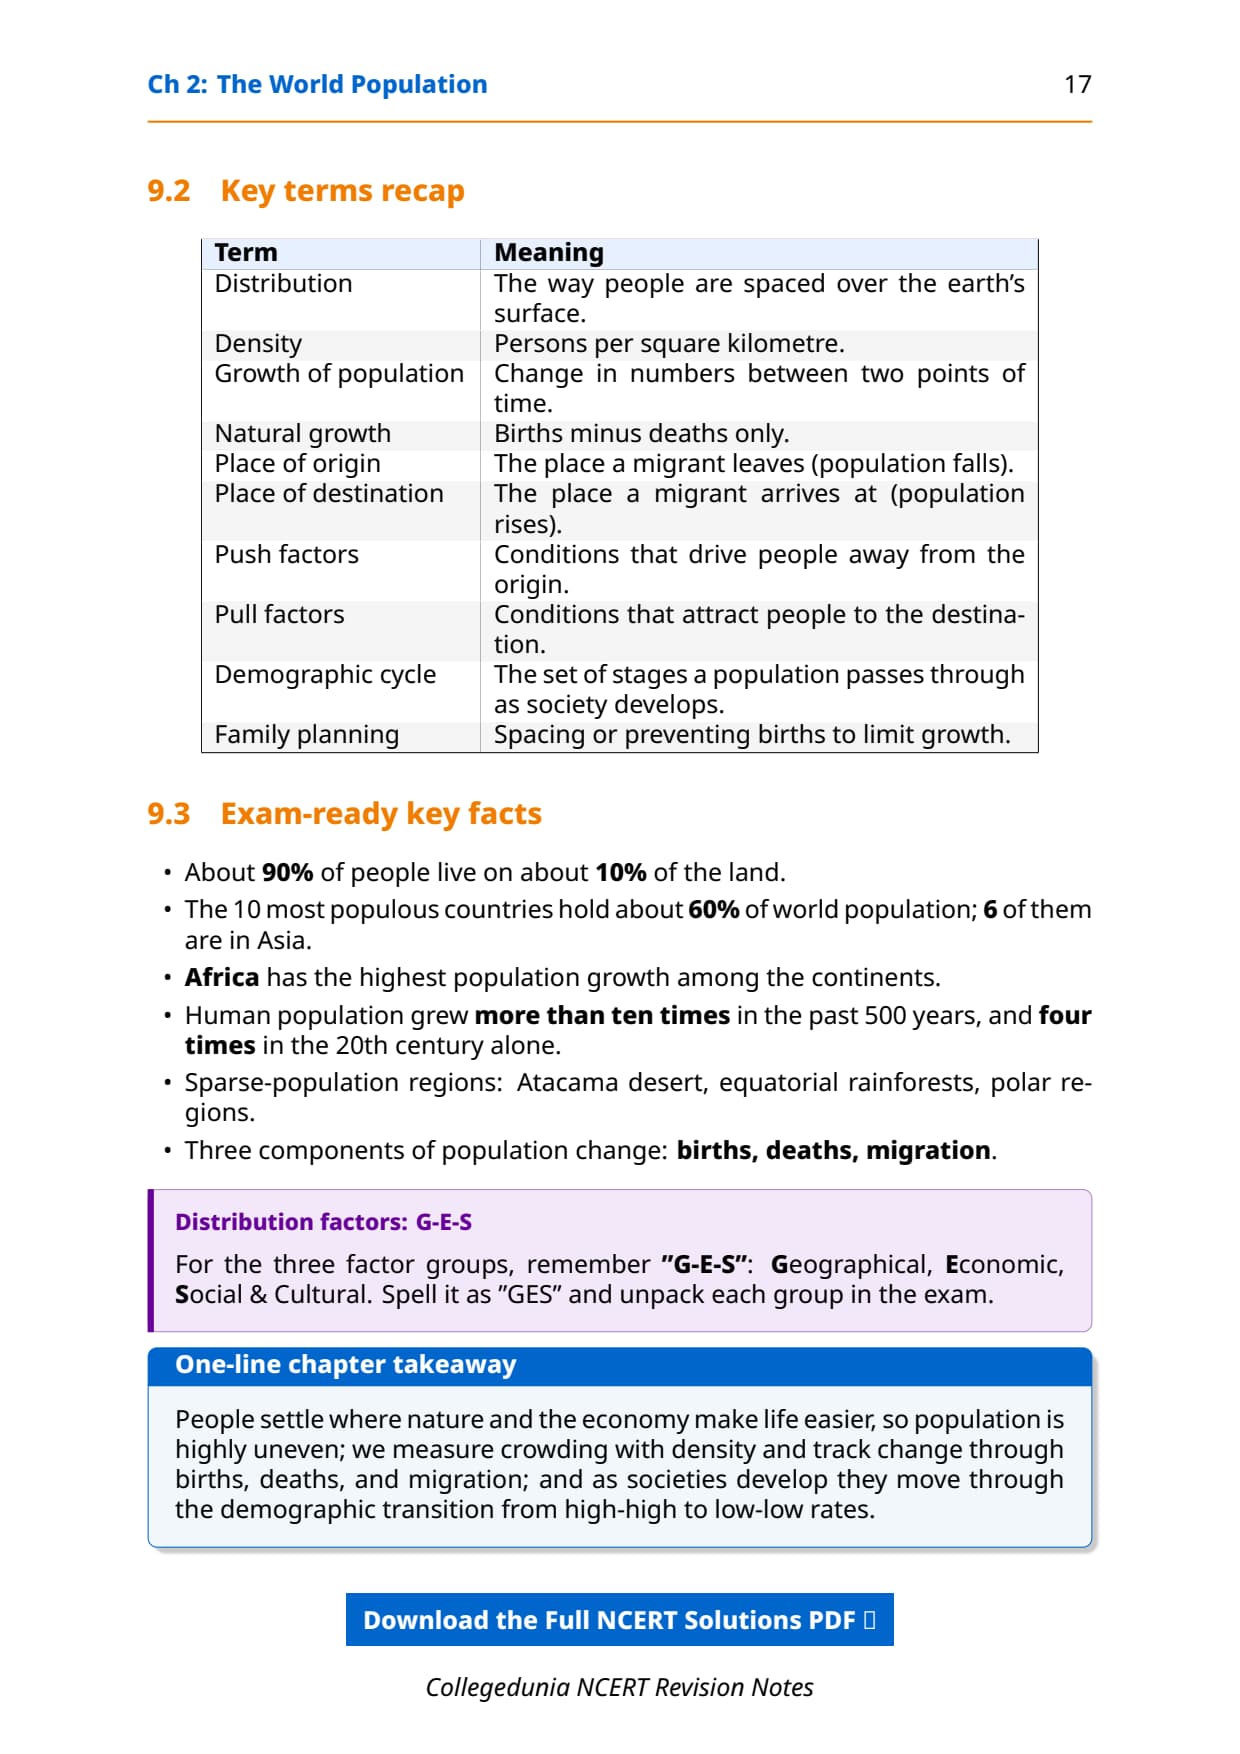
| Population Distribution | The way people are spaced over the earth's surface; broadly, 90% of world population lives on 10% of land area. | Section 2.1 |
| Density of Population | The ratio of the number of people to the size of land, usually measured in persons per sq km (Population divided by Area). | Section 2.1 |
| Population Growth | The change in number of inhabitants of a territory during a specific period of time, expressed as absolute numbers or percentage. | Section 2.2 |
| Natural Growth of Population | Population increase due to the difference between births and deaths (Natural Growth = Births minus Deaths). | Section 2.2 |
| Actual Growth of Population | Births minus Deaths plus In-Migration minus Out-Migration; total real change in population size. | Section 2.2 |
| Crude Birth Rate (CBR) | Number of live births per thousand of population per year; CBR = (B / P) x 1000. | Section 2.2 |
| Crude Death Rate (CDR) | Number of deaths per thousand of population per year; CDR = (D / P) x 1000. | Section 2.2 |
| Immigration | Migrants who move into a new place are called immigrants; the destination records a population increase. | Section 2.2 |
| Emigration | Migrants who move out of a place are called emigrants; the origin records a population decrease. | Section 2.2 |
| Demographic Transition | The shift from high birth and death rates to low birth and death rates as society moves from rural-agrarian to urban-industrial-literate. | Section 2.3 |
These ten definitions cover roughly 8 of the 10 one-mark and 3-mark theory questions CBSE has asked since 2021. Write them out once on paper before moving on.
Factors Influencing Distribution and Density of Population
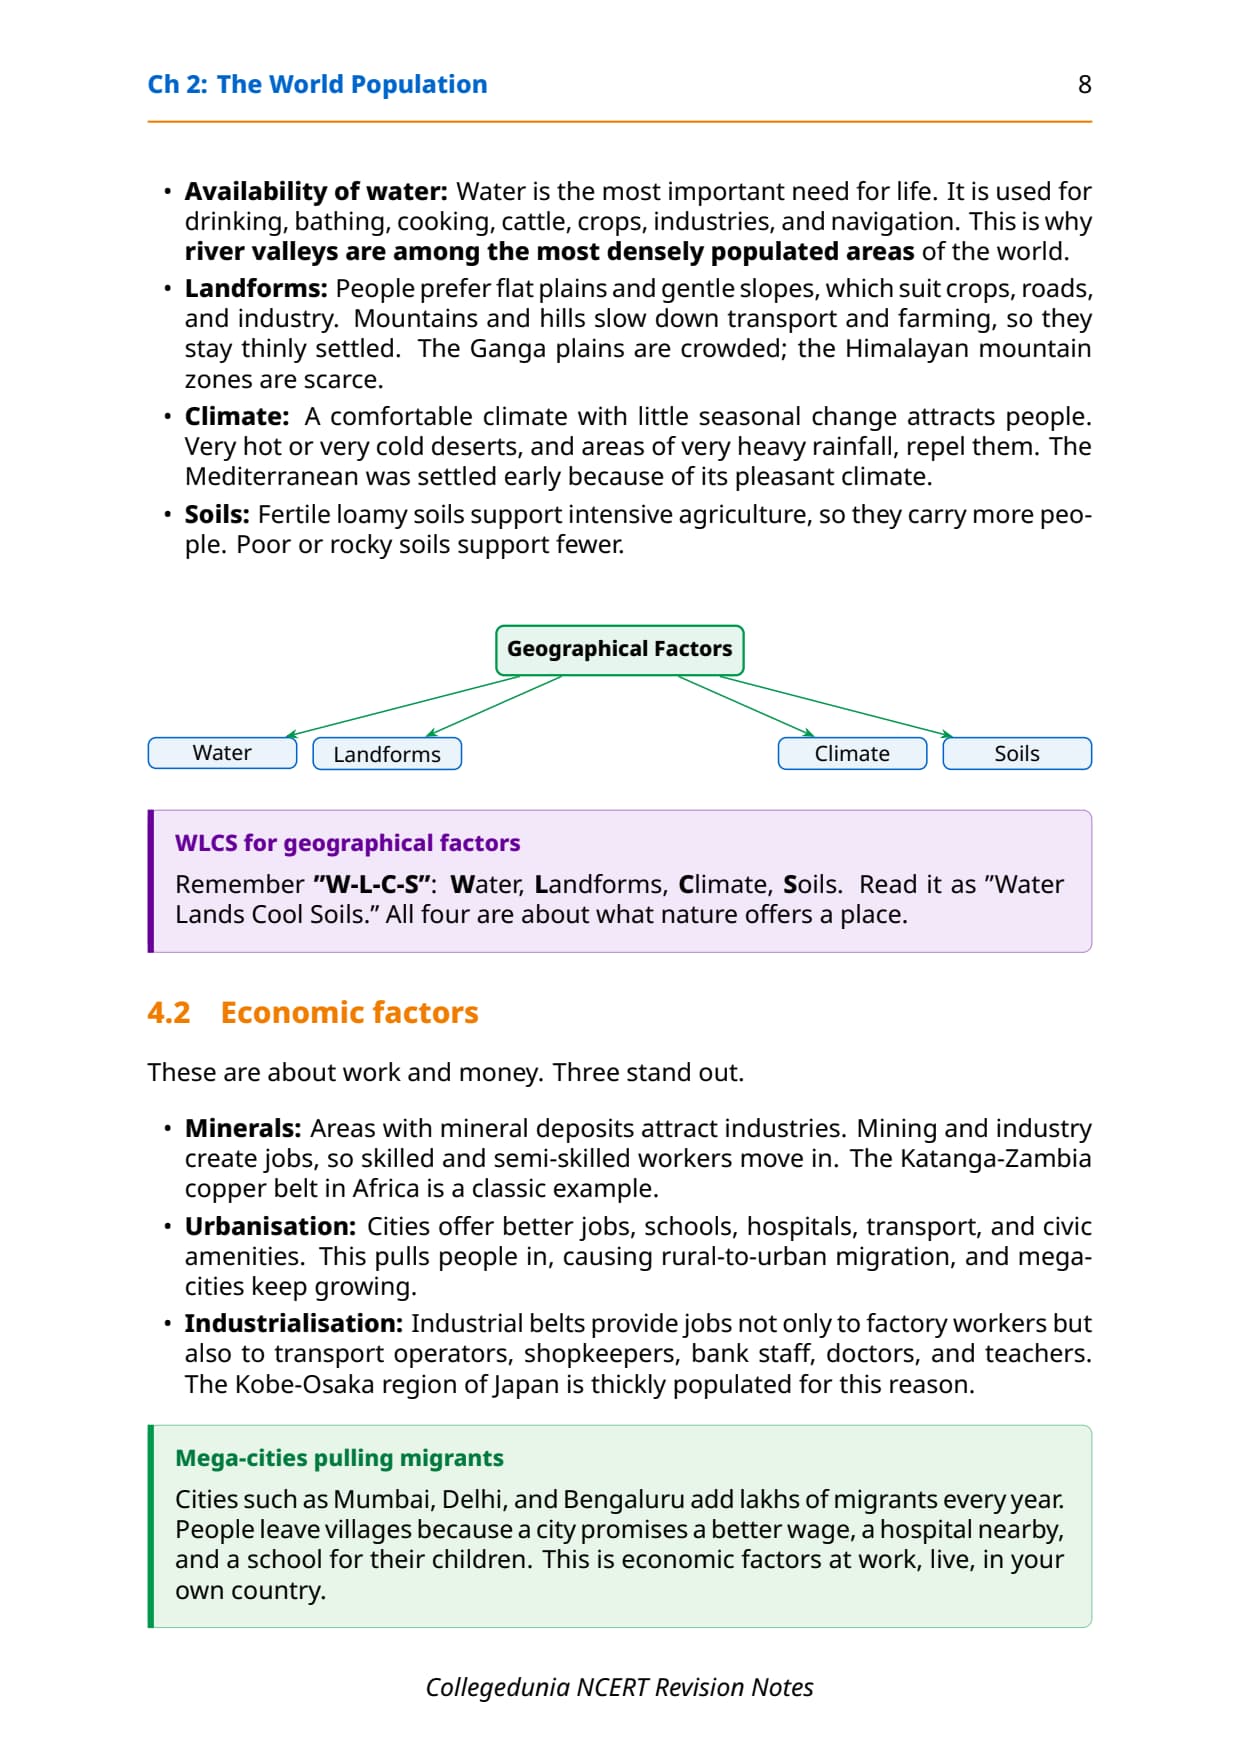
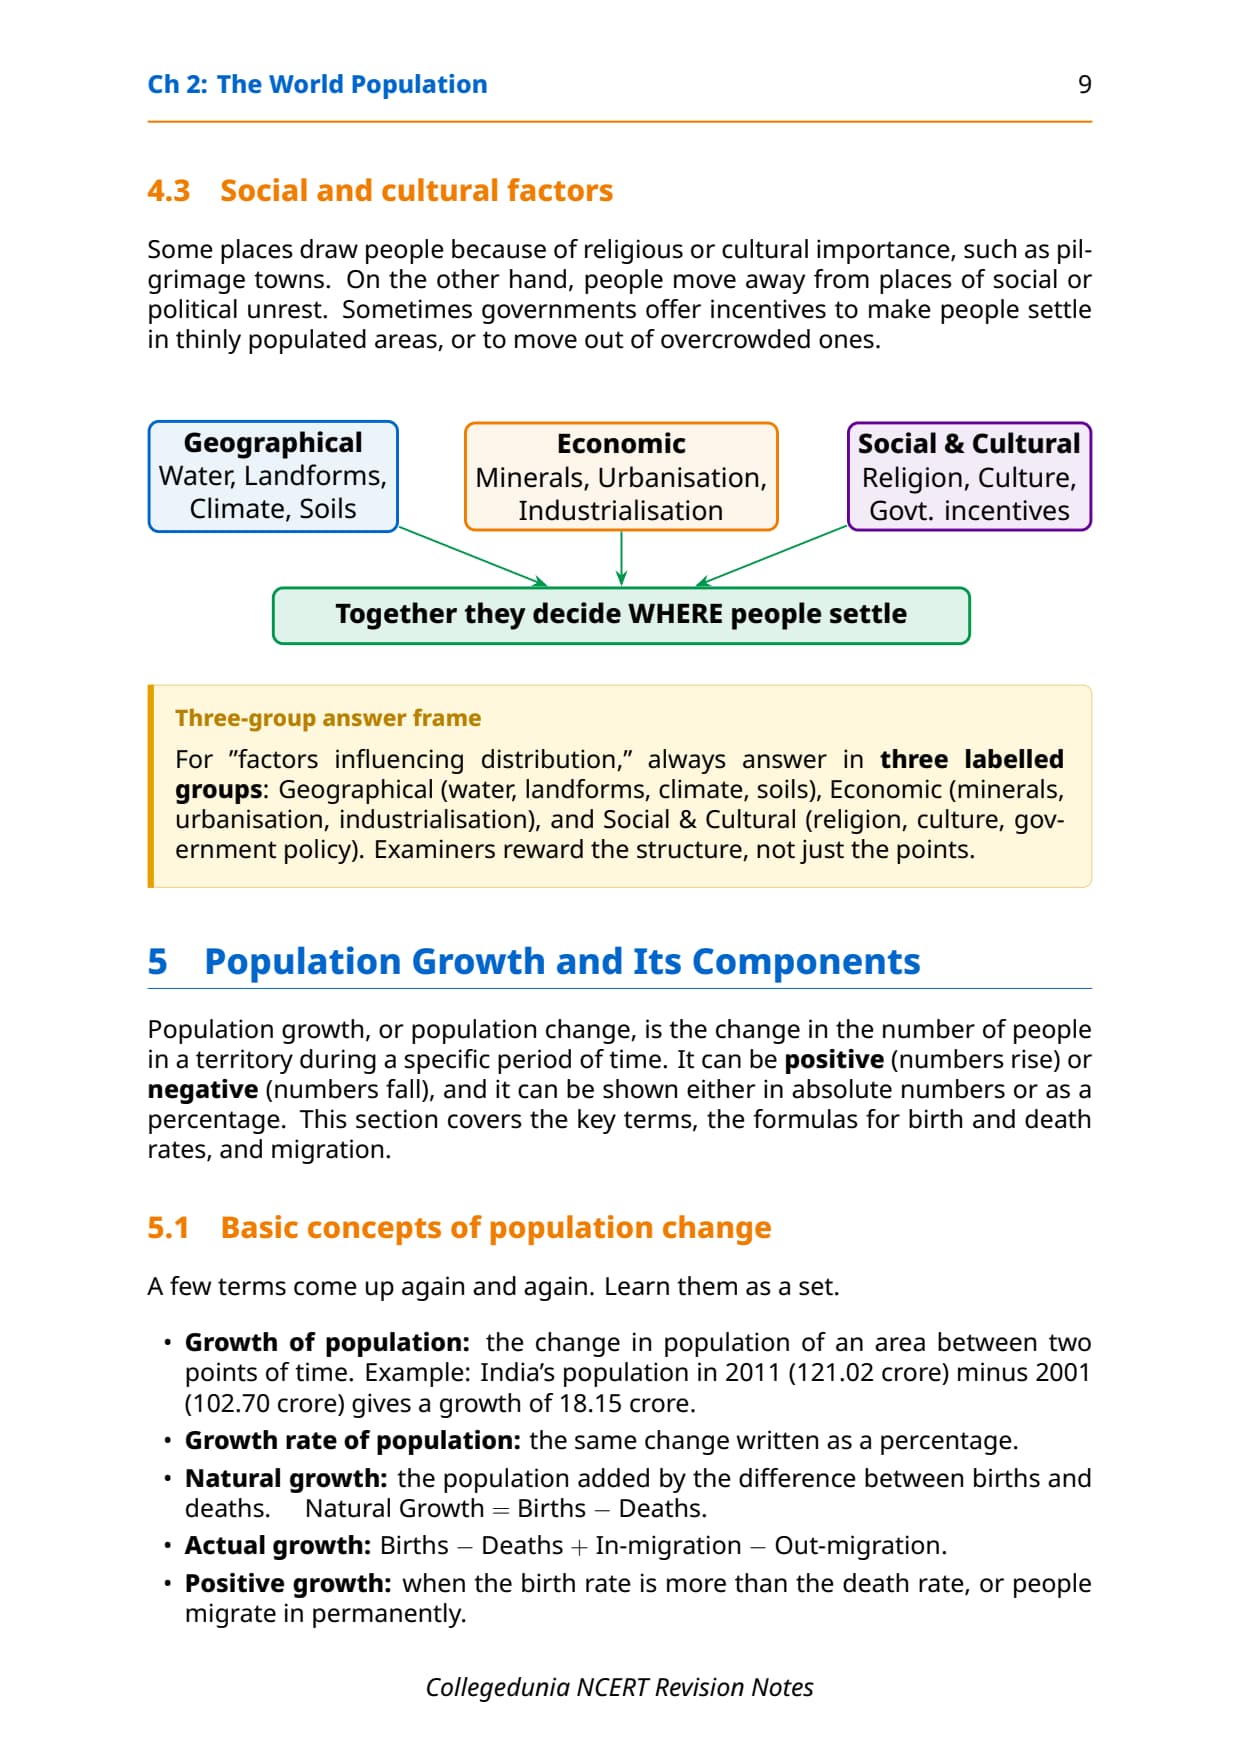
NCERT groups the factors that control where people live into three sets: geographical, economic, and social-cultural. Students should know at least two examples under each heading.
Geographical Factors
- Availability of water: river valleys like the Ganga plains are densely populated because water is reliable year-round.
- Landforms: flat plains draw large populations; mountains like the Himalayas stay sparse.
- Climate: extreme cold, heat or heavy rain drive people away; the mild Mediterranean has been densely inhabited since ancient times.
- Soils: fertile loamy soils support intensive farming and large rural populations.
Economic Factors
- Minerals: deposits attract mining and industry, and workers follow the jobs. The Katanga-Zambia copper belt is the NCERT example.
- Urbanisation: cities offer better jobs, education, healthcare and transport, swelling mega-cities through rural-to-urban migration.
- Industrialisation: factory belts pull in workers plus doctors, teachers and bankers. Japan's Kobe-Osaka region is the NCERT example.
Social and Cultural Factors
Religious and cultural significance draws pilgrims and settlers, while social and political unrest pushes people out. Government incentives can also shift population toward or away from an area.
Memory hook: Geography sets the base, Economics builds on it, Social-Cultural factors fine-tune it. In a 5-mark question, give one example from each group for full marks.
Components of Population Change: CBR, CDR and Migration
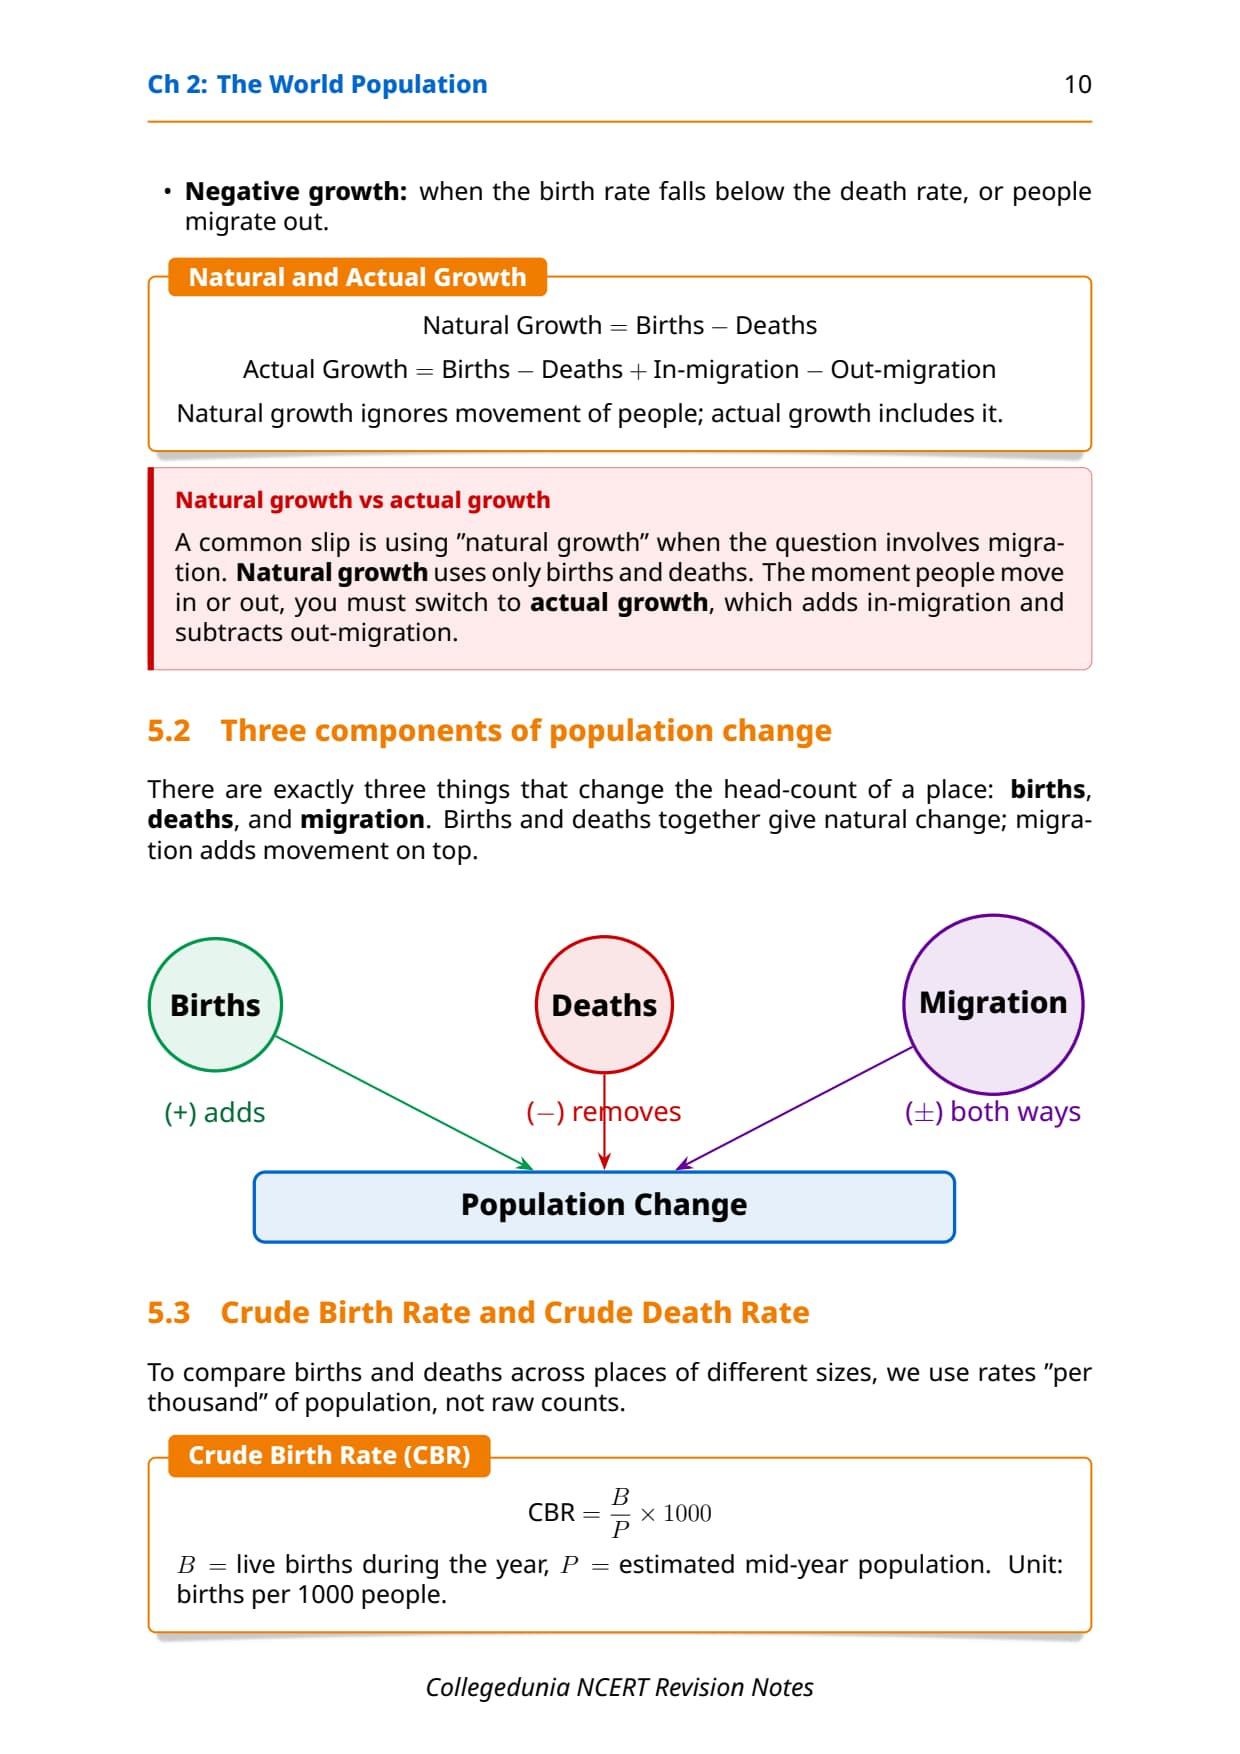
Population change depends on three components only: births, deaths and migration.
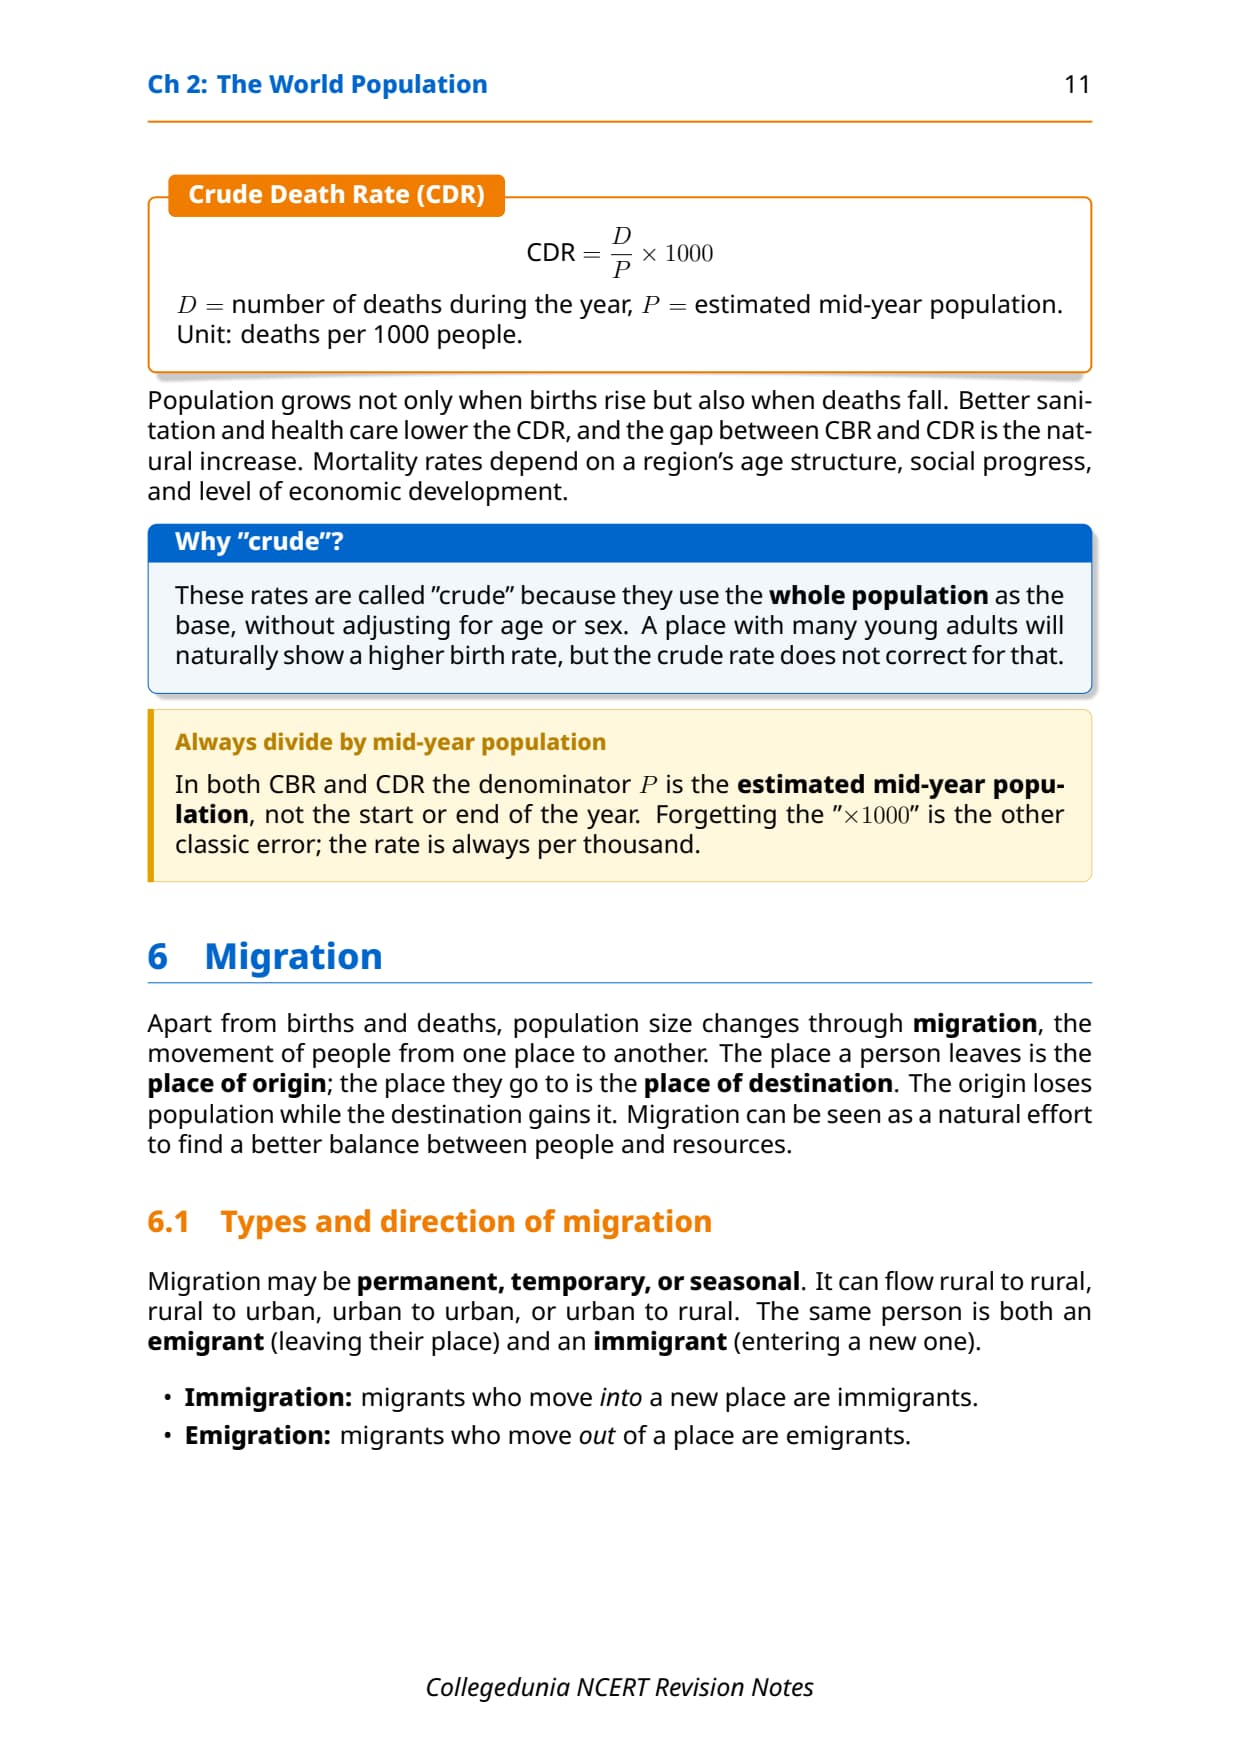
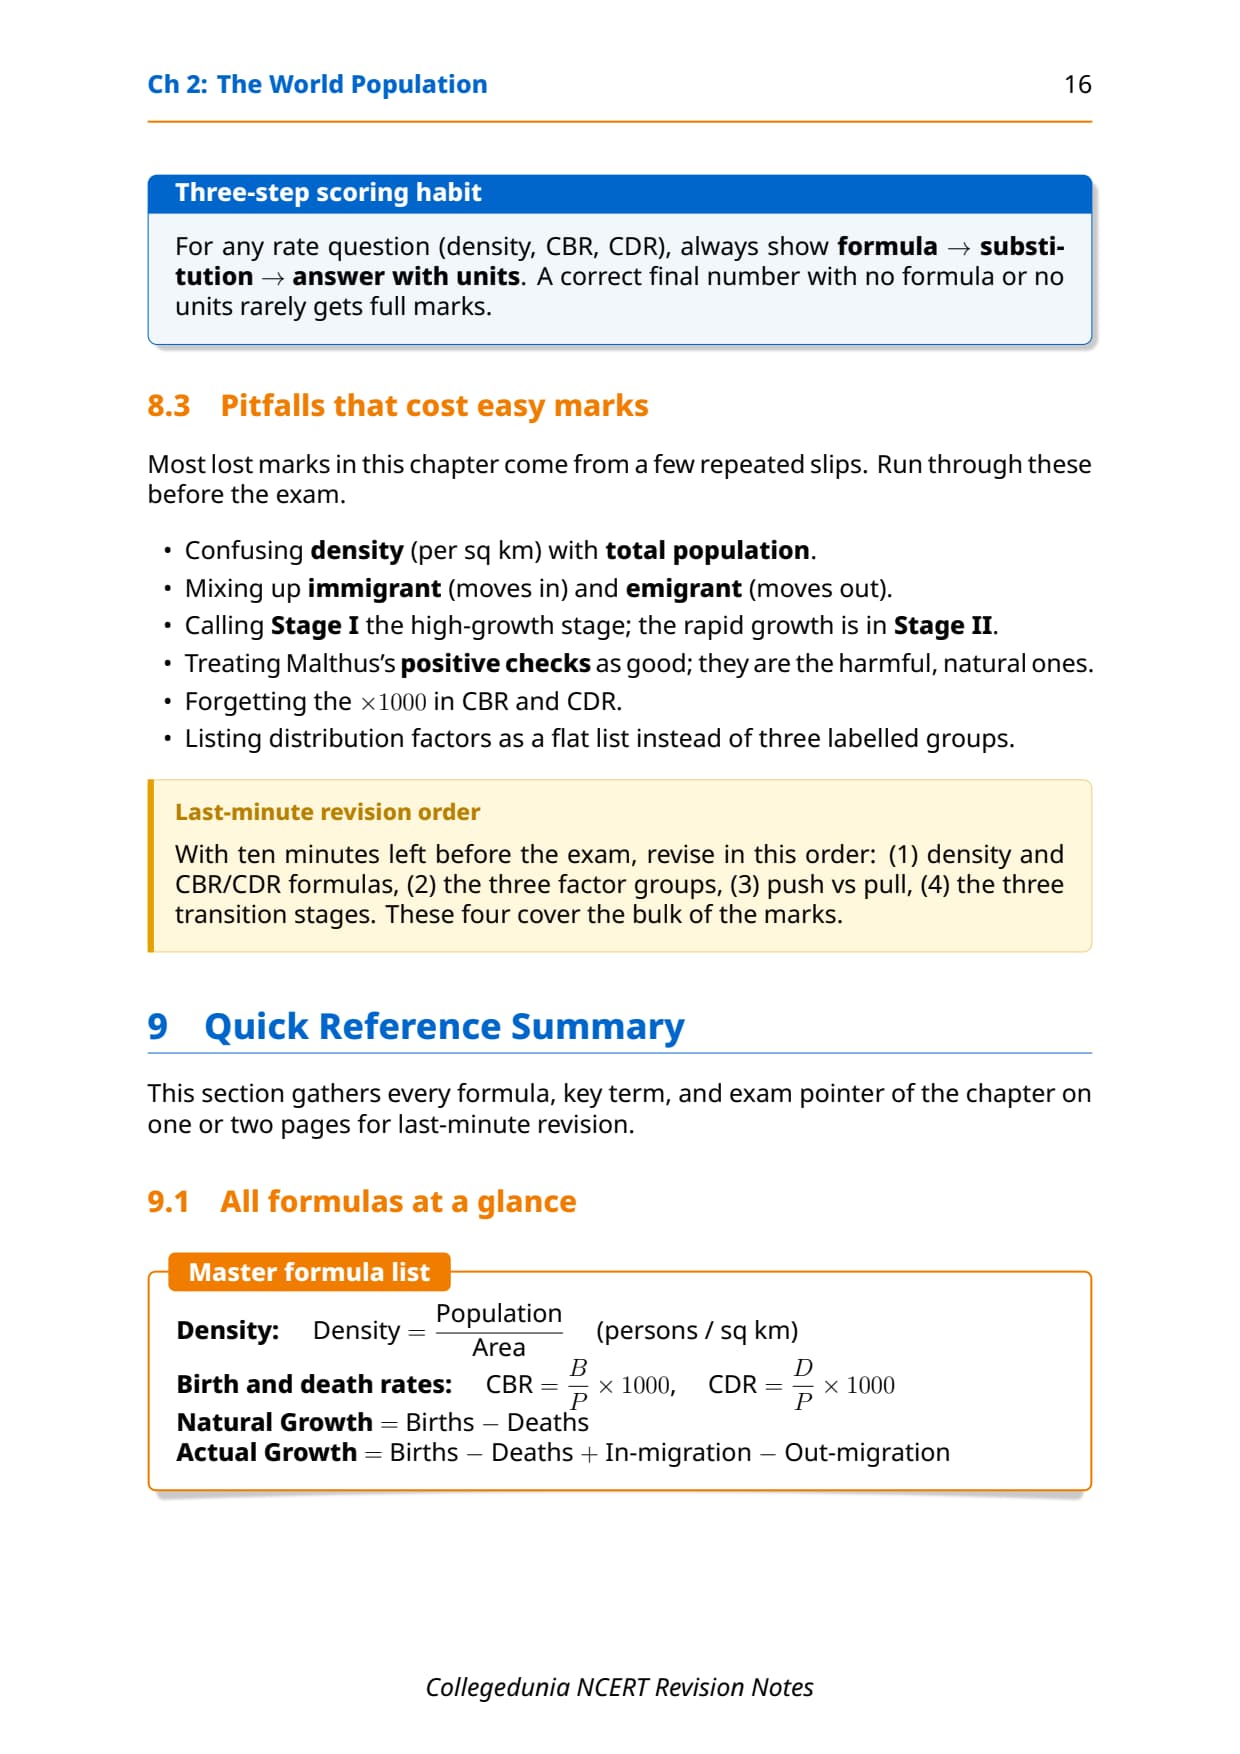
CBR = (B / P) x 1000 is live births per thousand people in a year (P = mid-year population). A high CBR, common in Stage 1, keeps population growing even when deaths are high.
CDR = (D / P) x 1000 is deaths per thousand people. CDR falls sharply when sanitation, healthcare and nutrition improve, triggering the Stage 2 boom.
Migration is the third component: the origin records a decrease and the destination an increase. It may be permanent, temporary or seasonal, and internal or international.
| Component | Formula | Direction of effect |
|---|---|---|
| Crude Birth Rate | CBR = (Births / Mid-year Population) x 1000 | Increases population |
| Crude Death Rate | CDR = (Deaths / Mid-year Population) x 1000 | Decreases population |
| Natural Growth | Births minus Deaths | Positive if CBR > CDR |
| Actual Growth | Births - Deaths + In-Migration - Out-Migration | Total net change |
| In-Migration | People arriving at destination | Increases destination population |
| Out-Migration | People leaving place of origin | Decreases origin population |
Tip: Natural growth ignores migration; actual growth includes it. Students who mix these up lose 2 marks on an easy question.
Push and Pull Factors of Migration
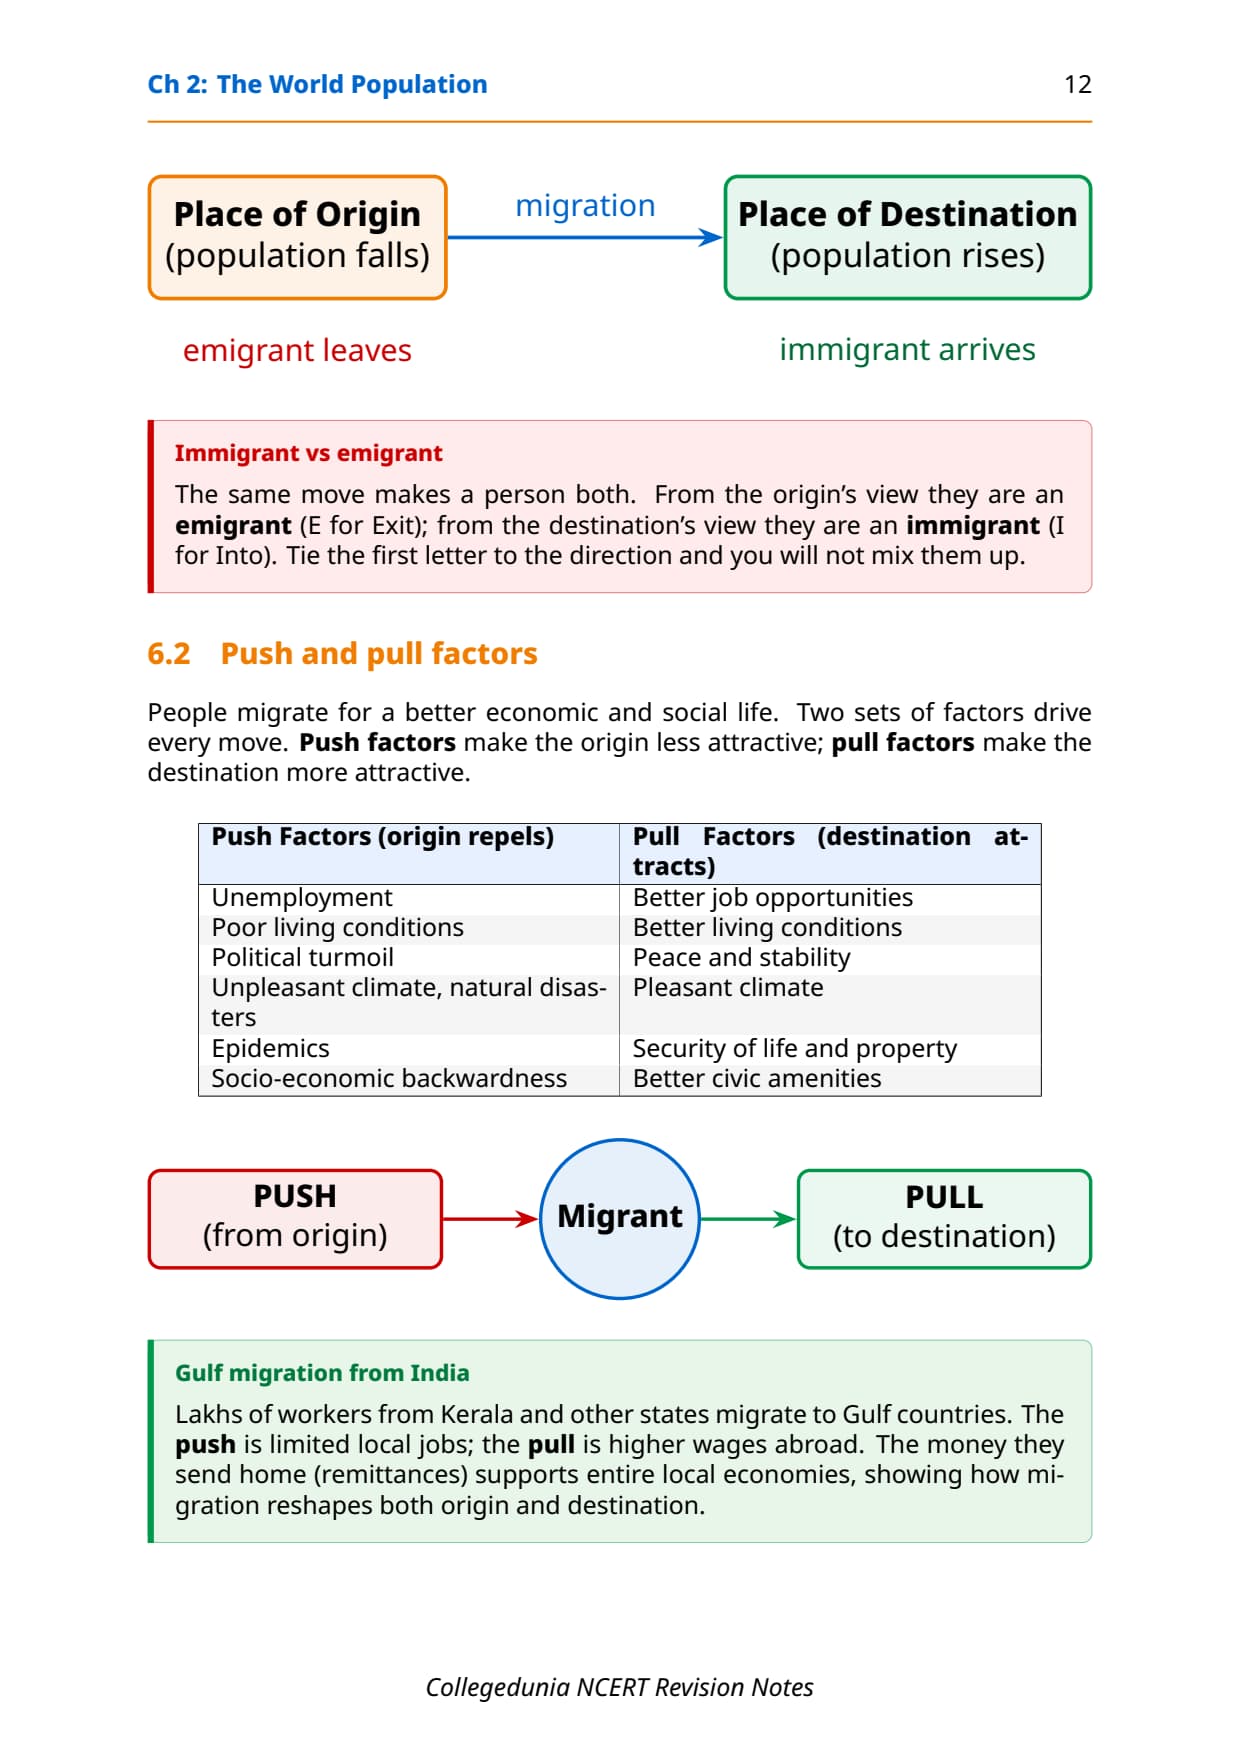
NCERT uses a two-factor model: push factors make the origin less attractive, pull factors make the destination more attractive. The combination triggers the move.
| Push Factors (Origin) | Pull Factors (Destination) |
|---|---|
| Unemployment and lack of job opportunities | Better job opportunities and higher wages |
| Poor living conditions and low income | Higher standard of living |
| Political turmoil, conflict or instability | Peace, stability and security of life |
| Unpleasant or harsh climate | Pleasant and comfortable climate |
| Natural disasters, floods and droughts | Lower risk of natural hazards |
| Epidemics and poor healthcare access | Better medical and educational facilities |
| Socio-economic backwardness | Urban infrastructure and civic amenities |
Note that better medical and educational facilities are a pull factor, not a push factor. This is the standard MCQ trap ("which is not a push factor?"), since these attract people to a destination rather than drive them away.
Three Stages of Demographic Transition Theory
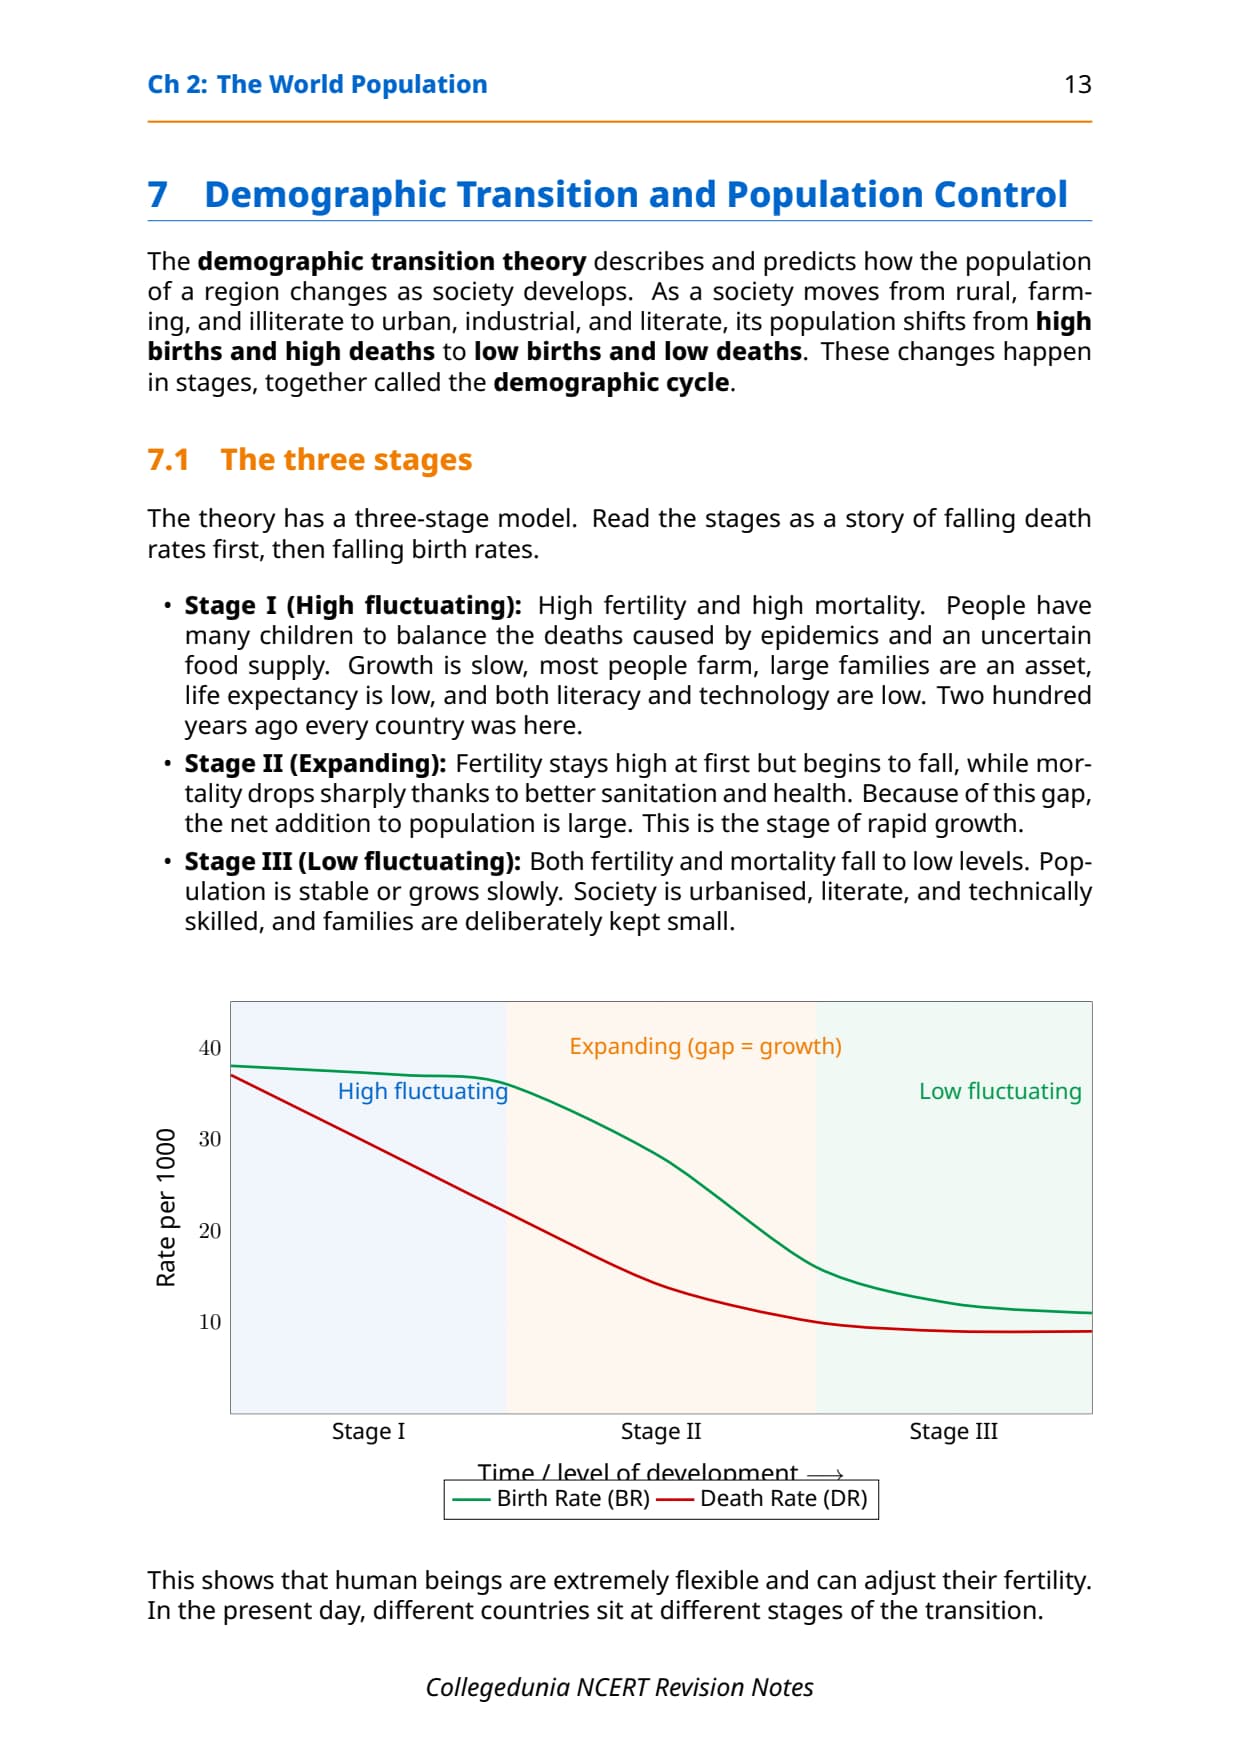
This theory explains how birth and death rates change as a society moves from rural-agrarian to urban-industrial-literate. CBSE sets a 5-mark question on it almost every year.
Stage 1: High Fluctuating
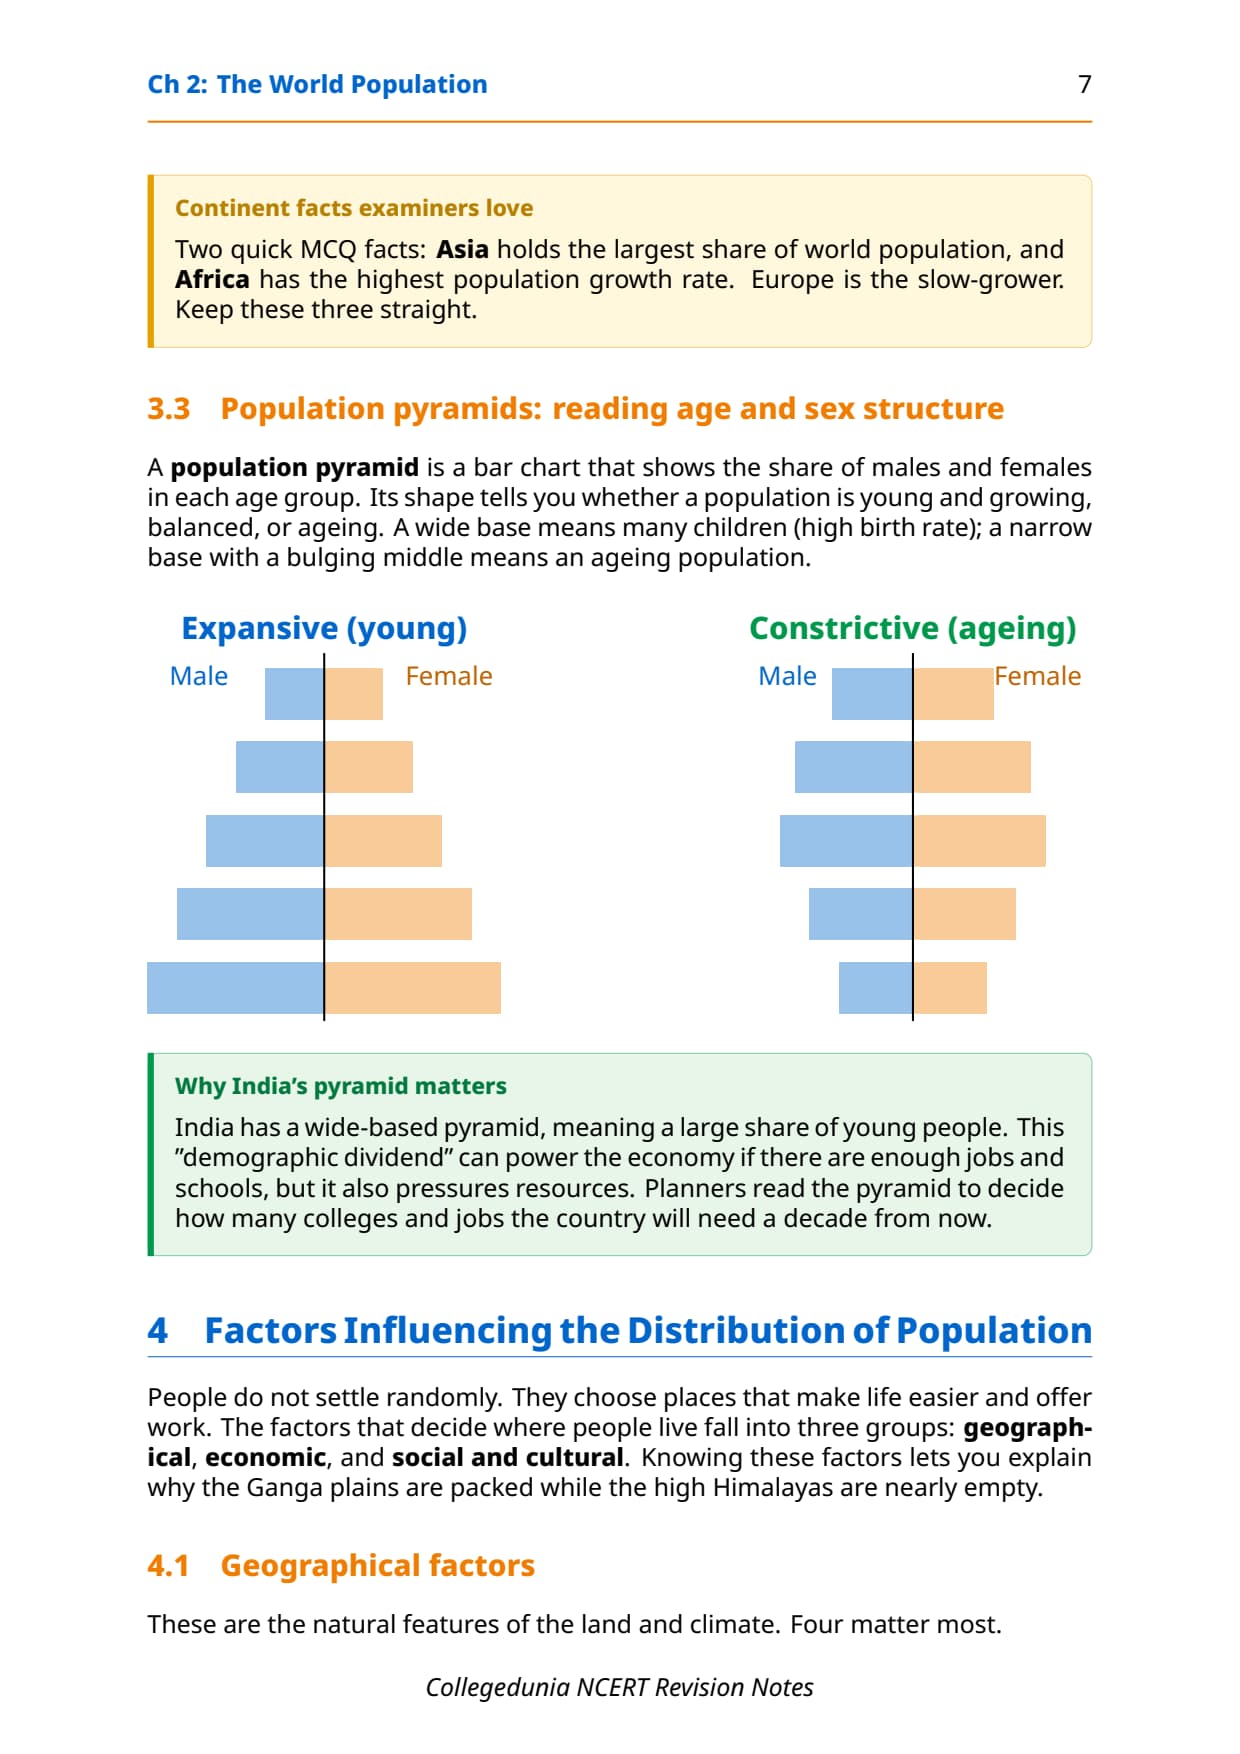
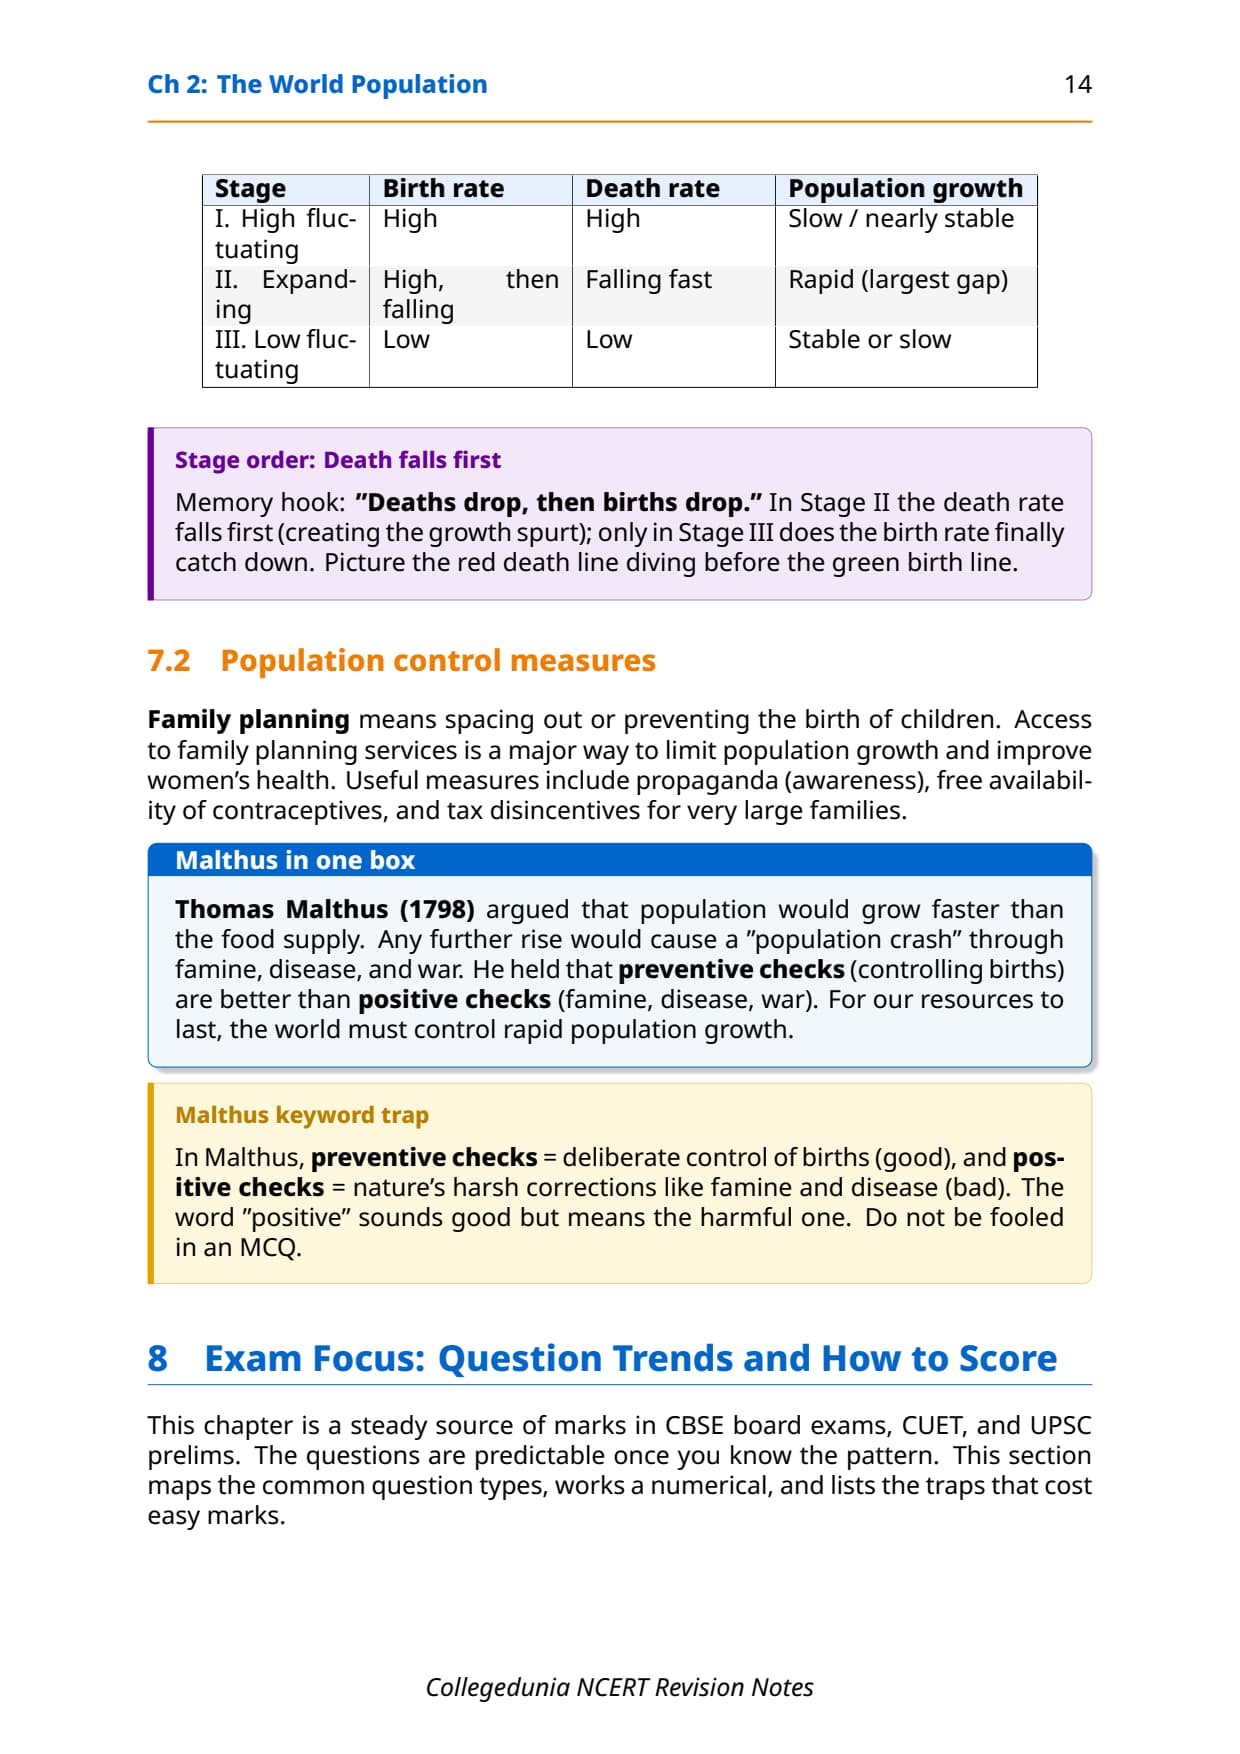
Both birth and death rates are high and fluctuate with famines, epidemics and wars, so population grows very slowly. High CBR (children valued as labour) and high CDR (poor sanitation and healthcare) cancel out, giving minimal natural increase. This fits pre-industrial societies.
Stage 2: Early Expanding (Population Explosion)
Birth rate stays high but death rate falls sharply as sanitation, healthcare and food improve. The widening gap gives a large natural increase, so net addition peaks here. Bangladesh and Kenya are cited examples.
Stage 3: Low Fluctuating
Both rates fall to low levels, so population is stable or grows slowly. Urbanisation, female literacy and deliberate family planning bring CBR down to match the low CDR. Canada, Japan and the USA are in this stage; some European countries have negative growth.
Common mistake: In Stage 1 both rates are high; in Stage 2 CDR falls first while CBR stays high. The biggest population addition happens in Stage 2, not Stage 1.
Population Control Measures and Malthus Theory
Family planning is the spacing or preventing of births. NCERT lists three government measures: awareness campaigns, free contraceptives, and tax disincentives for large families.
Thomas Malthus and Population Theory
Malthus argued in 1798 that population grows geometrically (1, 2, 4, 8) while food grows only arithmetically (1, 2, 3, 4). Unchecked growth would crash into famine, disease or war (positive checks); he preferred preventive checks like delayed marriage. NCERT uses this to support population control.
CUET angle: Malthus comes up in CUET Domain Geography. Know the geometric vs arithmetic distinction, the two types of checks, and the year 1798.
Previous Year Question Trends from World Population Class 12
The table below maps what CBSE has asked over the last five years so students can target revision.
| Year | Question type asked | Marks | Notes section to revise |
|---|---|---|---|
| 2025 | Distinguish push and pull factors of migration with examples | 5 | Push and Pull Factors section |
| 2024 | Explain three stages of demographic transition with diagram | 5 | Demographic Transition section |
| 2023 | Define density of population + factors influencing distribution (2+3) | 5 | Key Definitions + Factors section |
| 2022 | Distinguish CBR and CDR + MCQ on push factors | 3 + 1 | Components of Change section |
| 2021 | Explain geographical factors of population distribution + natural growth formula | 5 + 2 | Factors section + Key Definitions |
The chapter carries roughly 8 to 10 marks per year, most of it from push-pull factors and demographic transition.
Other Resources for Class 12 Geography Chapter 2 World Population
Pair these notes with the NCERT Solutions, Handwritten Notes and NCERT Book PDF below.
| Resource | What it covers | Open |
|---|---|---|
| Notes | Concept-first revision notes covering definitions, factors, CBR/CDR, push-pull factors, demographic transition and population control. | You are here |
| NCERT Solutions | Step-by-step answers to all exercise questions with Expert's Solution for every 5-mark answer. | Class 12 Geography Chapter 2 NCERT Solutions |
| Handwritten Notes | Topper's handwritten revision pages for last-minute board exam practice. | Class 12 Geography Chapter 2 Handwritten Notes |
| NCERT Book PDF | Official NCERT Fundamentals of Human Geography Chapter 2 textbook in PDF form. | Class 12 Geography Chapter 2 NCERT Book PDF |
| Subject Hub | All chapters of Class 12 Geography with every resource in one place. | Class 12 Geography Subject Hub |
All Chapters Notes for Class 12 Geography Fundamentals of Human Geography
Related Links: Notes for the other chapters of Class 12 Fundamentals of Human Geography.
| Chapter | Topic | Notes link |
|---|---|---|
| Chapter 1 | Human Geography: Nature and Scope | Class 12 Geography Chapter 1 Notes |
| Chapter 2 | The World Population: Distribution, Density and Growth | You are here |
| Chapter 3 | Human Development | Class 12 Geography Chapter 3 Human Development Notes |
| Chapter 4 | Primary Activities | Class 12 Geography Chapter 4 Primary Activities Notes |
| Chapter 5 | Secondary Activities | Class 12 Geography Chapter 5 Secondary Activities Notes |
| Chapter 6 | Tertiary and Quaternary Activities | Coming soon |
| Chapter 7 | Transport and Communication | Coming soon |
| Chapter 8 | International Trade | Coming soon |
NCERT Notes Class 12 Geography Chapter 2 World Population FAQs
Ques. What does the world population distribution density and growth Class 12 chapter cover?
Ans. The chapter covers how the world's population of over 6 billion is distributed unevenly across the earth's surface, why 90 per cent of people live on just 10 per cent of the land, how density of population is measured (persons per sq km), the geographical, economic and social factors that explain where people settle, the three components of population change (CBR, CDR, migration), push and pull factors of migration, the three stages of demographic transition theory, and population control measures including the Malthus theory of population.
Ques. What is the formula for density of population in Class 12 Geography?
Ans. The formula for density of population in Class 12 Geography is: Density = Population divided by Area, measured in persons per square kilometre. For example, if a region has an area of 100 sq km and a population of 1,50,000 persons, the density is 1,50,000 divided by 100, which equals 1,500 persons per sq km. This is the first formula in the NCERT chapter and one of the most commonly asked in one-mark and two-mark CBSE questions.
Ques. What are the three components of population change in Class 12 Geography?
Ans. The three components of population change are births (measured by the Crude Birth Rate), deaths (measured by the Crude Death Rate) and migration. CBR = (Births / Mid-year Population) x 1000; CDR = (Deaths / Mid-year Population) x 1000. Natural growth = Births minus Deaths. Actual growth = Births minus Deaths plus In-Migration minus Out-Migration. Migration adds or subtracts from natural growth to give the total real change in population size. All three components are covered in Section 2 of the NCERT chapter.
Ques. What is the difference between push factors and pull factors of migration?
Ans. Push factors make the place of origin less attractive and force people to leave: unemployment, poor living conditions, political turmoil, natural disasters, epidemics and socio-economic backwardness. Pull factors make the place of destination more attractive and draw people in: better job opportunities, higher standard of living, peace and stability, pleasant climate and better medical and educational facilities. CBSE has tested the distinction between push and pull factors as a 3-mark and 5-mark question in recent board papers, and medical/educational facilities is the standard MCQ trap (it is a pull factor, not a push factor).
Ques. How many stages are there in the demographic transition theory?
Ans. There are three stages in the demographic transition theory. Stage 1 (High Fluctuating) has both high birth rate and high death rate, so population grows very slowly. Stage 2 (Early Expanding) has a still-high birth rate but a falling death rate due to better sanitation and healthcare, producing a large natural increase called the population explosion. Stage 3 (Low Fluctuating) has both low birth rate and low death rate as societies become urban, literate and industrialised; population is stable or even negative in some developed countries. This three-stage model is a 5-mark question staple in CBSE Class 12 Geography.
Ques. Which factors determine where people prefer to live in the world?
Ans. The NCERT chapter organises the factors into three groups. Geographical factors include water availability (river valleys like the Ganga plains are densely populated), landforms (flat plains attract more people than mountains), climate (Mediterranean regions have been inhabited since ancient times due to pleasant climate) and soil fertility (loamy soils support intensive agriculture). Economic factors include mineral deposits (Katanga-Zambia copper belt), urbanisation (cities offer better jobs and services) and industrialisation (Kobe-Osaka region in Japan). Social and cultural factors include religious significance and political stability; areas with social or political unrest see out-migration.
Ques. What is Thomas Malthus's theory of population and why does it matter for Class 12?
Ans. Thomas Malthus argued in 1798 that population grows geometrically (doubling each generation) while food supply grows only arithmetically (by one unit at a time). Any excess population beyond the food supply would be cut back by positive checks such as famine, disease and war. He preferred preventive checks like delayed marriage and moral restraint. The NCERT textbook uses Malthus's argument to support the case for deliberate population control through family planning, contraception access and tax disincentives for large families. For the CBSE Class 12 board paper and CUET, students should know the geometric vs arithmetic distinction and the two types of checks.
Ques. What is the difference between natural growth and actual growth of population?
Ans. Natural growth of population is the difference between births and deaths in a region over a specific period (Natural Growth = Births minus Deaths). It does not include migration. Actual growth of population is births minus deaths plus in-migration minus out-migration, so it captures the full real change in population size including people moving in and out. CBSE tests this distinction in short-answer questions; students who confuse the two formulas lose easy marks. Natural growth is always the starting point; migration is then added to get actual growth.
Ques. Why do 90 per cent of the world's people live on 10 per cent of the land?
Ans. The concentration of 90 per cent of world population on 10 per cent of the land reflects the combined effect of geographical, economic and social-cultural factors. Flat plains with fertile soils and reliable water supply (like the Ganga and Rhine valleys) support intensive agriculture and large cities. Industrial zones with mineral wealth (like the Kobe-Osaka belt) attract workers and service providers. The remaining 90 per cent of land area, covering polar regions, high mountain zones, hot deserts like the Atacama and equatorial rainforests, is either too cold, too dry, too steep or too remote to support dense settlement. The NCERT chapter uses George B. Cressey's description of Asia to illustrate this pattern at the continental scale.
Ques. Is the Class 12 Geography syllabus for this chapter changing in 2026-27?
Ans. No major reductions in 2026-27. The Fundamentals of Human Geography Chapter 2 content on world population distribution, density, components of change, migration and demographic transition remains in the current NCERT syllabus. These Class 12 Geography Chapter 2 notes for the 2026-27 cycle are aligned to the unchanged textbook and the latest CBSE sample paper released for the 2026 boards. Students preparing for CUET Geography should also note that this chapter's concepts on demographic transition and push-pull factors appear regularly in CUET Domain subject questions.
Ques. How long does it take to revise these world population Class 12 notes?
Ans. The full notes file is designed for a 25 to 30 minute first-pass revision and a 15-minute night-before pass. Students who already have the chapter under their belt finish the file in about 20 minutes; first-time revisers take closer to 35 minutes. The Key Definitions Table, the Push-Pull Factors table and the Demographic Transition three-stage summary alone take 8 to 10 minutes to revise and cover roughly 8 of the 10 marks the chapter typically carries in the board paper.



Comments