




These Class 12 Geography Chapter 2 The World Population: Distribution, Density and Growth handwritten notes are a topper's genuine handwritten revision pages, aligned with the 2026-27 CBSE syllabus. The pages cover all key topics: population distribution patterns, density calculations, factors influencing distribution, population growth, demographic transition theory, and migration concepts. Use the PDF in the 24 hours before your board paper or CUET Geography section.
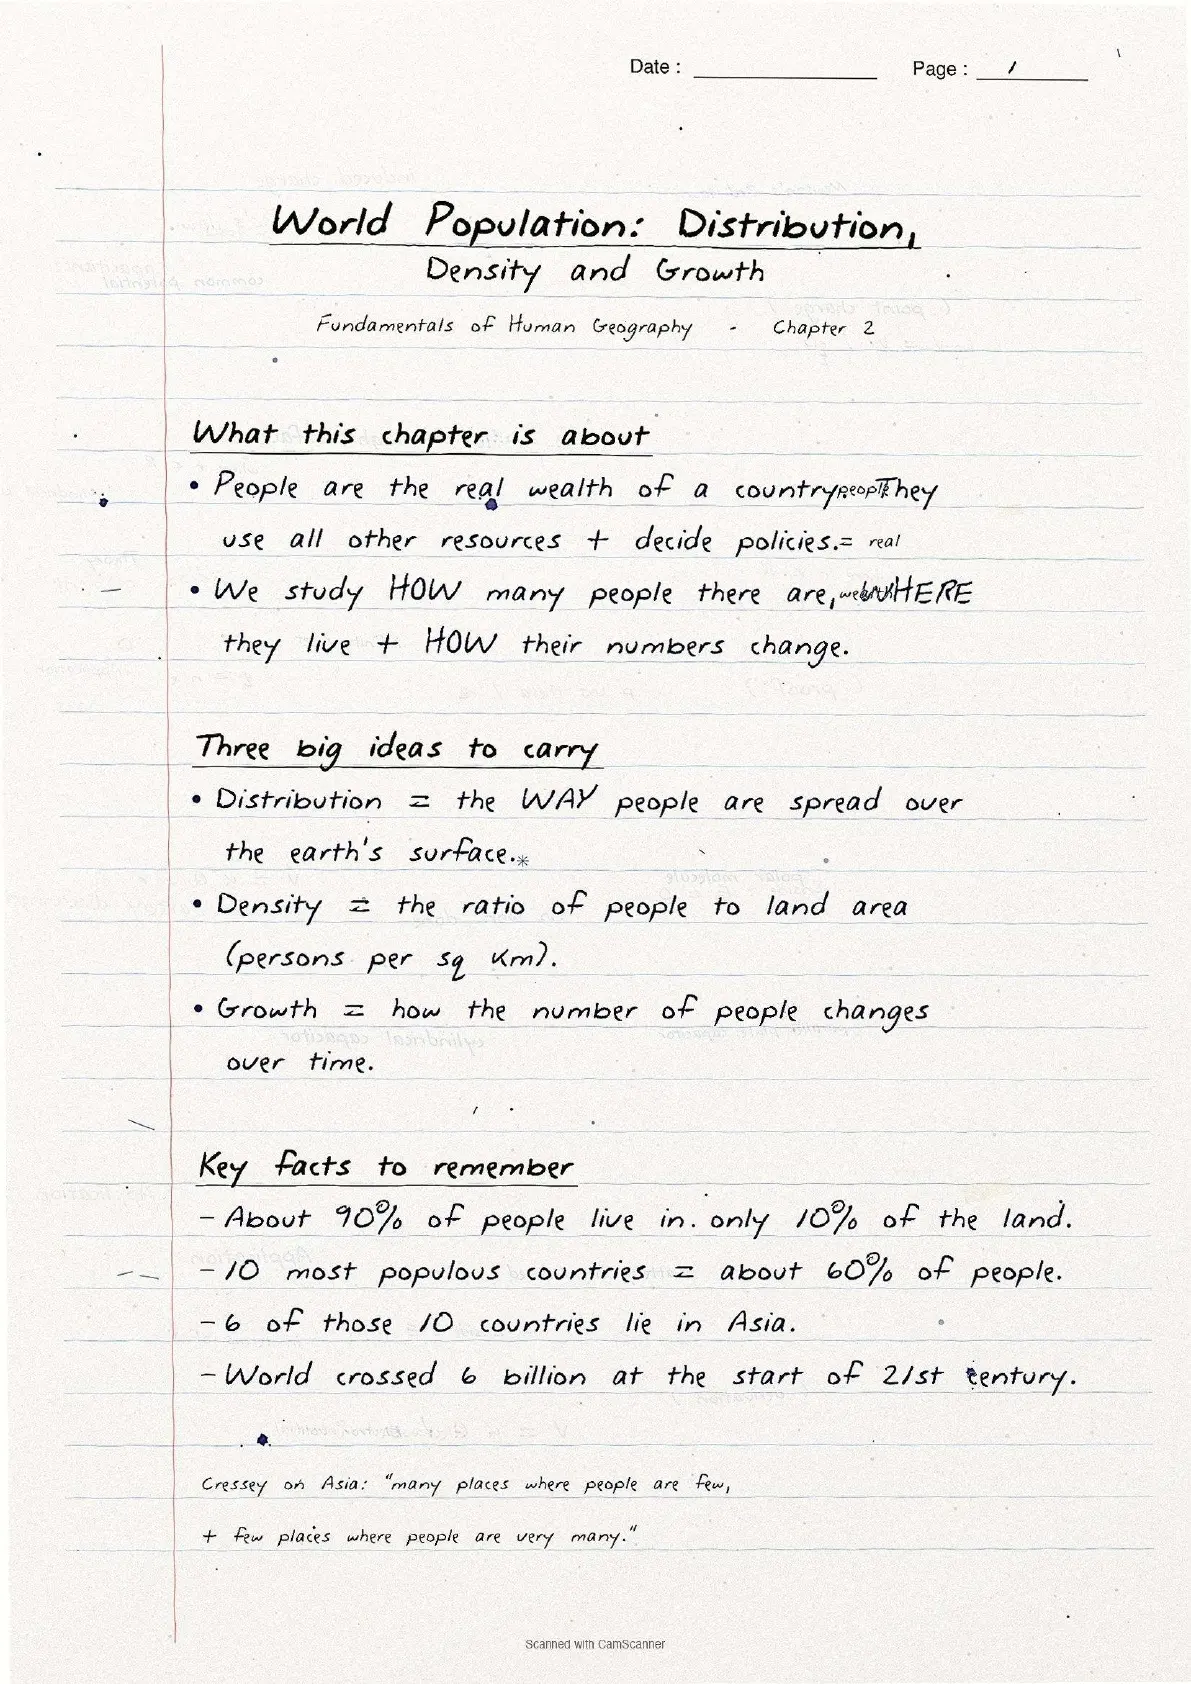
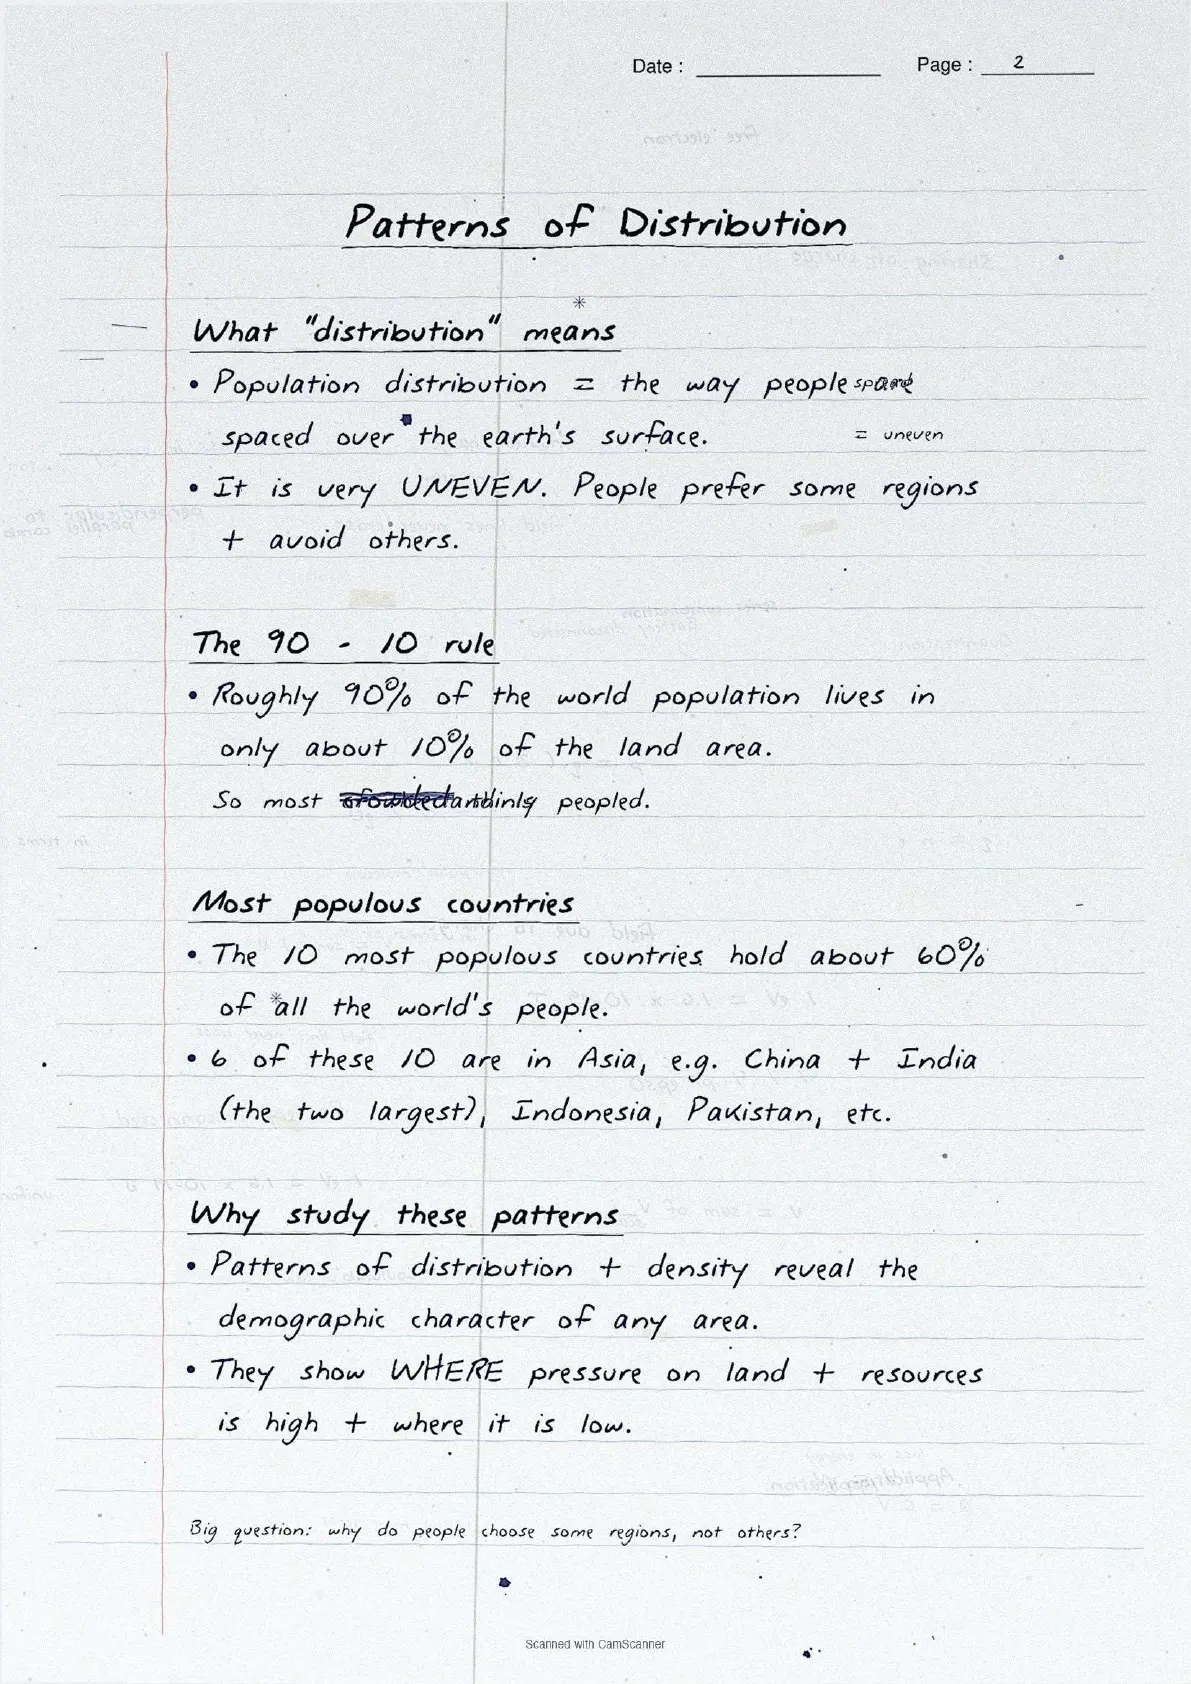
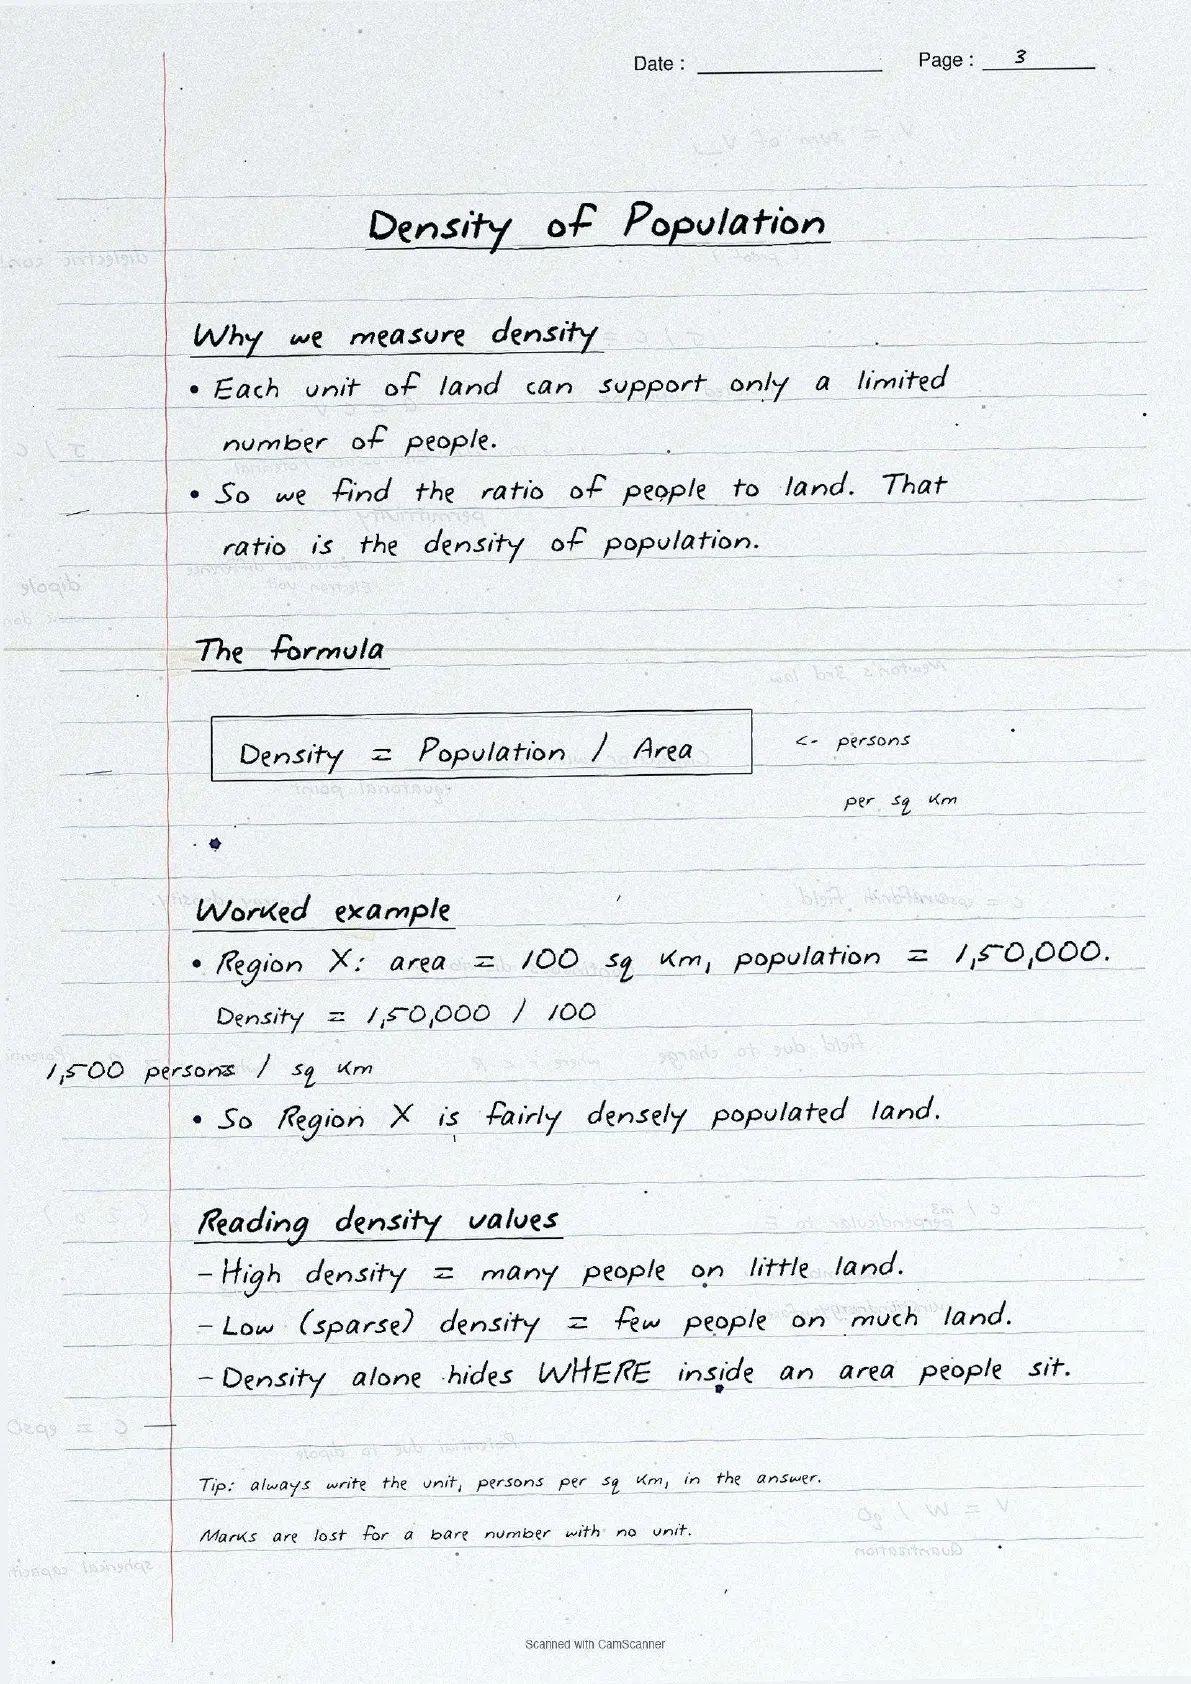
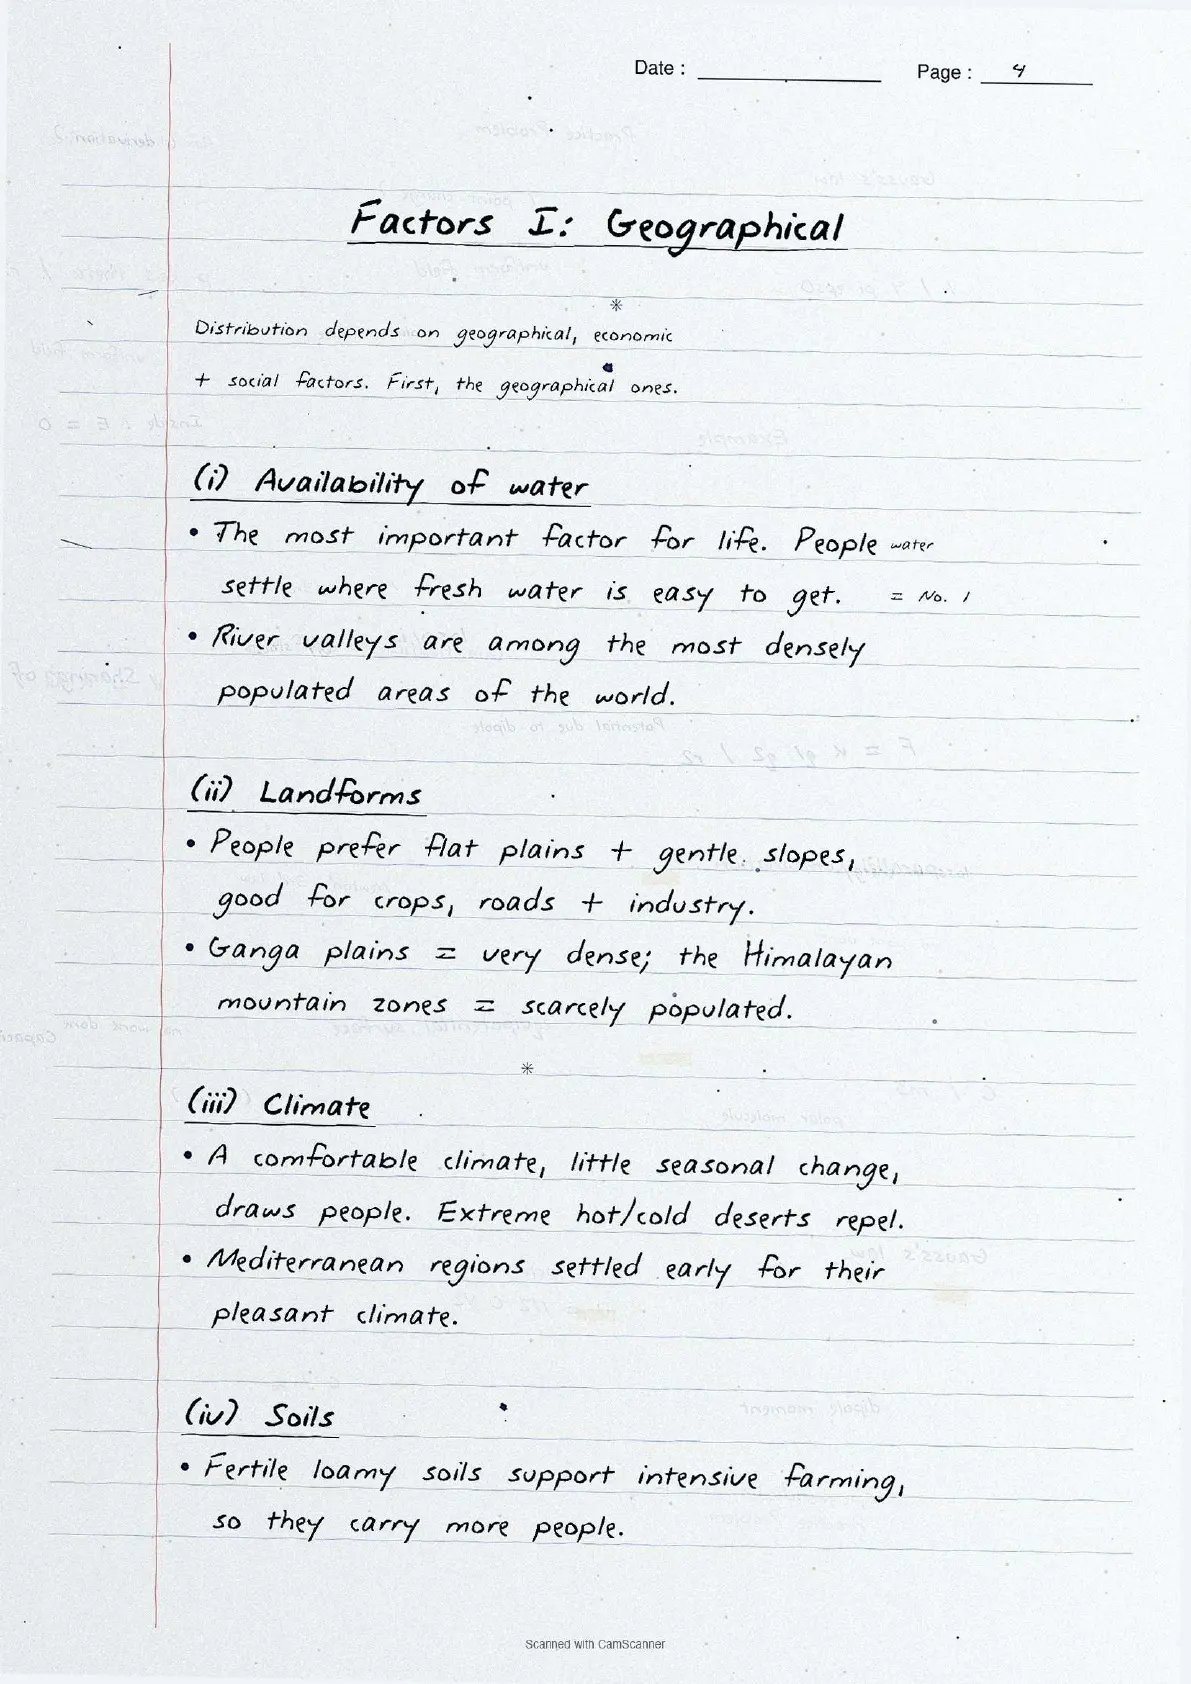
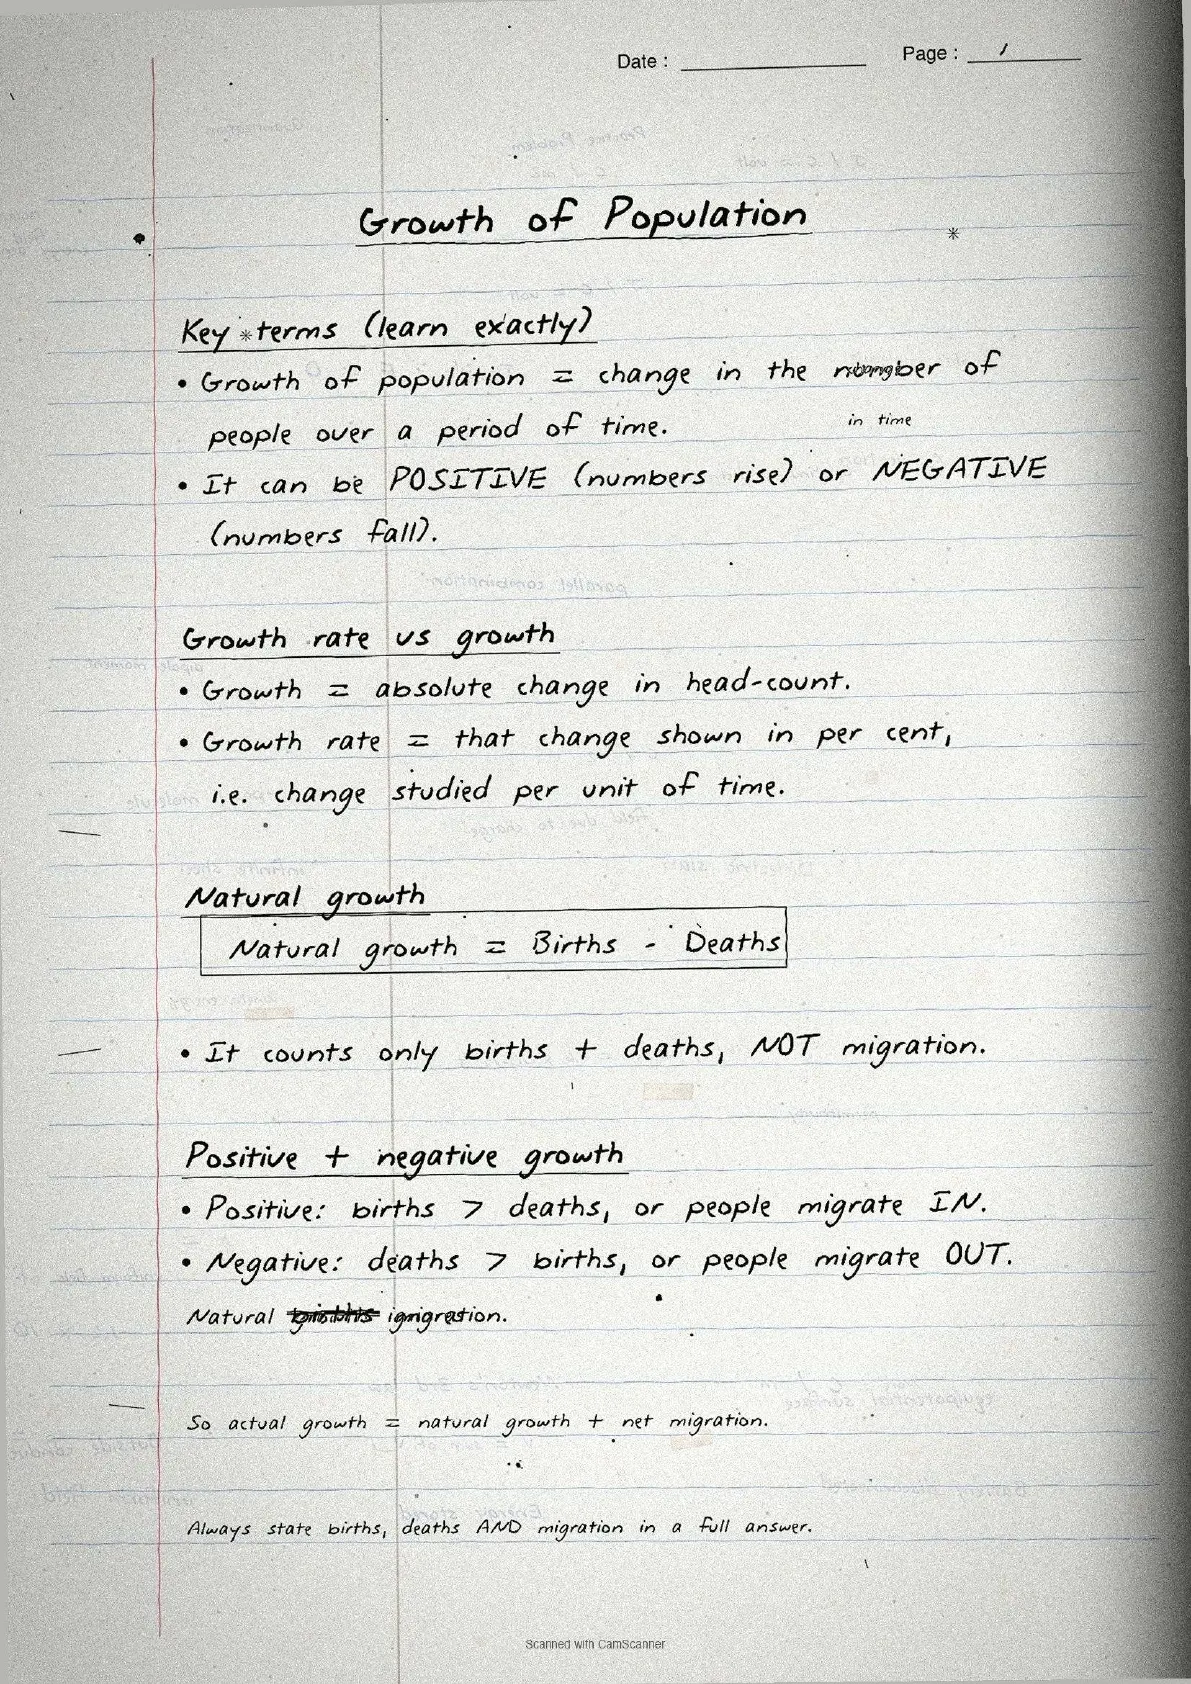
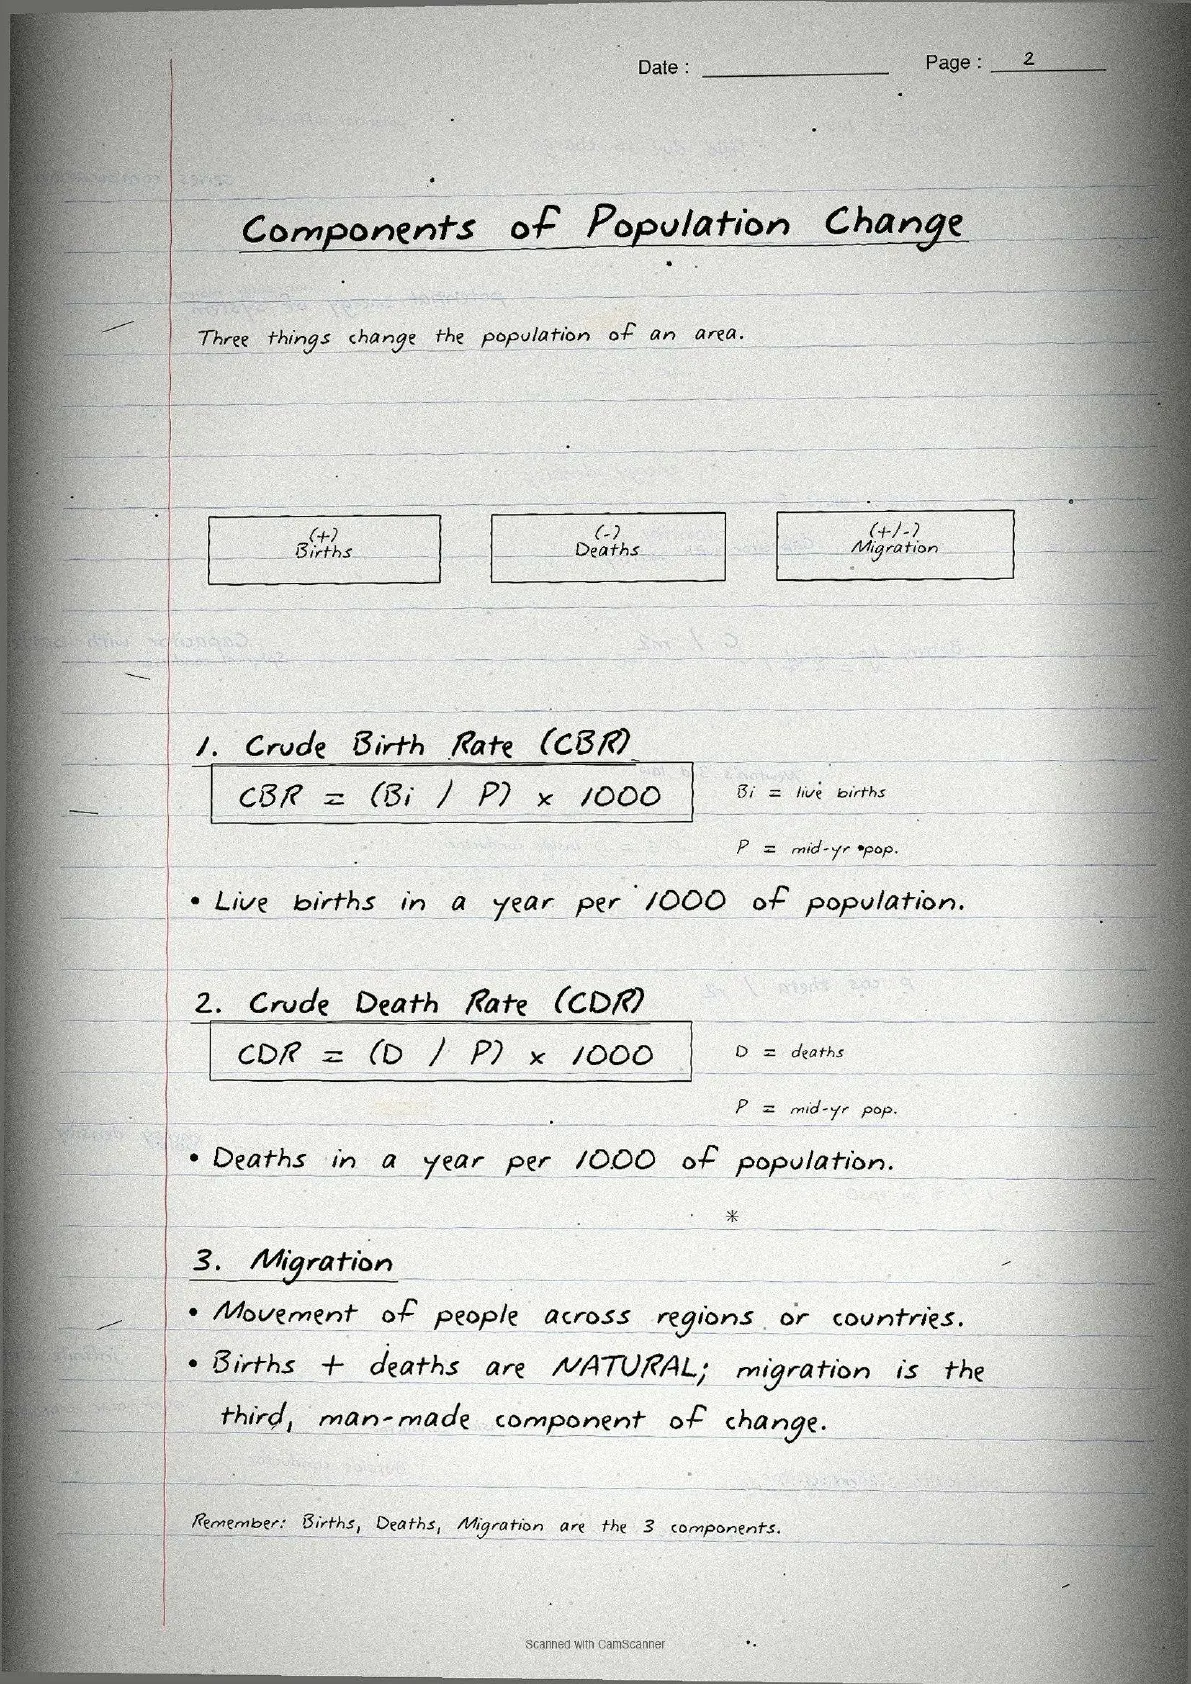
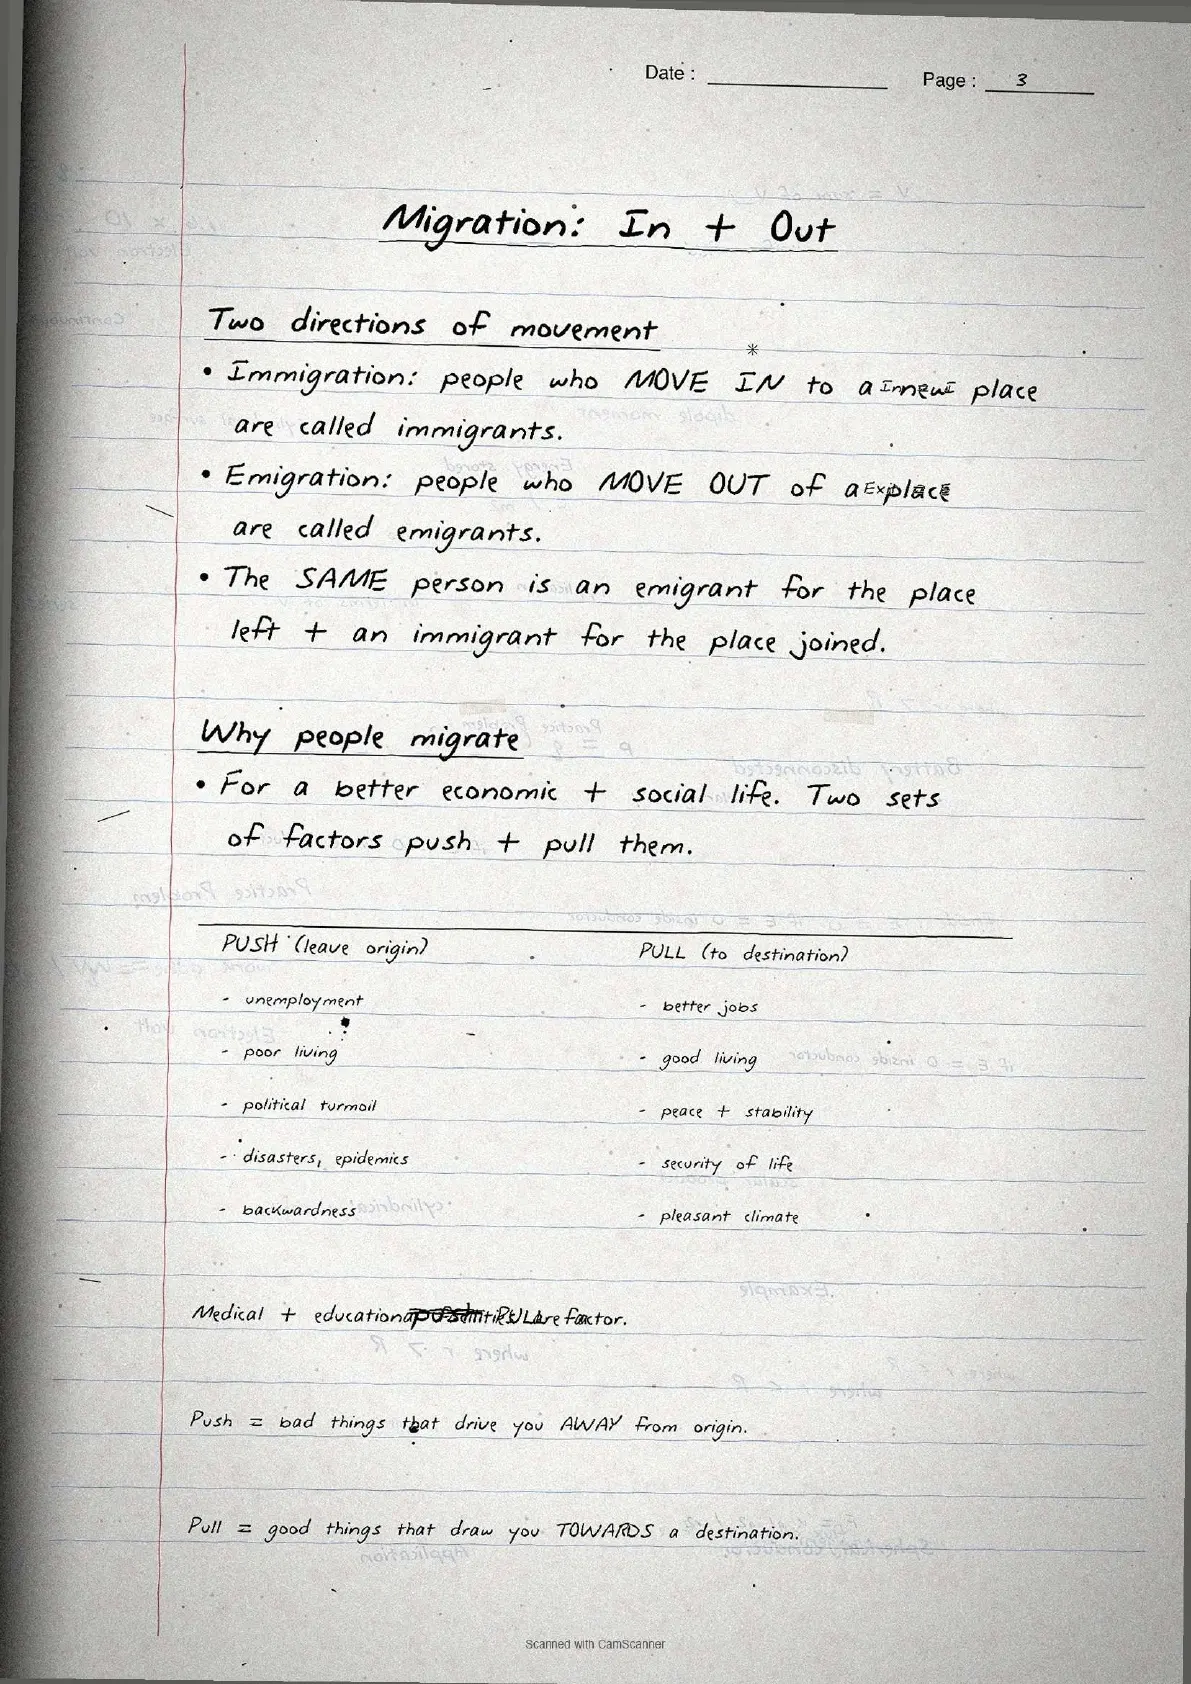
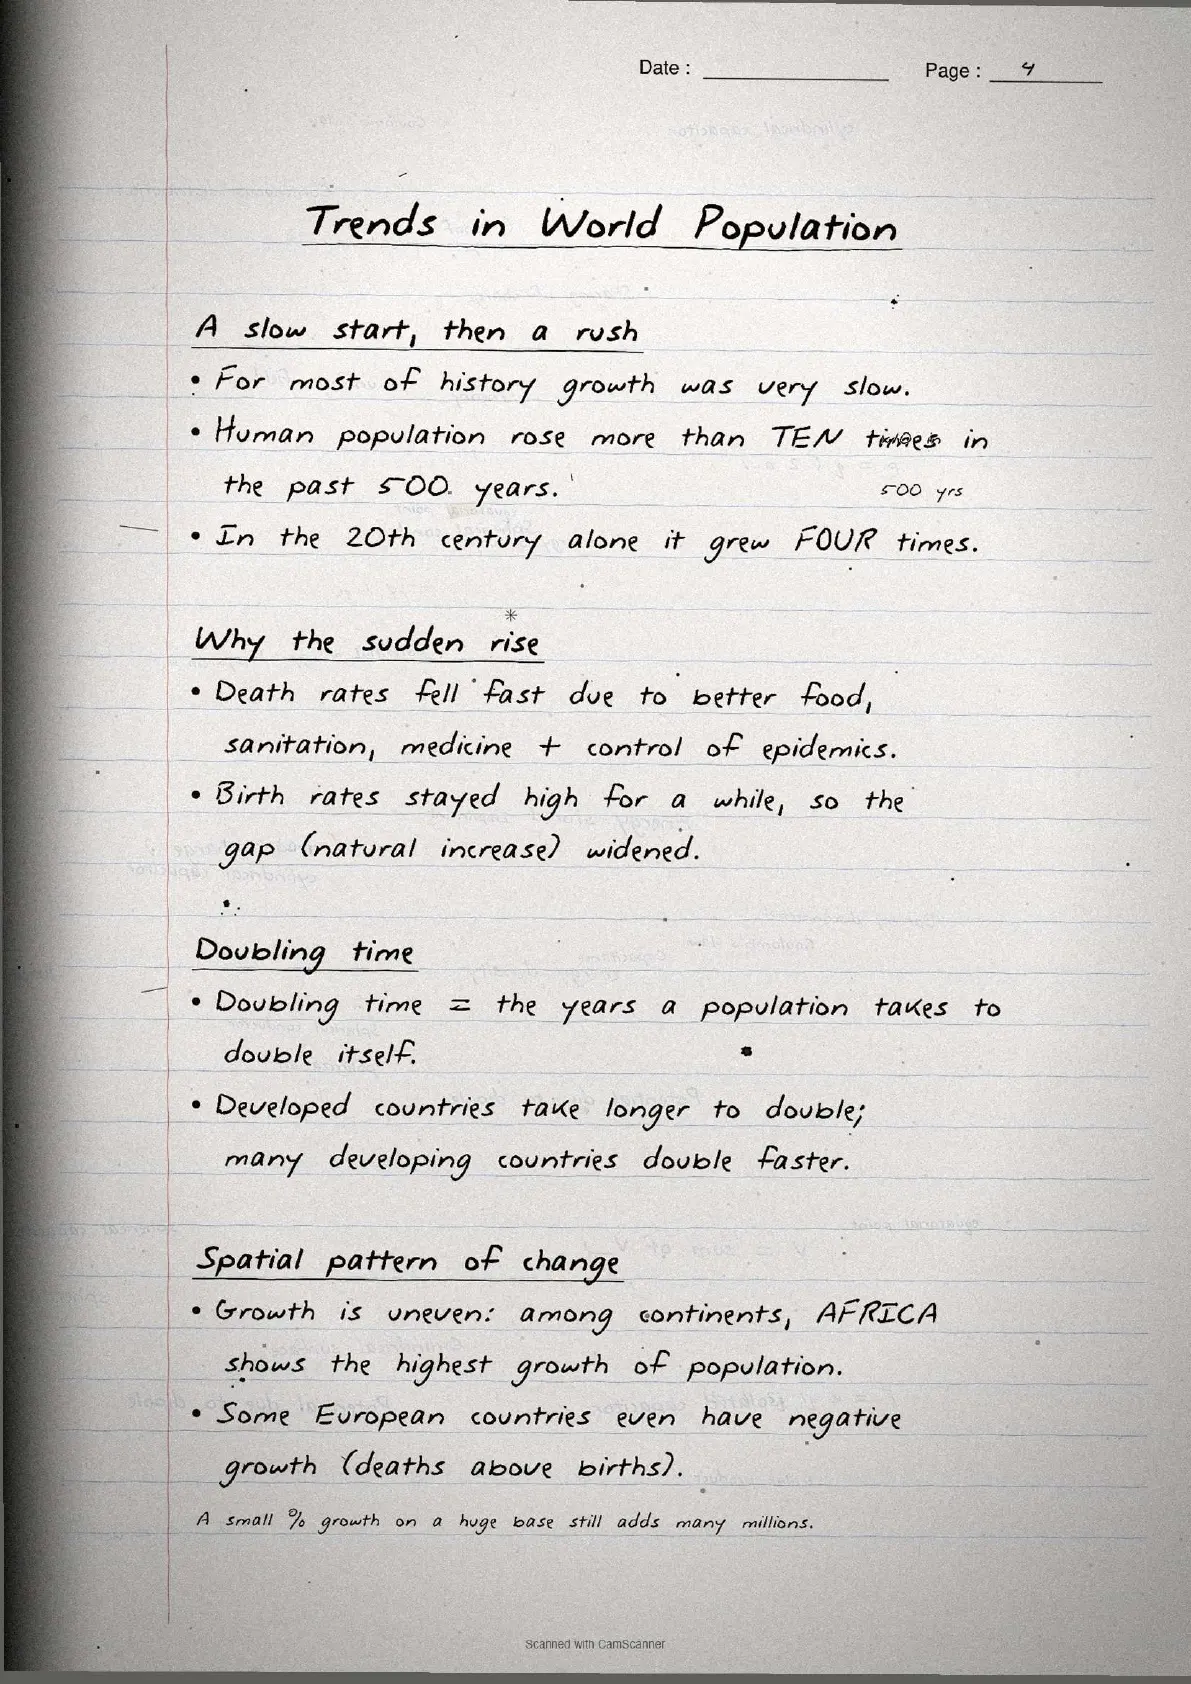
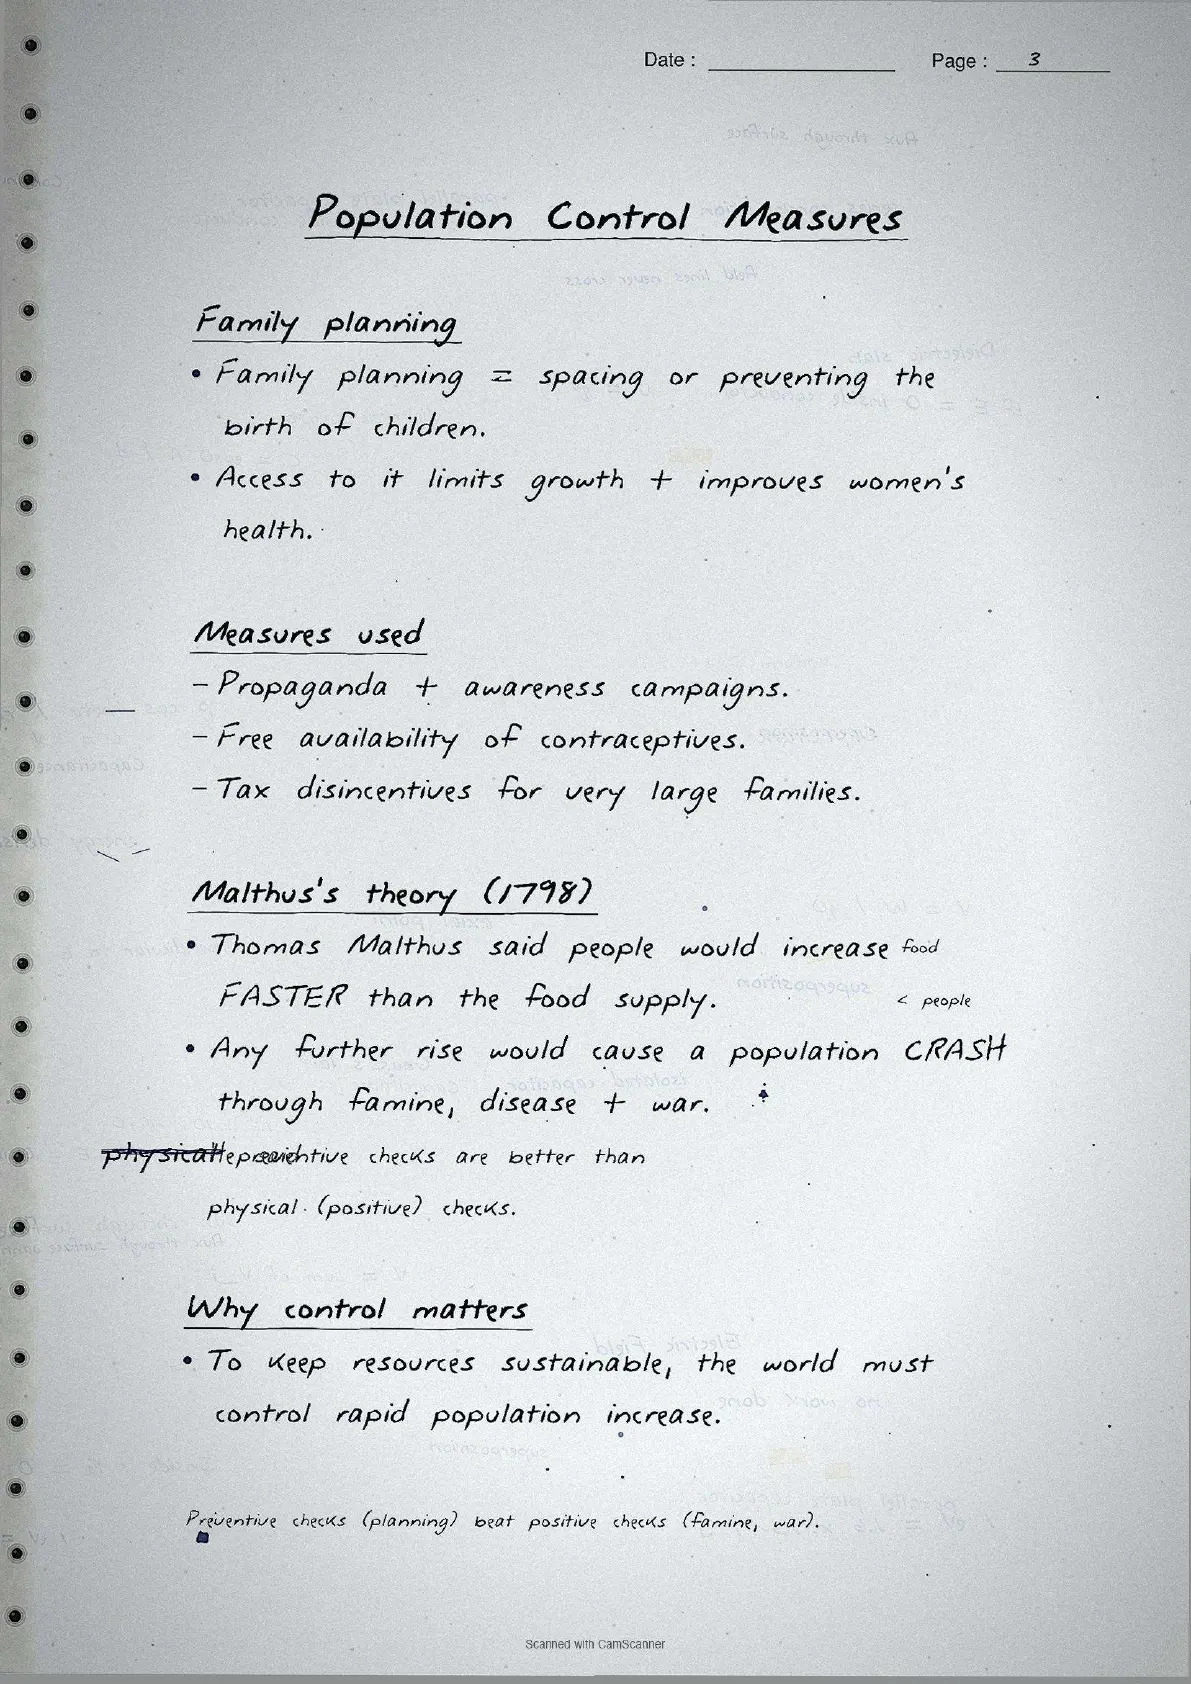
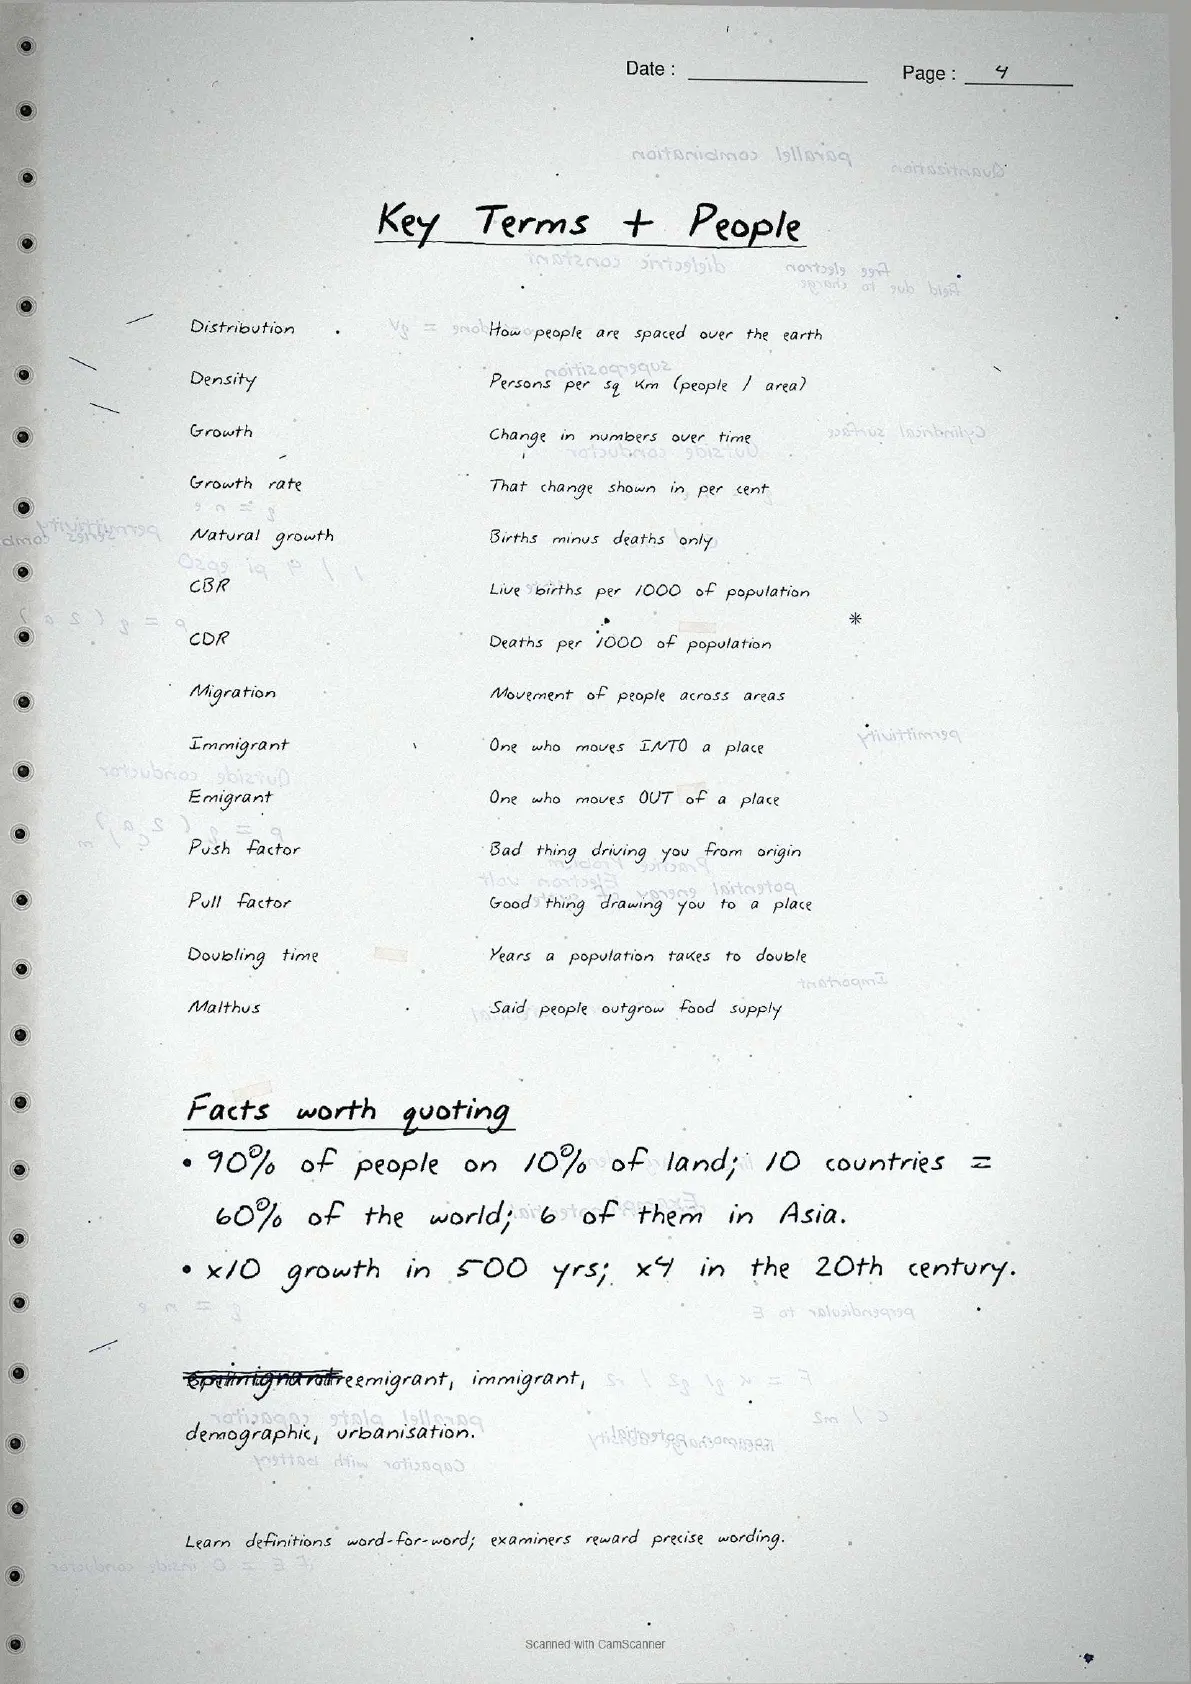
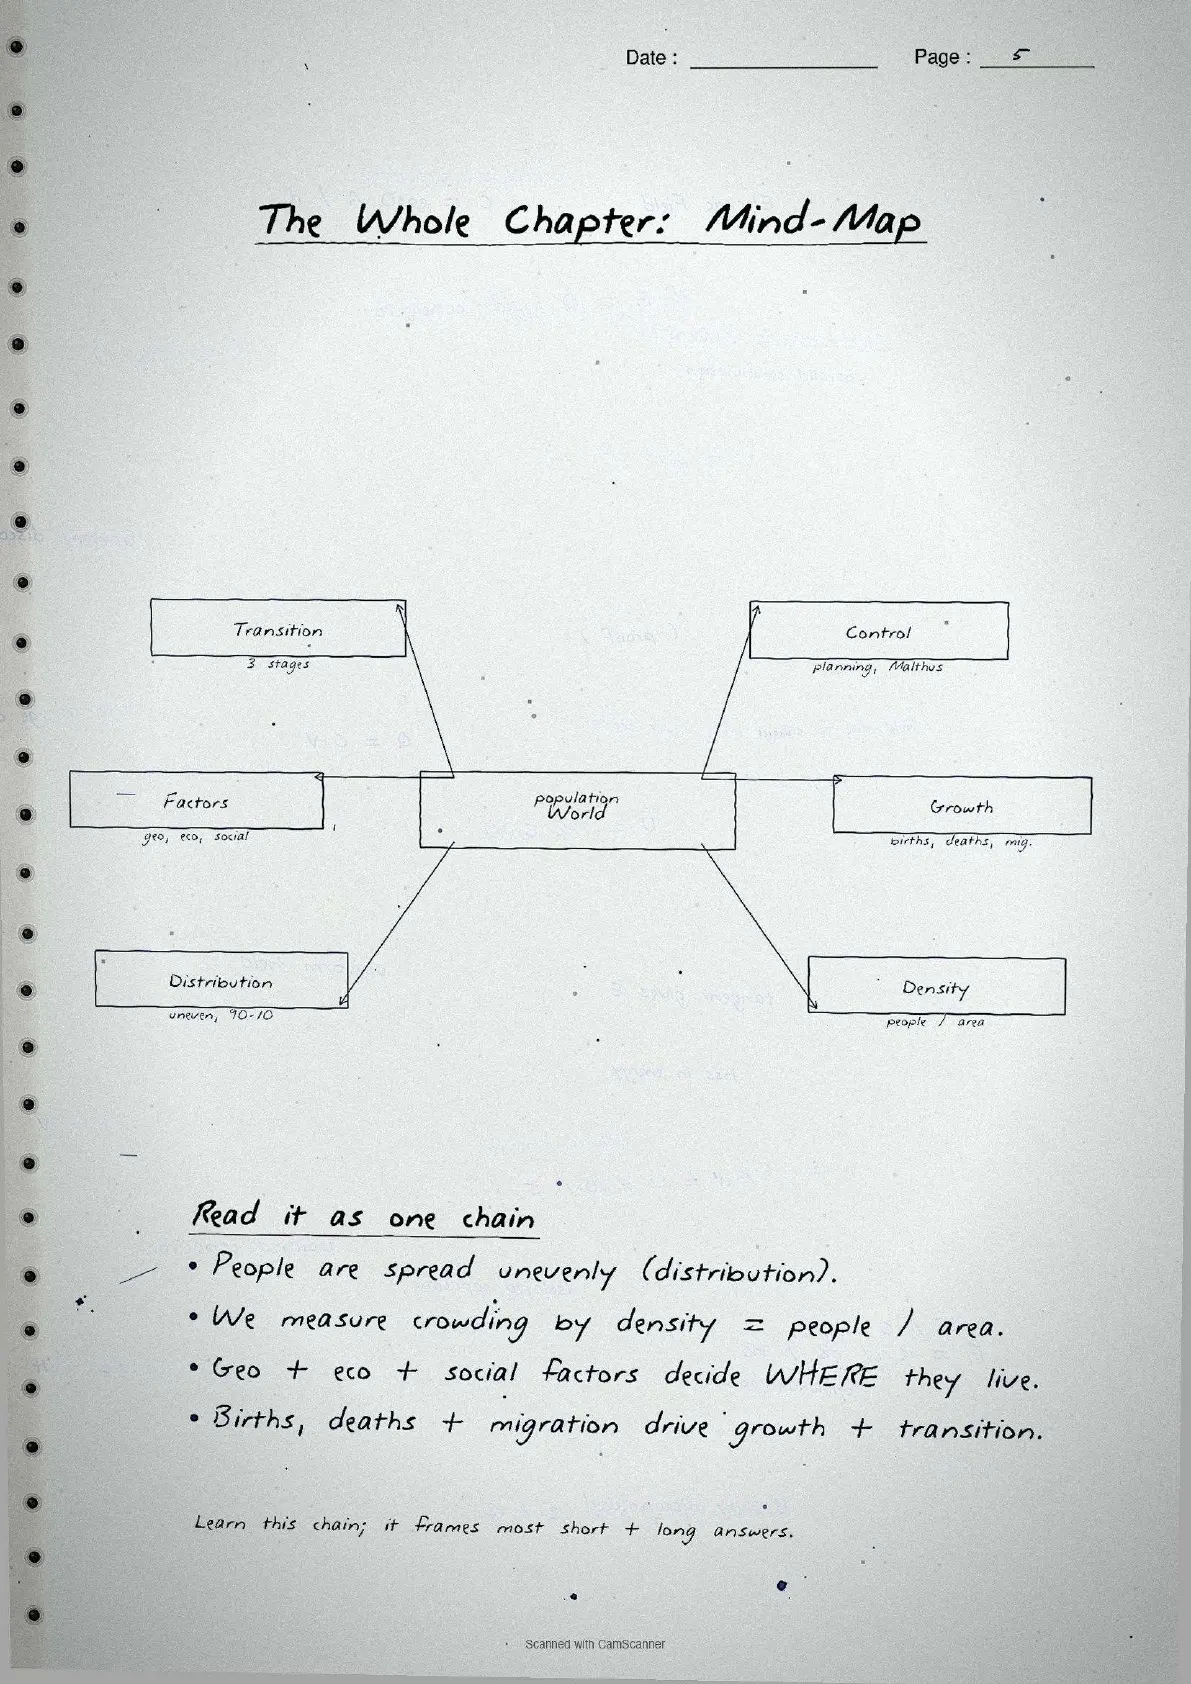
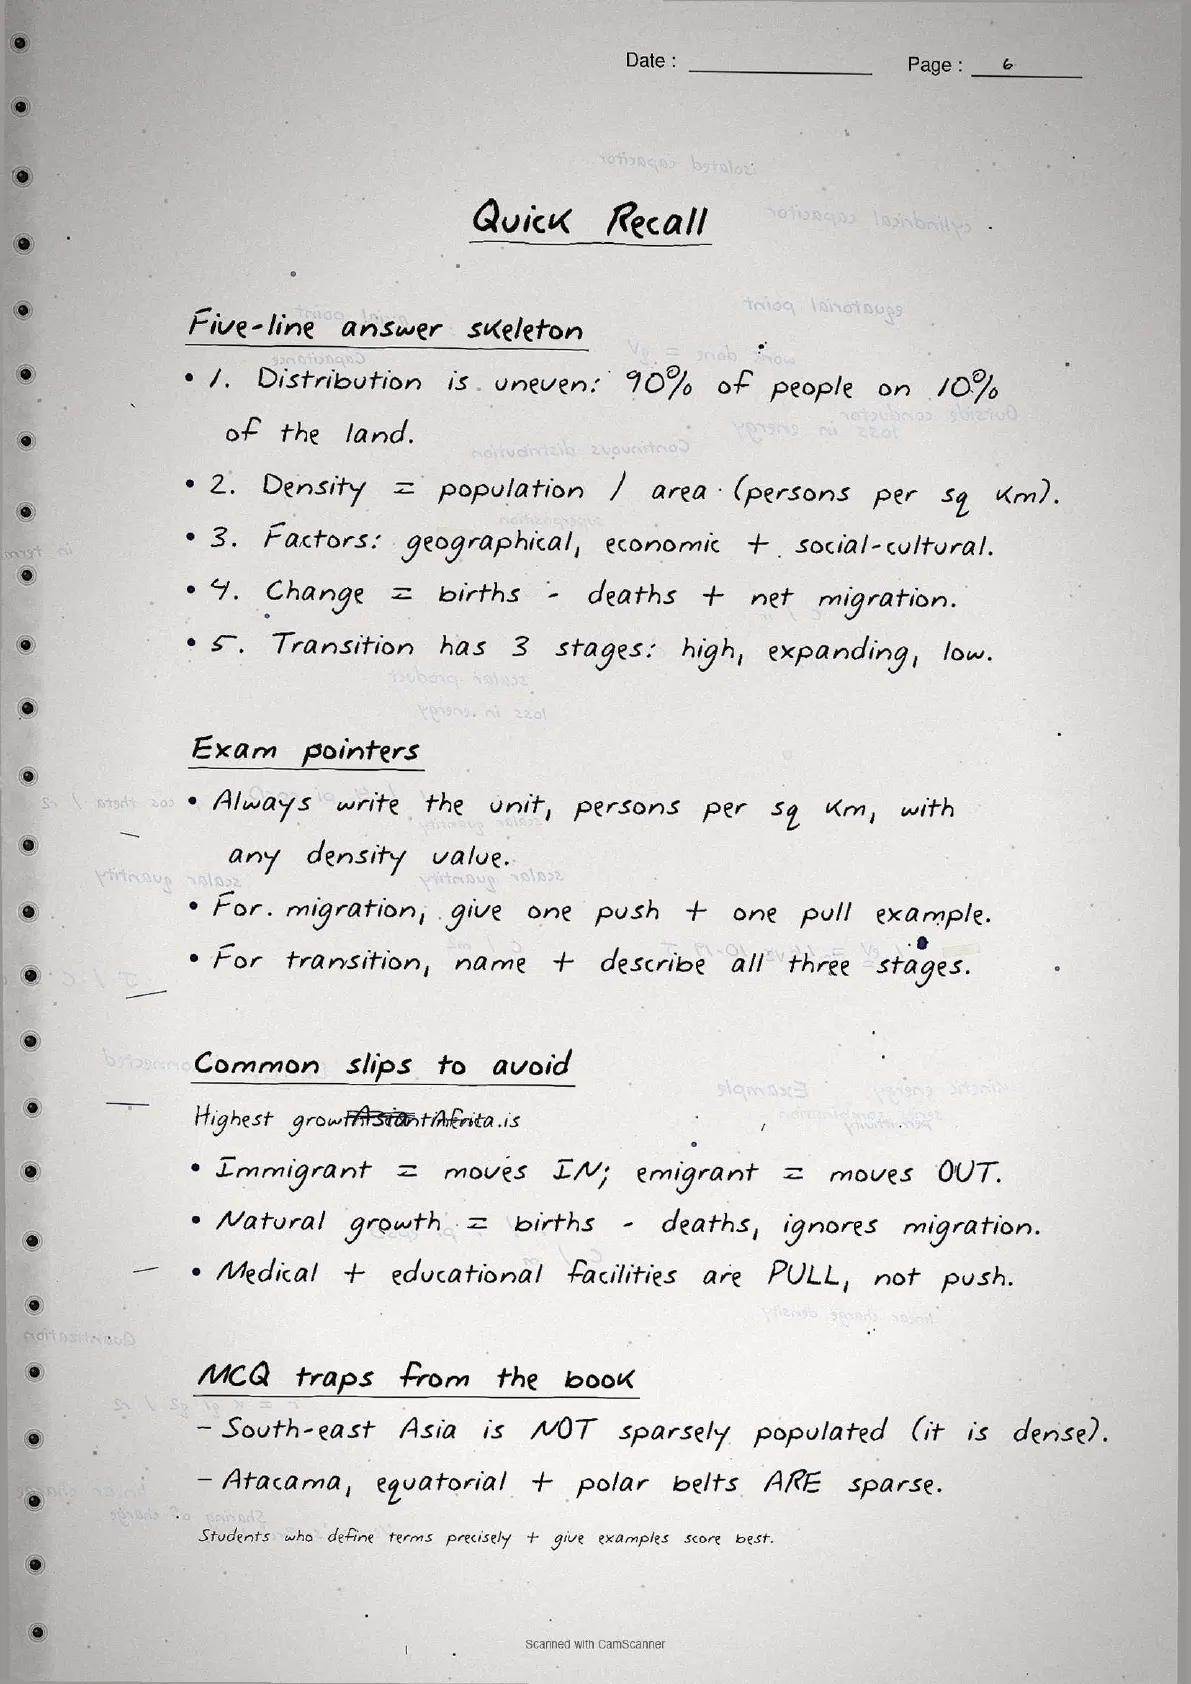
- Topper's handwritten revision notes covering all of CBSE Class 12 Fundamentals of Human Geography Chapter 2.
- Important chapter for CBSE boards and CUET, with population distribution maps, density formula, CBR/CDR formulas, push-pull factors and the 3-stage Demographic Transition Model all written out by hand.
- Pairs with the typed NCERT Solutions, typed Notes and the official NCERT Book PDF for the same chapter.
Every page of these world population class 12 handwritten notes is written by a Collegedunia Geography expert, mapped to the 2026-27 NCERT Fundamentals of Human Geography textbook, and cross-checked against recent CBSE Class 12 Geography board papers.
Student Feedback
68% of Class 12 Geography students said handwritten notes feel faster to scan than typed PDFs in the final 48 hours before the board exam, and 4 out of 5 said hand-drawn maps and diagrams stick in memory better. Most finished one full revision pass in about 20 minutes.
Source: 2026-27 Class 12 Geography handwritten-notes poll, 9,200 CBSE students.
What These Handwritten Notes Include
The world population class 12 handwritten notes PDF is a 4 to 5 page revision file. Every page carries hand-drawn boxes around formulas, arrow-tagged diagrams of the demographic transition stages, and colour corrections where a concept is tightened. It is built for last-mile revision, not first-time concept building.
The notes capture every concept tested in Chapter 2: patterns of distribution, the density formula, all geographical, economic and social factors, the three components of population change, the CBR and CDR formulas, push and pull factors, the three-stage Demographic Transition Model, and population control including Malthus's theory.
| Page | What the page covers | Approx revision time |
|---|---|---|
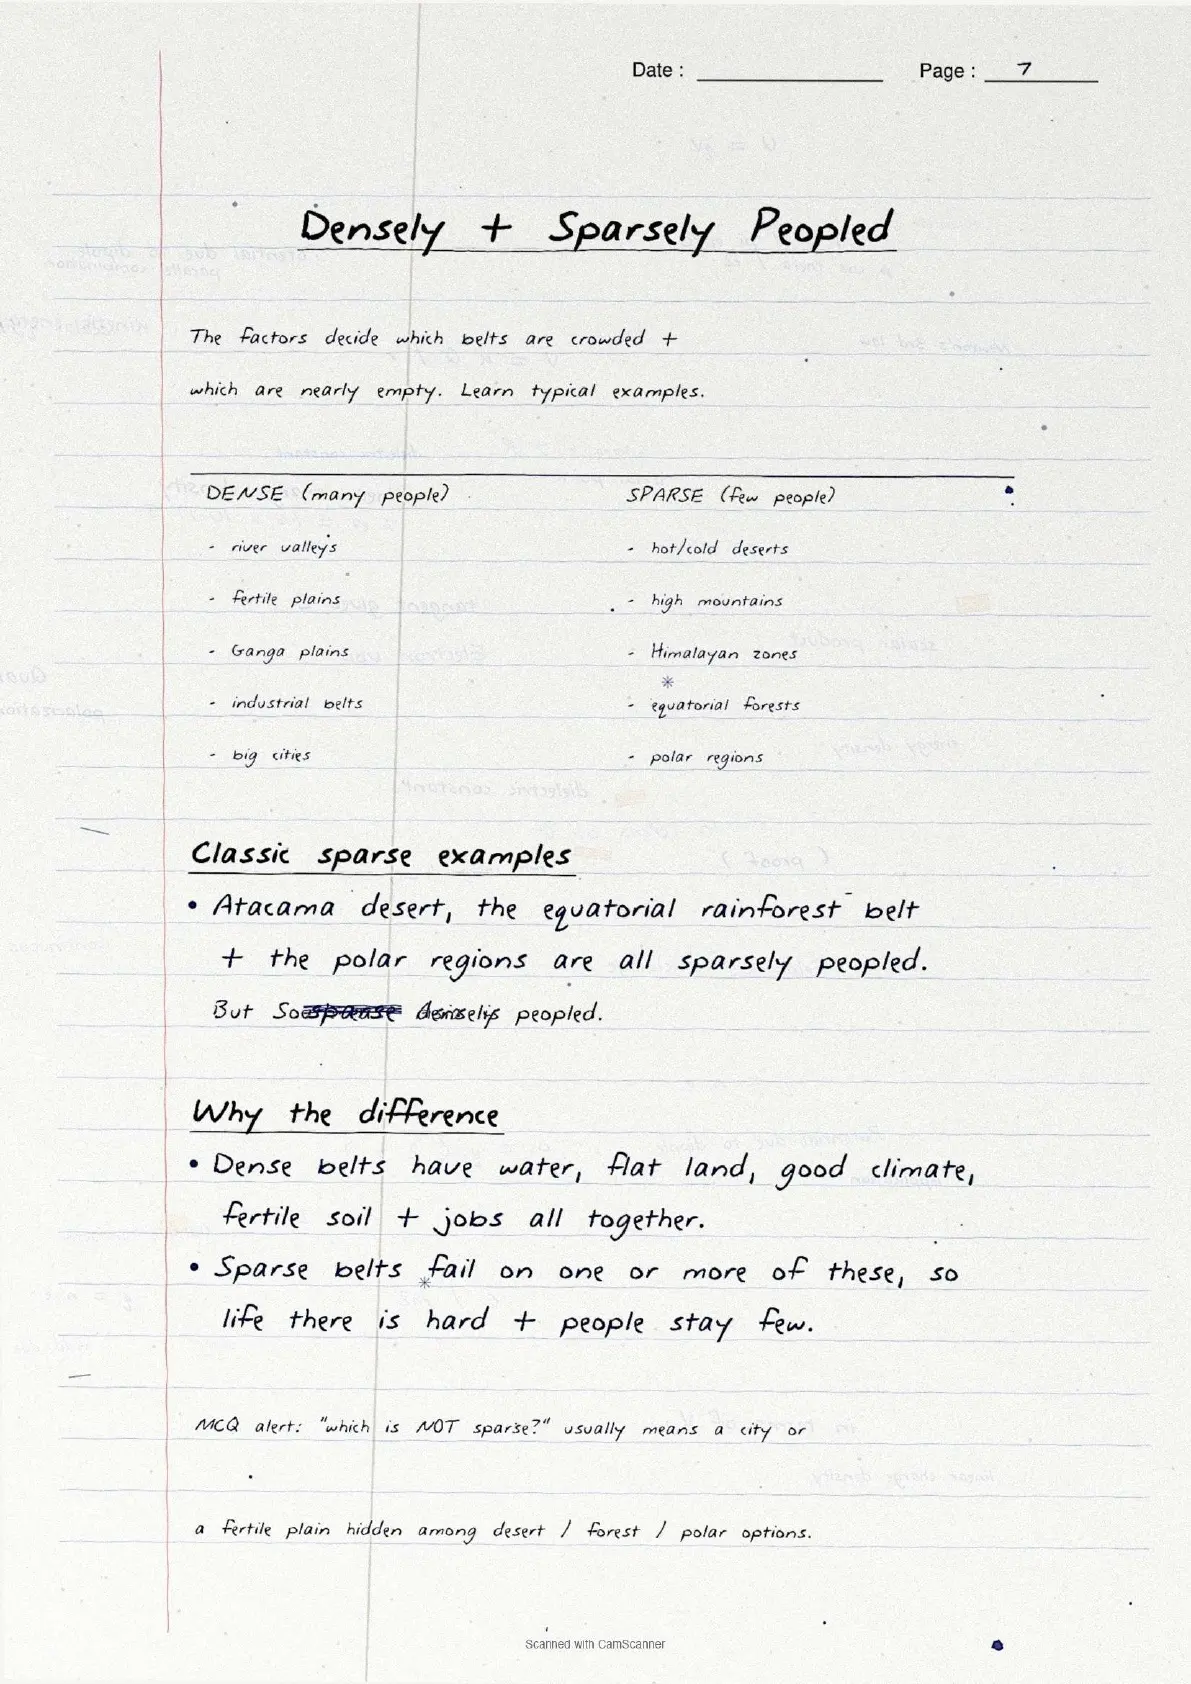
| Page 1 | World population distribution patterns, densely and sparsely populated regions, top 10 most populous countries, and the basic density formula. | 5 minutes |
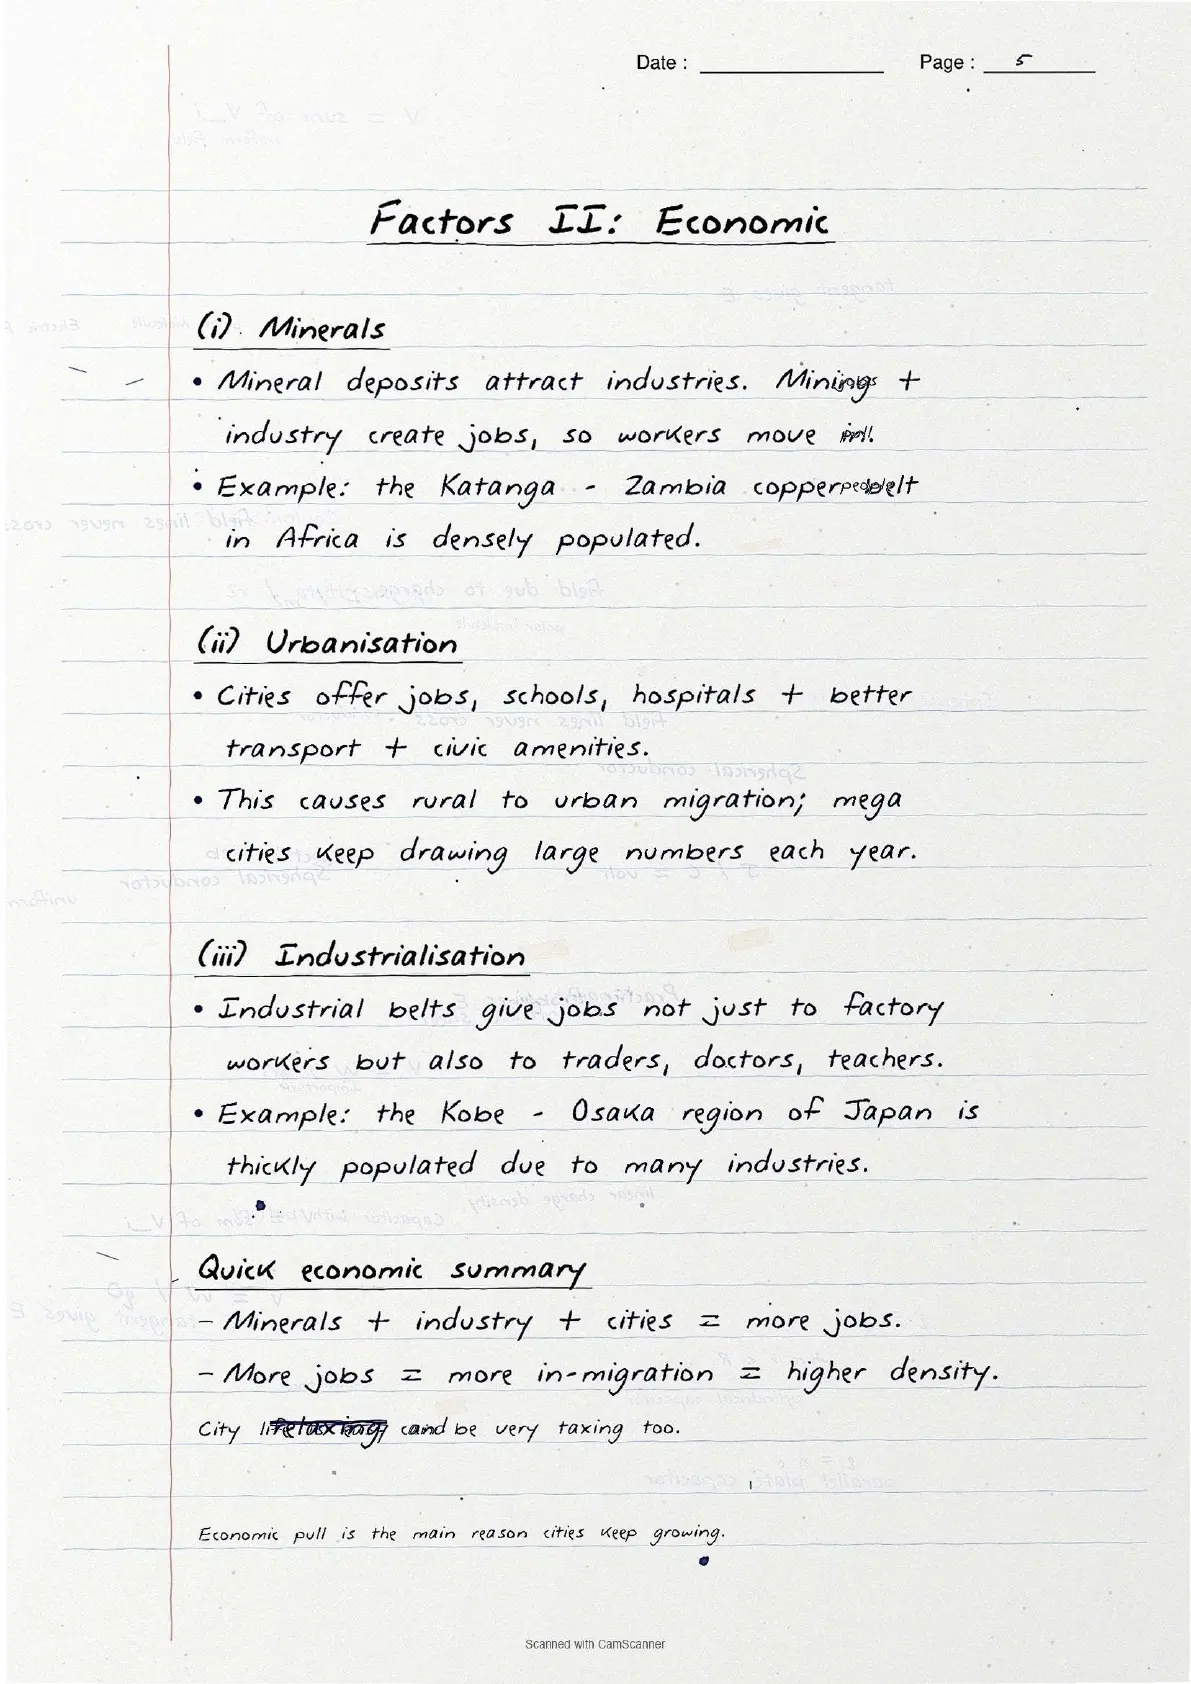
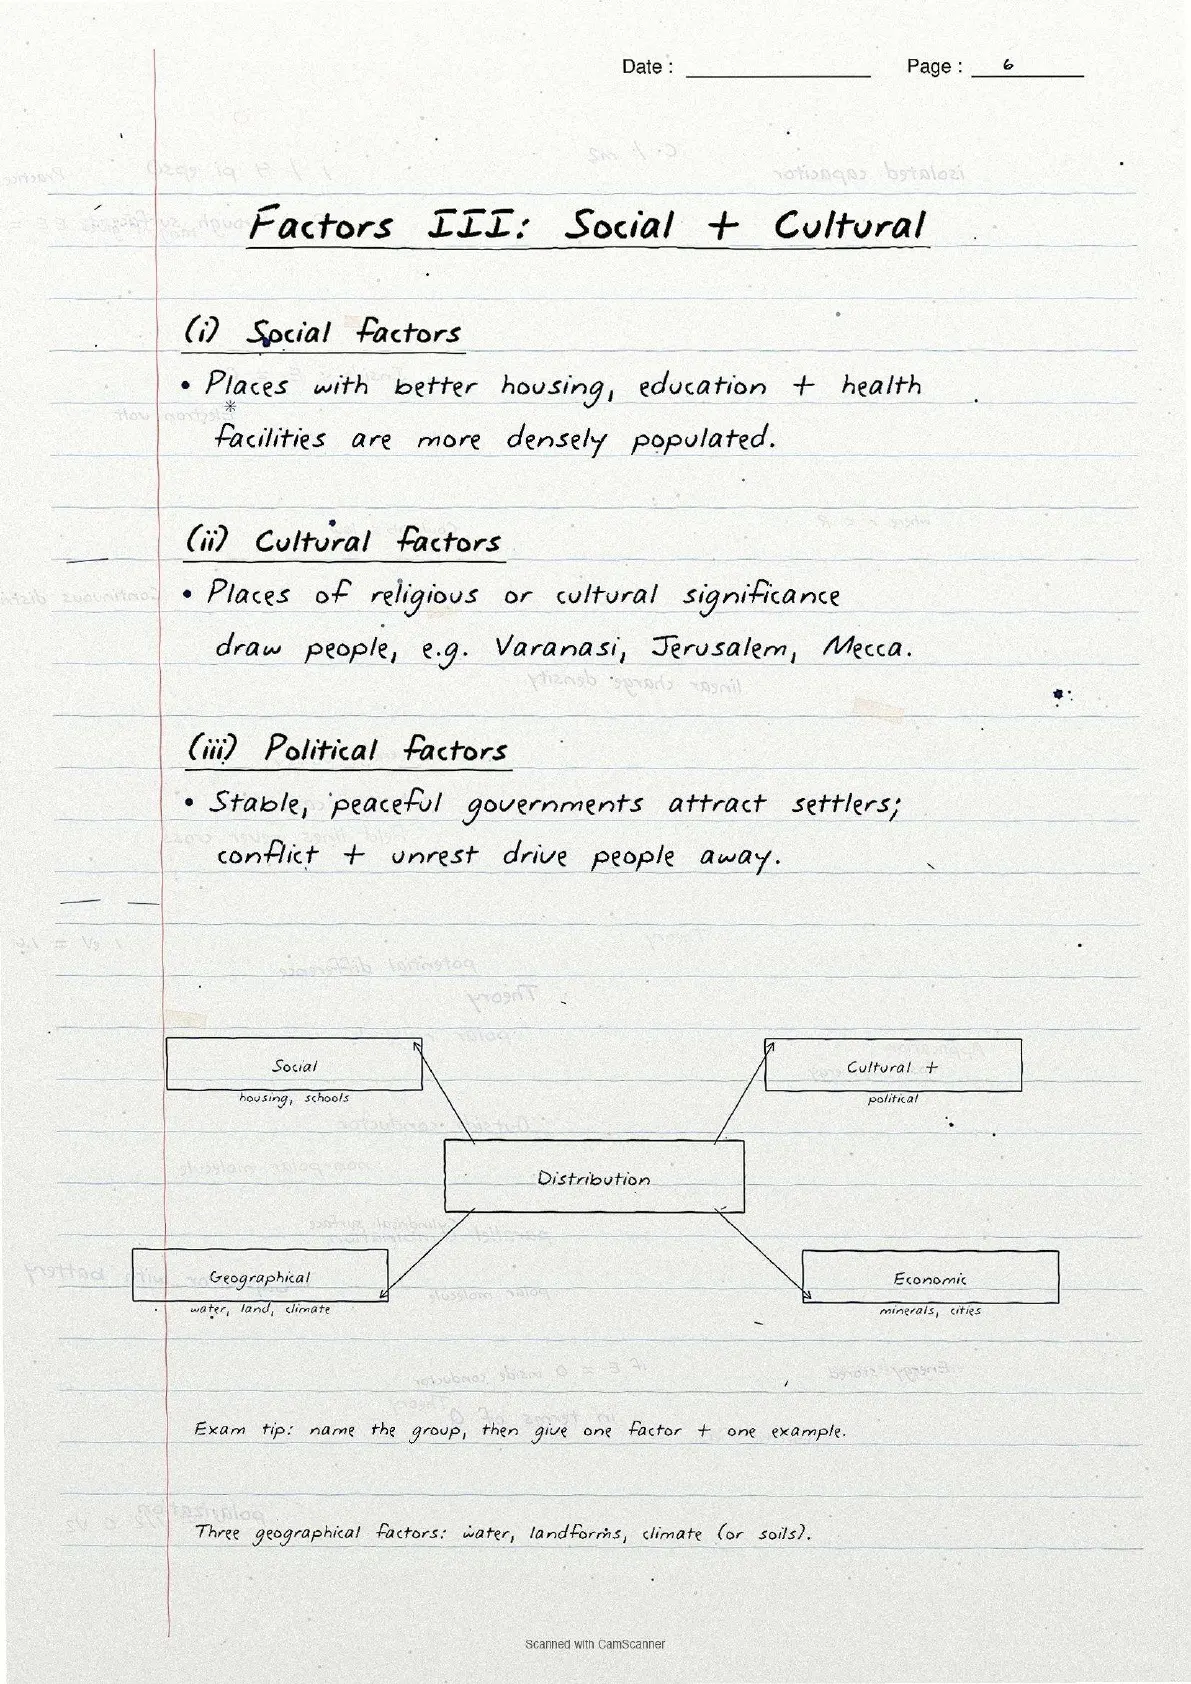
| Page 2 | Geographical, economic and social factors influencing distribution, with examples (Ganga plains, Kobe-Osaka, Katanga copper belt). | 6 minutes |
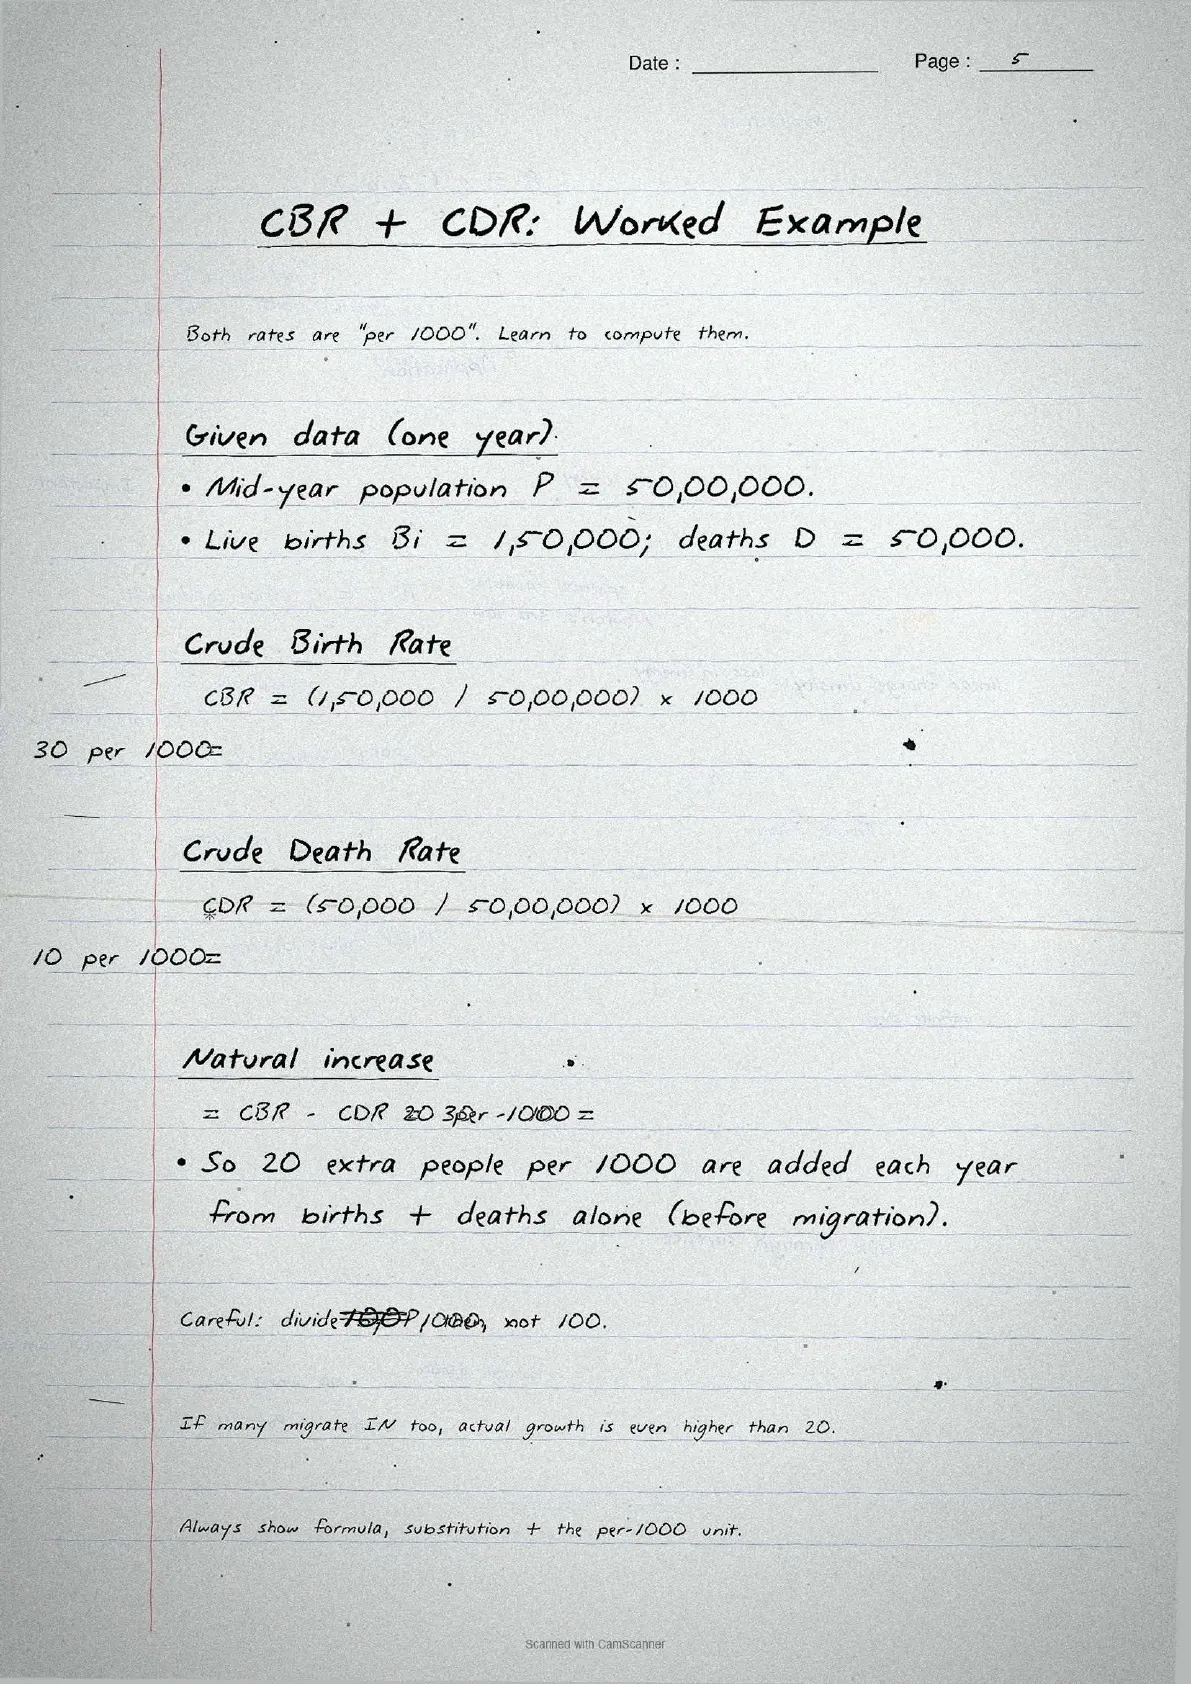
| Page 3 | Population growth concepts, Natural Growth formula, CBR and CDR formula boxes, and the three components of population change. | 5 minutes |
| Page 4 | Migration (push and pull factors), immigration vs emigration, and the Demographic Transition Theory 3-stage diagram. | 6 minutes |
| Page 5 | Population control measures, Malthus's theory, and a quick-recall summary of all key terms. | 4 minutes |
Source: Magnet Brains on YouTube
Key Formulas: Population Density, CBR and CDR
The formula section is the most-revised block in the file. The table lists every formula students must memorise for the board paper, in the same order as the notebook page.
| Concept | Handwritten formula (as written) | Board exam relevance |
|---|---|---|
| Density of Population | Population divided by Area (in sq km) = persons per sq km | Direct 1-mark or part of 3-mark Q |
| Natural Growth of Population | Births minus Deaths | Definition Q (1-2 marks) |
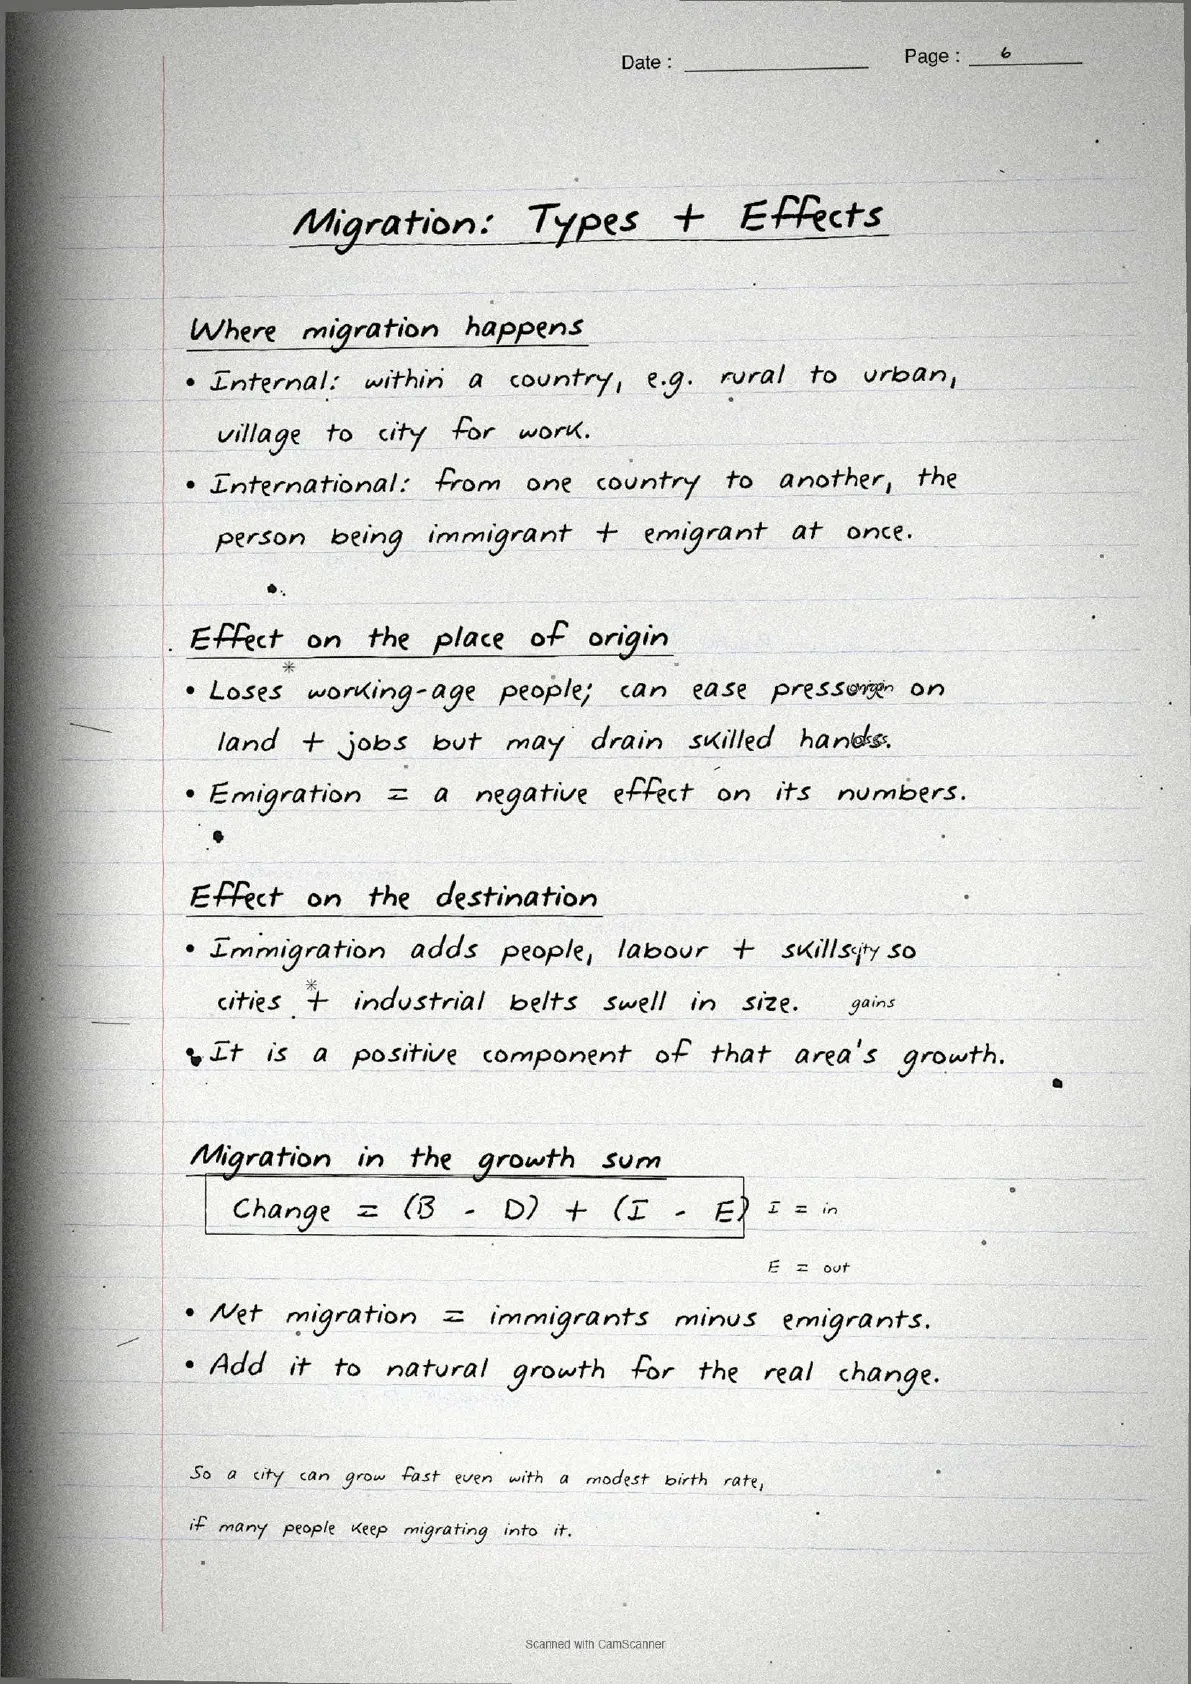
| Actual Growth of Population | Births minus Deaths plus In Migration minus Out Migration | Distinguish Q (3 marks) |
| Crude Birth Rate (CBR) | (B divided by P) times 1000; B = live births, P = mid-year population | 3-mark definition question |
| Crude Death Rate (CDR) | (D divided by P) times 1000; D = deaths, P = mid-year population | 3-mark definition question |
| Positive Growth of Population | Birth rate more than Death rate OR in-migration exceeds out-migration | Explain-the-concept Q |
| Negative Growth of Population | Birth rate less than Death rate OR out-migration exceeds in-migration | Explain-the-concept Q |
Tip: Each formula sits in a hand-drawn box with an arrow to the related concept, so students recall it faster on exam day.
Factors Influencing Population Distribution
Factors of distribution is the most content-heavy part of Chapter 2 and appears most in 3-mark and 5-mark questions. The notebook groups them under three headings.
Geographical factors
- Availability of water - River valleys are densely populated because fresh water is available for drinking, agriculture, industry and navigation.
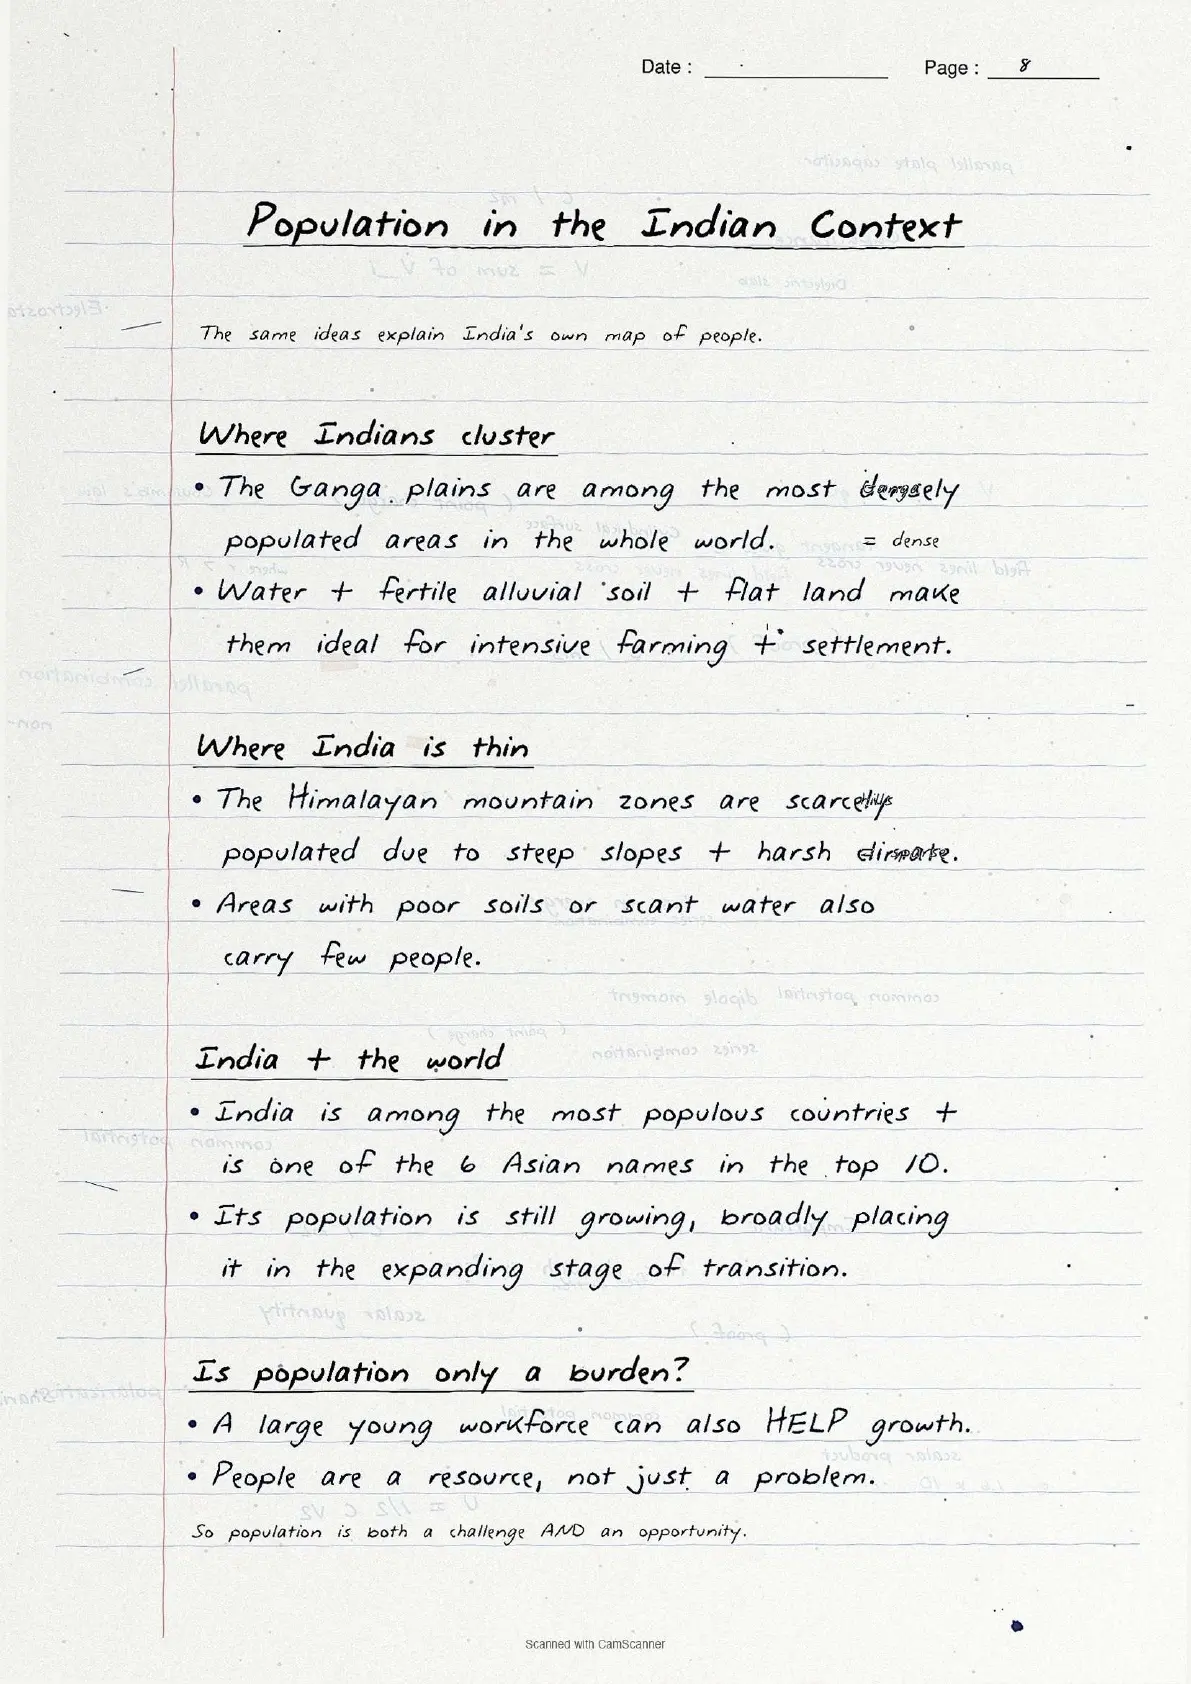
- Landforms - Flat plains attract settlement; mountains and hills hinder it. The Ganga plains are among the most densely populated areas in the world, while the Himalayas are sparsely populated.
- Climate - Extreme heat, cold or heavy rainfall keeps people away; pleasant Mediterranean climates attracted early settlers.
- Soils - Fertile loamy soils support intensive agriculture and denser populations.
Economic factors
- Minerals - The Katanga-Zambia copper belt in Africa drew workers to mining and industrial jobs.
- Urbanisation - Cities offer better employment, education and healthcare, so rural-to-urban migration swells mega cities.
- Industrialisation - Japan's Kobe-Osaka region is thickly populated because of industry, drawing not just factory workers but teachers, doctors and shopkeepers too.
Social and cultural factors
Places with religious or cultural significance attract people, while areas of social and political unrest push them out. Government incentives can also shift patterns.
Population Growth and Its Components
Population growth is the change in the number of inhabitants of a territory over a period of time. It can be positive or negative, and expressed in absolute numbers or as a percentage.
Important: The three components of population change are births, deaths and migration. This is a direct 1-mark question. Do not write "fertility" or "mortality" as components; those are rates, not components.
| Concept | One-line definition (as written in the notebook) |
|---|---|
| Growth of Population | Change in population between two points of time in a specific area (absolute numbers). |
| Growth Rate of Population | Change in population expressed as a percentage. |
| Natural Growth | Births minus Deaths in a region between two points of time. |
| Actual Growth | Births minus Deaths plus In-Migration minus Out-Migration. |
| Positive Growth | Birth rate higher than death rate OR net in-migration. |
| Negative Growth | Birth rate lower than death rate OR net out-migration. |
Demographic Transition Theory: All Three Stages
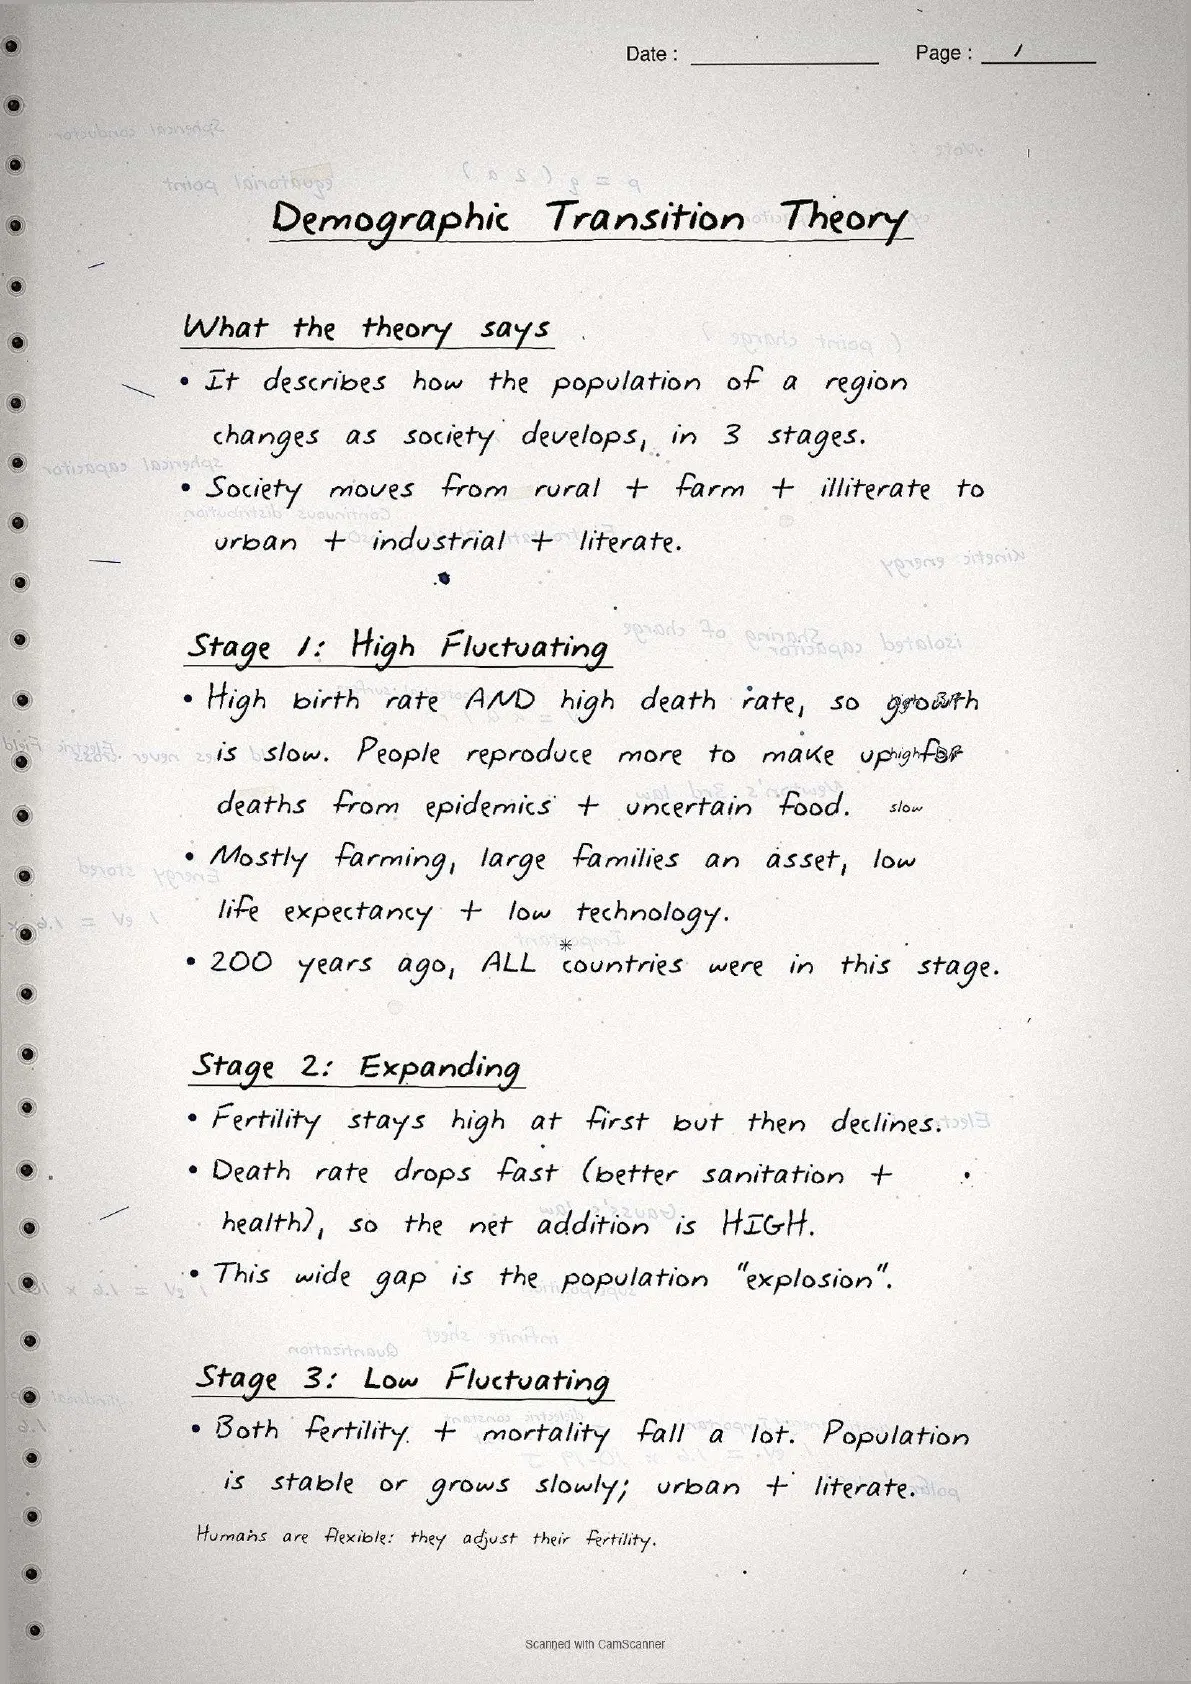
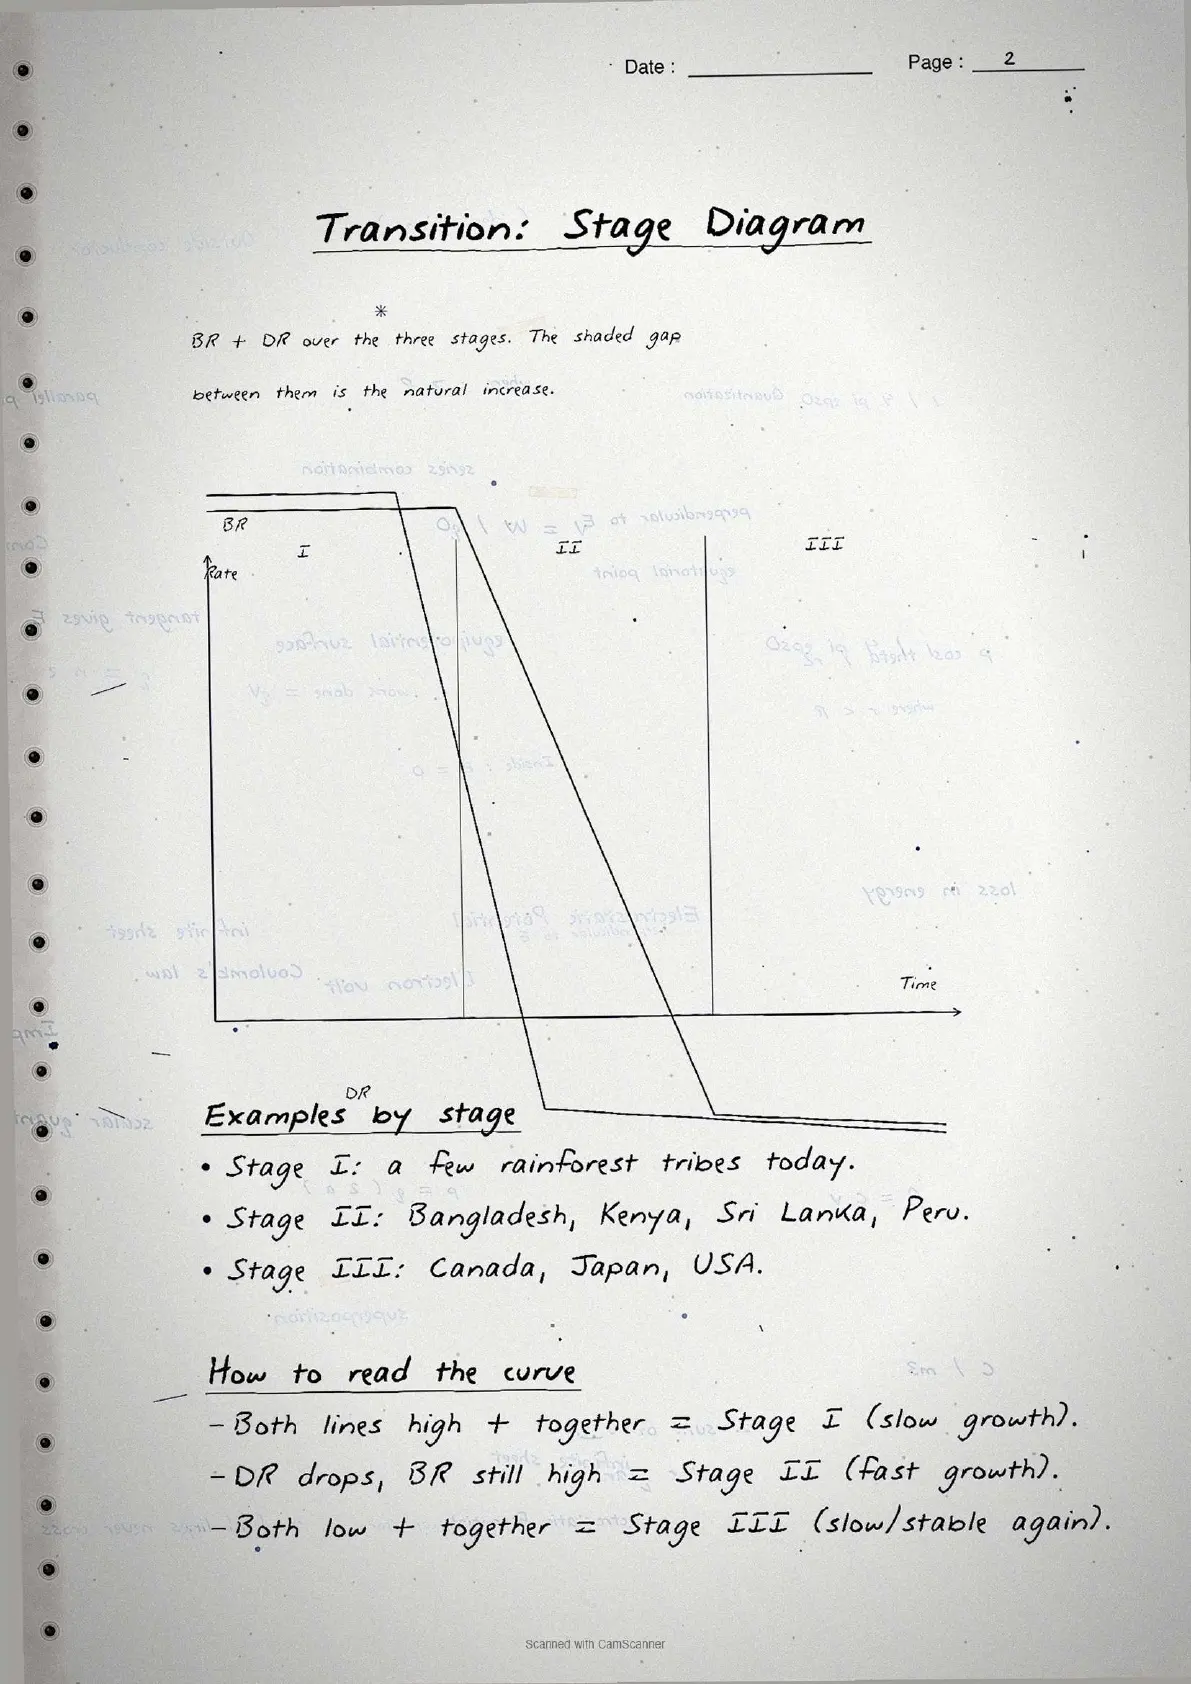
The Demographic Transition Model is the single most-drawn concept in Chapter 2, tested nearly every year as a 3-mark explain or diagram question. The notes draw the full 3-stage graph by hand with CBR and CDR lines and world examples for each stage.
Stage 1: High Fluctuating
Both birth rate and death rate are high and fluctuating, so growth is slow. This stage is typical of pre-industrial, rural, agrarian societies, like remote rainforest tribes.
Stage 2: Early Expanding
Birth rate stays high but death rate drops with better sanitation, healthcare and food. The widening gap means net addition to population is high. Examples: Bangladesh and Kenya. This is the stage of maximum growth.
Stage 3: Low Fluctuating
Both rates decline, so population is stable or grows slowly. Society is urbanised, literate and controls family size. Examples: Canada, Japan and USA. Human beings adjust fertility to match social conditions, the NCERT's conclusion for Stage 3.
Common exam trap: Stage 3 does not have zero population growth. It has slow growth or a stable population. The notes flag this in red ink on Page 4.
Migration: Push and Pull Factors
Migration is the third component of population change and a frequent source of 3-mark questions. The notes present all push and pull factors in two columns on Page 4, with key vocabulary (immigrant, emigrant, origin, destination) in capitals.
| Push Factors (make origin less attractive) | Pull Factors (make destination more attractive) |
|---|---|
| Unemployment | Better job opportunities |
| Poor living conditions | Better living conditions and peace |
| Political turmoil and unrest | Security of life and property |
| Unpleasant climate | Pleasant climate |
| Natural disasters and epidemics | Better educational and medical facilities |
| Socio-economic backwardness | Stability and rule of law |
The same person is both an immigrant (at destination) and an emigrant (at origin), a one-mark fact students often miss.
Common Mistakes Highlighted in the Notes
The six repeat-offender mistakes CBSE examiners flag each year on world population class 12 questions, each marked in the margin of the notes in a second ink colour:
- Writing "components" as fertility and mortality. The three components are births, deaths and migration; fertility and mortality are the driving rates.
- Confusing positive and negative growth. Positive growth only needs birth rate to exceed death rate or net in-migration.
- Mixing up immigration and emigration. An immigrant moves INTO a place; an emigrant moves OUT. Im = Into, Em = Exit.
- Describing Stage 3 as zero population growth. Stage 3 has slow growth or a stable population, not zero.
- Missing examples for economic factors. CBSE expects Katanga copper belt for minerals and Kobe-Osaka for industrialisation.
- Forgetting Malthus's theory. Thomas Malthus (1798) said population grows faster than food supply, and preventive checks beat physical checks (famine, disease, war).
Previous Year Question Trends
The CBSE Class 12 Geography board paper carries a stable 8 to 10 marks from Chapter 2 over recent years, split across theory questions, one map-based question and occasionally a 5-mark descriptive answer.
| Year | Question asked | Marks | Notes page to revise |
|---|---|---|---|
| 2025 | Distinguish between Crude Birth Rate and Crude Death Rate + name three components of population change | 3 + 1 | Page 3 |
| 2024 | Explain the three stages of Demographic Transition Theory with a diagram | 5 | Page 4 |
| 2023 | Explain geographical factors influencing population distribution with examples | 5 | Page 2 |
| 2022 | Distinguish between push and pull factors of migration + define emigration | 3 + 1 | Page 4 |
| 2021 | What is population density? How is it calculated? Give an example. | 3 | Page 1 |
The Demographic Transition Theory question and the factors-of-distribution question are the most consistent, so Page 2 and Page 4 are the two highest-priority pages for revision.
Other Resources for Class 12 Geography Chapter 2 The World Population
Pair these handwritten notes with the matching NCERT Solutions, typed Notes and the official NCERT Book chapter.
| Resource | What it covers | Open |
|---|---|---|
| Handwritten Notes | Topper's handwritten revision pages for last-mile board exam prep. | You are here |
| NCERT Solutions | Step-by-step answers to all NCERT exercise questions on world population distribution and growth. | Class 12 Geography Chapter 2 NCERT Solutions |
| Notes | Concept-first typed revision notes with definitions, formulas, factor tables and demographic transition explanation. | Class 12 Geography Chapter 2 Notes |
| NCERT Book PDF | Official NCERT Fundamentals of Human Geography Chapter 2 textbook in PDF form. | Class 12 Geography Chapter 2 NCERT Book PDF |
| Subject Hub | All chapters of Class 12 Geography with every resource in one place. | Class 12 Geography Subject Hub |
All Chapters Handwritten Notes for Class 12 Fundamentals of Human Geography
Related Links: Use the table below to open the handwritten notes for the other chapters of Class 12 Fundamentals of Human Geography.
| Chapter | Topic | Handwritten Notes link |
|---|---|---|
| Chapter 1 | Human Geography: Nature and Scope | Class 12 Geography Chapter 1 Handwritten Notes |
| Chapter 2 | The World Population: Distribution, Density and Growth | You are here |
| Chapter 3 | Human Development | Class 12 Geography Chapter 3 Handwritten Notes |
| Chapter 4 | Primary Activities | Class 12 Geography Chapter 4 Handwritten Notes |
| Chapter 5 | Secondary Activities | Class 12 Geography Chapter 5 Handwritten Notes |
| Chapter 6 | Tertiary and Quaternary Activities | Class 12 Geography Chapter 6 Handwritten Notes |
| Chapter 7 | Transport and Communication | Class 12 Geography Chapter 7 Handwritten Notes |
| Chapter 8 | International Trade | Class 12 Geography Chapter 8 Handwritten Notes |
World Population Class 12 Handwritten Notes FAQs
Ques. What are these world population class 12 handwritten notes meant to be used for?
Ans. The world population class 12 handwritten notes are a topper's handwritten revision file: they compress the full NCERT Chapter 2 of Class 12 Fundamentals of Human Geography into 4 to 5 pages of factor lists, formula boxes, migration tables and the Demographic Transition Model drawn by hand. Students typically use the file for last-mile revision in the 24 hours before the board paper, paired with the typed Notes PDF for concept building and the NCERT Solutions PDF for answer-writing practice.
Ques. How are handwritten notes different from the typed notes for this chapter?
Ans. The typed Class 12 Geography Chapter 2 notes carry deeper prose around each factor and theory, detailed explanations and map-based context, and run 6 to 8 pages long. The handwritten notes compress that content down to formula boxes, factor lists and hand-drawn diagrams alone, sit at 4 to 5 pages, and lean on visual recall (ruler-drawn boxes, arrow-tagged stage diagrams, colour corrections) rather than typed explanations. The two files are designed to be used together: read the typed Notes first for concept building, then move to the handwritten file for the second and third revision passes.
Ques. What is the formula for population density in Class 12 Geography?
Ans. The formula for population density is: Density of Population = Population divided by Area (in square kilometres), and the result is expressed in persons per sq km. For example, if Region X has an area of 100 sq km and a population of 1,50,000 persons, its density is 1,50,000 divided by 100 = 1,500 persons per sq km. The handwritten notebook draws this formula inside a ruler-drawn box on Page 1, with a worked-out numerical example written below it so students can see the full calculation in one glance.
Ques. What are the three components of population change in Class 12 Geography?
Ans. The three components of population change are births, deaths and migration. Births and deaths are measured using the Crude Birth Rate (CBR) and Crude Death Rate (CDR) formulas respectively, both expressed per thousand of population. Migration refers to the movement of people from one place to another, either into a region (in-migration, producing immigrants) or out of a region (out-migration, producing emigrants). The actual growth of population = Births minus Deaths plus In-Migration minus Out-Migration. All three components and their formulas are covered in the handwritten notebook on Page 3.
Ques. What is the Demographic Transition Theory for Class 12 Geography?
Ans. The Demographic Transition Theory says that population of any region changes from high births and high deaths to low births and low deaths as society moves from rural agrarian and illiterate to urban industrial and literate. It has three stages: Stage 1 (High Fluctuating - both CBR and CDR high, slow growth, example: rainforest tribes), Stage 2 (Early Expanding - CDR falls, CBR stays high, maximum growth, example: Bangladesh, Kenya), and Stage 3 (Low Fluctuating - both CBR and CDR low, stable population, example: Japan, Canada, USA). The handwritten notes draw the full 3-stage graph on Page 4 with the CBR and CDR lines clearly labelled.
Ques. What are push and pull factors of migration in Class 12 Geography?
Ans. Push factors make the place of origin seem less attractive and include unemployment, poor living conditions, political turmoil, unpleasant climate, natural disasters, epidemics and socio-economic backwardness. Pull factors make the place of destination seem more attractive and include better job opportunities and living conditions, peace and stability, security of life and property, and pleasant climate. The handwritten notes present both sets of factors in a two-column table on Page 4, making it easy to write a compare-and-contrast answer in the board exam.
Ques. Are these world population class 12 handwritten notes enough for the CBSE board exam?
Ans. The handwritten notes are sufficient for the concept-recall component of Chapter 2, covering formulas, factors, migration types and the Demographic Transition Theory. Students aiming for 90-plus in CBSE Class 12 Geography should pair the handwritten file with the matching NCERT Solutions PDF for full answer-writing practice and the typed Notes PDF for deeper conceptual understanding. All three resources are linked in the cross-resource table on this page. For map-based questions, students should also practise on the outline map of the world using the Map Skill exercise in the NCERT textbook.
Ques. How long does it take to revise these world population class 12 notes?
Ans. The full handwritten notes file is designed for a 20-minute first revision pass, a 12-minute targeted pass and a 7-minute final pass right before the exam. Students who already have the chapter covered can finish the full file in under 18 minutes. Page 2 (factors influencing distribution) and Page 4 (Demographic Transition Model and migration) together take 10 to 12 minutes to revise and cover roughly 6 to 8 of the 8 to 10 marks the chapter typically carries in the CBSE Class 12 Geography board paper.
Ques. Can these handwritten notes be printed and pasted in a physical revision notebook?
Ans. Yes, and that is the recommended use pattern. The PDF is rendered at 150 DPI and sized for A4 printing, with each page sitting cleanly inside a standard ruled notebook page. Toppers in the 2026 Class 12 Geography student poll reported that printing the pages and pasting them inside the physical revision notebook helped them recall the Demographic Transition stages faster in the exam hall, because the hand-drawn graph matches the muscle memory of drawing it in the answer script.
Ques. Is the Class 12 Geography syllabus for this chapter changing in 2026-27?
Ans. No major changes in 2026-27. The Fundamentals of Human Geography Chapter 2 structure is unchanged for the current cycle, and the CBSE marking scheme continues to reward concept-based answers with specific examples (Katanga copper belt, Kobe-Osaka, Ganga plains). These world population class 12 handwritten notes for the 2026-27 cycle are aligned to the unchanged NCERT textbook (Reprint 2026-27) and the latest CBSE sample paper released for the 2026 boards.
Ques. What is the distribution of world population according to Class 12 NCERT?
Ans. According to the NCERT Class 12 Geography textbook, world population is unevenly distributed. About 90 per cent of the world's population lives in only about 10 per cent of its land area. The 10 most populous countries contribute about 60 per cent of the world's total population, and 6 of those 10 countries are located in Asia. Regions that are densely populated include the Ganga-Brahmaputra plains, the Nile valley, North-East USA and Europe. Regions that are sparsely populated include the polar regions, hot and cold deserts, equatorial rainforests and the Atacama desert.



Comments