



Exams Prep Master
A cumulative frequency in statistics is referred to as the total of frequencies, that are distributed over different class intervals. Meaning, the data and the total are represented in the form of a table wherein the frequencies are distributed according to the class interval. You might have heard about ‘frequency’ while studying statistics. It is a way of collecting raw data and then representing them in a proper and easier format. These data can be represented by using different types of graphs, tables, pie charts, etc. Frequency is a type of data that repeats itself after a certain point of time and the number of times the item is repeated is its frequency. Here, we will be learning Cumulative frequency distribution in detail and discuss some important questions.
| Table of Content |
Key takeaways: Cumulative Frequency, more than ogive, less than ogive, statistics
Define Cumulative Frequency
[Click Here for Sample Questions]
Cumulative Frequency is referred to continuous data which is represented in an easier and more understandable form. It is a sum of all the frequencies, where the first frequency of the first class interval is added to the frequency of the second class interval and then their sum is added to the third class interval and it goes on.
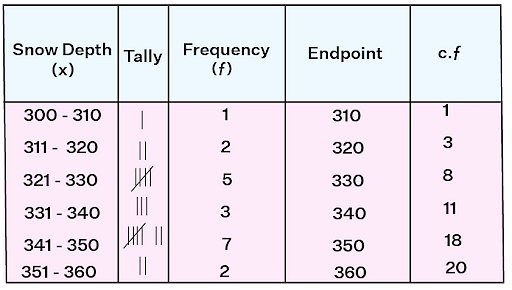
In short, cumulative frequency is used to identify the number of observations that lie above or below a certain frequency in a given data.
Also read: Chance and Probability
Types of Cumulative Frequency
[Click Here for Sample Questions]
The cumulative frequency can be divided into two different parts which are:
- Less than Cumulative Frequency Distribution:
A Less than cumulative frequency distribution is obtained by adding all the frequencies of the previous classes with the class they are written against successively. In this type of ogive, the graph begins from the lowest and goes towards the highest.
- More than cumulative Frequency Distribution :
The more than cumulative frequency distribution is obtained by determining the cumulative frequency from the beginning of the higher class to the lower class. It is also known as 'Greater than Cumulative Frequency'.
Also read: Frequency Polygon
Graphical Representation of Cumulative Frequency
[Click Here for Sample Questions]
Graphical representation of any type of raw data makes it easy to understand and convenient for the reader to compare. We can use table, bar-graph, frequency polygon, or histograms.
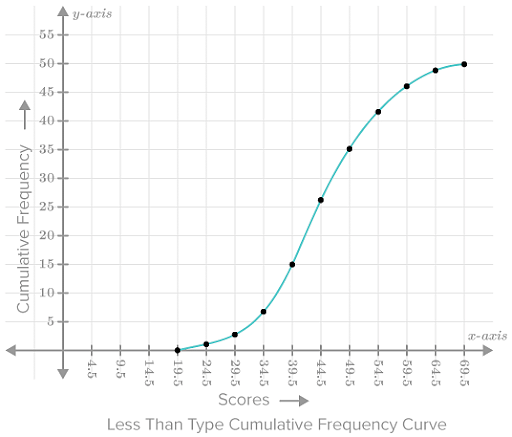
It can be plotted in two types:
- Ogive of a 'Less than type'
- Ogive of a 'More than type'
Steps to construct the Less than type Cumulative frequency Curve:
STEP 1: Mark the upper limits on the x-axis (Horizontal Axis) and the cumulative frequencies on the y-axis (Vertical Axis)
STEP 2: Plot all the points in the coordinate axis and then join all the points.
STEP 3: After joining the points, you will get a smooth curve starting from the base of the graph to the highest point.
For Instance, given below is a less than type graph.

Steps to construct the More than type Cumulative frequency Curve:
STEP 1: Mark the lower limits on the x-axis (Horizontal Axis) and the cumulative frequencies on the y-axis (Vertical Axis)
STEP 2: Plot all the points in the coordinate axis and then join all the points.
STEP 3: After joining the points, you will get a smooth curve starting from the top of the graph to the lowest point.
For Instance, given below is a more than type graph.

Also, if these two types of graphs are drawn in the same plane and they have intersected, then the point of intersection of these curves will give the value of the median of the given data. For Instance,

Importance of Cumulative Frequency Distribution
[Click Here for Sample Questions]
Cumulative Frequency is an important feature of statistics. It is often used in representing the raw data in a better way. It helps in understanding the given data in a proper and detailed way. It helps in improving research. There are so many events happening in real life whose statistics.
Also Read: Relation between Mean, Mode, and Median
Things to Remember
- Cumulative Frequency Distribution is a Statistical way of representing data, with its help the analysis process can be tabulated with ease.
- Cumulative Frequency Distribution helps in shortening the lengthy data and the tiring process as it brings the repeated data together. The number of times the data is being repeated is known as its frequency.
- The cumulative frequency curve is a graphical presentation of the Cumulative frequency, which is known as Ogive.
- Ogives can be of two types either it can be of 'more than type' or 'less than type'. Please note: We use the upper-class limit to draw the less than ogive and the lower class limit to make the more than ogive.
- We can plot both the more than and the less than ogive in a graph, their point of intersection is known as the Median of the data.
Also read: Measures of Dispersion
Sample Questions
Ques: From the given data make a frequency table. (4 marks)
| A,C,F,F,W,A,C,F,F,F,W,A,A,A,W,W,W |
Ans:
| Data | Frequency |
|---|---|
| A | 5 |
| C | 2 |
| F | 5 |
| W | 5 |
Ques: Construct a Cumulative Frequency distribution table of the given data: (4 marks)
| Class Interval | frequency |
|---|---|
| 0-8 | 9 |
| 8-16 | 13 |
| 16-24 | 12 |
| 24-32 | 7 |
| 32-40 | 15 |
Ans:
| Class Interval | Cumulative Frequency |
|---|---|
| 0-8 | 9 |
| 8-16 | 22 |
| 16-24 | 34 |
| 24-32 | 41 |
| 32-40 | 56 |
Ques: From the given graph, calculate frequency between the ranges 400 to 1200:  (2 marks)
Ans: From the curve, check the corresponding values for the class intervals between the given frequencies:
Between 400 to 1200 = 20-2= 8
hence, the frequency in the given class intervals is 8.
Ques: Draw a less than type ogive for the given data and also find the median of the data. (4 marks)
Given below is the age distribution of malaria patients who are admitted to the hospital for a week in the month of October.
| Age (In years) | No. of Patients |
|---|---|
| less than 10 | 30 |
| less than 20 | 35 |
| less than 30 | 55 |
| less than 40 | 69 |
| less than 50 | 90 |
| less than 60 | 115 |
| less than 70 | 135 |
| less than 80 | 150 |
Ans:

Ques: Following is a table which shows the income of 50 workers in a factory. Draw both types of curves that are 'more than type' and 'less than type' ogives for the data. (4 marks)
| Daily Income | Number of Workers |
|---|---|
| 100-120 | 12 |
| 120-140 | 14 |
| 140-160 | 8 |
| 160-180 | 6 |
| 180-200 | 10 |
Ans:
| Daily Income (Less than type) | No. of Workers (C.F.) | Daily Income (More than type) | No.of workers(C.F.) |
|---|---|---|---|
| Less than 120 | 12 | More than 100 | 50 |
| Less than 140 | 26 | More than 120 | 38 |
| Less than 160 | 34 | More than 140 | 24 |
| Less than 180 | 40 | More than 160 | 16 |
| Less than 200 | 50 | More than 180 | 10 |

Ques: What is Meant by Cumulative frequency? (2 marks)
Ans: Cumulative Frequency is the total number of frequencies in which the first class interval is added to the frequency of the second interval and then their sum to the next frequency and so on.
Ques: What is Cumulative Frequency Distribution? (2 marks)
Ans: It is a table that shows the cumulative frequency which is distributed all over different classes that are called the cumulative frequency table or the cumulative frequency distribution.
Ques: Describe the Cumulative Frequency Curve. (2 marks)
Ans: Cumulative Frequency Distribution is a statistical way of representing any type of data, it helps in the tabulation of data in an easy and analytical way. A simple polygon graph is drawn from the cumulative frequency distribution which is called a cumulative frequency curve. In short, it is also known as Ogive which is also further divided into two types that are 'more than type' and other is 'less than type'.
Ques: How is Relative Frequency different from Cumulative Frequency? (2 marks)
Ans: If we put it simply, frequency is the total number of times a particular value is occurring in the entire data. whereas Relative frequency can be expressed in decimal form and it also tells us the relative times that a value has occurred in the given data. but when we are talking about cumulative frequency, it involves the sum of all the frequencies from the first interval till the ending to derive a class interval.
Also read: Frequency Distribution
Previous Year Questions
Ques: Convert The distribution given below to a less than type cumulative frequency distribution. (2018) (4 marks)
| Daily Income | 100-120 | 120-140 | 140-160 | 160-180 | 180-200 |
| Number of workers | 12 | 14 | 8 | 6 | 10 |
Ans:
| Daily Income | Frequency | Income Less than cumulative | Cumulative freq. |
|---|---|---|---|
| 100-120 | 12 | 120 | 12 |
| 120-140 | 14 | 140 | 26 |
| 140-160 | 8 | 160 | 34 |
| 160-180 | 6 | 180 | 40 |
| 180-200 | 10 | 200 | 50 |
Ques: Find the median for the given data. Also, draw a 'less than ogive' of the given data. (2020) (4 marks)
| Age(in years) | 00-10 | 10-20 | 20-30 | 30-40 | 40-50 | 50-60 | 60-70 |
| No. of Persons | 5 | 15 | 20 | 25 | 15 | 11 | 9 |
Ans:
| Age (in years) | Number of persons |
|---|---|
| 10 | 5 |
| 20 | 20 |
| 30 | 40 |
| 40 | 65 |
| 50 | 80 |
| 60 | 91 |
| 70 | 100 |
Median =100/2=50

Ques: Draw a 'less than cumulative frequency curve' (ogive). And hence find the mean of the data. (2019) (4 marks)
| Marks | No. of Students | Upper Limit (less than) | Cumulative Frequency |
|---|---|---|---|
| 00-05 | 2 | 5 | 2 |
| 05-10 | 5 | 10 | 7 |
| 10-15 | 6 | 15 | 13 |
| 15-20 | 2 | 20 | 21 |
| 20-25 | 10 | 25 | 31 |
| 25-30 | 25 | 30 | 56 |
| 30-35 | 20 | 35 | 76 |
| 35-40 | 18 | 40 | 94 |
| 40-45 | 4 | 45 | 98 |
| 45-50 | 2 | 50 | 100 |
Ans:

Ques: Find the values of a and b if the median of the given data is is 31. (4 marks)
| Classes | Frequency |
|---|---|
| 00-10 | 5 |
| 10-20 | a |
| 20-30 | 6 |
| 30-40 | b |
| 40-50 | 6 |
| 50-60 | 5 |
| TOTAL | 40 |
Ans:
| Classes | Frequency | Cumulative Frequency |
|---|---|---|
| 00-10 | 5 | 5 |
| 10-20 | a | 5+a |
| 20-30 | 6 | 11+a |
| 30-40 | b | 11+a+b |
| 40-50 | 6 | 17+a+b |
| 50-60 | 5 | 22+a+b |
| TOTAL | 40 |
=> a+b+22= 40
a+b= 18 -----------------(1)
n/2= 40/2=20
Median= 31 (Given)
=>Median Class= 30-40;
So, the median = [l+ ((n/2-c.f.)/f)*h];
31= 30+ [{(20-11-a)/(18-a)}*10]
=> 18-a=90-10a;----------- (from equation 1)
9a=72;
a= 8;
Hence, the values of a and b are 8 and 10 respectively.
Ques: Draw the ogives for the given data: (2017) (4 marks)
(a) More than ogive
(b) Less than ogive
Also, find the median of the data.
| Class | Frequency |
|---|---|
| 00-10 | 8 |
| 10-20 | 7 |
| 20-30 | 5 |
| 30-40 | 10 |
| 40-50 | 5 |
Ans:
| Classes (less than) | C.F. | Classes (more than) | C.F. |
|---|---|---|---|
| less than 10 | 8 | more than 00 | 35 |
| less than 20 | 15 | more than 10 | 27 |
| less than 30 | 20 | more than 20 | 20 |
| less than 40 | 30 | more than 30 | 15 |
| less than 50 | 35 | more than 40 | 05 |

More Relatable topics to read:



Comments