



Education Journalist | Study Abroad Lead
Standard Normal Distribution, also known as z-distribution, is a particular normal distribution whose mean value is zero and the value of standard deviation equals one. The standard normal distribution has a zero at the centre and the standard deviation indicates how far a measurement deviates from the mean. The mean of the standard normal distribution is always equivalent to its median and mode. The random variable with the standard normal distribution has been designated by the letter z. Therefore the standard normal distribution curve units are designated by z and are known as z-values or z-scores. The standard score also known as a z-score is the random variable of a standard normal distribution.
Key Terms: Standard Normal Distribution, Normal Distribution, Standard Normal Curve, Standard Normal Distribution Table, Z-Score, Mean, Standard Deviation, Random Variable, Probability Distribution
What is Standard Normal Distribution?
[Click Here for Sample Questions]
Standard Normal Distribution is a kind of normal distribution that appears when a normal random variable has a mean value equals to zero and the value of standard deviation equals one.
The random variable of a standard normal curve is referred to as the standard score or a Z-score. The following formula can be used to convert any normal random variable X into a z score:
Z = (X- μ)/σ
Where,
- X = normal random variable
- μ = mean of X
- σ = standard deviation of X.
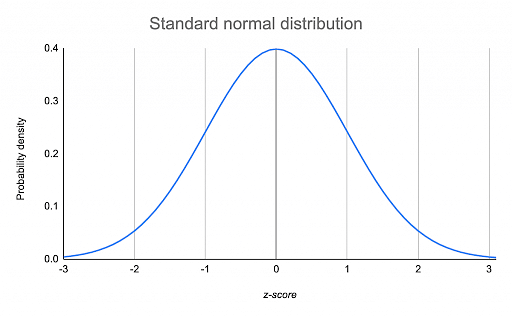
Standard Normal Distribution
Read More: Mean and Variance of Random Variable
Normal Distribution VS Standard Normal Distribution
[Click Here for Sample Questions]
The standard normal distribution is unimodal and symmetrically distributed with a bell-shaped curve. Whereas the normal distribution on the other hand can have any mean and standard deviation. In a typical normal distribution, the mean and standard deviation are always fixed. Every normal distribution is a stretched or squeezed variant of the standard normal distribution that has been moved horizontally right or left.
The curve centre is determined by the mean. The curve travels right when the mean is increased and left when the mean is decreased. The curve is stretched by the standard deviation. A narrow curve is produced by a small standard deviation while a wide curve is produced by a large standard deviation.
Read More: Probability Distribution
Standard Normal Distribution Table
[Click Here for Sample Questions]
The standard normal distribution table is used to calculate the probability of a regularly distributed random variable Z, whose mean is 0 and the value of standard deviation equals 1. The normal distribution, also known as Gaussian distribution, is a persistent probability distribution. It is applicable for only positive values of z.
A standard normal distribution table comes into use to determine the area under the bend (f(z)) to find out the probability of a specific range of distribution. Since its shape looks like a bell, the normal distribution density function f(z) is called the Bell Curve.
If one has to discover the probability of a value that is not exactly or more than a fixed positive z value, it can be found out by a standard normal distribution table. This is known as area Φ.
A standard normal distribution table basically displays a cumulative probability linked with a particular z-score. The rows of the standard normal distribution table represent the whole number and tenth place of the z-score. The columns of the standard normal distribution table represent the hundredth place. The cumulative probability (from –∞ to the z-score) are visible in the cell of the table.
For instance, a part of the standard normal table has been given below. In order to find the cumulative probability of a z-score equal to -1.21, cross-reference the row containing -1.2 of the table with the column holding 0.01. Here, the table shows and explains that the probability that a standard normal random variable will be less than -1.21 is 0.1131; i.e, P(Z < -1.21) = 0.1131. This table is also known as a z-score table.
| z | 0.00 | 0.01 | 0.02 | 0.03 | 0.04 | 0.05 |
| -3.0 | 0.0013 | 0.0013 | 0.0013 | 0.0012 | 0.0012 | 0.0011 |
| .... | .... | .... | .... | .... | .... | .... |
| -1.4 | 0.0808 | 0.0793 | 0.0778 | 0.0764 | 0.0749 | 0.0735 |
| -1.3 | 0.0968 | 0.0951 | 0.0934 | 0.0918 | 0.0901 | 0.0885 |
| -1.2 | 0.1151 | 0.1131 | 0.1112 | 0.1093 | 0.1075 | 0.1056 |
| .... | .... | .... | .... | .... | .... | .... |
| 3.0 | 0.9987 | 0.9987 | 0.9987 | 0.9988 | 0.9988 | 0.9989 |
Area Under Standard Normal Curve
[Click Here for Sample Questions]
The area under the curve of the graph of an equation can be obtained by directly manipulating the equation's individual terms such as by integrating the curve between the x-coordinates of interest. The normal curve requires you to look up one or two integers in a table known as z-values. The area under the standard normal curve is given the value 1.0. So, all limited areas under the standard normal curve are decimal numbers between 0 and 1 that may be easily transformed to percentages by multiplying by 100.
Z-Score table allow reading of the score up to the 100th place in order to supply areas to four or five specific digits. The hundredth place can be found by placing the tenth place on the left axis and reading across the specific row.
This shows why the proportion of the area to the left of z = -2.58 is .00494.
Read More: Probability & Statistics
Area of Standard Normal Distribution
[Click Here for Sample Questions]
In Graphical form, the probability of Z not exactly “a” being Φ(a), as considered from the standard normal distribution table, is shown as follows

P(Z < –a)
As we have discussed above, the standard normal distribution table just provides us with the probability to values, not particularly a positive z value (i.e., z values on the right-hand side of the mean). Thus, how would one ascertain the probability below a negative z value (as given below)?

P(Z > a)
The probability of P(Z > a) is given as 1 – Φ(a). One can understand the reasoning behind this by having a look at the illustration shown below:

We know that Φ(a), and comprehend that the total area under the standard normal curve is 1 so by numerical conclusion P(Z > a) is given as 1 Φ(a).
P(Z > –a)
The probability of P(Z > –a) is P(a), which is given as Φ(a). In order to understand this, one has to value the symmetry of the standard normal distribution curve. We have to make an effort to discover the region below:

If this area is the particular region we need,
We can easily observe that this is the same size area as the area we are looking for. We can get this area straight from the standard normal distribution table
P(Z < a)
In this manner, the P(Z > –a) is P(Z < a), which is Φ(a).
Characteristics of Standard Normal Distribution
[Click Here for Sample Questions]
A standard normal distribution z-score is a standard score that specifies how many standard deviations are away from the mean an individual value (x) lies:
The x-value is more than the mean when the z-score is positive, the x-value is less than the mean when the z-score is negative and when the z-score is zero then the x-value equals the mean.
The mean and standard deviation are two values that can be used to define the distribution.
Read More: Difference Between Variance and Standard Deviation
Uses of Standard Normal Distribution
[Click Here for Sample Questions]
- The standard normal distribution is a technique for converting a normal distribution into numbers.
- The standard normal distribution to quickly assess the various values occurring in our distribution or to compare data sets with different means and standard deviations.
- The amount of standard deviations a data point falls above or below the mean is represented by the z-score of the standard normal distribution
Things to Remember
- Standard Normal Distribution is a type of normal distribution that occurs when a normal random variable has a mean value that is equal to zero and the value of standard deviation is equal to one.
- The random variable of a standard normal distribution is also referred to as the standard score or a z-score.
- The formula used to transform every normal random variable X into a z score is z = (X – μ) / σ.
- A standard normal distribution table is used in order to present a cumulative probability linked with a particular z-score.
Sample Questions
Ques. There are some computers in an office in which the time period between charges of the battery is normally distributed with a mean of 50 hours and a standard deviation of 15 hours. Anjali is the owner of one of these given computers and wants to know the probability that the time period will be between 50 and 70 hours. (5 Marks)
Ans. Let us assume x be the random variable that represents the time period
Mean μ= 50
Standard deviation σ = 15
Here we need to calculate the probability x that is between 50 and 70 or P( 50< x < 70)
Using the transformation equation,
z = (X – μ) / σ
For x = 50 , z will be (50 – 50) / 15 = 0
For x = 70 , z will be (70 – 50) / 15 = 1.33
P( 50< x < 70) = P( 0< z < 1.33)
=(area to the left of z = 1.33) –(area to the left of z = 0)
From the table, we get the values
P( 0< z < 1.33) = 0.9082 – 0.5 = 0.4082
Thus, the probability that Anjali’s computer has a time period between 50 and 70 hours is equal to 0.4082.
Ques. What do you mean by empirical rule? (3 Marks)
Ans. The empirical rule, also known as the 68-95-99.7 rule indicates where the majority of the values in a normal distribution are found:
- 68 % of the data lies within 1 standard deviation of the mean
- 95 % of the data lies falls within 2 standard deviations of the mean
- 99.7 % of the data lies within 3 standard deviations of the mean
Ques. What are the applications of standard normal distribution in the real world? (5 Marks)
Ans. The application of standard normal distribution in the real world is when you can use the standard normal distribution to figure out which subjects you did well and which subjects you need to work harder on because of your low grades. You may believe you are better or worked harder in the topic in which you received high marks after you know the subject you scored highest. If you acquire a score that is a particular number of standard deviations above the mean in a topic in which you received high marks you can only say that you are better in that subject. The standard deviation indicates how closely your data clusters around the mean.
Ques. What is the Percent of Population Between 0 and 0.45? (3 Marks)
Ans. Begin reading from the 0.4 rows and continue until you reach 0.45, where you will find the value 0.1736 and also 0.1736 equals 17.36%.
So 17.36% of the population has a Standard Deviation from the Mean of 0 to 0.45. The same table can be used for values in either direction because the curve is symmetrical, hence a negative 0.45 has an area of 0.1736.
Ques. What is the difference between z- distribution and t- distribution? (3 Marks)
Ans. The t-distribution is more conservative than the ordinary normal distribution in this distribution you need to include more range of data to achieve the same degree of confidence or statistical significance. While z-distribution gives less probability of the distribution as compared to t- distribution.
Ques. The Graduate Management Admission Council GMAT examination is required for admission to most graduate business schools. The GMAT score distribution is roughly normal, with a mean of 527 and a standard deviation of 112. (5 Marks)
(1) What are the chances of a candidate getting a GMAT score of 500 or higher?
(2) How high must a candidate's GMAT score be in order to be in the top 5% of the class?
Ans. (1) Given, μ= 527, X= 500, σ = 112
Z = (X- μ)/σ
Z = (500- 527)/112
Z = - 0.24107
P(X>500) = P(Z > -0.24)
= 1 – 0.4052 = 0.5948
(2) Given: μ = 528, σ = 112
P(X > ?) = 0.05 = P(Z > ?) = 0.05
P(Z < ?) = 1 - 0.05 = 0.95 = Z = 1.645
X = 527 + 1.645(112)
X = 527 + 184.24
X = 711.24
Ques. The Edwards' Theater franchise has conducted research into how much money moviegoers spend on concessions. The expenditure distribution was found to be essentially normally distributed, with a mean of $4.11 and a standard deviation of $1.37, according to the study. What percentage of customers will buy concessions for less than $3.00? (3 Marks)
Ans. Given; μ = 4.11, X = 3, σ = 1.37
(Normal Distribution) Z = (X - μ)/σ
Z = (3 - 4.11)/1.37
Z = -0.81021
P(X < 3.00)
P(Z < -0.81) = 0.2090
⇒ 20.9%
Related Links:



Comments