



Content Curator
T Distribution (also called the student T Distribution) is a distribution family that looks almost like a normal distribution curve, but shorter and flatter. The most commonly distributed data is those with a ‘bell-shaped curve’ or a ‘U-shaped curve’. The distribution of T and the test of t make part of the calculations absurd. Moreover, the distribution table is usually an illustration of the frequencies related to the different possible outcomes in the sample. Each entry in such a table includes the frequency of calculation related to the occurrence of the values involved in a region or group. Both the quality and quantity variables can be represented by a frequency distribution table.
Read More: Concepts in Probability and Statistics
| Table of Content |
Key Takeaways: T Distribution Table, Sample Size, Normal Distribution, Degrees of Freedom.
What is T Distribution?
[Click Here for Sample Questions]
T Distribution (also called the student T Distribution) is a distribution family that looks almost like a normal distribution curve, but shorter and flatter. The T-distribution is used instead of the normal distribution if you have small samples. The larger the sample size, the more the T distribution looks like the normal distribution. In fact, in samples larger than 20, the distribution is almost exactly the same as the normal distribution.
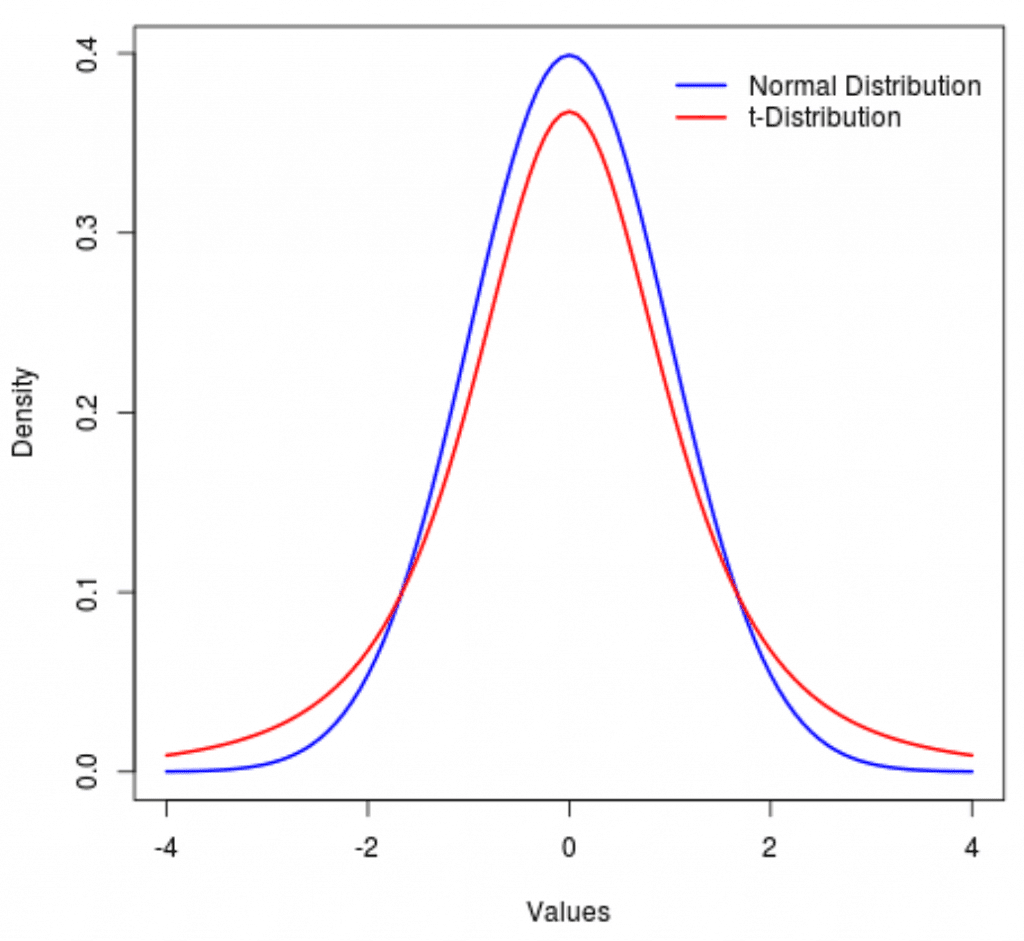
T Distribution
The purpose of the T distribution is used to evaluate the hypothesis and whether it should be accepted or rejected. It is used to estimate the number of people that are usually distributed. It is usually used if the sample size is small (not less than 20) and where the standard deviation is unknown. It is used to calculate the probability by sample definition.
Read More:
| Related Articles | ||
|---|---|---|
| Variance | Mean and Variance of Random Variable | |
| Measures of Dispersion | Statistics | |
T Distribution Formula
[Click Here for Sample Questions]
Formula for T Distribution is –
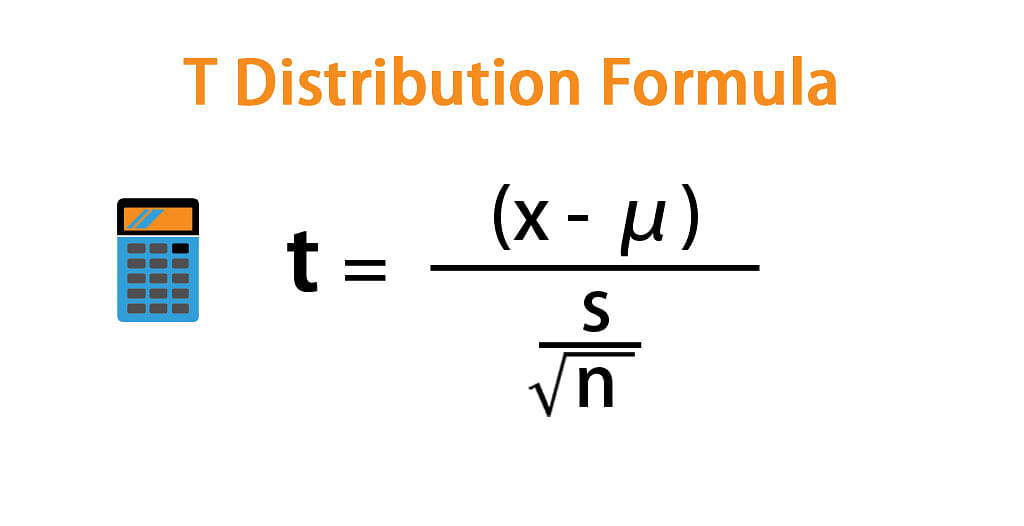
T Distribution Formula
The T Distribution measures the state of normal distribution. It measures a definite sample size with a particular degree of freedom.
Also read: Variance
T Distribution Table
[Click Here for Sample Questions]
T-distribution table is used to determine the values associated with z-scores. We use this table to find the approximate value of t. The distribution table of T indicates the probability that t takes values from a given value. Chances are the location of the t-curve between the t-distribution links, the given value, and the infinity.
In the T Distribution table below, the critical values are defined for degrees of freedom (df) –
| df/α | 0.9 | 0.5 | 0.3 | 0.2 | 0.1 | 0.05 | 0.02 | 0.01 | 0.001 |
| 1 | 0.158 | 1 | 2 | 3.078 | 6.314 | 12.706 | 31.821 | 64 | 637 |
| 2 | 0.142 | 0.816 | 1.386 | 1.886 | 2.92 | 4.303 | 6.965 | 10 | 31.598 |
| 3 | 0.137 | 0.765 | 1.25 | 1.638 | 2.353 | 3.182 | 4.541 | 5.841 | 12.929 |
| 4 | 0.134 | 0.741 | 1.19 | 1.533 | 2.132 | 2.776 | 3.747 | 4.604 | 8.61 |
| 5 | 0.132 | 0.727 | 1.156 | 1.476 | 2.015 | 2.571 | 3.365 | 4.032 | 6.869 |
| 6 | 0.131 | 0.718 | 1.134 | 1.44 | 1.943 | 2.447 | 3.143 | 3.707 | 5.959 |
| 7 | 0.13 | 0.711 | 1.119 | 1.415 | 1.895 | 2.365 | 2.998 | 3.499 | 5.408 |
| 8 | 0.13 | 0.706 | 1.108 | 1.397 | 1.86 | 2.306 | 2.896 | 3.355 | 5.041 |
| 9 | 0.129 | 0.703 | 1.1 | 1.383 | 1.833 | 2.263 | 2.821 | 3.25 | 4.781 |
| 10 | 0.129 | 0.7 | 1.093 | 1.372 | 1.812 | 2.228 | 2.764 | 3.169 | 4.587 |
| 11 | 0.129 | 0.697 | 1.088 | 1.363 | 1.796 | 2.201 | 2.718 | 3.106 | 4.437 |
| 12 | 0.128 | 0.695 | 1.083 | 1.356 | 1.782 | 2.179 | 2.681 | 3.055 | 4.318 |
| 13 | 0.128 | 0.694 | 1.079 | 1.35 | 1.771 | 2.16 | 2.65 | 3.012 | 4.221 |
| 14 | 0.128 | 0.692 | 1.076 | 1.345 | 1.761 | 2.145 | 2.624 | 2.977 | 4.14 |
| 15 | 0.128 | 0.691 | 1.074 | 1.341 | 1.753 | 2.131 | 2.602 | 2.947 | 4.073 |
| 16 | 0.128 | 0.69 | 1.071 | 1.337 | 1.746 | 2.12 | 2.583 | 2.921 | 4.015 |
| 17 | 0.128 | 0.689 | 1.069 | 1.333 | 1.74 | 2.11 | 2.567 | 2.898 | 3.965 |
| 18 | 0.127 | 0.688 | 1.067 | 1.33 | 1.734 | 2.101 | 2.552 | 2.878 | 3.922 |
| 19 | 0.127 | 688 | 1.066 | 1.328 | 1.729 | 2.093 | 2.539 | 2.861 | 3.883 |
| 20 | 0.127 | 0.687 | 1.064 | 1.325 | 1.725 | 2.086 | 2.528 | 2.845 | 3.85 |
| 21 | 0.127 | 0.686 | 1.063 | 1.323 | 1.721 | 2.08 | 2.518 | 2.831 | 3.819 |
| 22 | 0.127 | 0.686 | 1.061 | 1.321 | 1.717 | 2.074 | 2.508 | 2.819 | 3.792 |
| 23 | 0.127 | 0.685 | 1.06 | 1.319 | 1.714 | 2.069 | 2.5 | 2.807 | 3.767 |
| 24 | 0.127 | 0.685 | 1.059 | 1.318 | 1.711 | 2.064 | 2.492 | 2.797 | 3.745 |
| 25 | 0.127 | 0.684 | 1.058 | 1.316 | 1.708 | 2.06 | 2.485 | 2.787 | 3.725 |
| 26 | 0.127 | 0.684 | 1.058 | 1.315 | 1.706 | 2.056 | 2.479 | 2.779 | 3.707 |
| 27 | 0.137 | 0.684 | 1.057 | 1.314 | 1.703 | 2.052 | 2.473 | 2.771 | 3.69 |
| 28 | 0.127 | 0.683 | 1.056 | 1.313 | 1.701 | 2.048 | 2.467 | 2.763 | 3.674 |
| 29 | 0.127 | 0.683 | 1.055 | 1.311 | 1.699 | 2.045 | 2.462 | 2.756 | 3.649 |
| 30 | 0.127 | 0.683 | 1.055 | 1.31 | 1.697 | 2.042 | 2.457 | 2.75 | 3.656 |
| 40 | 0.126 | 0.681 | 1.05 | 1.303 | 1.684 | 2.021 | 2.423 | 2.704 | 3.551 |
| 80 | 0.126 | 0.679 | 1.046 | 1.296 | 1.671 | 2 | 2.39 | 2.66 | 3.46 |
| 120 | 0.126 | 0.677 | 1.041 | 1.289 | 1.658 | 1.98 | 2.358 | 2.617 | 3.373 |
| Infinity | 0.126 | 0.674 | 1.036 | 1.282 | 1.645 | 1.96 | 2.326 | 2.576 | 3.291 |
Things To Remember
[Click Here for Sample Questions]
- T Distribution (also called the student T Distribution) is a distribution family that looks almost like a normal distribution curve.
- T Distribution is a mathematical method of testing or calculating the definition of a set of commonly distributed data.
- T Distribution is used in hypothesis testing.
- T-distribution table is used to determine the values associated with z-scores.
Read More:
Sample Questions
Ques. Give two properties of T Distribution. (2 marks)
Ans.
- It has a U-shaped curve and symmetry similar to regular distribution.
- The distribution status of T varies with the change in degrees of freedom.
Ques. Give some uses of T Distribution. (2 marks)
Ans.
- It is used in demographic means of estimation.
- Examination of the hypothesis of the difference between the two means having a dependent sample.
- An examination of the hypothesis of differences between the two approaches.
Ques. Explain degrees of freedom. (2 marks)
Ans. The heavy tail in the case of the T-distribution is determined by a parameter known as the degree of freedom. It describes the form and shape of the T-shaped distribution of the sample. When the level of freedom is high it is very similar to the appearance of a normal distribution.
Ques. If we have a sample size of n = 20 items, then calculate the degrees of freedom. (2 marks)
Ans. To calculate degrees of freedom,
Df = n-1
= 20-1 = 19
So, we write T Distribution as t19.
Ques. What is the disadvantage of T Distribution? (2 marks)
Ans. T-distribution can distort accuracy compared to conventional distribution. Its limitation arises only when there is a need for complete normalization. However, there is little difference between using standard distribution and T distribution.
Ques. Define standard deviation. (2 marks)
Ans. The standard deviation (SD) is the level scattering of data points into their meaning, in descriptive statistics. It tells how values are still distributed in the data sample and is a measure of the difference in data points from the definition.
For Latest Updates on Upcoming Board Exams, Click Here: https://t.me/class_10_12_board_updates
Check-Out:



Comments