




These Class 12 Geography Chapter 1 Population Distribution Density Growth and Composition handwritten notes are a topper's genuine handwritten revision pages, mapped to the 2026-27 CBSE syllabus. The pages cover all four major topics in the chapter: distribution, density, growth phases and population composition (rural-urban, linguistic, religious and occupational). Use the PDF in the 24 hours before the board paper.
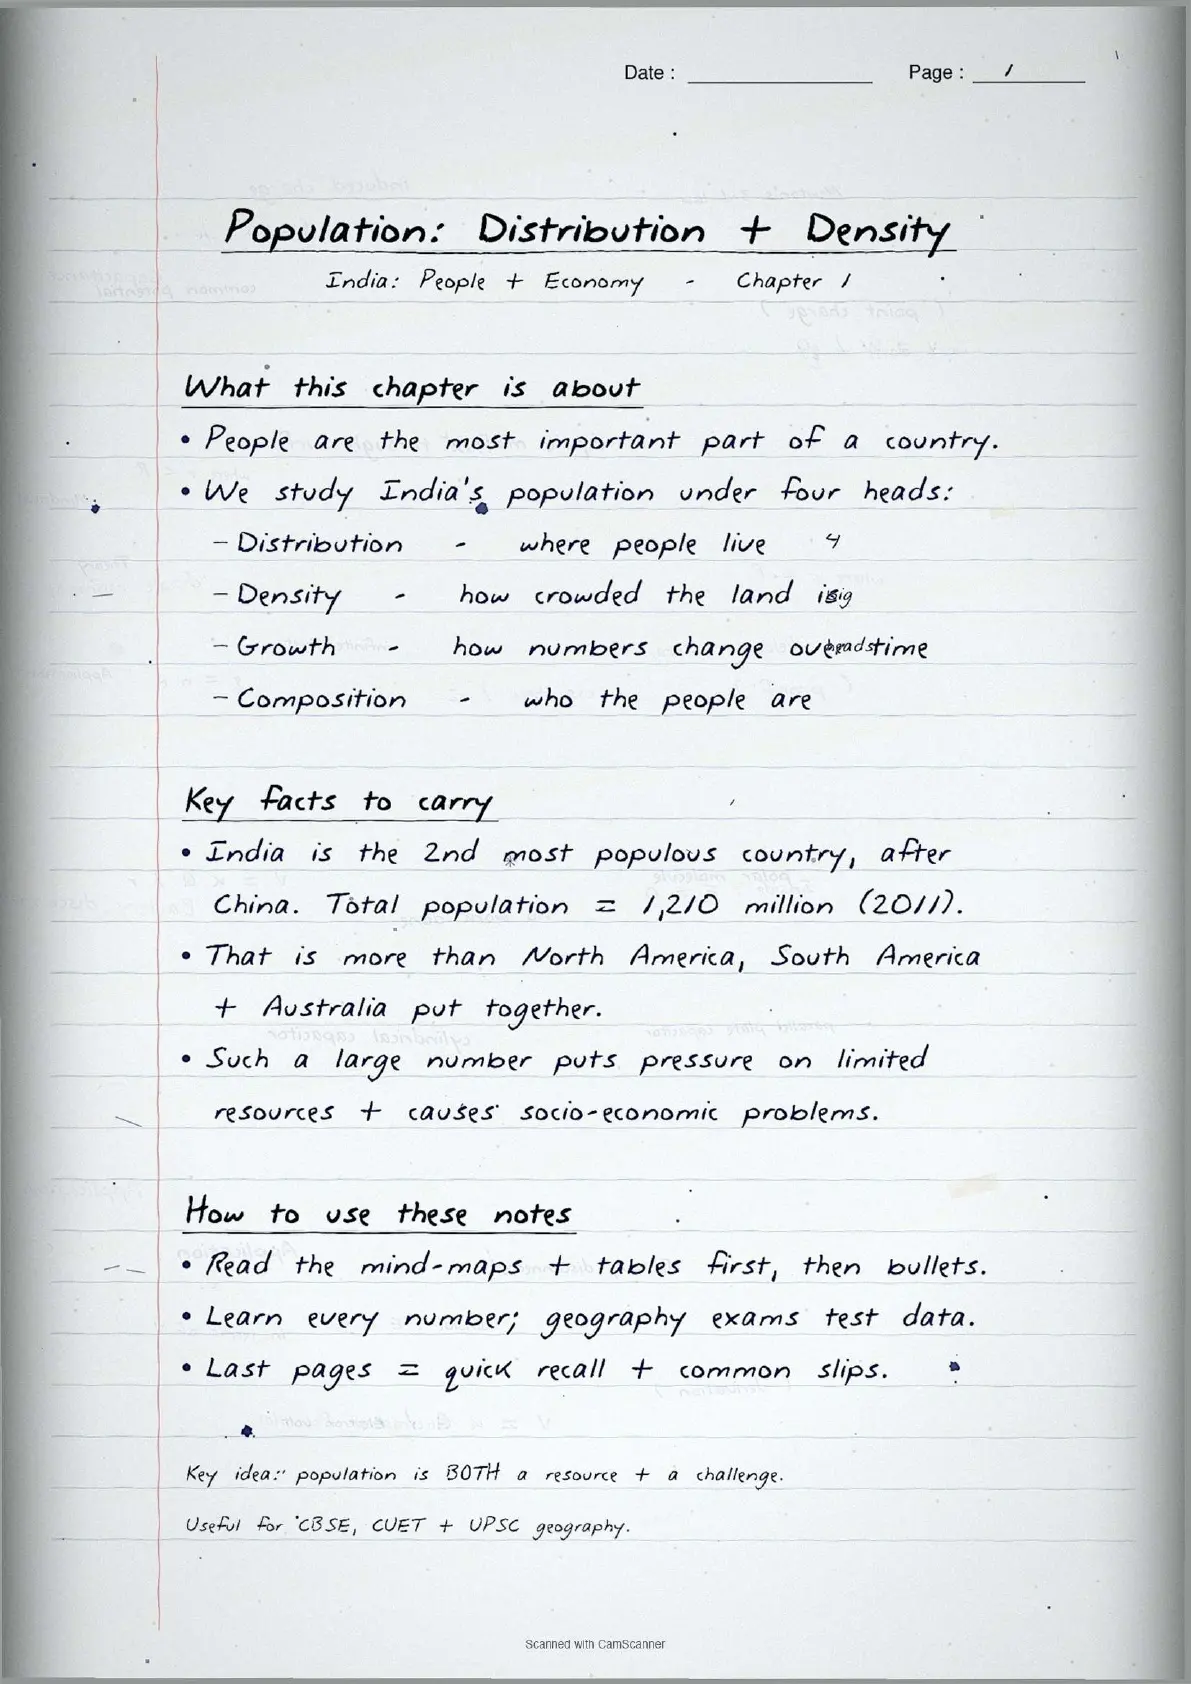
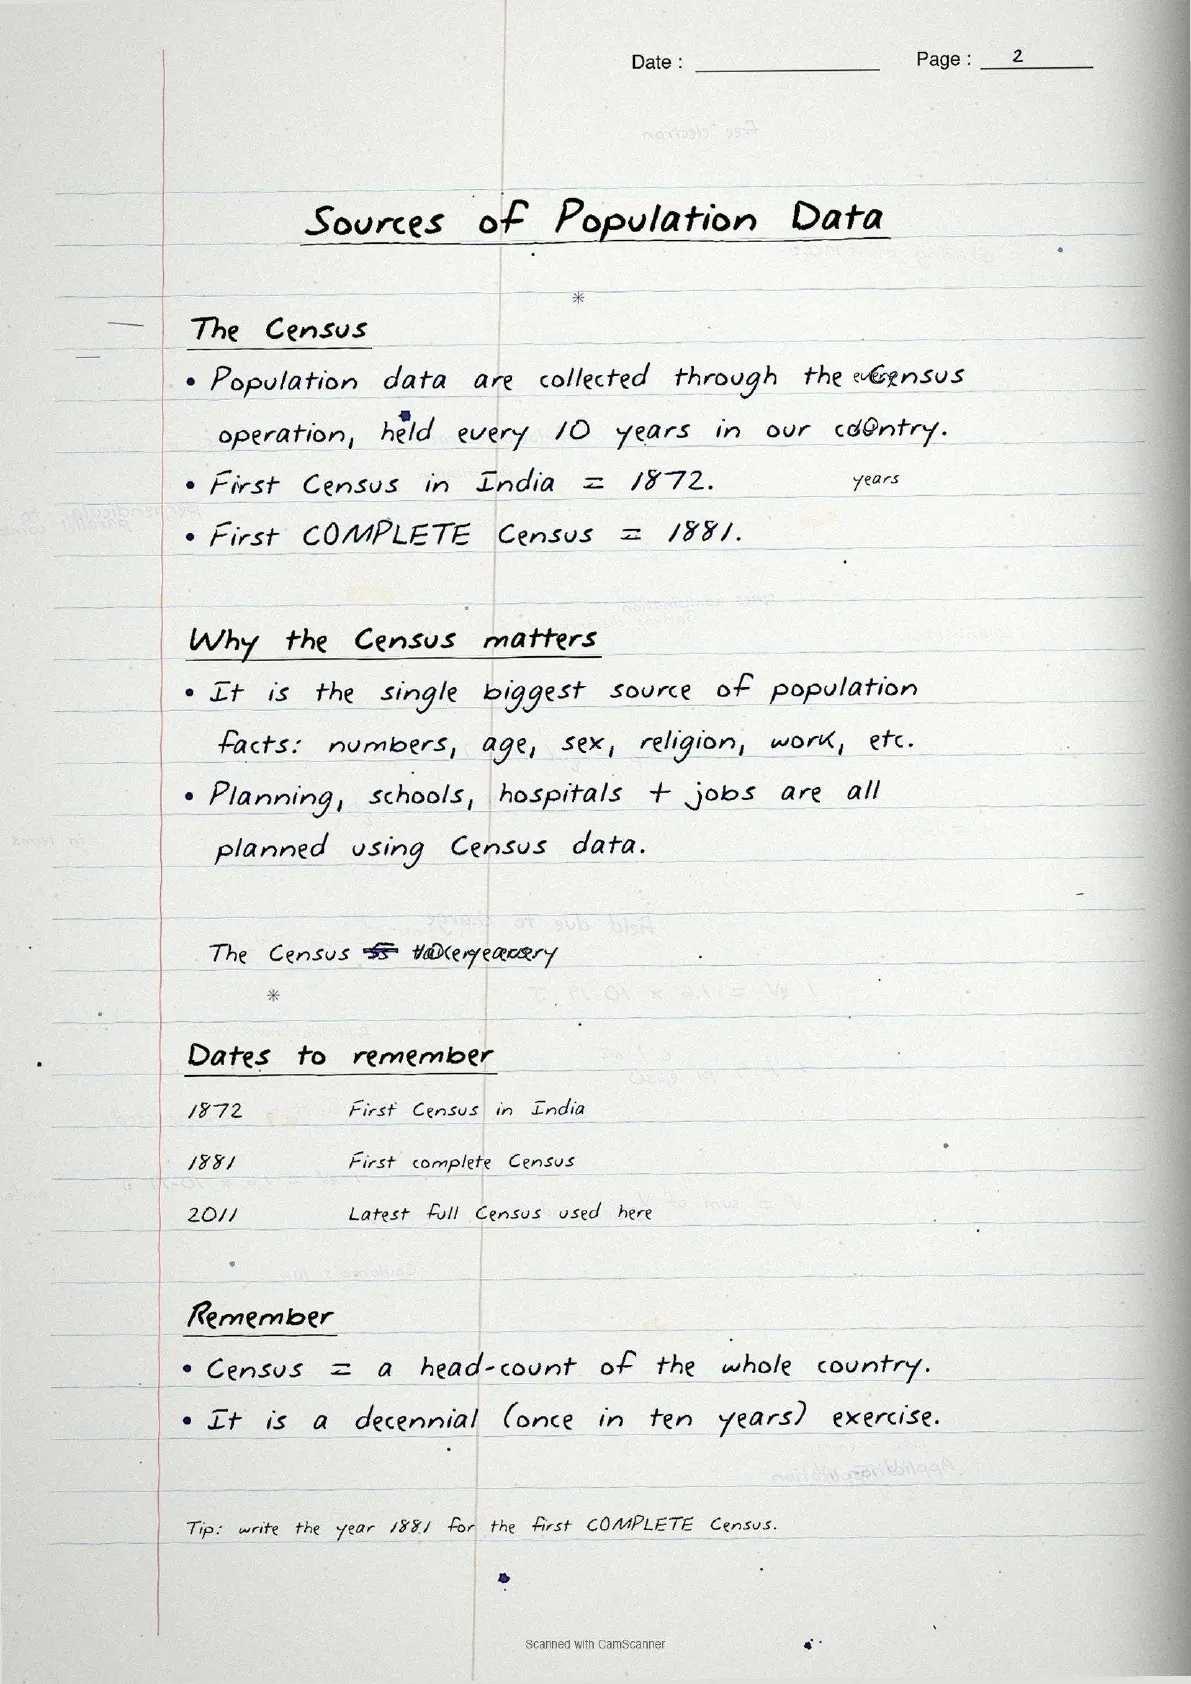
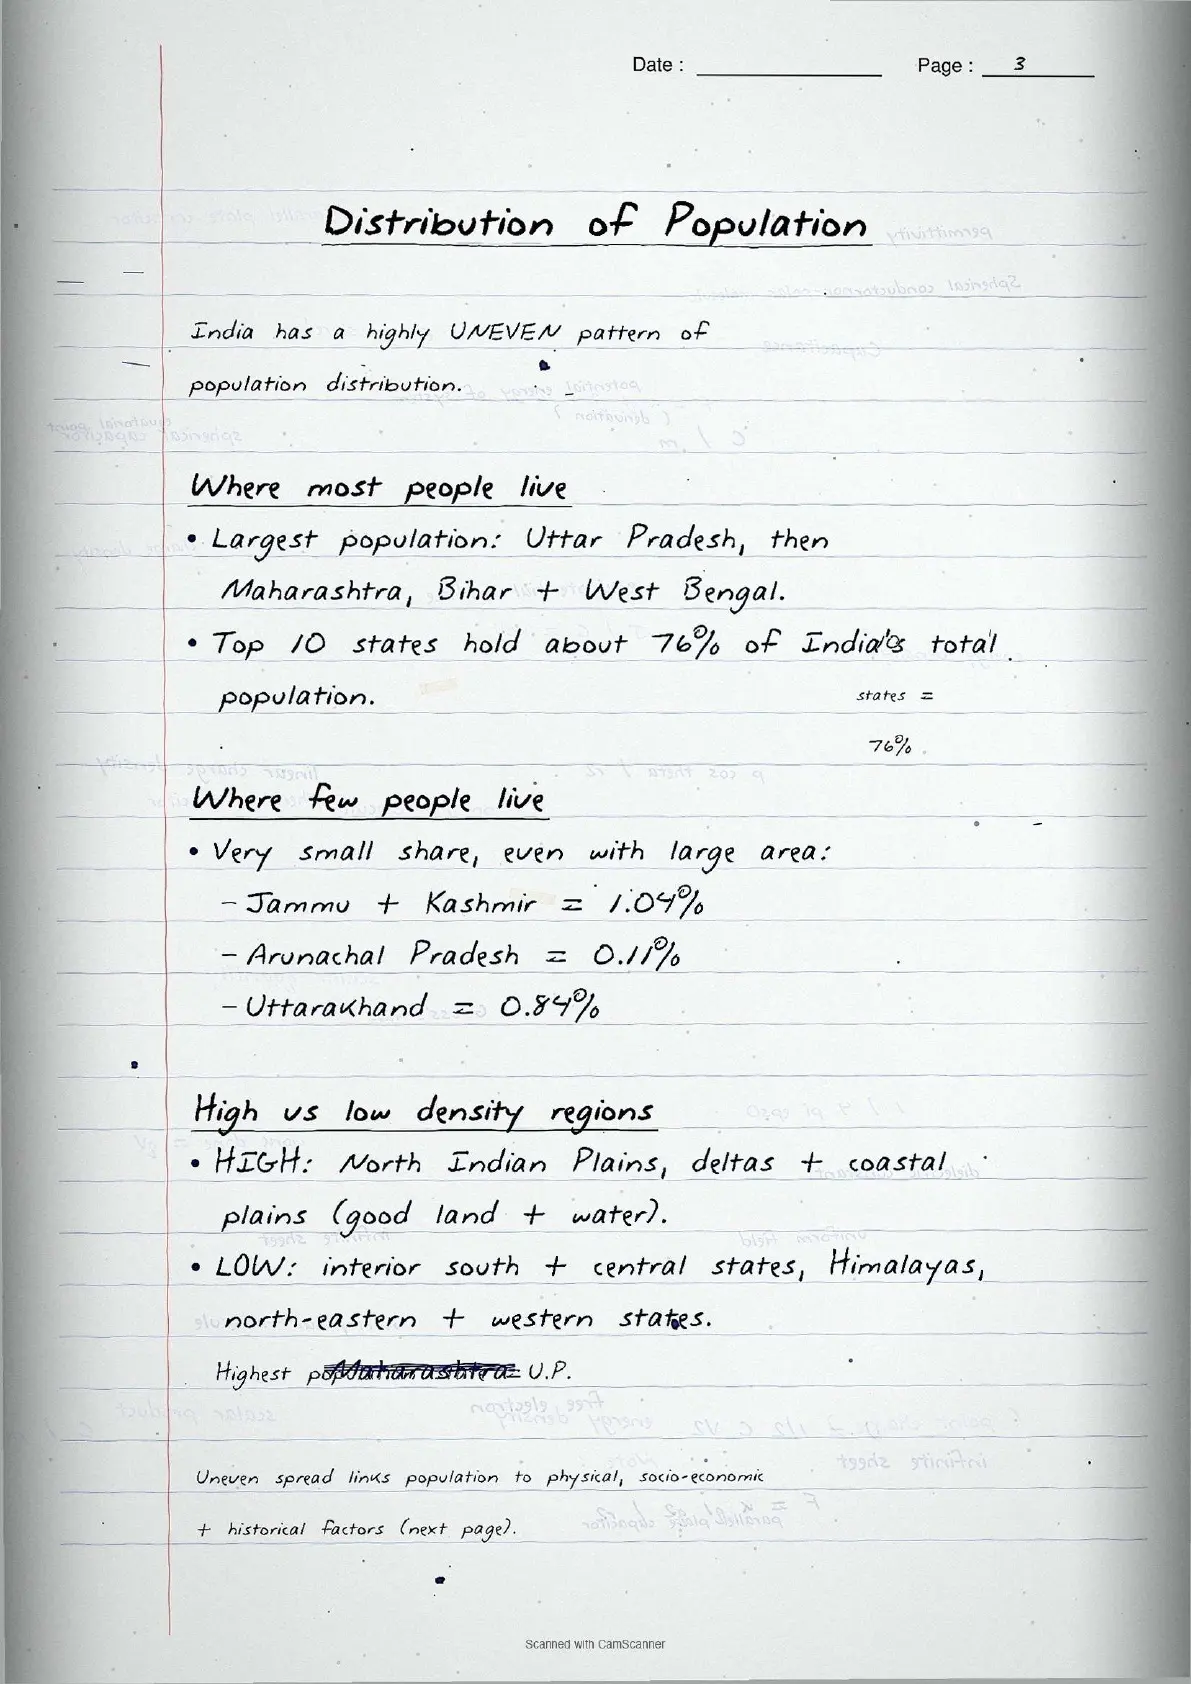
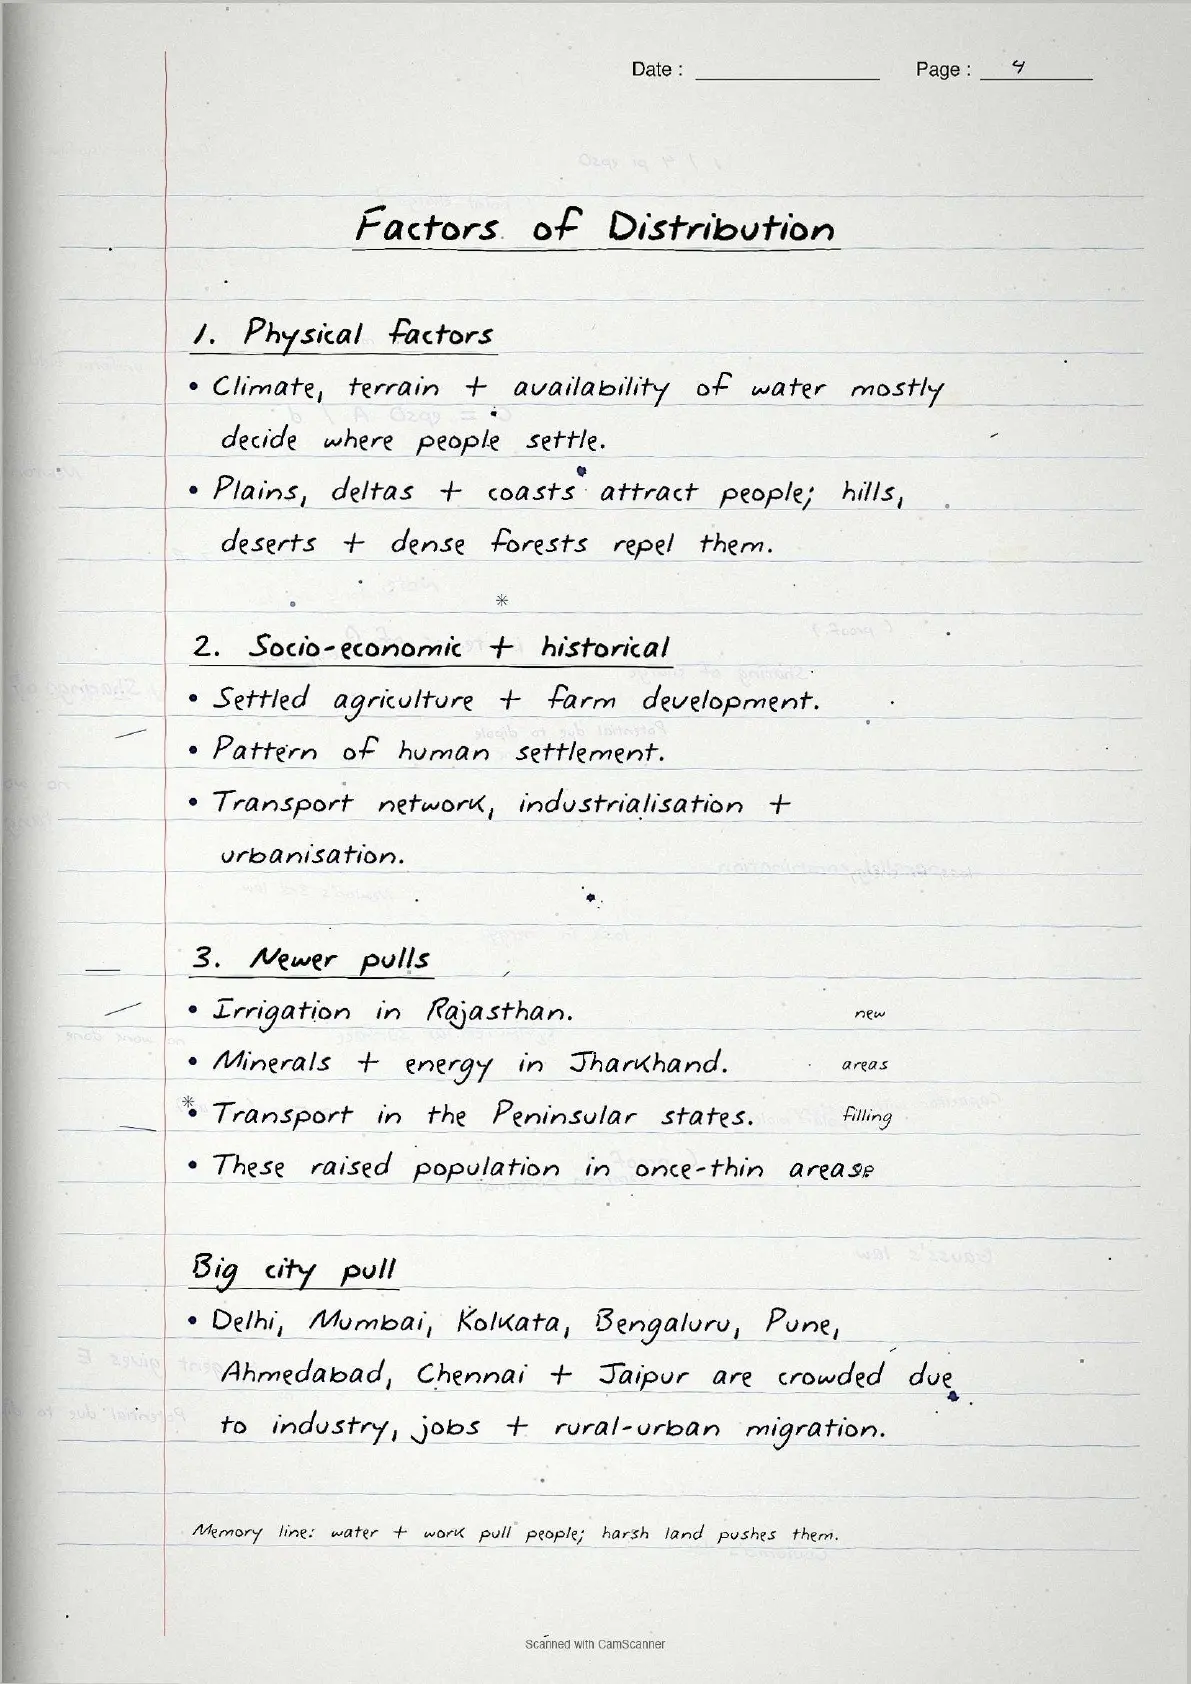
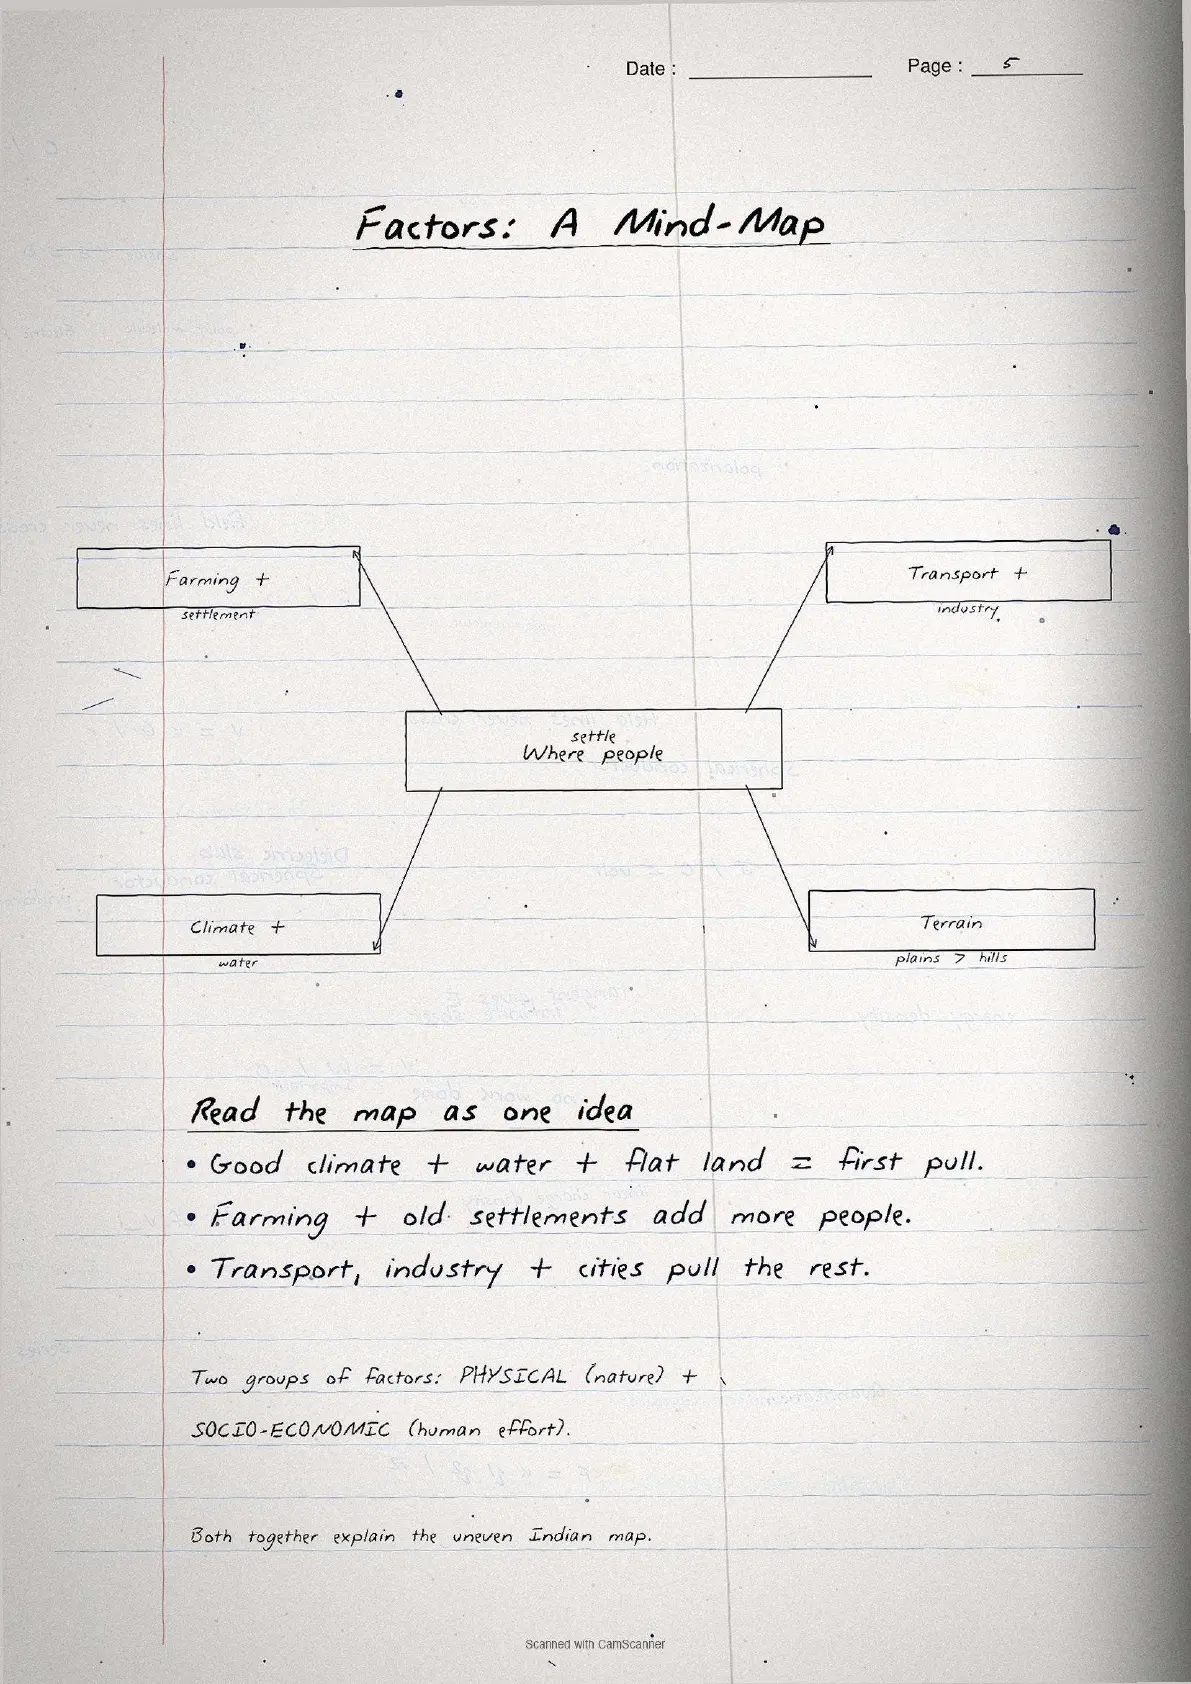
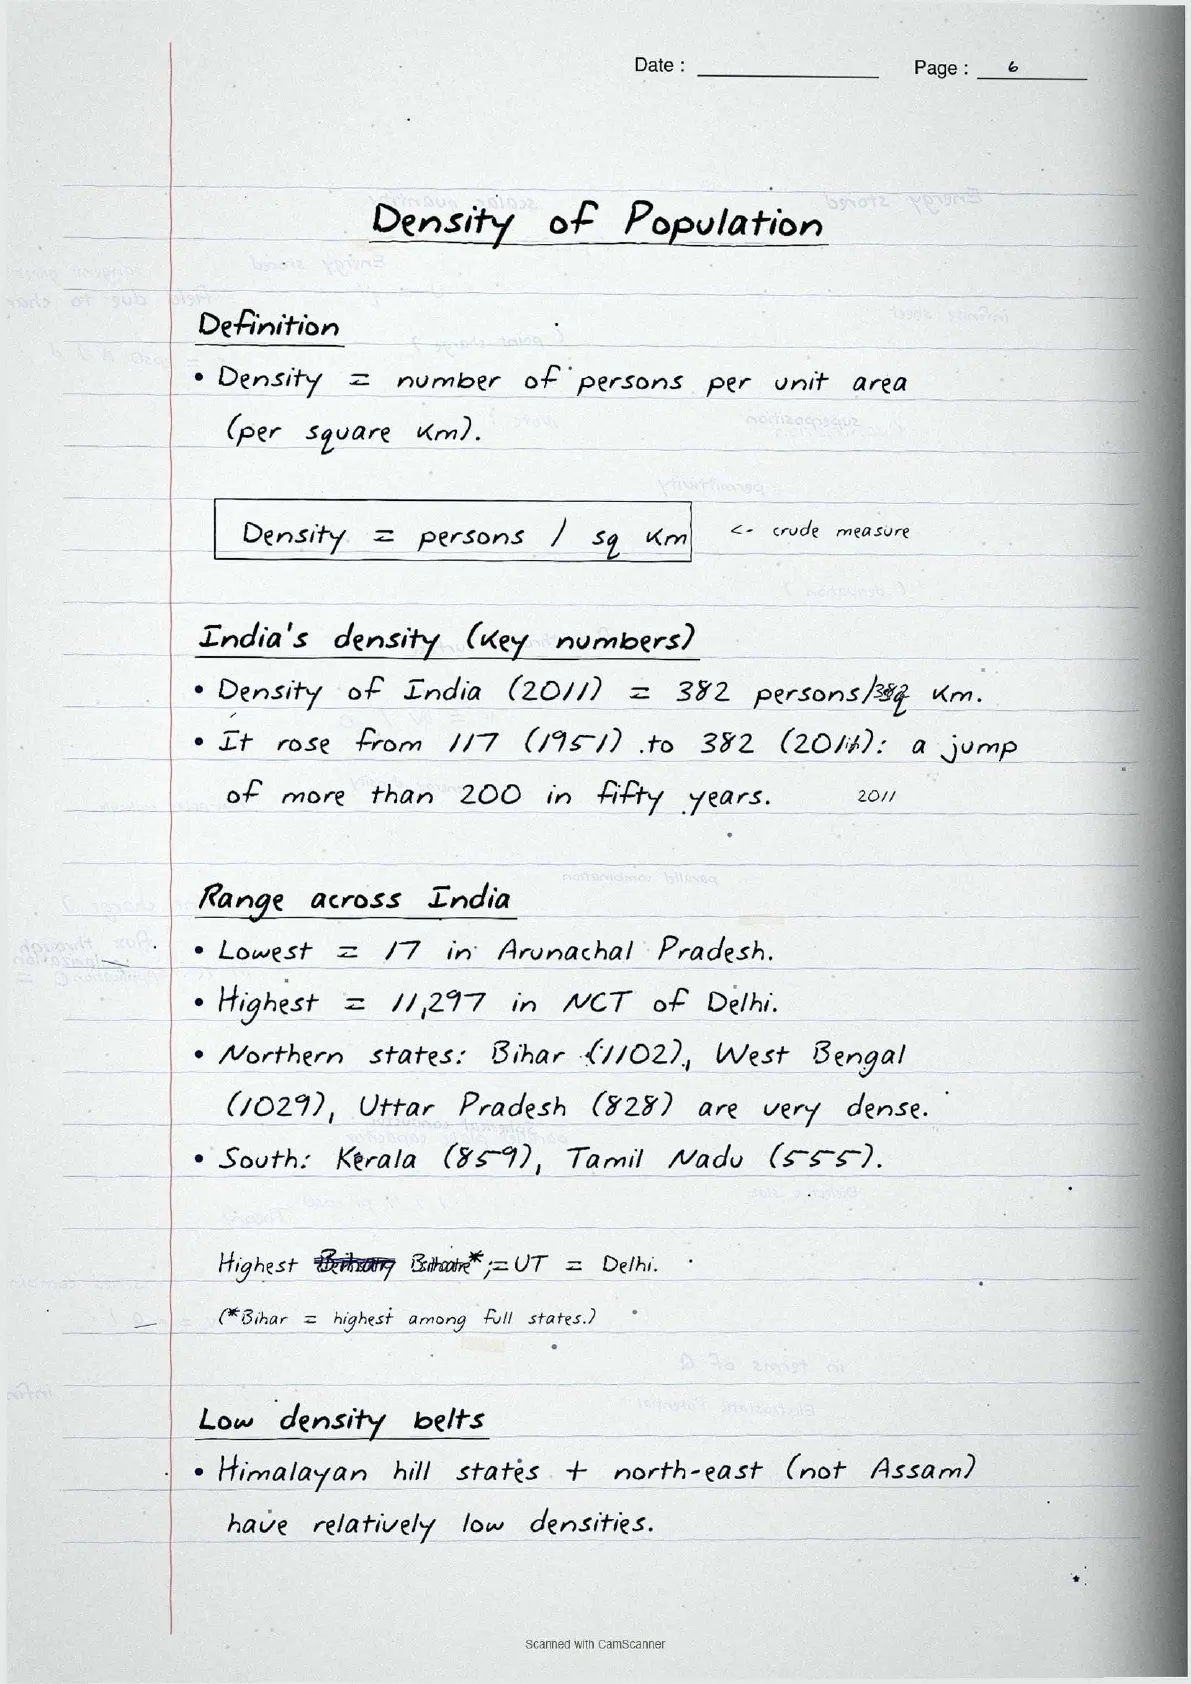
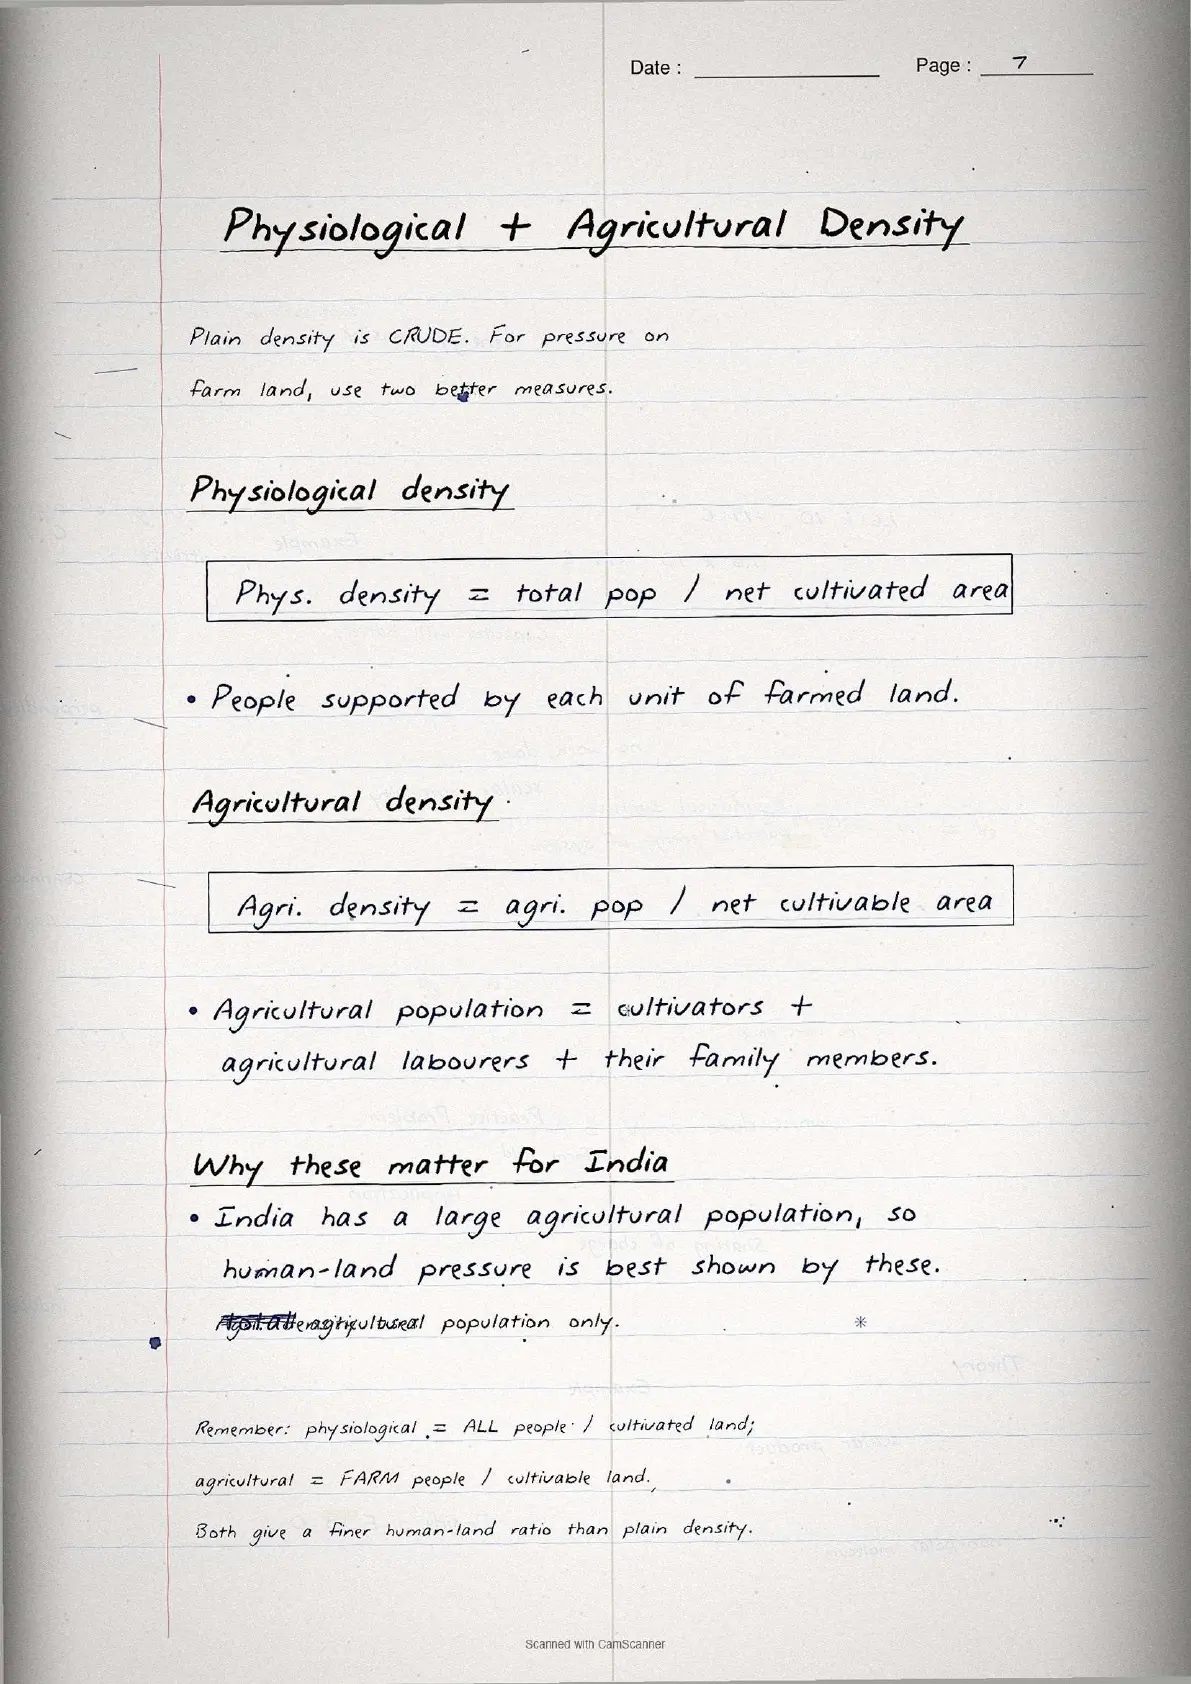
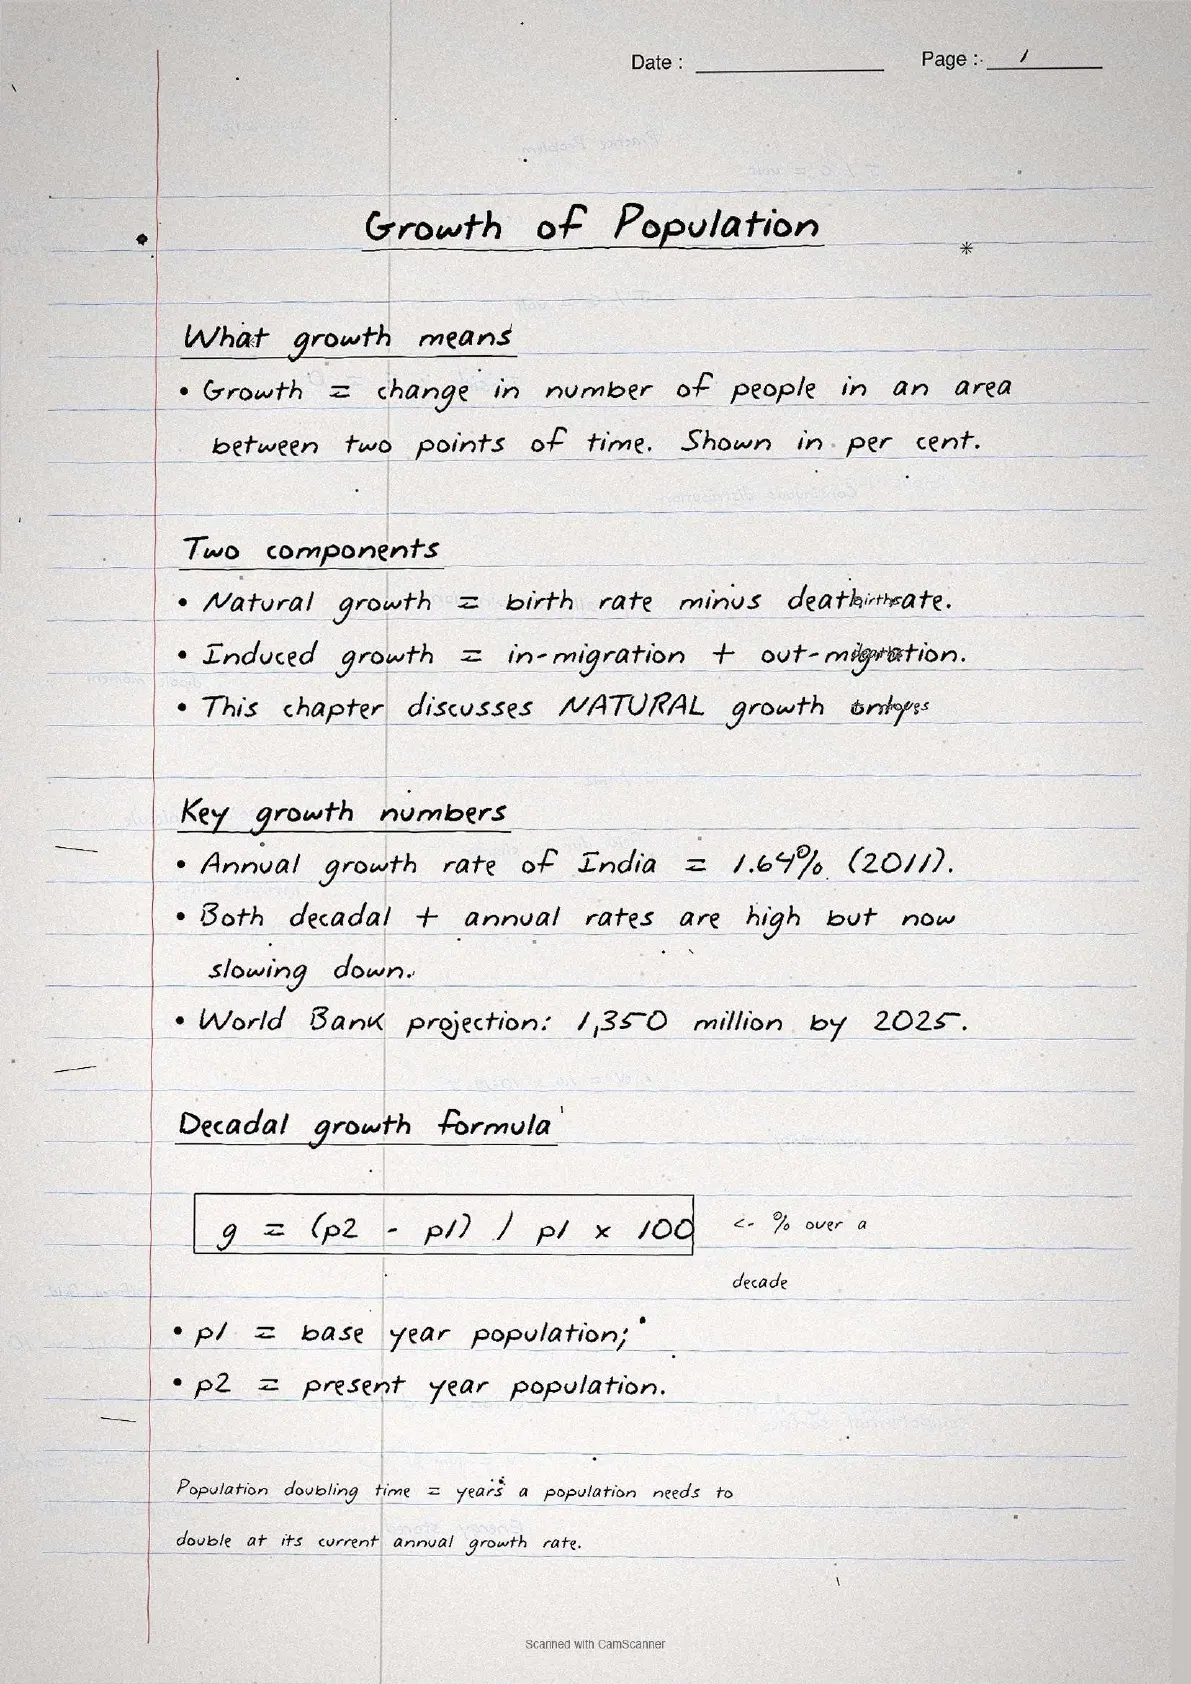
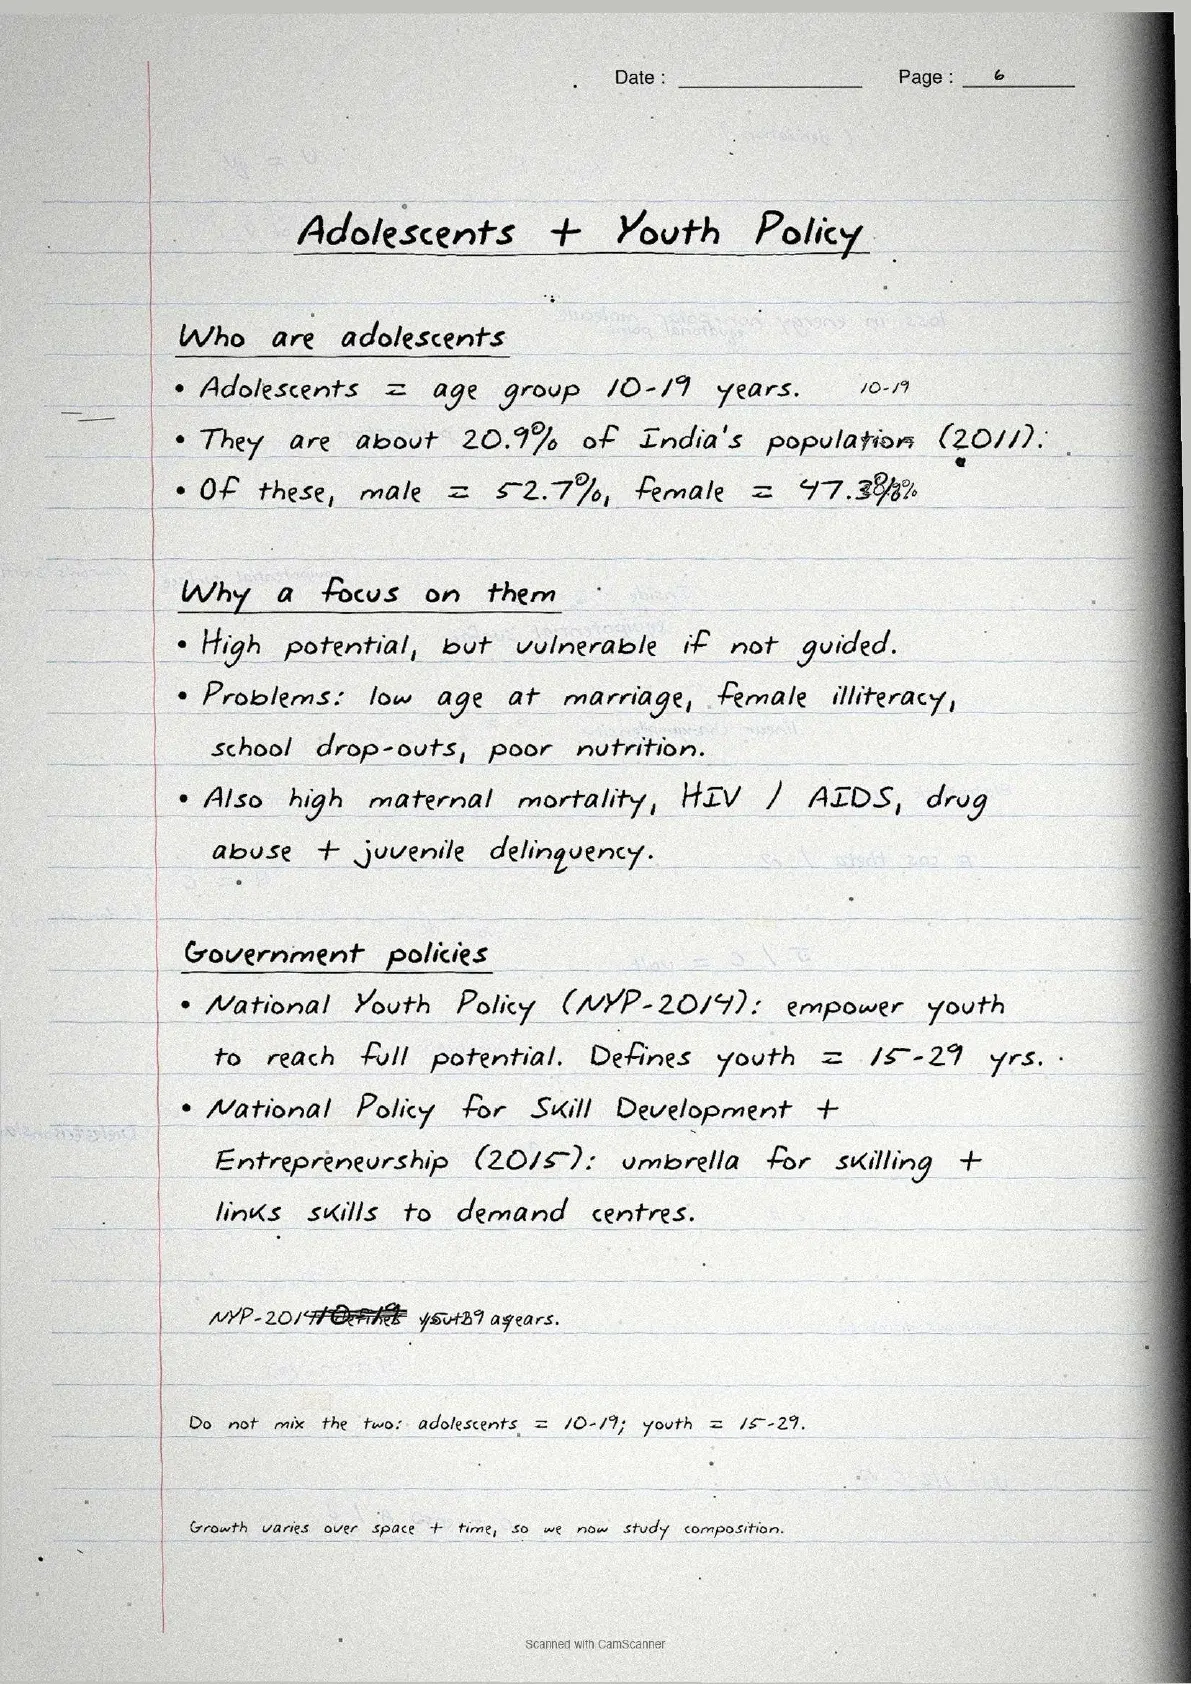
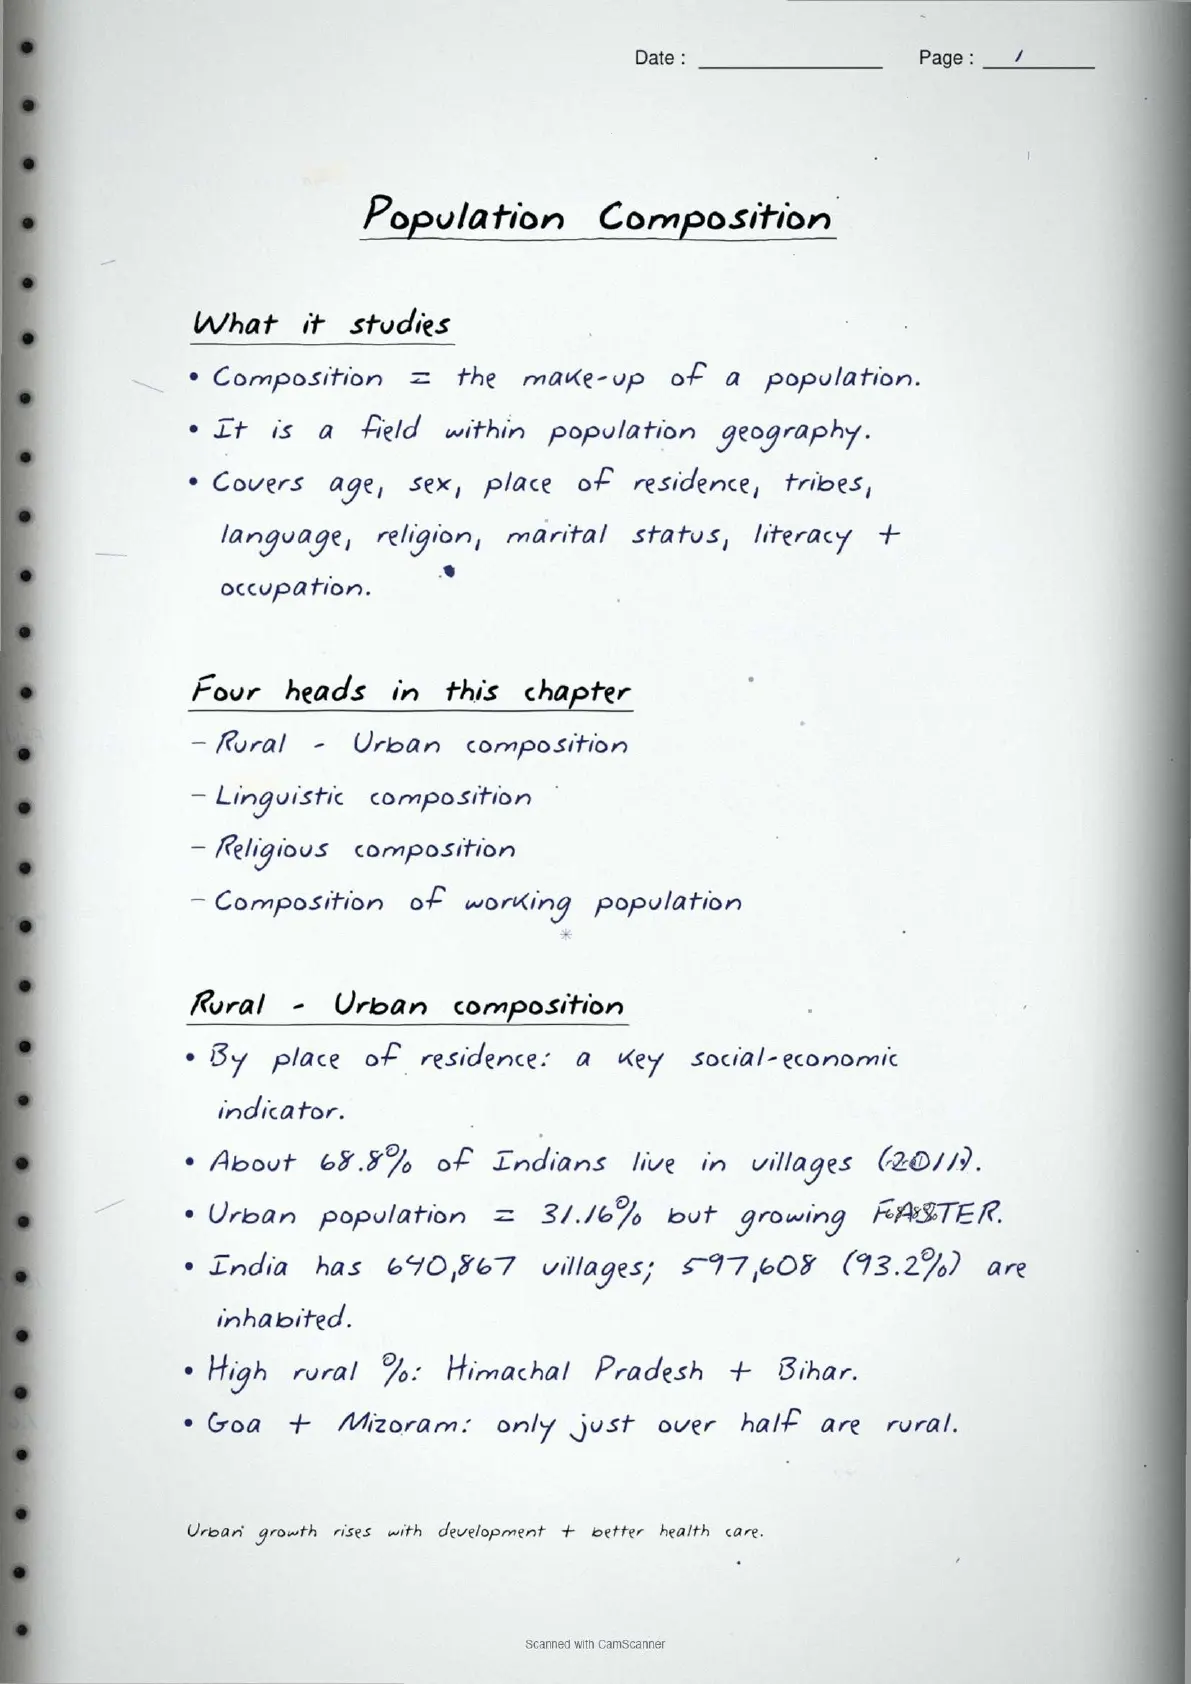
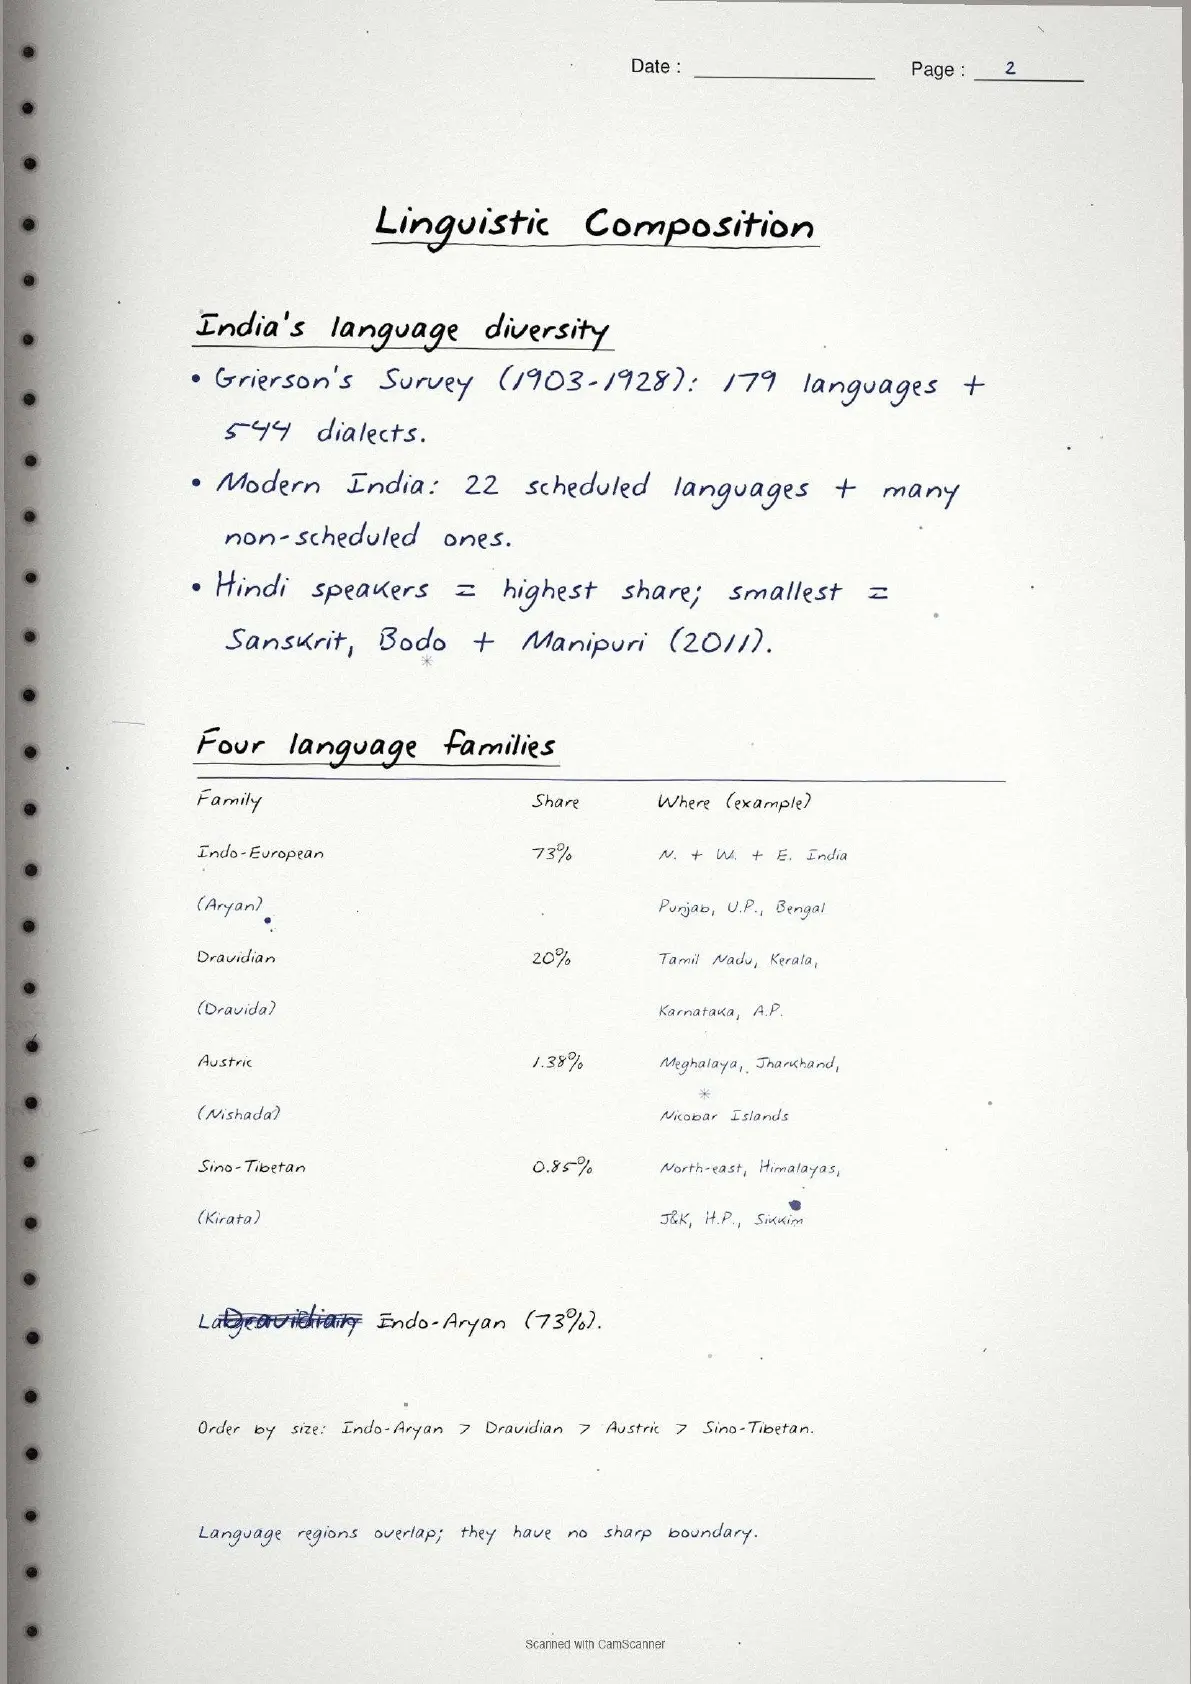
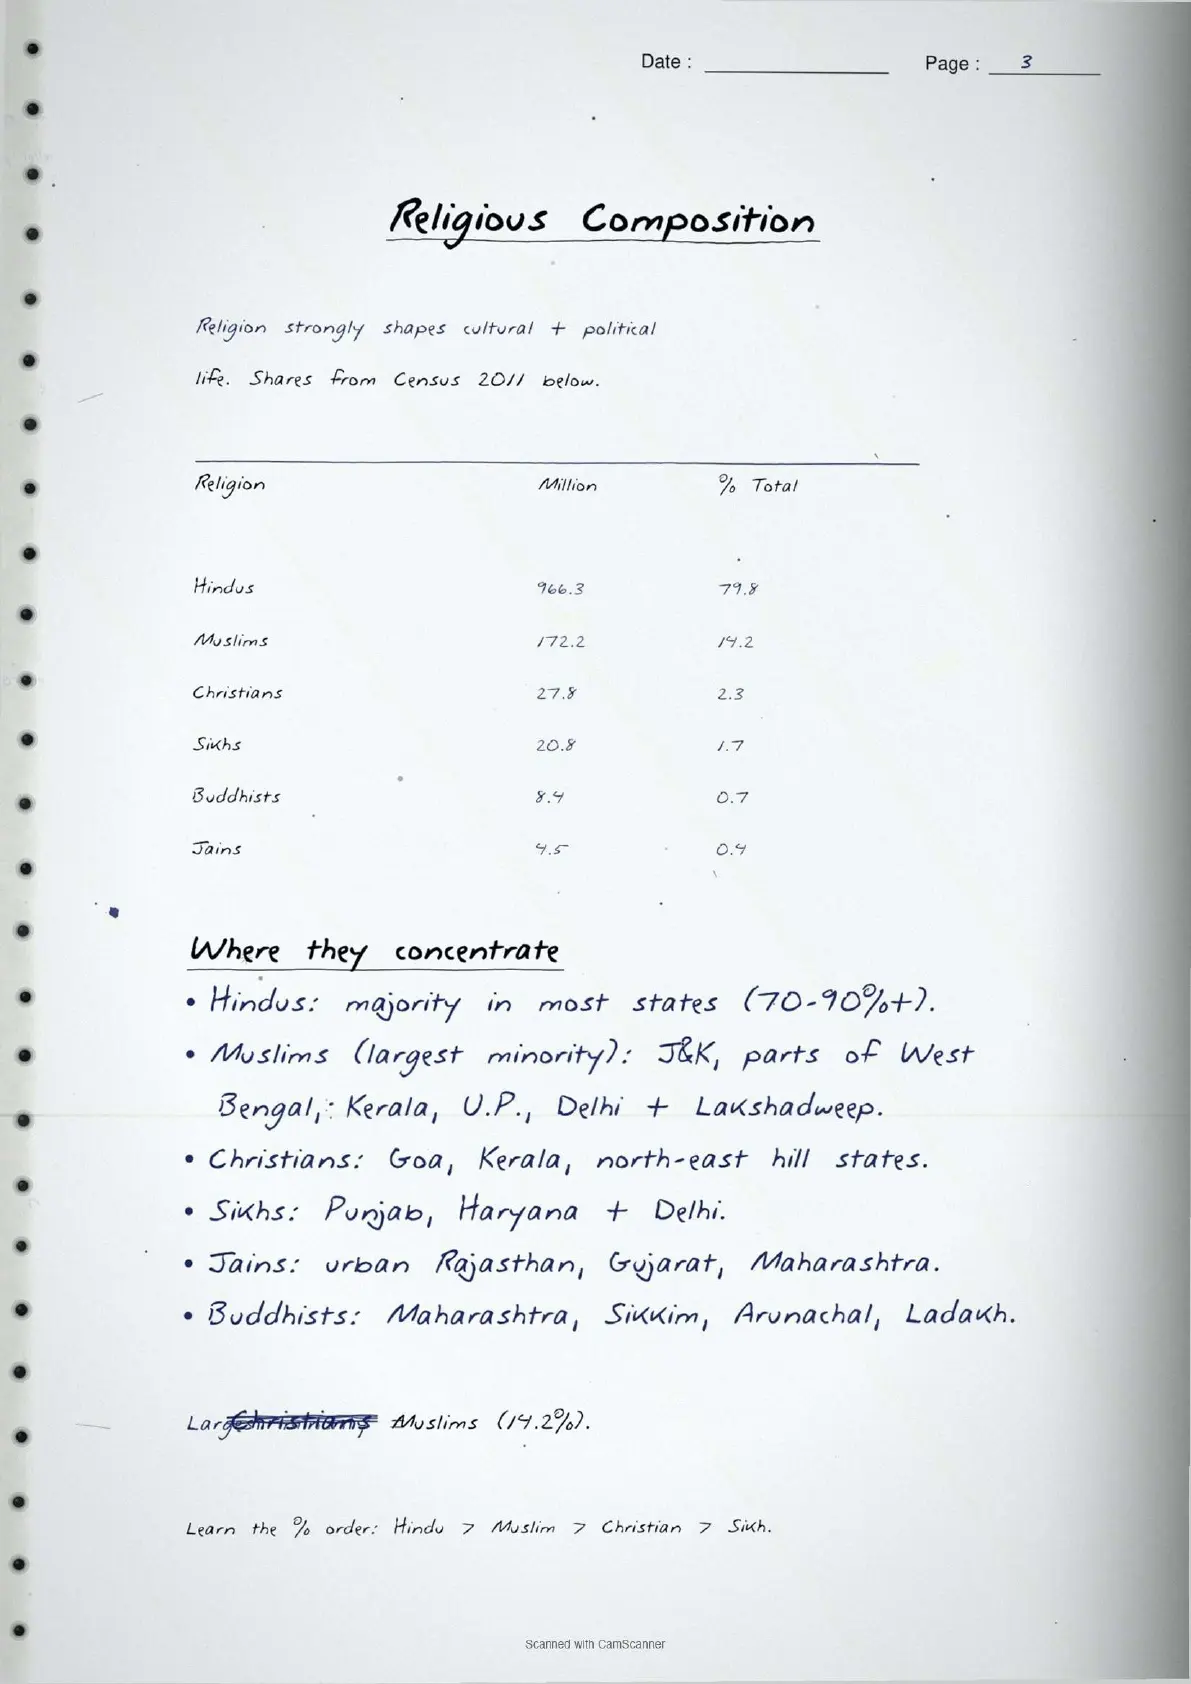
- Topper's handwritten revision notes covering all of CBSE Class 12 Geography India People and Economy Chapter 1.
- 6-8 marks weightage in the Class 12 Geography board paper, with the four phases of population growth, density data and composition tables written out by hand.
- Pairs with the typed NCERT Solutions, typed Notes and the official NCERT Book PDF for the same chapter.
Each page of these population distribution density growth and composition class 12 handwritten notes is written by a Collegedunia subject expert, mapped to the 2026-27 NCERT India People and Economy textbook, and cross-checked against the last five years of CBSE Class 12 Geography board papers.
Student Feedback
69% of Class 12 students said handwritten notes feel faster to scan than typed PDFs in the final 48 hours before the board exam, and 4 out of 5 said pen-on-paper concept boxes stick in memory better. Most finished one full revision pass in about 20 minutes.
Source: 2026-27 Class 12 Geography handwritten-notes poll, 10,240 CBSE students.
What These Handwritten Notes Include
The population distribution density growth and composition class 12 handwritten notes PDF is a 4 to 5 page revision file. Every page carries hand-drawn boxes around key data points, arrow-tagged diagrams of the four growth phases, and colour corrections where a definition is tightened. It is built for last-mile revision, not first-time concept building.
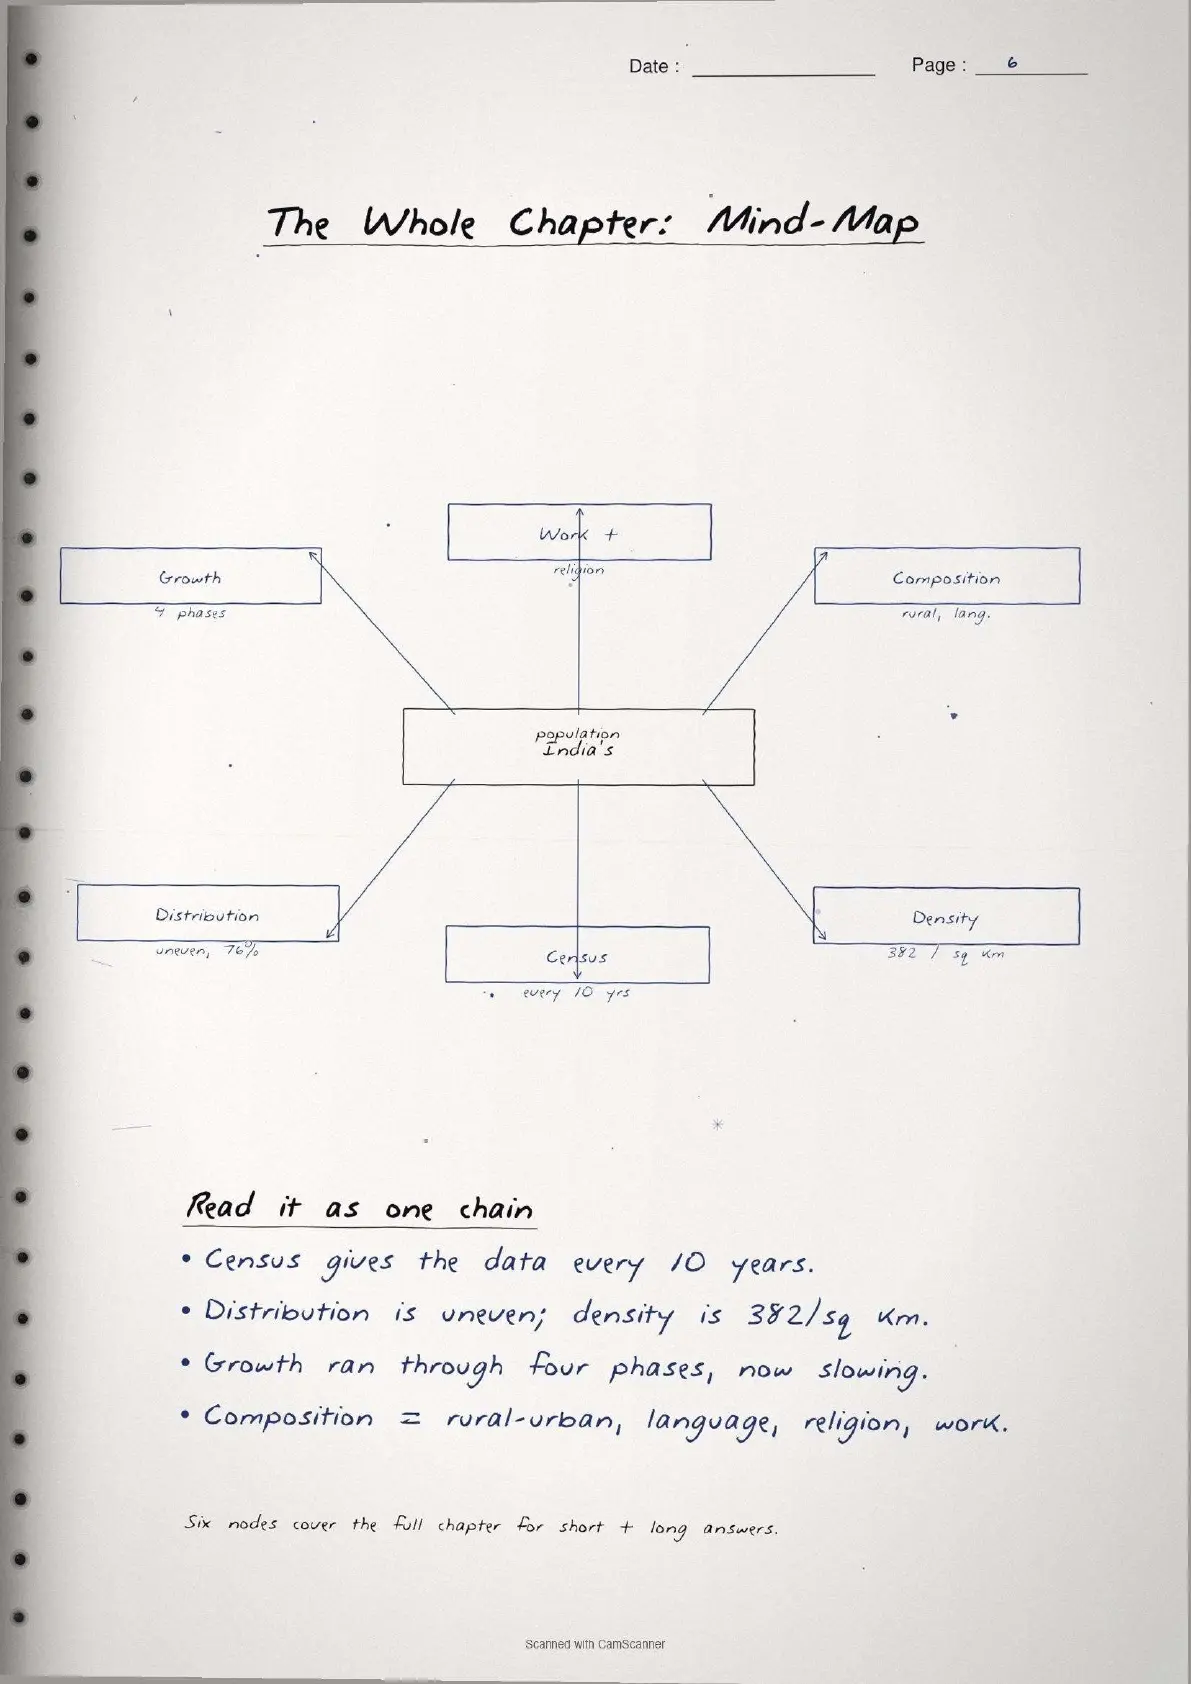
The notes capture every concept tested in Chapter 1 of India People and Economy: the spatial pattern of distribution across states, the density of 382 persons per sq km (2011), the four phases of population growth from 1901, doubling time, regional variation, and the full composition covering rural-urban, linguistic, religious and occupational breakdown.
| Page | What the page covers | Approx revision time |
|---|---|---|
| Page 1 | Distribution of population across states, factors (physical, socio-economic, historical), key states with high and low density. | 5 minutes |
| Page 2 | Density of population (382/sq km), physiological and agricultural density, state-wise density for Bihar, West Bengal, Delhi vs Arunachal Pradesh. | 5 minutes |
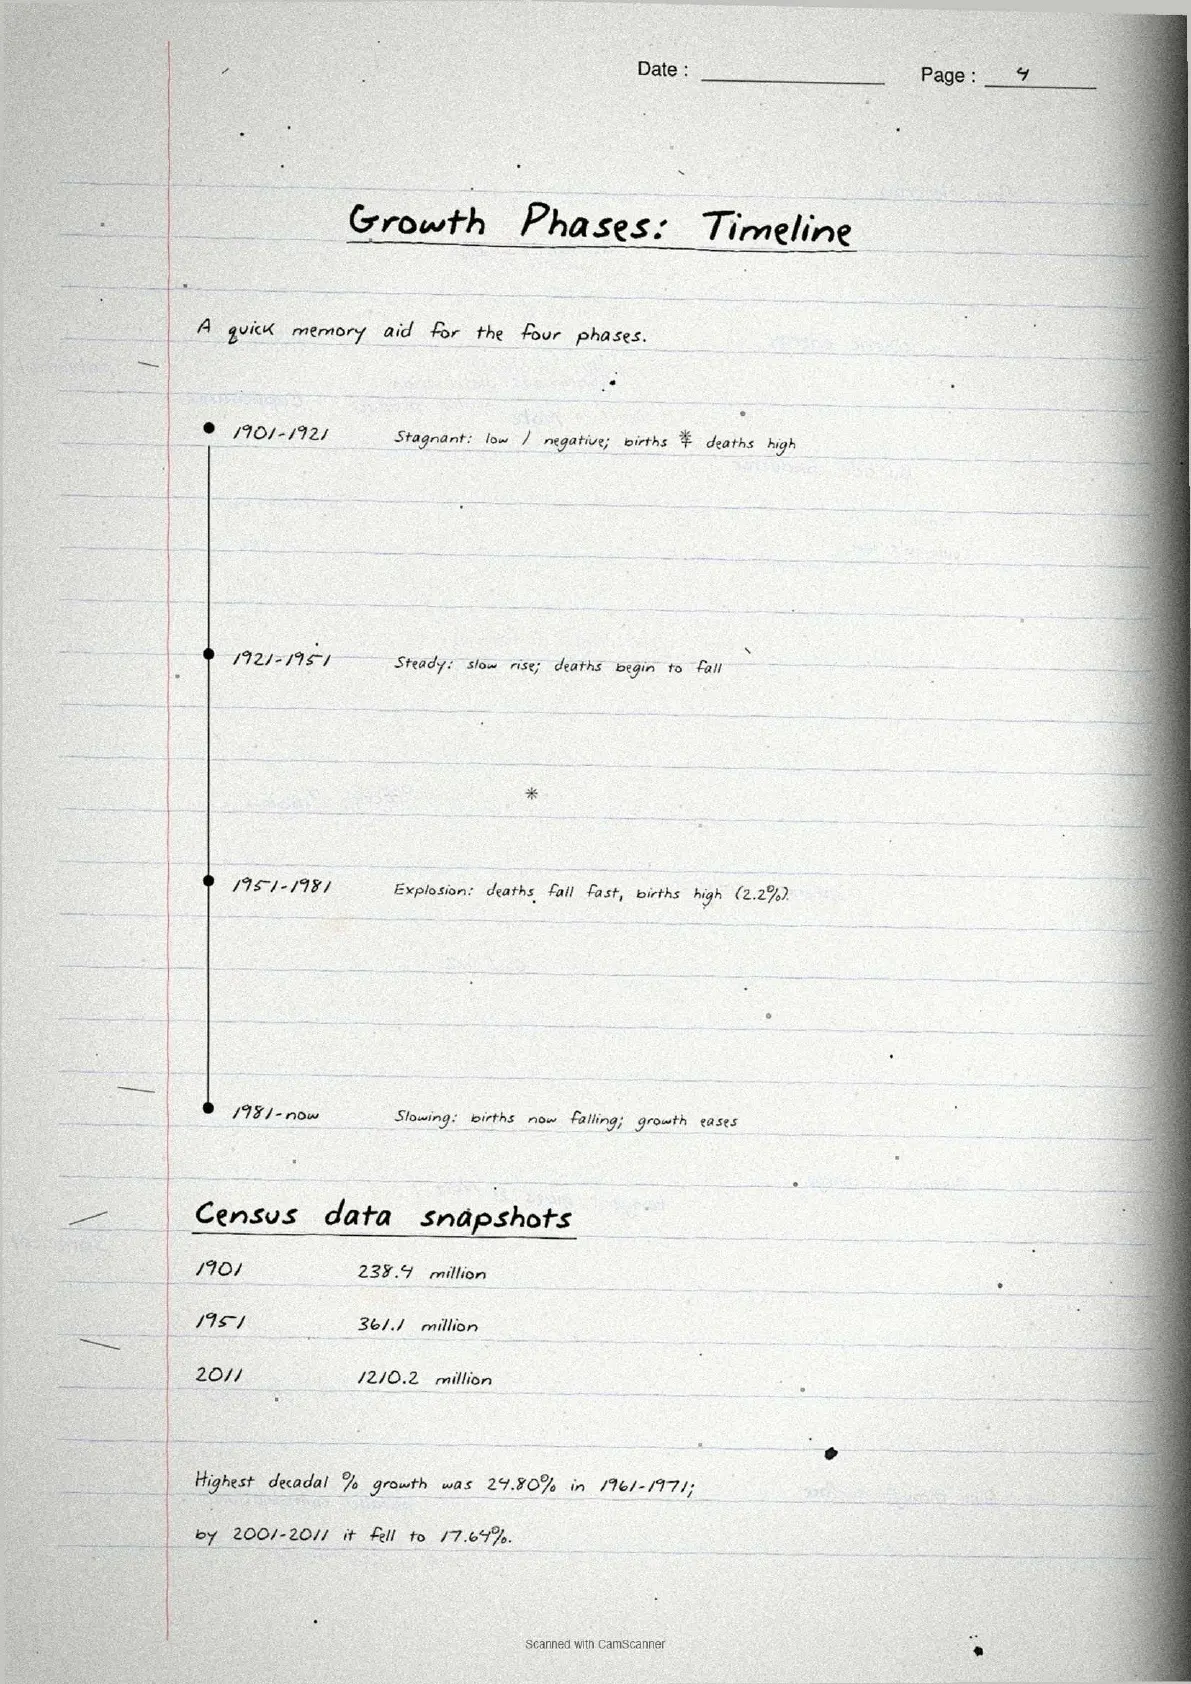
| Page 3 | Four phases of population growth (1901-2011 decadal growth rate table), doubling time, annual growth rate 1.64%. | 6 minutes |
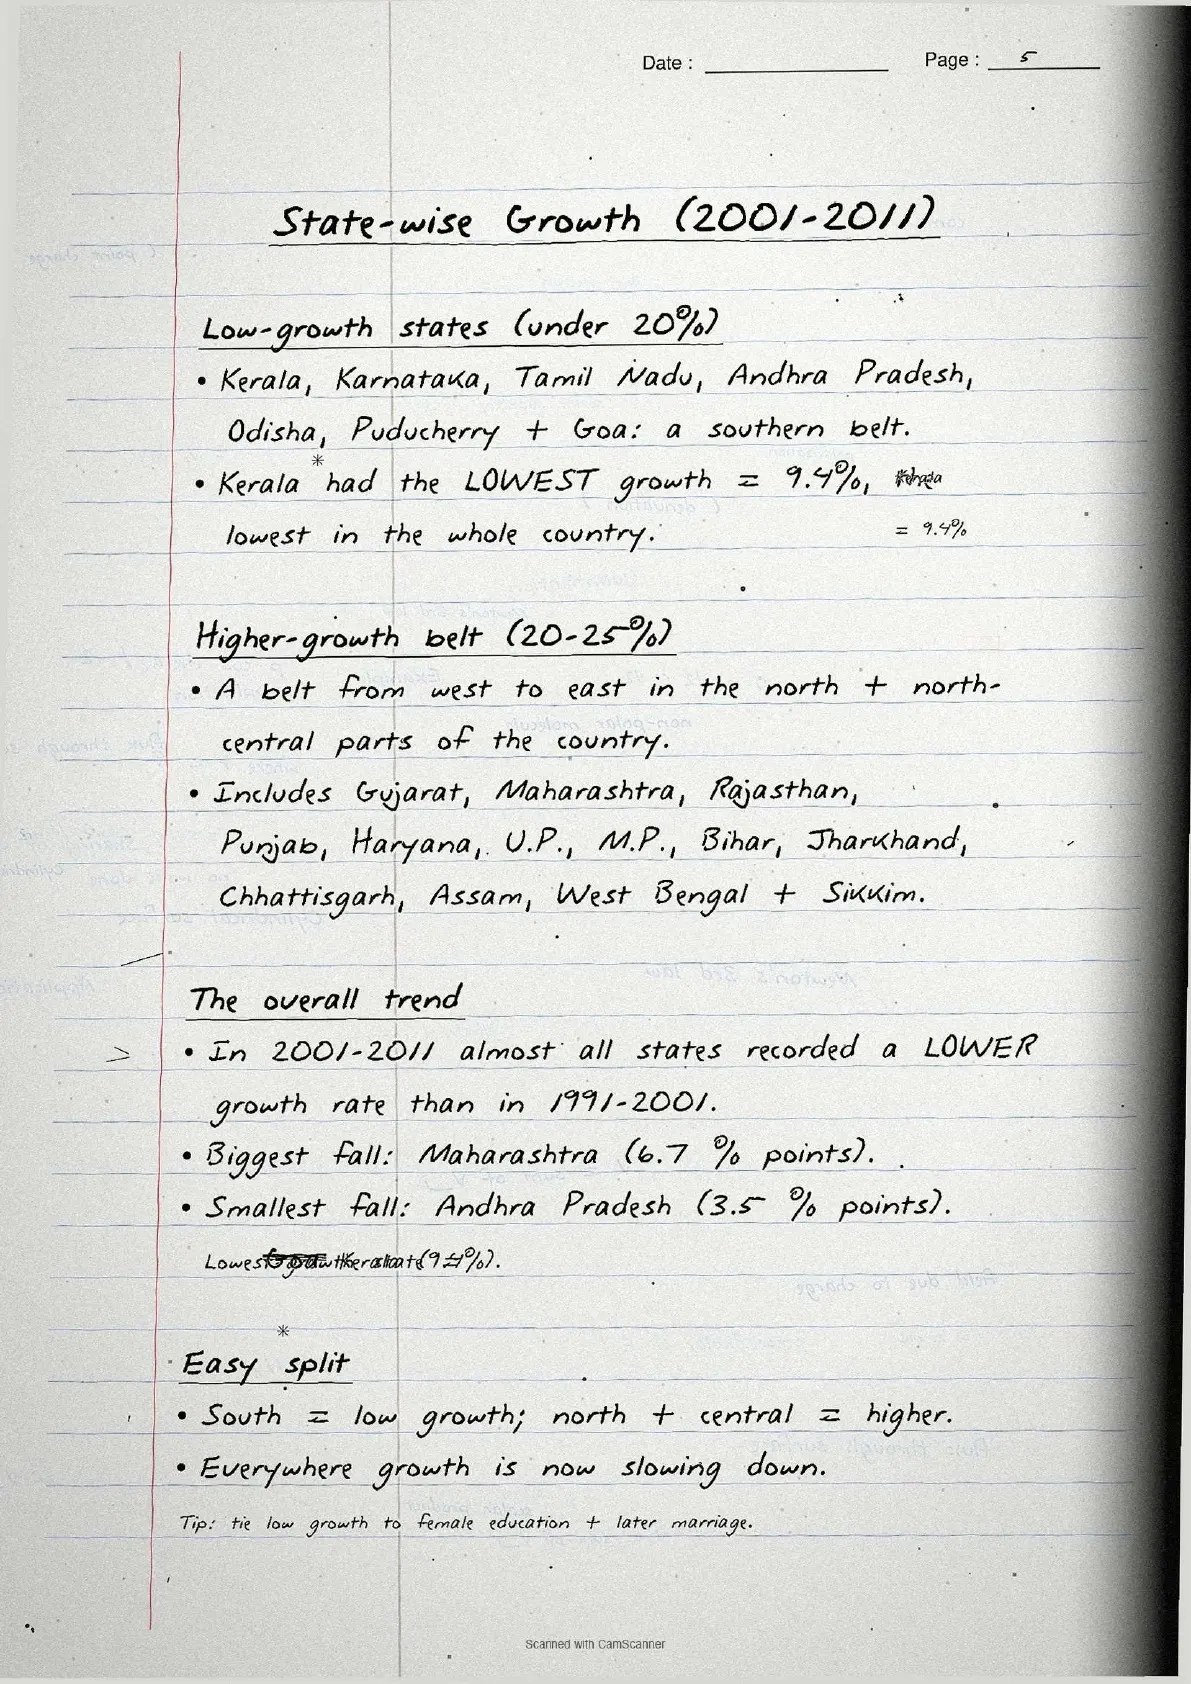
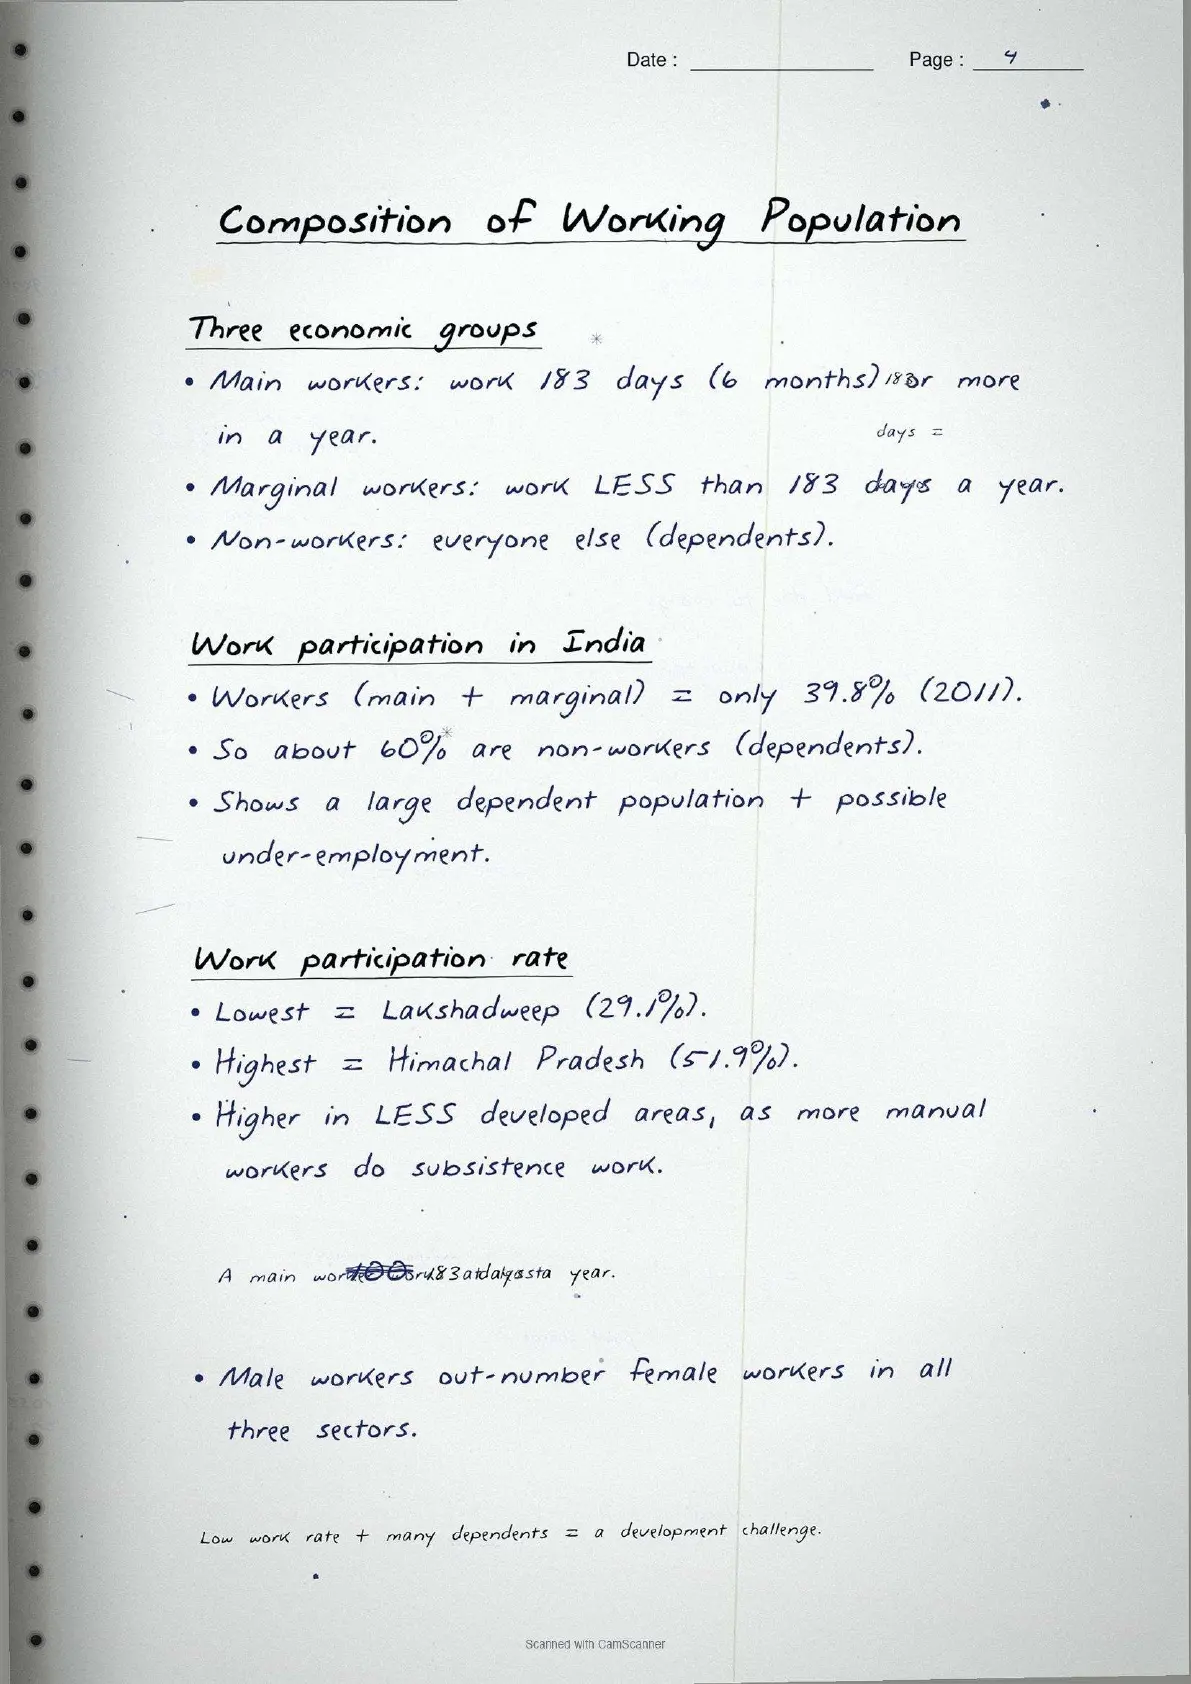
| Page 4 | Regional variation in growth, adolescent population, rural-urban split (68.8% rural vs 31.16% urban). | 4 minutes |
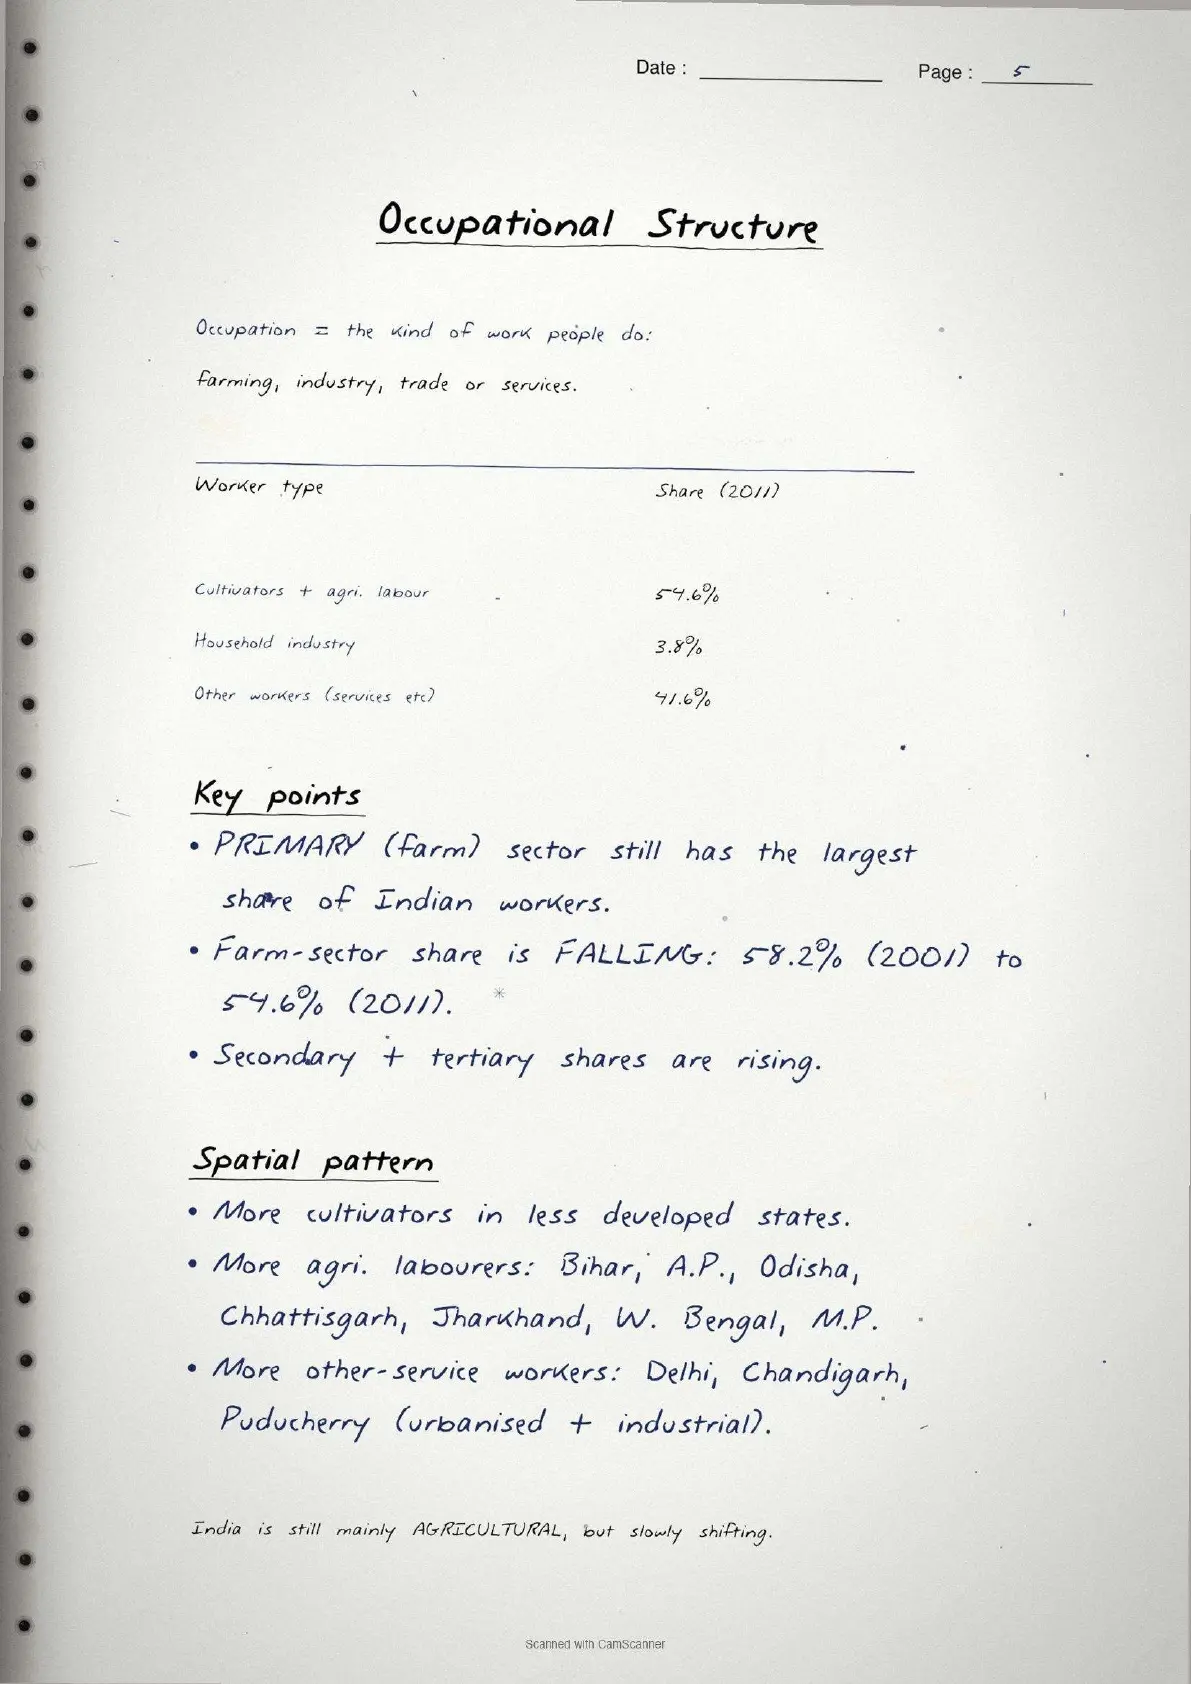
| Page 5 | Linguistic (four language families), religious (Table 1.3 data), occupational composition. | 4 minutes |
Source: Magnet Brains on YouTube
Key Facts and Definitions in Handwritten Style
This fact sheet is the highest-value block in the file. The table lists every key figure and definition students must memorise for the board paper, in the same order as the notebook page.
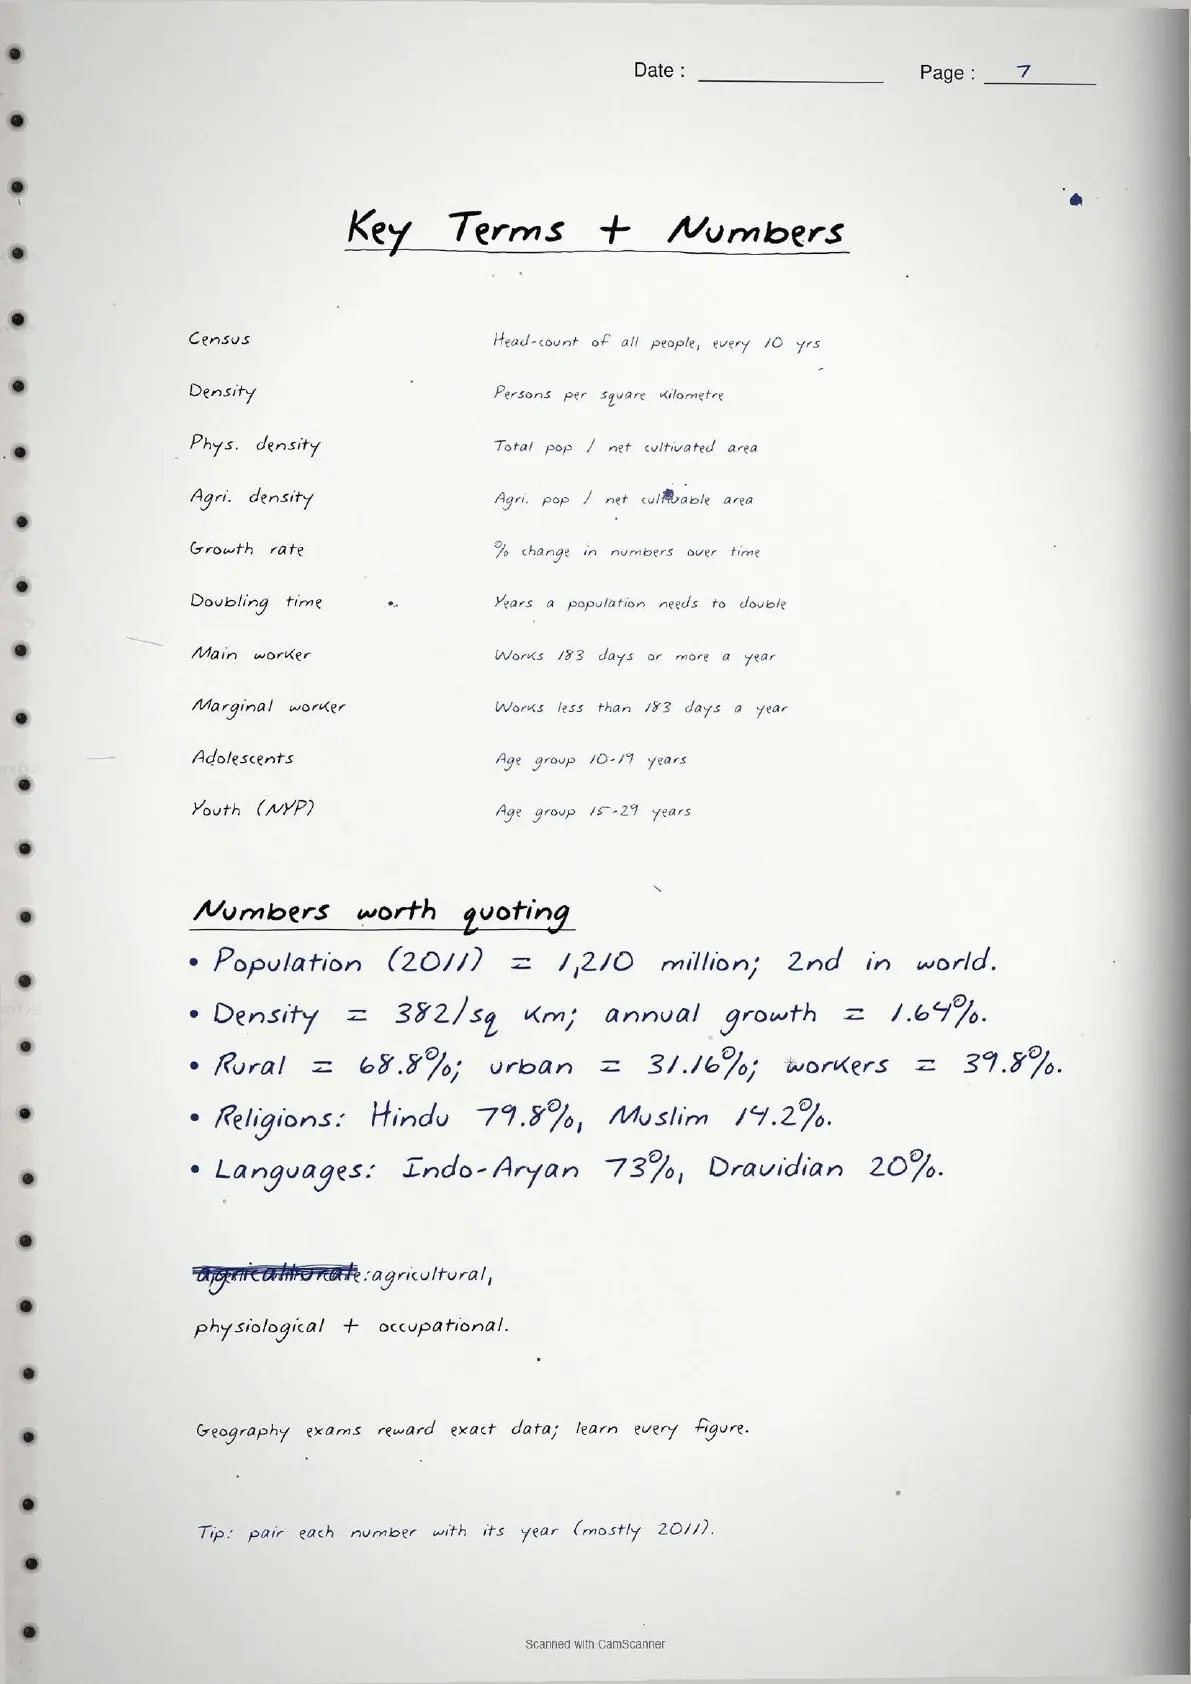
| Concept / Fact | Handwritten note (as drawn) | NCERT exercise Q |
|---|---|---|
| India's population (2011) | 1,210 million - second largest after China | Q1(i) |
| Density of population (2011) | 382 persons per sq km | Q3(i) |
| Highest density state | Bihar - 1,102 persons per sq km | Q1(ii) |
| Lowest density state | Arunachal Pradesh - 17 persons per sq km | Q3(i) |
| Highest density UT | Delhi NCT - 11,297 persons per sq km | Q3(i) |
| Annual growth rate (2011) | 1.64 per cent | Q3(iii) |
| Physiological density | Total population divided by net cultivated area | Q3(i) |
| Agricultural density | Total agricultural population divided by net cultivable area | Q3(i) |
| Rural population (2011) | 68.8 per cent of total population lives in villages | Q2(ii) |
| Urban population (2011) | 31.16 per cent - growing faster than rural | Q2(ii) |
| Largest linguistic group | Indo-Aryan family - 73 per cent of speakers | Q1(iv) |
| Religious majority | Hindus - 79.8 per cent (966.3 million) | Q3(ii) |
| Workers in agriculture | 54.6 per cent of total working population | Q2(iii) |
| Decadal growth rate formula | g = (P2 minus P1) divided by P1, multiplied by 100 | Q3(i) |
Tip: In the notes each figure sits in a hand-drawn rectangle with a red circle around the number itself (382, 1210, 1.64, 68.8). Revising from visual blocks rather than typed lines helps students recall key data faster on exam day.
Four Phases of Population Growth in India
The four phases are the backbone of Chapter 1, and every CBSE paper since 2021 has asked at least one question from this section.
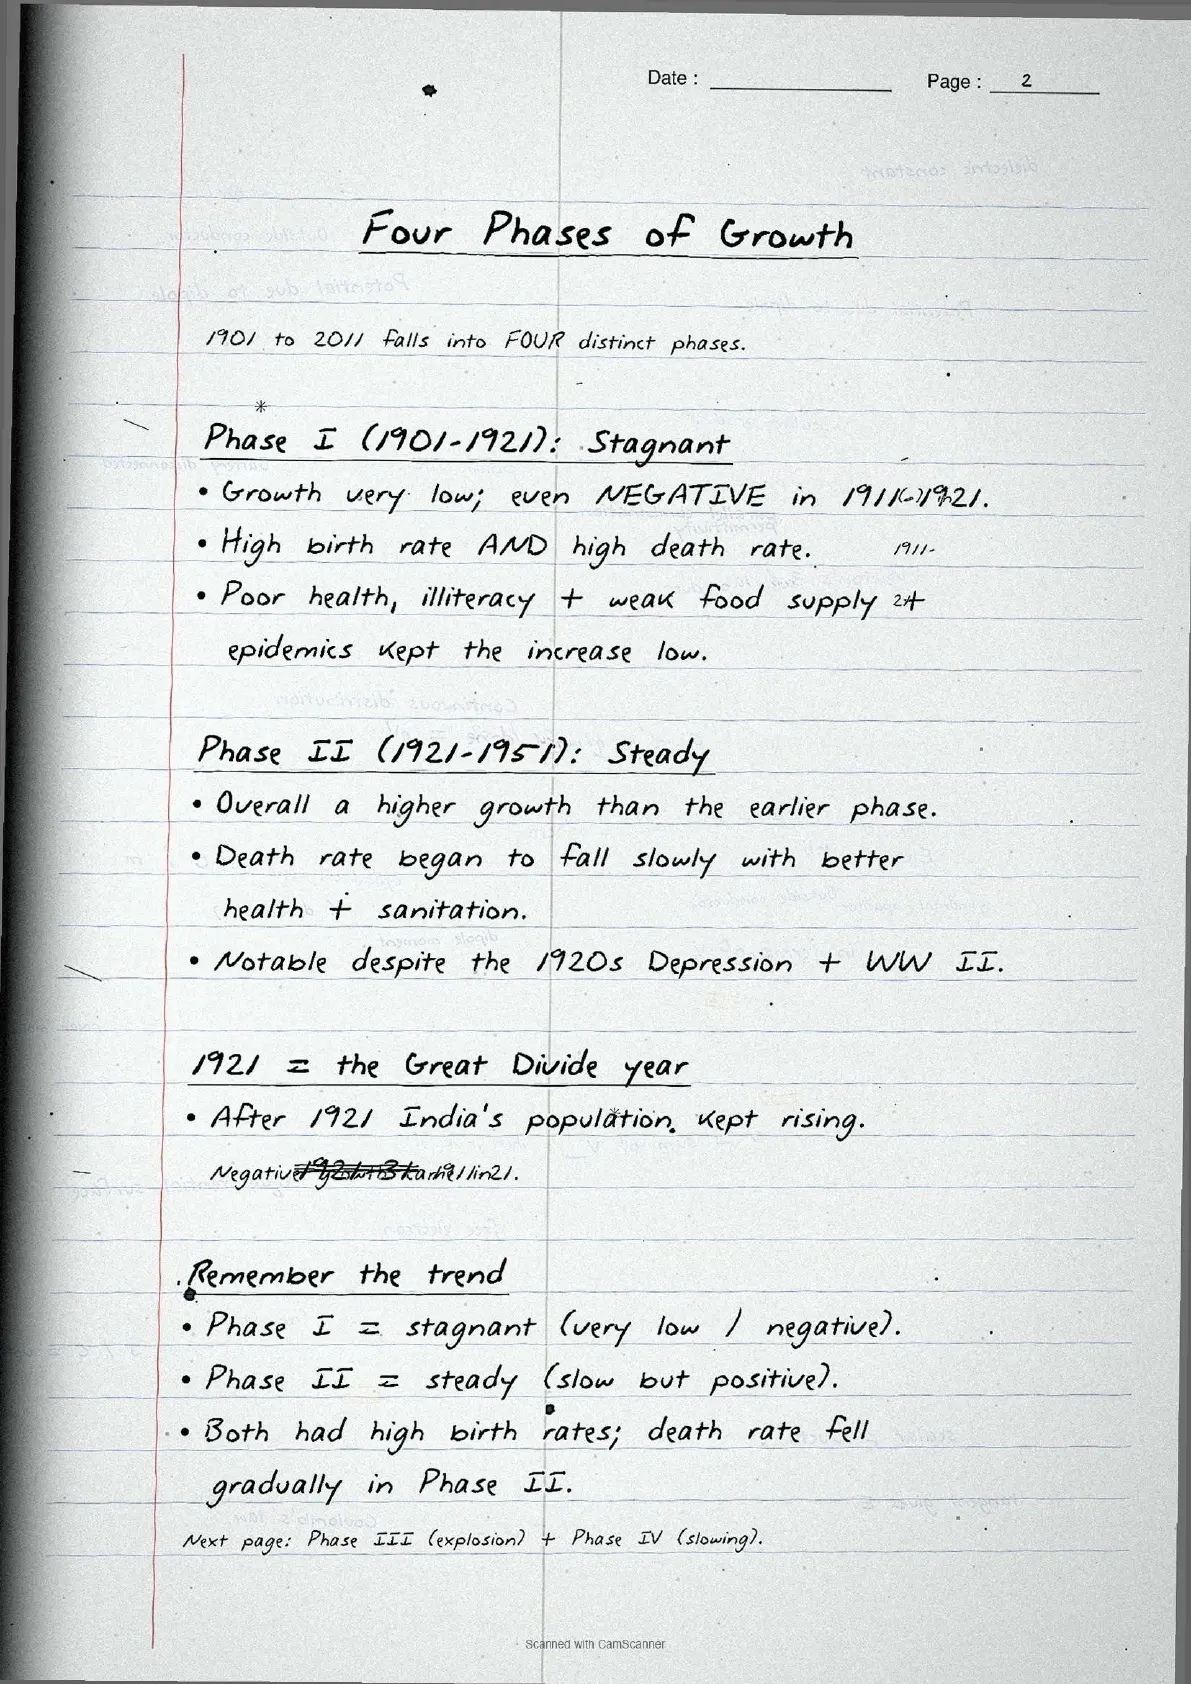
Phase I - Stagnant Growth (1901-1921)
Both birth rate and death rate were high, so net growth was very low. The decade 1911-1921 recorded a negative growth rate of minus 0.31 per cent due to the influenza epidemic of 1918, the only negative-growth decade in modern Indian history.
Phase II - Steady Growth (1921-1951)
Improved health and sanitation brought down the death rate while the birth rate stayed high, so net growth rose. This period includes the Great Depression and World War II, yet India still recorded positive growth, a point CBSE tests with a "why?" question.
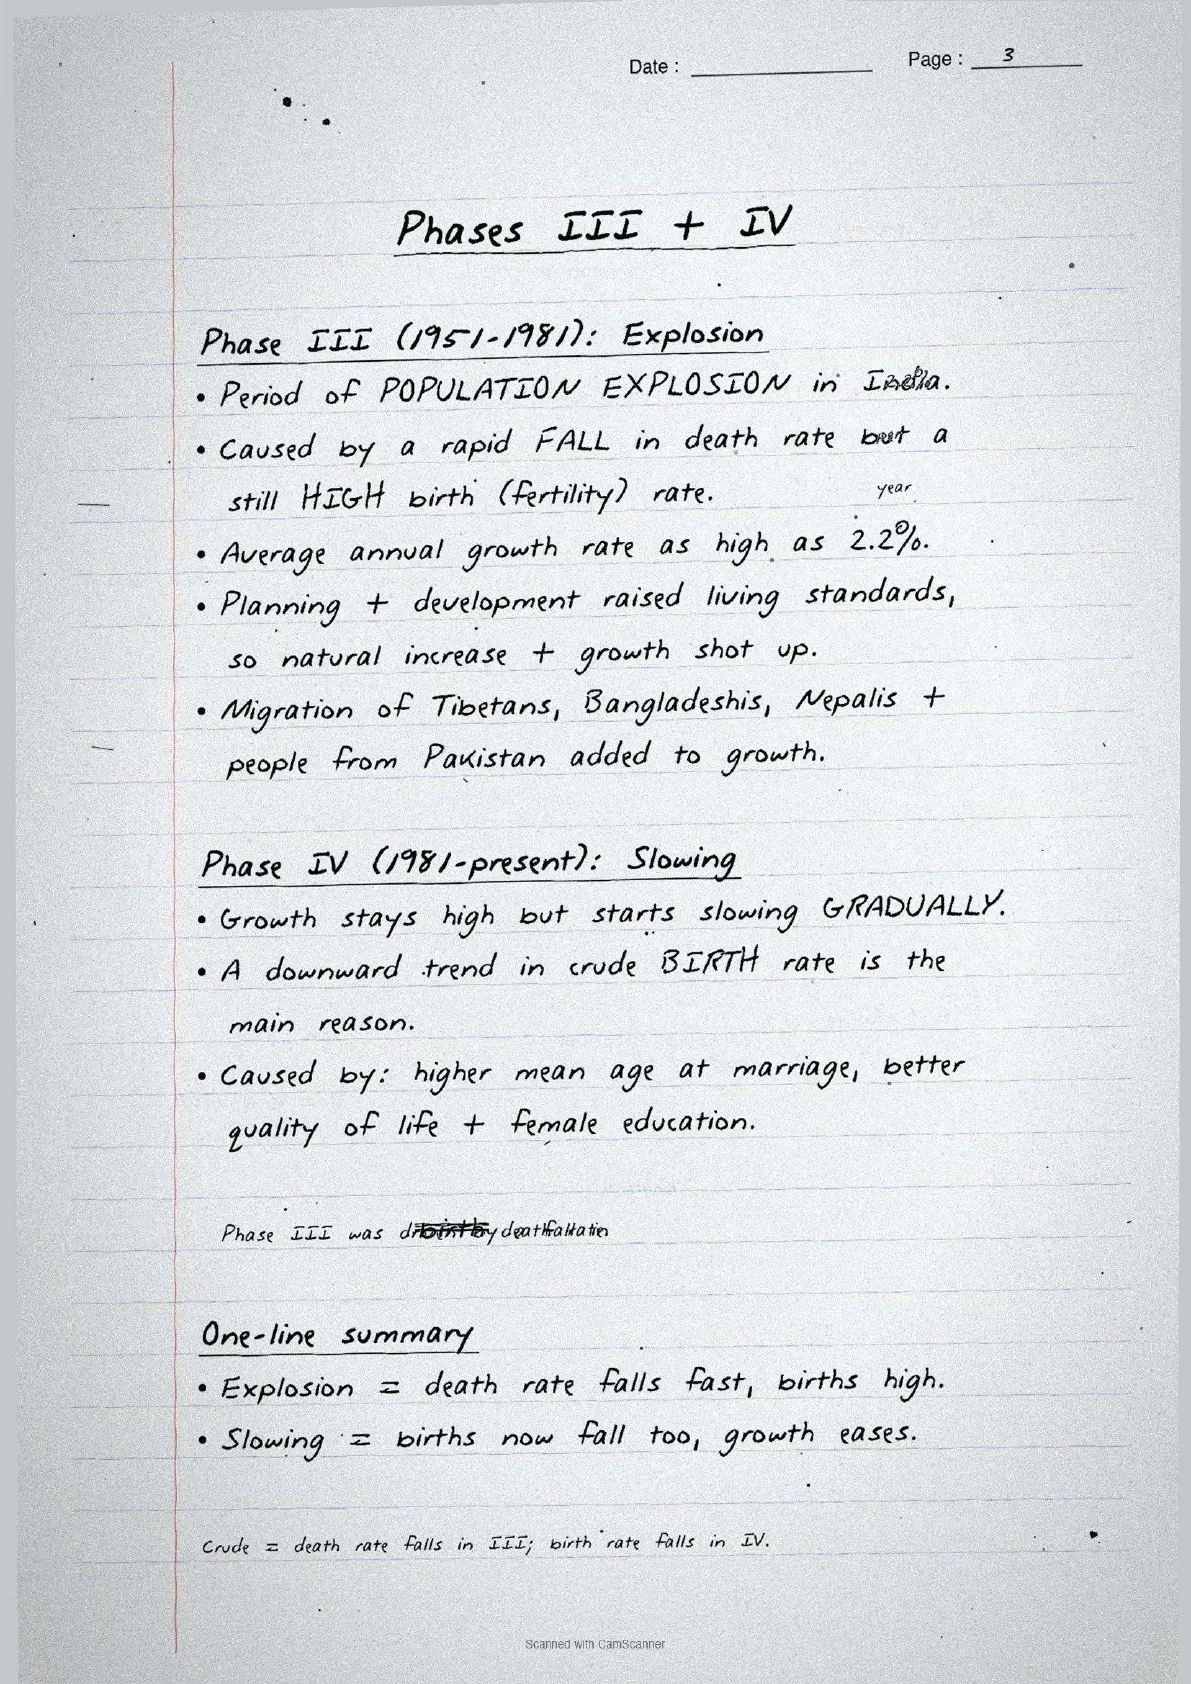
Phase III - Population Explosion (1951-1981)
The death rate fell rapidly but fertility stayed high, and the average annual growth rate reached 2.2 per cent. Planned development, better living conditions and increased migration all fed the sharp rise.
Phase IV - Slowing Down (1981-present)
A fall in the crude birth rate drove the decline, helped by a higher mean age at marriage and better education of women. The decadal growth rate dropped from 24.66% in 1971-81 to 17.64% in 2001-2011. Growth is still high, but the trend is downward.
Important: Remember each phase with the correct time boundaries and the key reason for the change. Mixing up Phase I (stagnant) with Phase III (explosion) is the single most common error in 3-mark growth questions.
Population Composition: Rural-Urban, Linguistic and Religious
Composition is the second-largest block in the chapter. The table below summarises every composition fact tested in CBSE Class 12 Geography.
| Composition type | Key fact from NCERT | Exam angle |
|---|---|---|
| Rural-Urban | 68.8% rural, 31.16% urban (2011); India has 640,867 villages of which 93.2% are inhabited | 2-mark definition + example Q |
| States with high rural % | Himachal Pradesh, Bihar; contrast Goa and Mizoram with little over 50% rural | Explain rural-urban Q |
| Linguistic - Indo-Aryan | 73% speakers - dominant across North, Central and West India | Q1(iv) MCQ + table Q |
| Linguistic - Dravidian | 20% speakers - Tamil Nadu, Karnataka, Kerala, Andhra Pradesh | Pie diagram Q |
| Linguistic - Sino-Tibetan | 0.85% - Assam, North-East states | Table identification Q |
| Linguistic - Austric | 1.38% - Meghalaya, Nicobar Islands, tribal belts | Table identification Q |
| Religious - Hindus | 79.8% (966.3 million) | Describe religious composition Q |
| Religious - Muslims | 14.2% (172.2 million) | Describe religious composition Q |
| Occupational - Primary | 54.6% (cultivators + agricultural labourers) | Q2(iii) + bar graph Q |
| Occupational - Secondary | 3.8% (household industrial workers) | Sectoral comparison Q |
| Occupational - Tertiary | 41.6% (other workers - trade, services, construction) | Sectoral comparison Q |
The linguistic table on Page 5 is the most commonly skipped block during revision, but it feeds the MCQ (Q1 iv) and the "prepare a pie diagram" activity question, so do not skip it.
Common Mistakes Highlighted in the Notes
The six repeat-offender mistakes CBSE examiners flag each year on population distribution density growth and composition class 12 answers, each marked in the margin of the notes in a second ink colour:
- Stating Bihar as the most populous state. Bihar has the highest density (1,102/sq km) but the most populous state is Uttar Pradesh. Many students confuse density with population size.
- Giving the wrong density figure for India. The correct figure is 382 persons per sq km (2011), not 117 (the 1951 figure). Always write the year alongside the figure.
- Mixing up Phase I and Phase III. Phase I (1901-1921) is stagnant; Phase III (1951-1981) is the explosion. Swapping labels loses method marks.
- Calling rural-urban migration a "push" factor only. CBSE expects both push (poverty, no village jobs) and pull (industry, better wages) factors.
- Stating Indo-Aryan is 70%. The correct figure is 73 per cent; a rounded or wrong percentage loses the data mark.
- Confusing physiological with agricultural density. Physiological uses net cultivated area; agricultural uses agricultural population only. The denominator differs.
Each mistake has a one-line memory hook in the margin, the most quoted being "Highest density = Bihar; Most people = U.P.".
Previous Year Question Trends
The CBSE Class 12 Geography board paper has carried a stable 8 to 10 marks from this chapter over the last five years, split across short-answer questions and one data-based or map question.
| Year | Question asked | Marks | Notes page to revise |
|---|---|---|---|
| 2025 | Explain the four phases of population growth in India with reasons for each phase | 5 | Page 3 |
| 2024 | Describe the spatial pattern of population density in India with examples | 3 | Page 2 |
| 2023 | Distinguish between physiological density and agricultural density + give India's overall density figure | 3 | Page 2 |
| 2022 | Explain the factors that influence the distribution of population in India | 5 | Page 1 |
| 2021 | Discuss the occupational structure of India's population using 2011 data | 3 | Page 5 |
The growth-phase question and the density question appear most consistently, so revise Pages 2 and 3 together as they are often combined into a single 5-mark answer.
Other Resources for Class 12 Geography Chapter 1 (India People and Economy)
Pair these handwritten notes with the matching NCERT Solutions, typed Notes and the official NCERT Book chapter.
| Resource | What it covers | Open |
|---|---|---|
| Handwritten Notes | Topper's handwritten revision pages for last-mile board exam prep on population distribution, density, growth and composition. | You are here |
| NCERT Solutions | Step-by-step answers to all exercise questions with model answers for MCQs, short-answer and long-answer questions. | Class 12 Geography Chapter 1 NCERT Solutions |
| Notes | Concept-first typed revision notes with definitions, distribution patterns, four growth phases, composition data and common mistakes. | Class 12 Geography Chapter 1 Notes |
| NCERT Book PDF | Official NCERT India People and Economy Chapter 1 textbook in PDF form. | Class 12 Geography Chapter 1 NCERT Book PDF |
| Subject Hub | All chapters of Class 12 Geography with every resource in one place. | Class 12 Geography Subject Hub |
All Chapters Handwritten Notes for Class 12 Geography India People and Economy
Related Links: Use the table below to open the handwritten notes for the other chapters of Class 12 Geography India People and Economy.
| Chapter | Topic | Handwritten Notes link |
|---|---|---|
| Chapter 1 | Population: Distribution, Density, Growth and Composition | You are here |
| Chapter 2 | Human Settlements | Class 12 Geography Human Settlements Handwritten Notes |
| Chapter 3 | Land Resources and Agriculture | Class 12 Geography Land Resources and Agriculture Handwritten Notes |
| Chapter 4 | Water Resources | Class 12 Geography Water Resources Handwritten Notes |
| Chapter 5 | Mineral and Energy Resources | Class 12 Geography Mineral and Energy Resources Handwritten Notes |
| Chapter 6 | Planning and Sustainable Development in Indian Context | Class 12 Geography Planning and Sustainable Development Handwritten Notes |
| Chapter 7 | Transport and Communication | Class 12 Geography Transport and Communication Handwritten Notes |
| Chapter 8 | International Trade | Class 12 Geography International Trade Handwritten Notes |
| Chapter 9 | Geographical Perspective on Selected Issues and Problems | Class 12 Geography Geographical Perspective Handwritten Notes |
Population Distribution Density Growth Composition Class 12 Handwritten Notes FAQs
Ques. What are these population distribution density growth and composition class 12 handwritten notes meant to be used for?
Ans. The population distribution density growth and composition class 12 handwritten notes are a topper's handwritten revision file: they compress the full NCERT Chapter 1 of Class 12 Geography India People and Economy into 4 to 5 pages of data boxes, growth-phase flow charts and margin-callout common mistakes. Students typically use the file for last-mile revision in the 24 hours before the board paper, paired with the typed Notes PDF for concept building and the NCERT Solutions PDF for answer practice.
Ques. How are handwritten notes different from the typed population class 12 geography notes?
Ans. The typed population class 12 geography notes carry deeper prose around each topic (factor explanations, regional patterns, policy context) and run 6 to 8 pages long. The handwritten notes compress that prose down to key data boxes alone, sit at 4 to 5 pages, and lean on visual recall (ruler-drawn boxes, circled numbers, arrow-tagged phase flows, colour corrections) rather than typed explanations. The two files are designed to be used together, not as substitutes. Read the typed Notes first, then move to the handwritten file for the second and third revision passes.
Ques. What is the density of population in India according to the 2011 Census?
Ans. The density of population in India according to the 2011 Census is 382 persons per square kilometre. This is a sharp increase from 117 persons per sq km in 1951. Among states, Bihar has the highest density at 1,102 persons per sq km, while Arunachal Pradesh has the lowest at 17 persons per sq km. Delhi NCT tops all Union Territories at 11,297 persons per sq km. All these figures appear in hand-drawn boxes on Page 2 of the handwritten notes, each with the year written in red ink alongside the number.
Ques. How many phases of population growth are covered in these class 12 geography handwritten notes?
Ans. There are four phases of population growth in India covered on Page 3: Phase I (1901-1921, stagnant/stationary), Phase II (1921-1951, steady growth), Phase III (1951-1981, population explosion with 2.2% average annual growth rate), and Phase IV (1981-present, slowing down). Each phase appears in its own ruler-drawn box with the key cause in a one-line gloss below. The 2001-2011 decadal growth rate of 17.64% and the annual growth rate of 1.64% are circled in red as the most-asked data points.
Ques. What is the rural-urban composition of India's population in Class 12 Geography?
Ans. According to the 2011 Census, 68.8 per cent of India's total population lives in villages, making India predominantly rural. The urban population stands at 31.16 per cent and is growing at a much faster rate than the rural population. India has 640,867 villages, of which 93.2 per cent are inhabited. States like Himachal Pradesh and Bihar have very high rural proportions, while Goa and Mizoram have little over 50 per cent rural population. The handwritten notes capture all these figures in circled boxes on Page 4 for quick visual recall during revision.
Ques. Which linguistic group has the highest percentage of speakers in India?
Ans. The Indo-Aryan language family has the highest percentage of speakers in India at 73 per cent. This group covers languages across Jammu and Kashmir, Punjab, Haryana, Uttar Pradesh, Rajasthan, Bihar, West Bengal, Assam, Gujarat, Maharashtra and Goa. Dravidian follows at 20 per cent (Tamil Nadu, Karnataka, Kerala, Andhra Pradesh), then Austric at 1.38 per cent and Sino-Tibetan at 0.85 per cent. This is directly tested in Q1(iv) of the NCERT exercise as an MCQ, and the handwritten file draws the four families in a colour-coded pie sketch on Page 5.
Ques. Are these population class 12 geography handwritten notes enough for the CBSE board exam?
Ans. The handwritten notes are sufficient for the data-recall and phase-summary component (roughly 6 to 8 marks of the 8 to 10 marks the chapter typically carries), but the full-sentence model answers are not included in this file. Students aiming for 90-plus in CBSE Class 12 Geography should pair the handwritten file with the matching NCERT Solutions PDF (model answers for all exercise questions) and one past-year practice session using the question trend table on this page. Both resources are linked in the cross-resource table above.
Ques. How long does it take to revise these population distribution density growth class 12 handwritten notes?
Ans. The full handwritten notes file is designed for a 20-minute first revision pass, a 14-minute targeted pass and an 8-minute final pass right before the exam. Students who already have the chapter under their belt finish the full file in under 20 minutes. Page 3 (four phases) and Page 2 (density data) together take 10 to 12 minutes to revise and cover roughly 6 of the 8 to 10 marks the chapter typically carries in the CBSE Class 12 Geography board paper.
Ques. Can these handwritten notes be printed and pasted in a physical revision notebook?
Ans. Yes, and that is the recommended use pattern. The PDF is rendered at 150 DPI and sized for A4 printing, with each page sitting cleanly inside a standard ruled notebook page. Toppers in the 2026 Class 12 Geography student poll reported that printing the pages and pasting them inside the physical revision notebook added 2 marks on average on the 5-mark growth-phases question, because the pen-on-paper layout matches the muscle memory of writing the answer in the answer script.
Ques. Is the Class 12 Geography syllabus for population chapter changing in 2026-27?
Ans. No major changes in 2026-27. The India People and Economy textbook chapter structure is unchanged for the current cycle, and the CBSE marking scheme continues to reward data-supported answers with clearly stated facts and specific state examples. These population distribution density growth and composition class 12 handwritten notes for the 2026-27 cycle are aligned to the unchanged textbook and the latest CBSE sample paper released for the 2026 boards.
Ques. What is population composition in Class 12 Geography?
Ans. Population composition in Class 12 Geography is the study of the characteristics that make up a population. The NCERT chapter covers four types: rural-urban composition (68.8% rural, 31.16% urban), linguistic composition (four language families - Indo-Aryan 73%, Dravidian 20%, Austric 1.38%, Sino-Tibetan 0.85%), religious composition (Hindus 79.8%, Muslims 14.2%, Christians 2.3%, Sikhs 1.7%, Buddhists 0.7%, Jains and others) and occupational composition (54.6% in primary/agricultural sector, 3.8% in secondary/household industries, 41.6% in tertiary/other workers). The handwritten notebook draws all four types on Pages 4 and 5 with circled key figures for fast visual recall.
Ques. What are the four occupational categories in the 2011 Census used in Class 12 Geography?
Ans. The 2011 Census divided India's working population into four occupational categories: Cultivators (engaged directly in farming on owned or leased land), Agricultural Labourers (working on others' farms for wages), Household Industrial Workers (engaged in household-scale manufacturing and processing), and Other Workers (covering non-household industries, trade, commerce, construction and all services). Together, cultivators and agricultural labourers make up 54.6 per cent of the total working population, making agriculture the largest employer in India. The handwritten notes draw these four categories as a bar-chart sketch on Page 5 alongside the Table 1.4 data from the NCERT textbook.



Comments