




These Class 12 Geography Chapter 1 Population Distribution Density Growth and Composition notes cover every NCERT definition, the four phases of growth, the full composition breakdown and key Census 2011 data, aligned to the 2026-27 syllabus for quick full-chapter revision.

- Concept-first revision of distribution patterns, the three density types, the four growth phases (1901-2011) and composition by residence, language, religion and occupation.
- All key 2011 Census data that CBSE, CUET and UPSC examiners pick, plus the decadal growth and occupational-structure tables.
- Cross-pointers to the matching NCERT Solutions, Handwritten Notes and NCERT Book PDF.
These notes are written by Collegedunia geography experts, mapped to the 2026-27 NCERT India: People and Economy textbook and checked against recent CBSE, CUET and UPSC question trends.
Student Feedback
72% of Class 12 students found the four growth phases the most-confused part, and 3 out of 4 rated the composition section most worth revising. Most finished a full revision in about 30 minutes.
Source: 2026-27 Class 12 Geography student poll, 10,200 CBSE students.
Quick Concept Recap: Population Chapter at a Glance
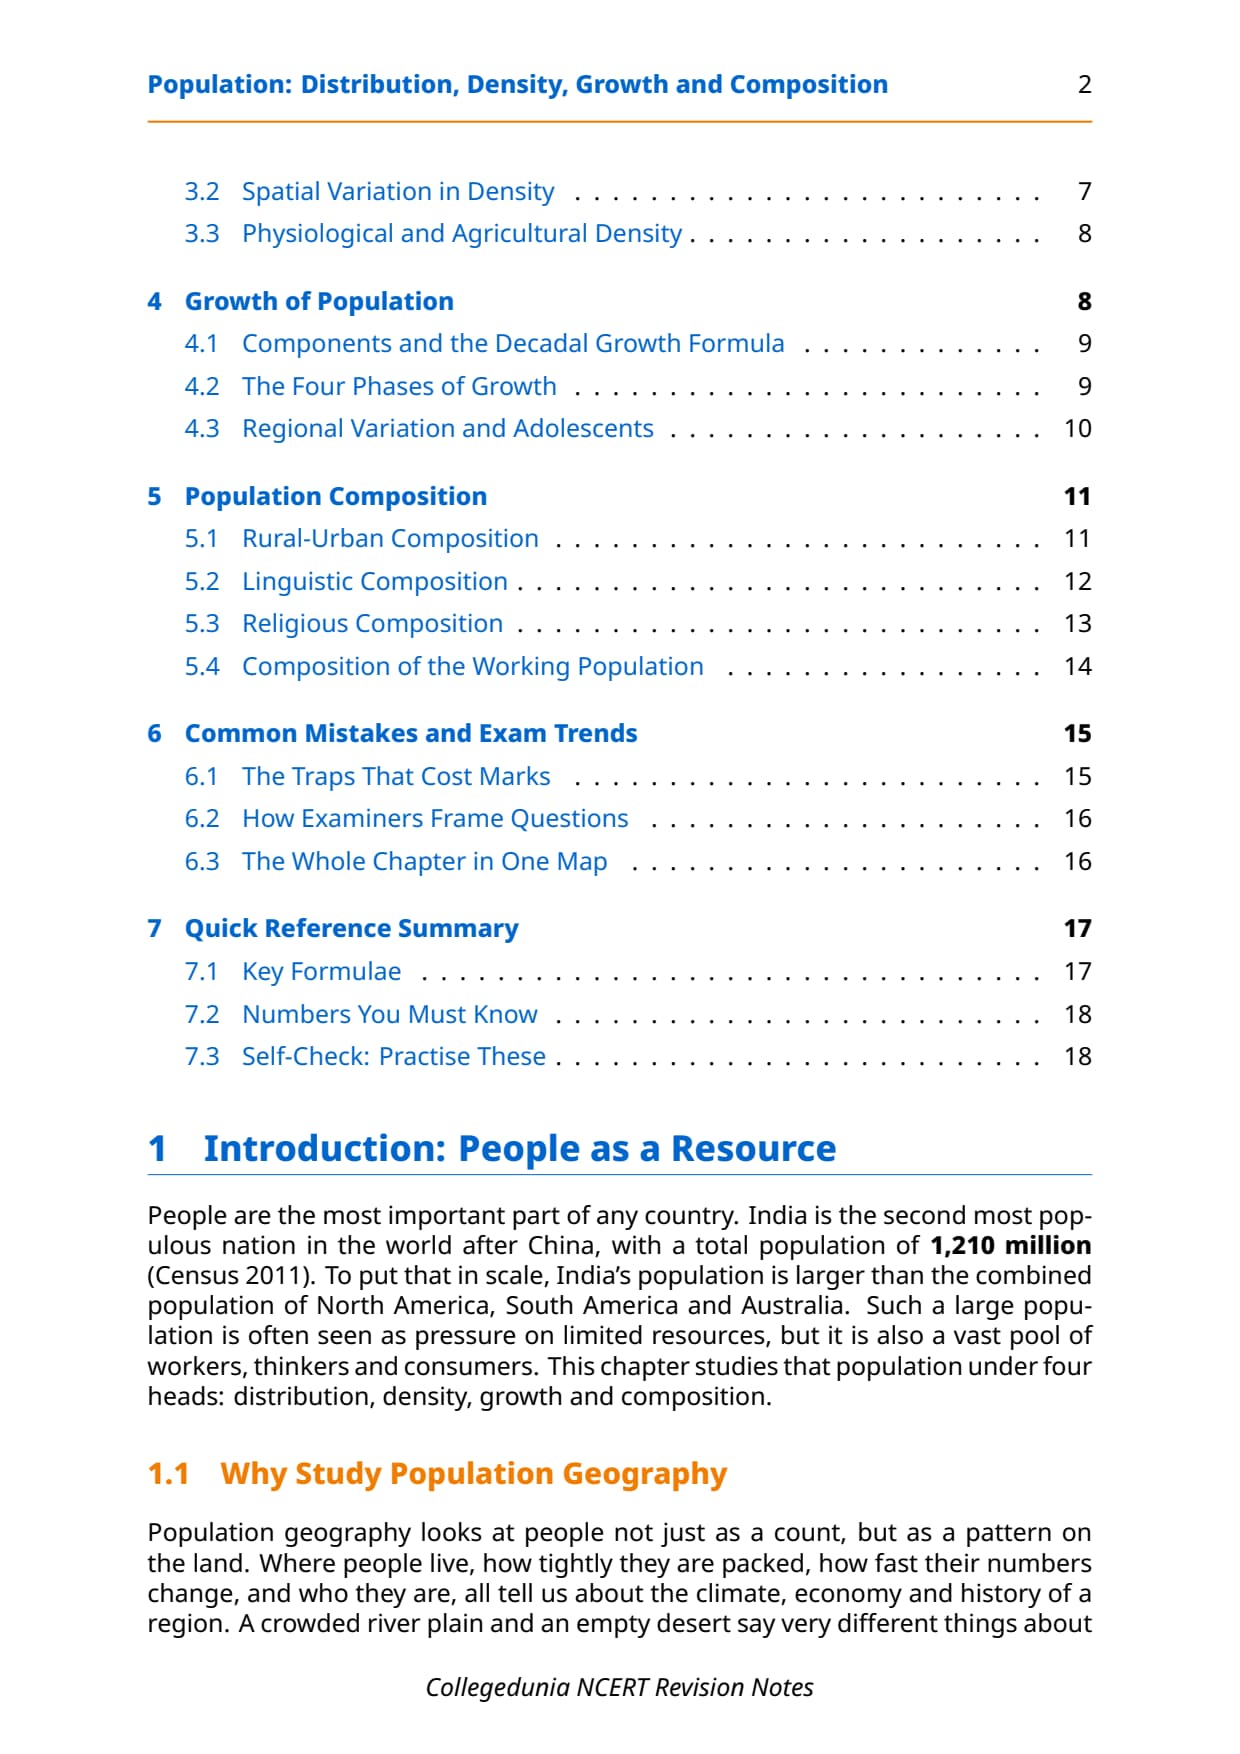
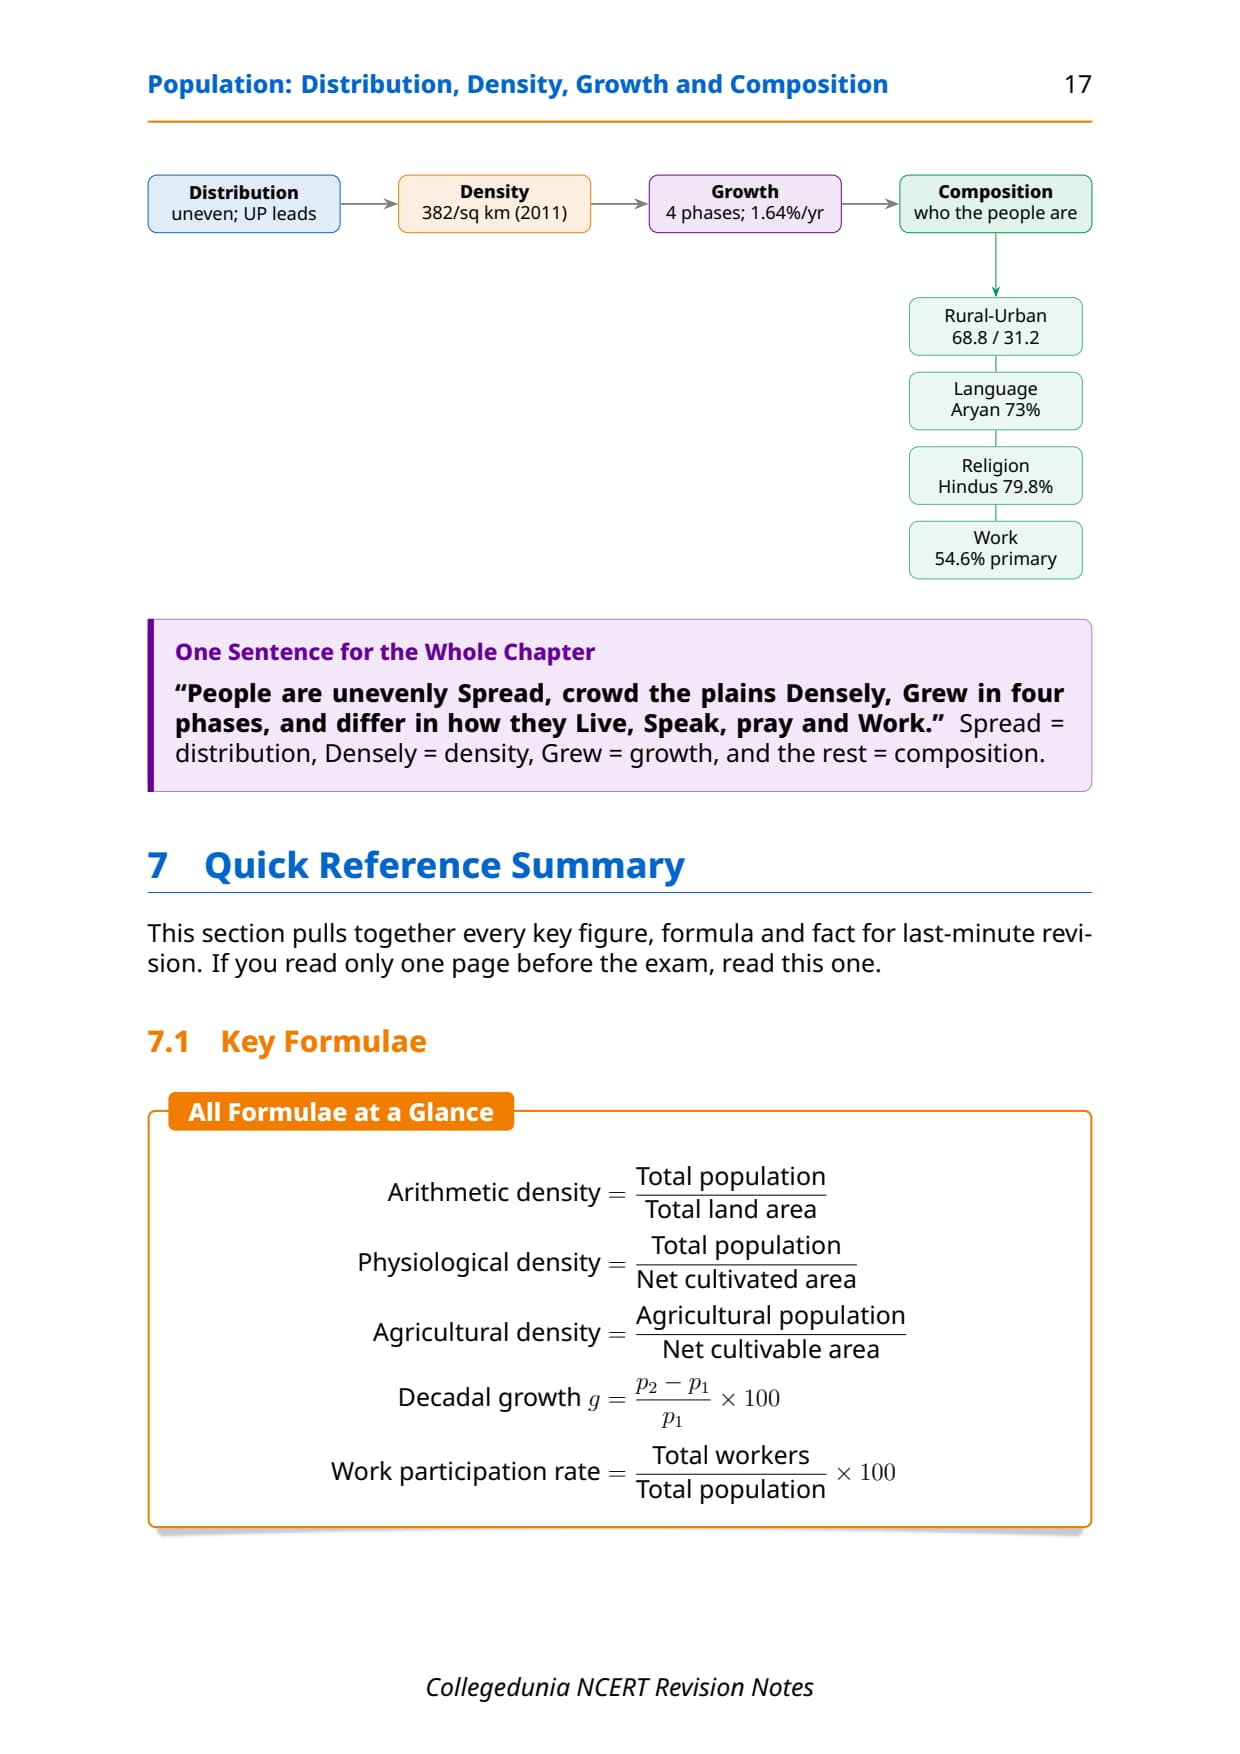
India had a total population of 1,210 million as per the 2011 Census, the second most populous country after China. The chapter moves through four themes: how population is spread (distribution), how crowded areas are (density), how fast it changes (growth), and what it looks like by residence, language, religion and occupation (composition).
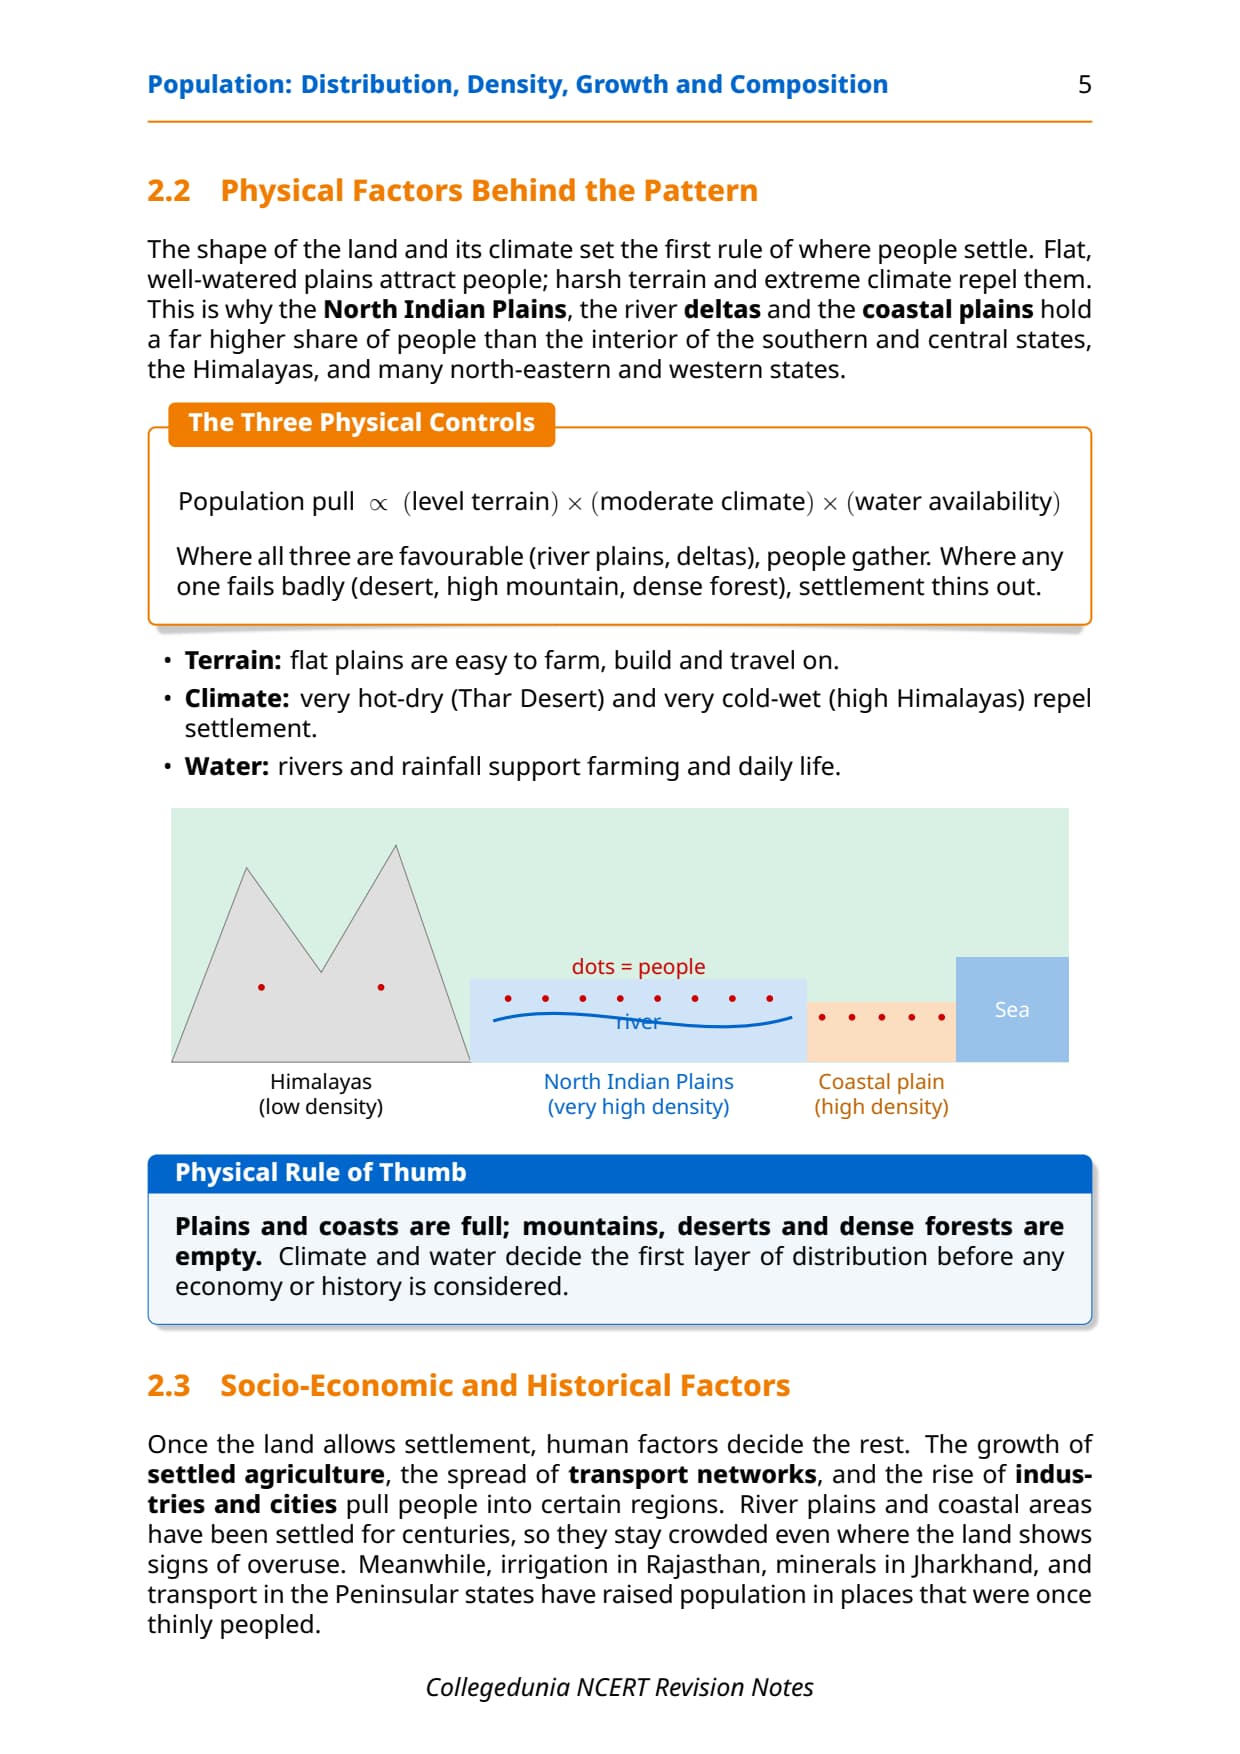
- Distribution: highly uneven; UP has the highest population, Arunachal Pradesh the lowest density (17/sq km).
- Density: arithmetic, physiological (net cultivated area) and agricultural (net cultivable area).
- Four growth phases: stagnant (1901-21), steady (1921-51), explosion (1951-81), slowing (1981 on).
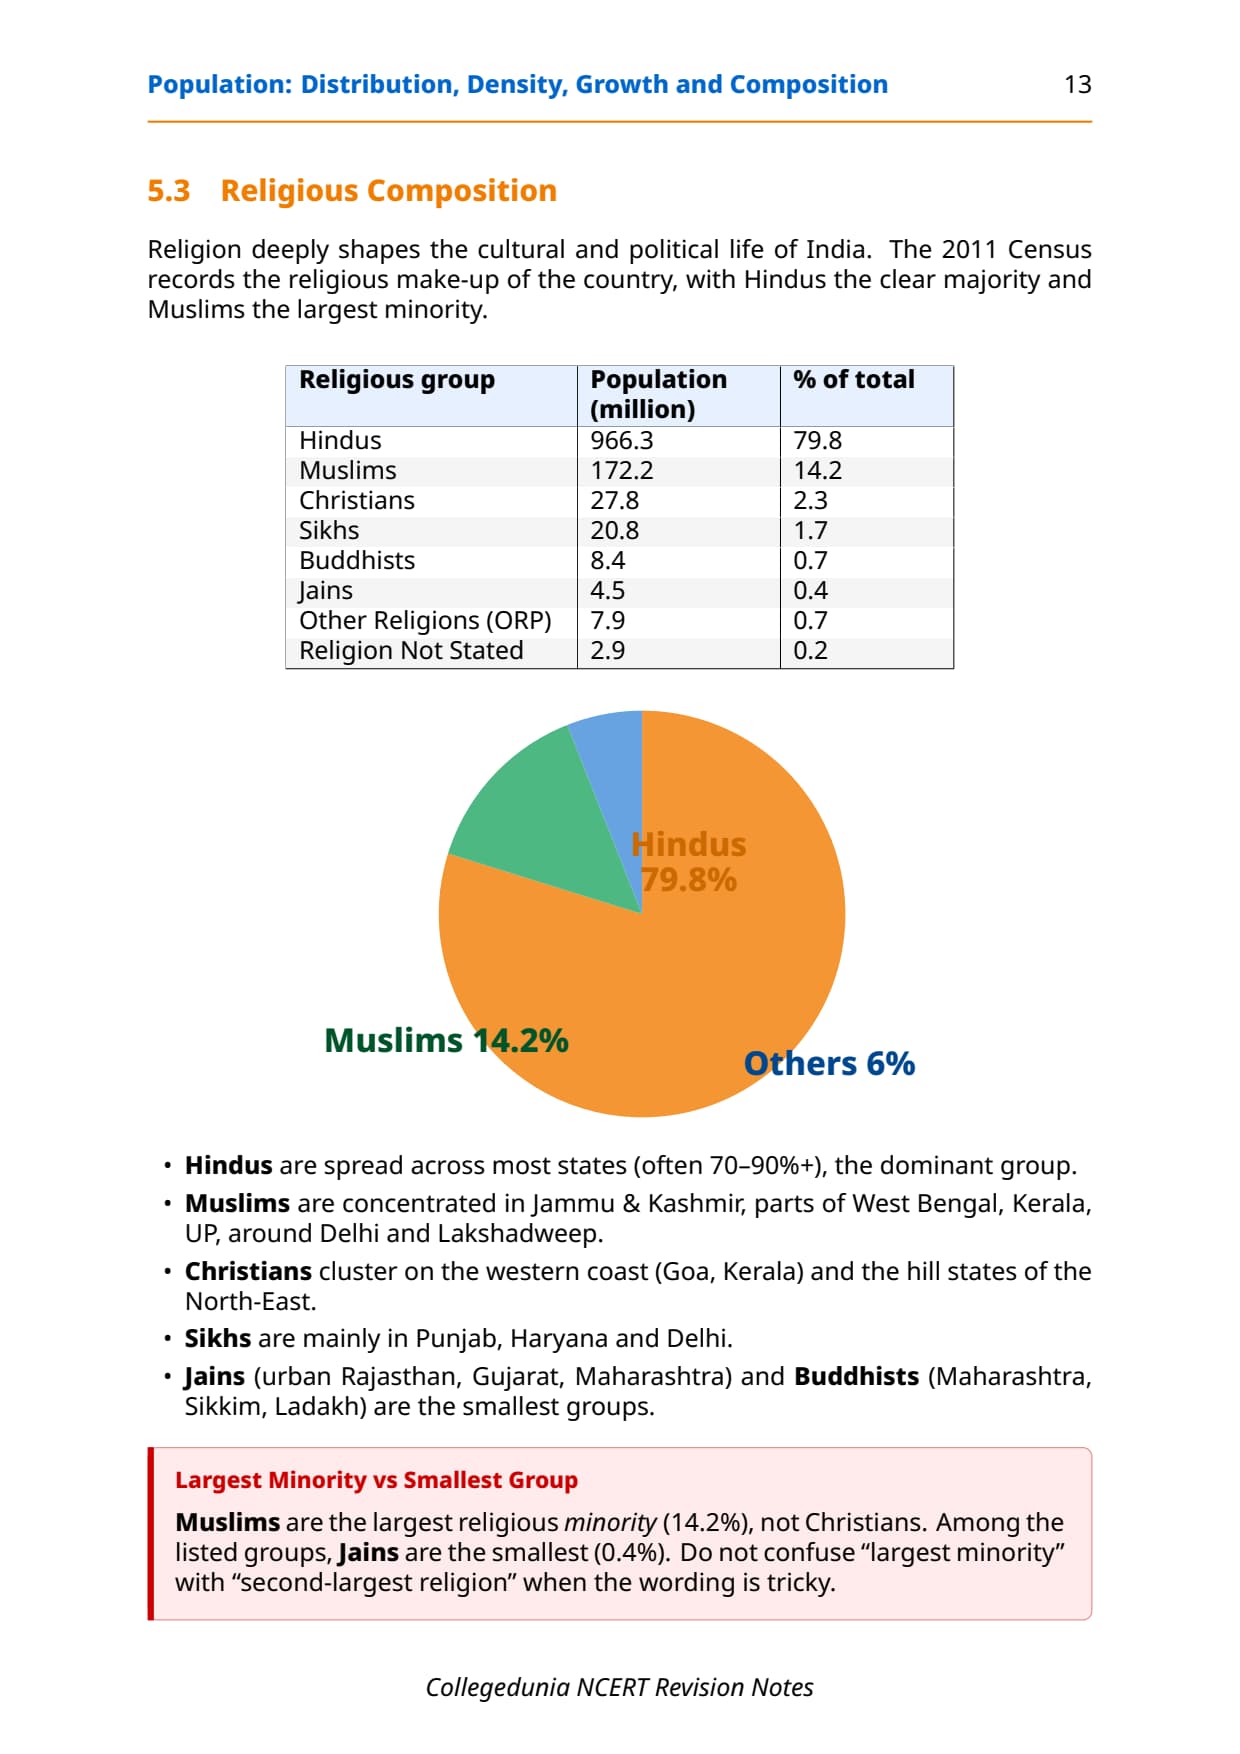
- Composition: 68.8% rural (2011); four language families; six religions; three occupation sectors.
- Adolescents: about 20.9% in the 10-19 group (2011), under National Youth Policy 2014.
Read these notes first, then use the matching NCERT Solutions for Class 12 Geography Chapter 1 for the exercise drill.
Source: Magnet Brains on YouTube
Sources of Population Data and Distribution of Population
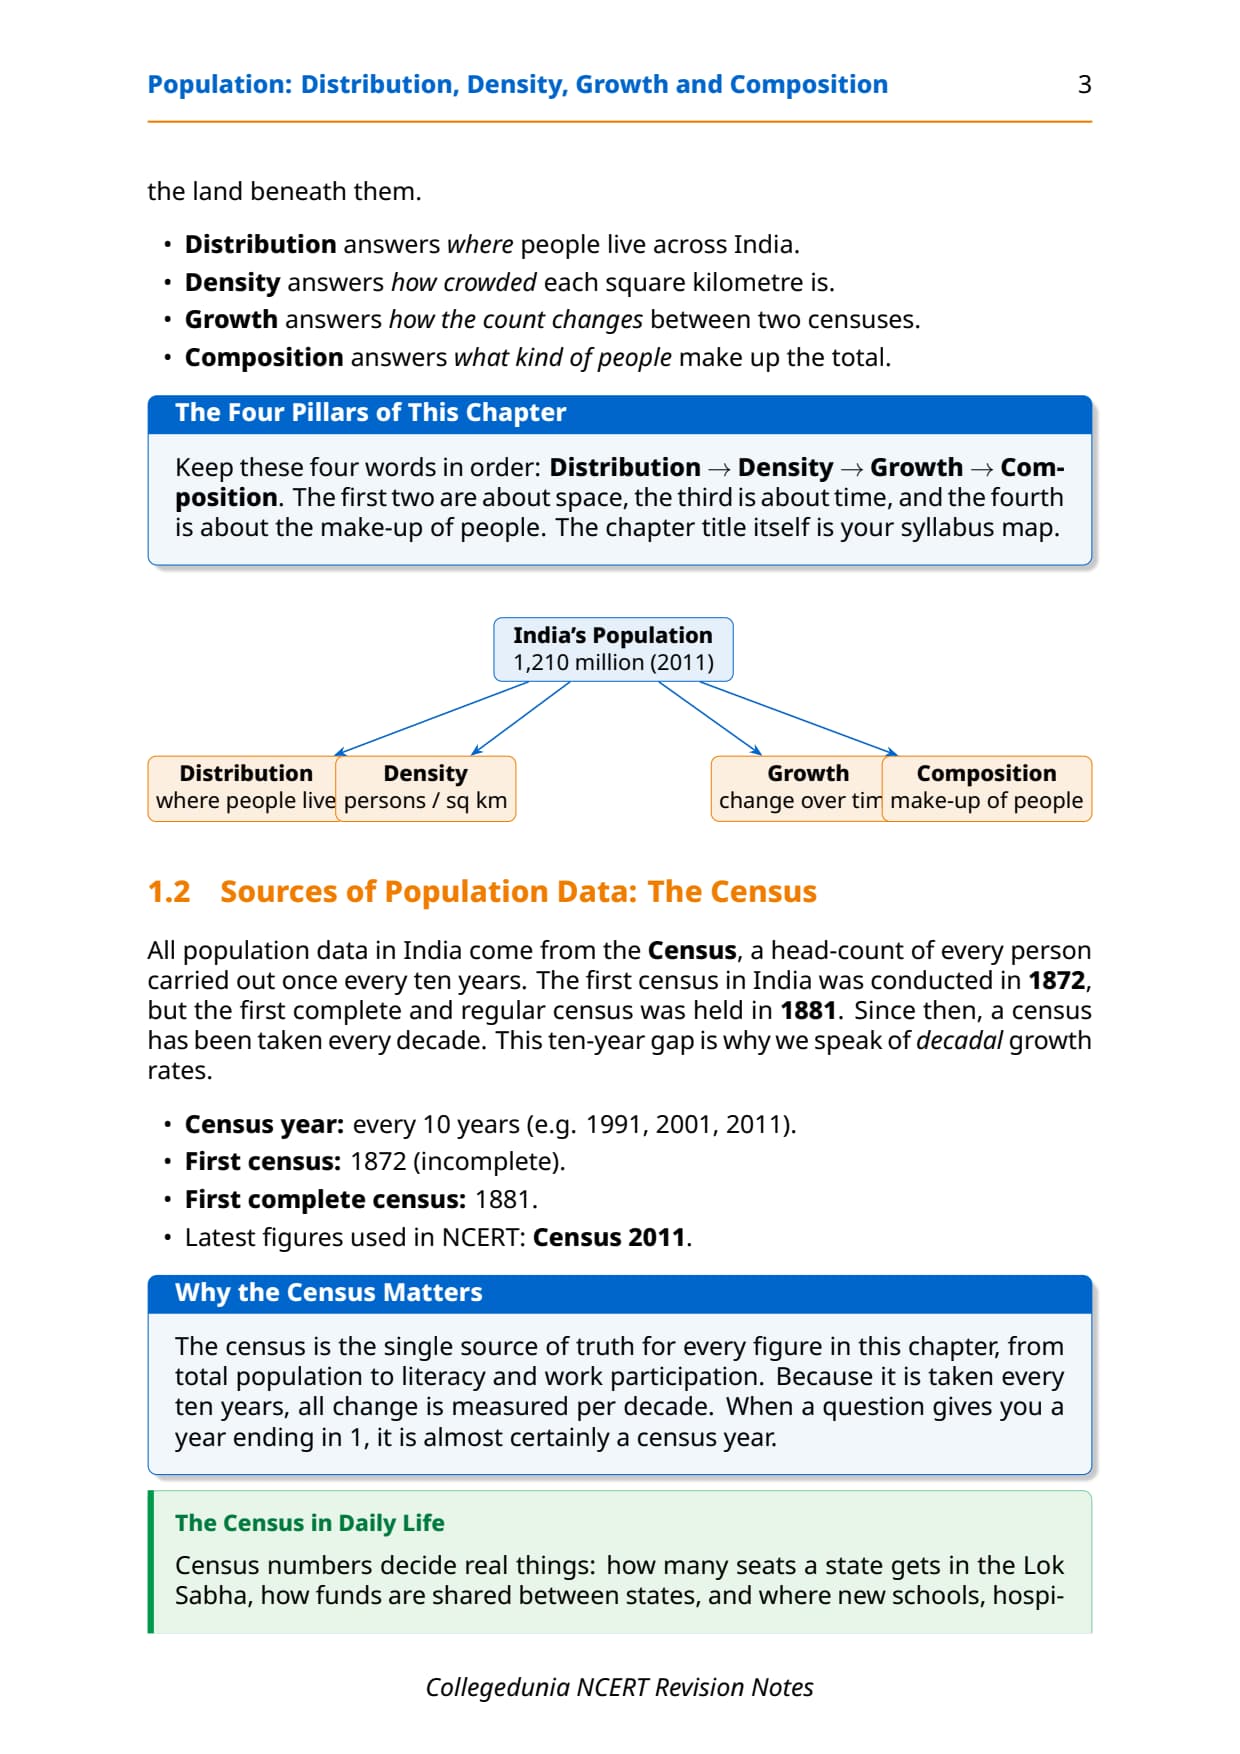
Population data come from the Census, held every 10 years. The first was in 1872 and the first complete one in 1881. The table maps where population concentrates and why.
| Region / State | Population feature (Census 2011) | Key exam point |
|---|---|---|
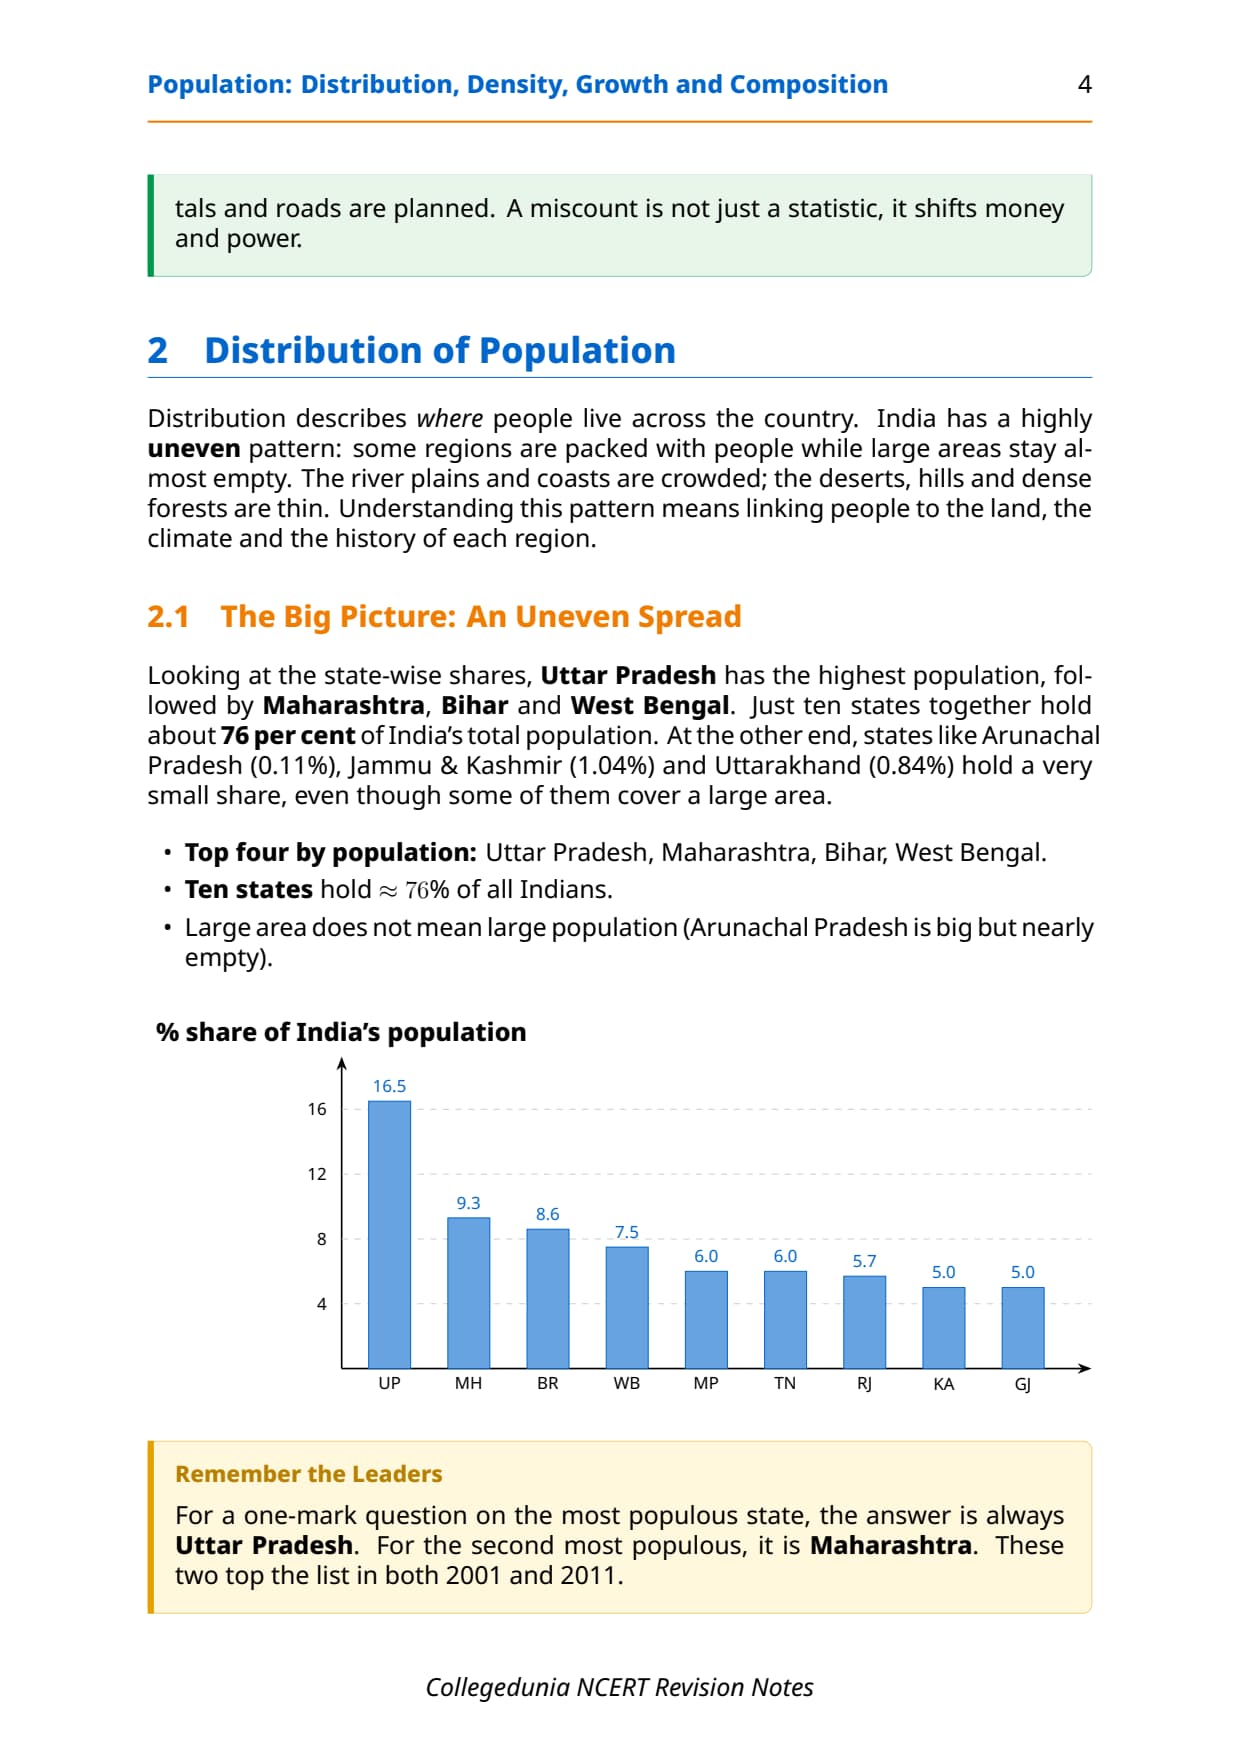
| Uttar Pradesh | Highest total population in India | Followed by Maharashtra, Bihar, West Bengal |
| Bihar, West Bengal, UP | High density in North Indian Plains | Fertile land, settled agriculture, transport |
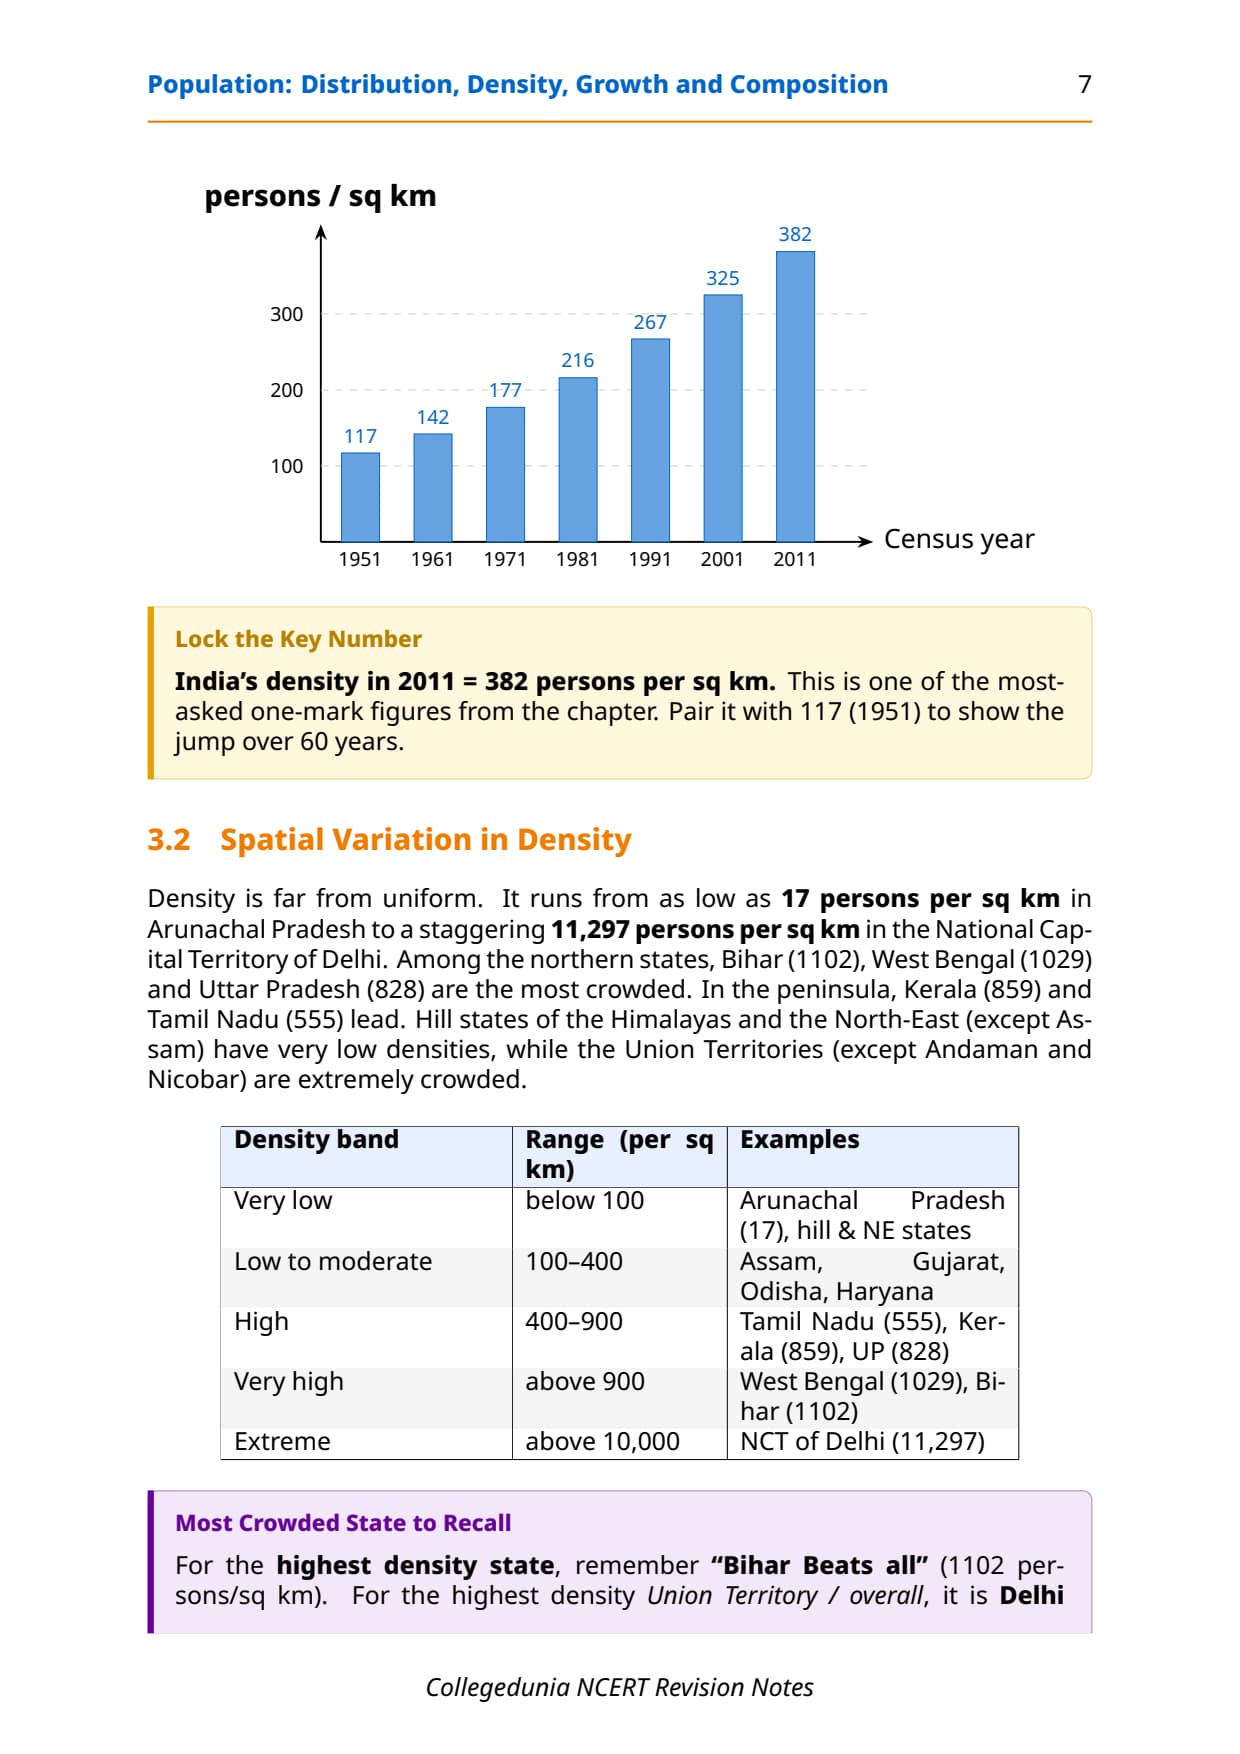
| Arunachal Pradesh | Lowest density: 17 persons per sq km | Harsh terrain, forest cover, poor connectivity |
| NCT Delhi | Highest density: 11,297 persons per sq km | Urbanisation, industrialisation, migration |
| Kerala, Tamil Nadu | High density in peninsular India | Irrigated agriculture, social development |
| Rajasthan, Himalayan states | Low to moderate density | Desert terrain, cold climate, poor water availability |
| Top 10 states together | Account for about 76% of total population | Includes UP, Maharashtra, Bihar, West Bengal, AP, TN, MP, Rajasthan, Karnataka, Gujarat |
Uneven distribution is driven by physical factors (climate, terrain, water) and socio-economic factors (settled agriculture, transport, industrialisation, settlement history). The North Indian Plains, river deltas and coasts are crowded because these factors work together there.
Density of Population: Arithmetic, Physiological and Agricultural
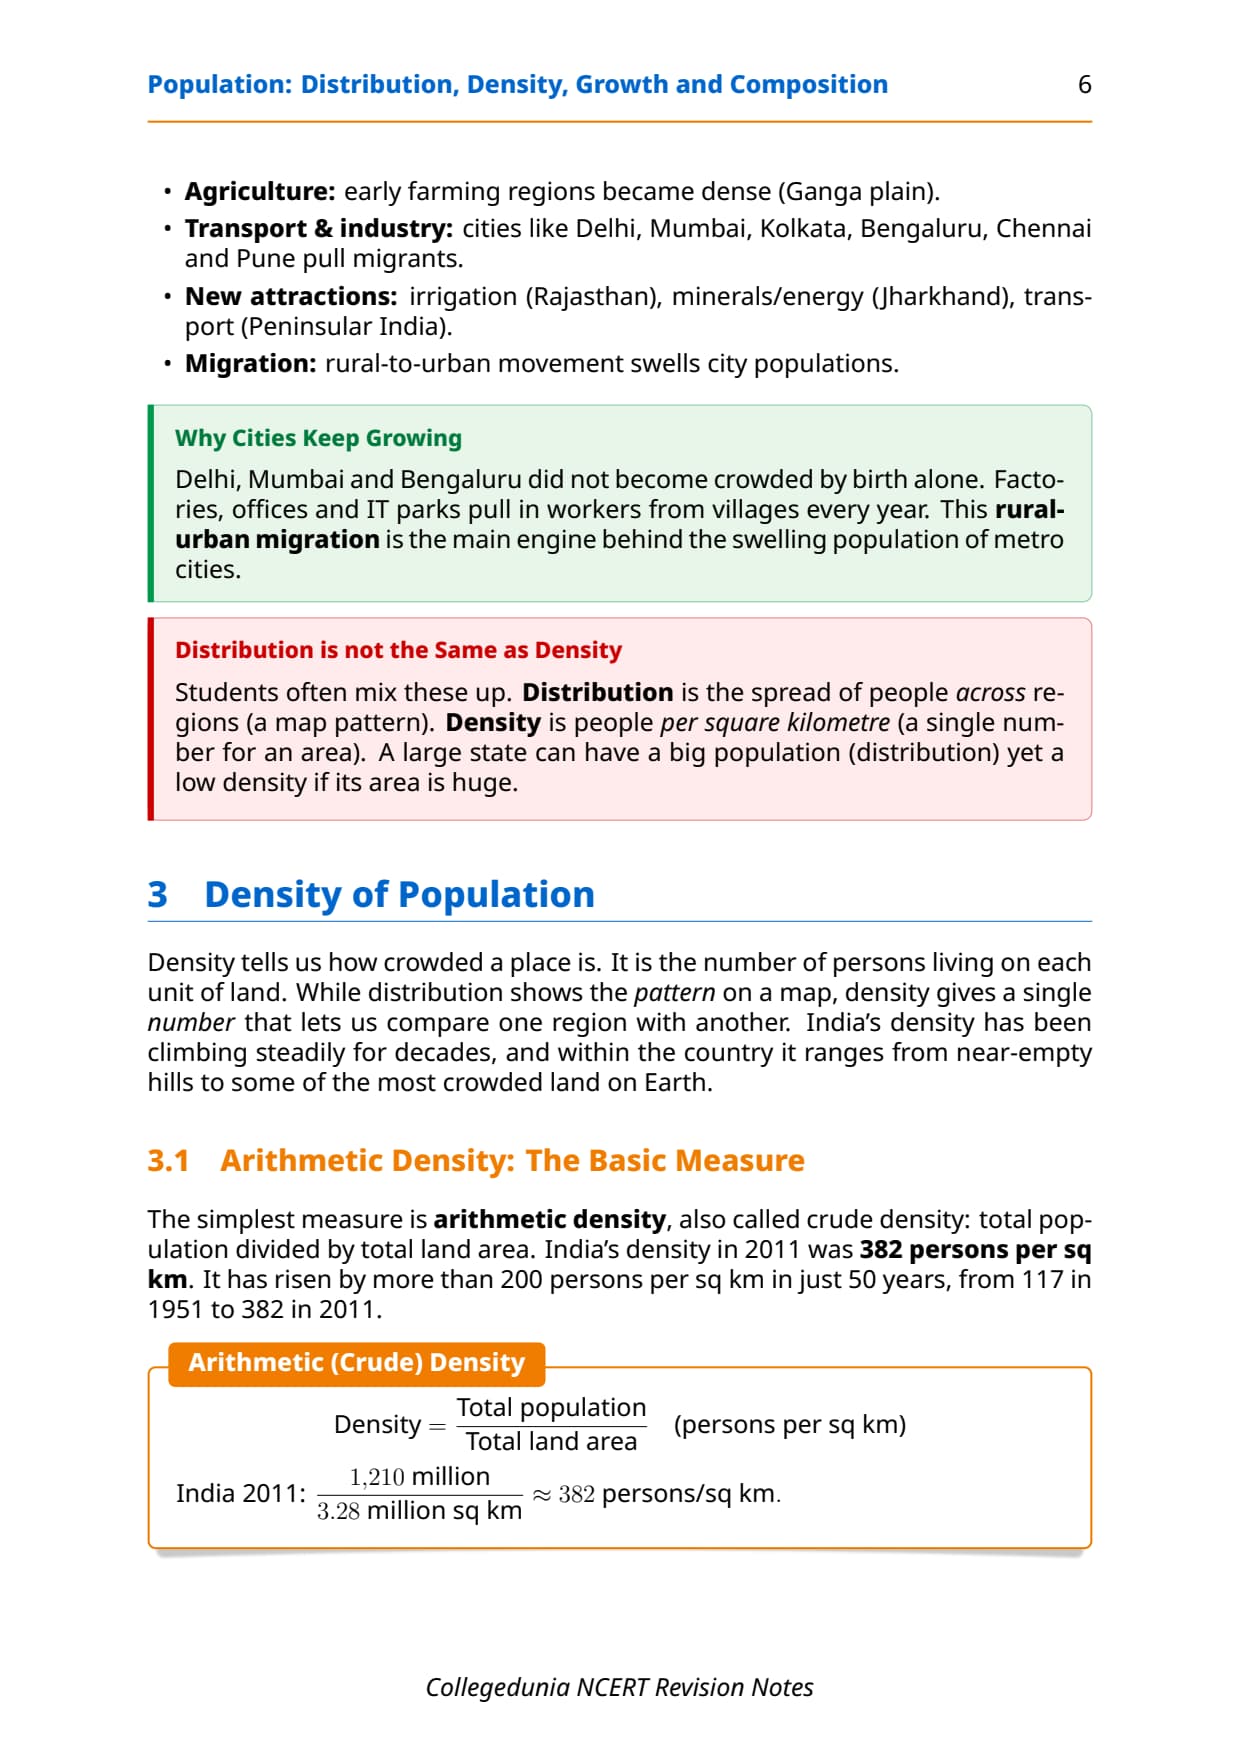
Density is the number of persons per unit area. India's average was 382 per sq km in 2011, up from 117 in 1951, but this hides large variation. NCERT introduces three density measures.
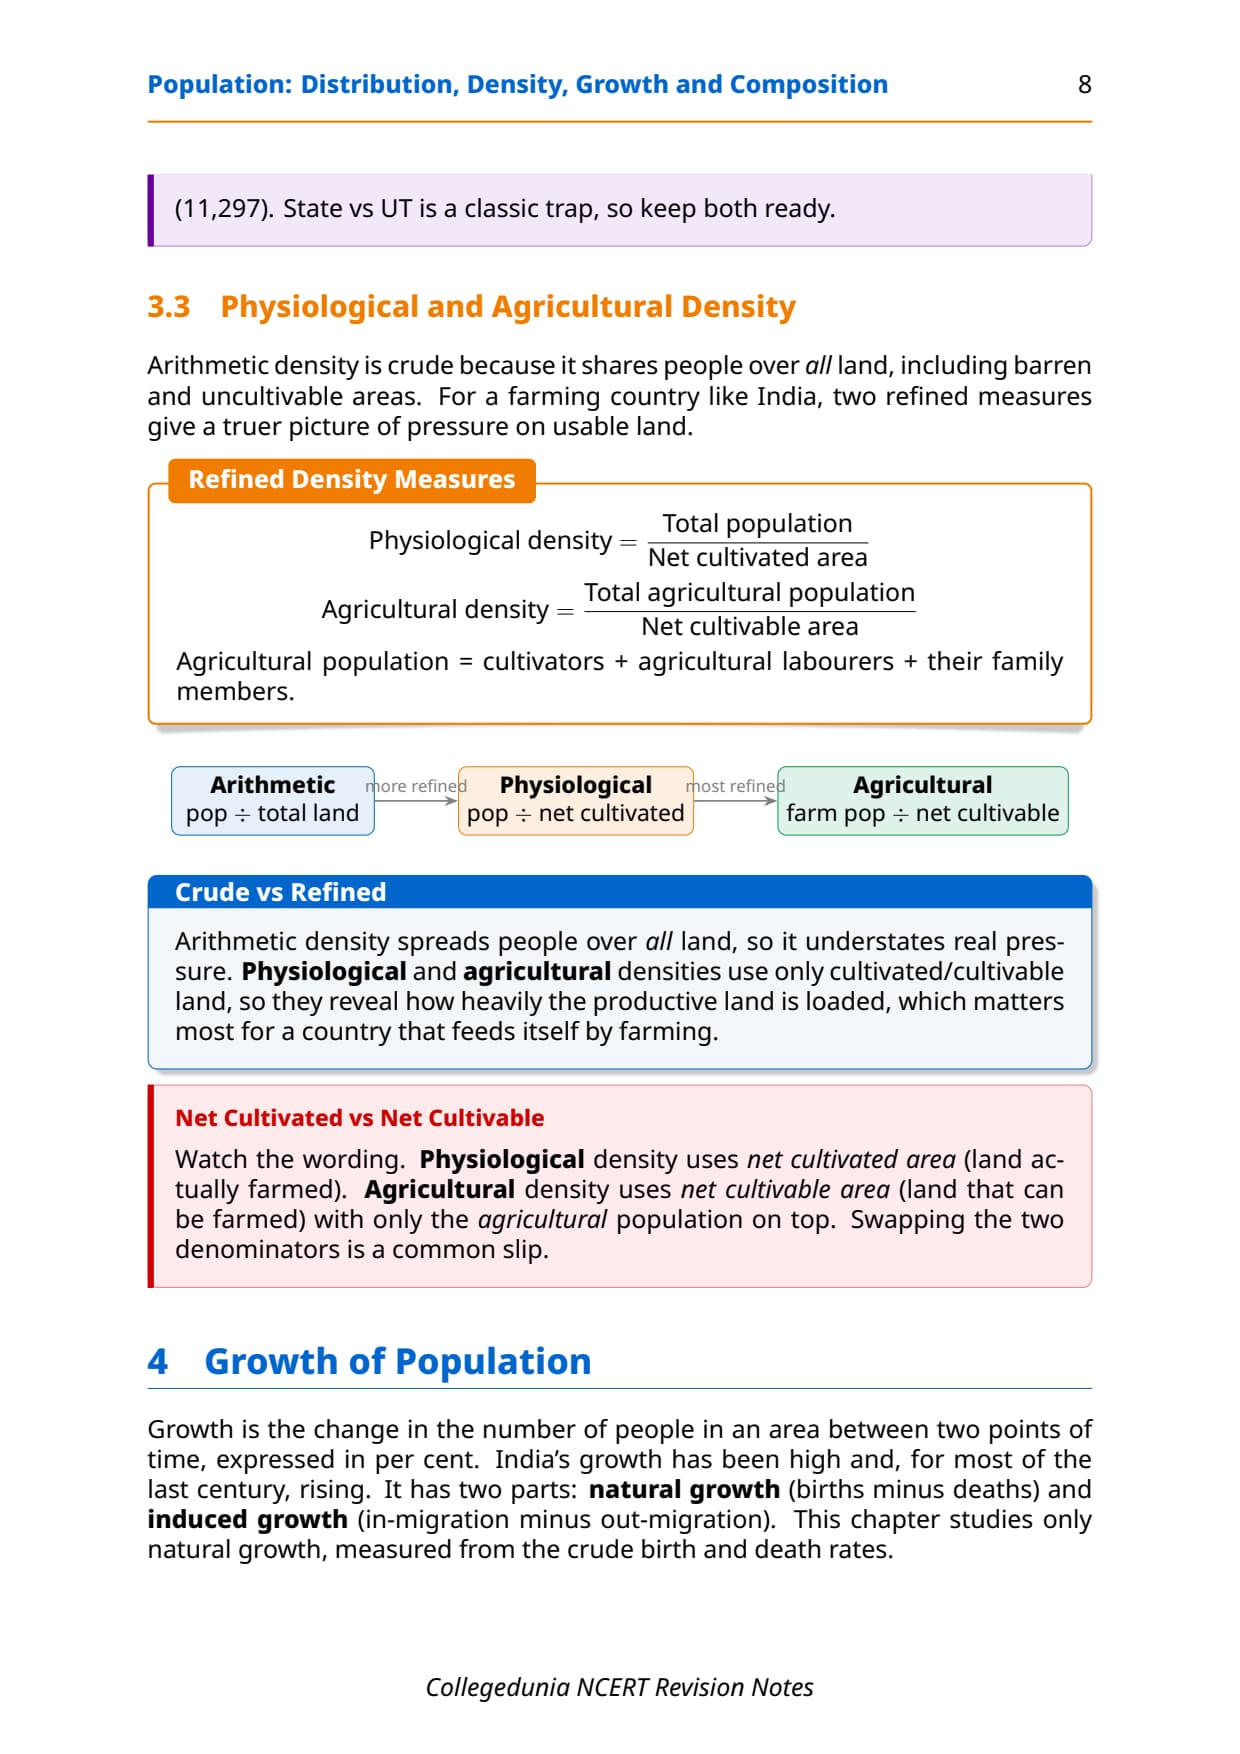
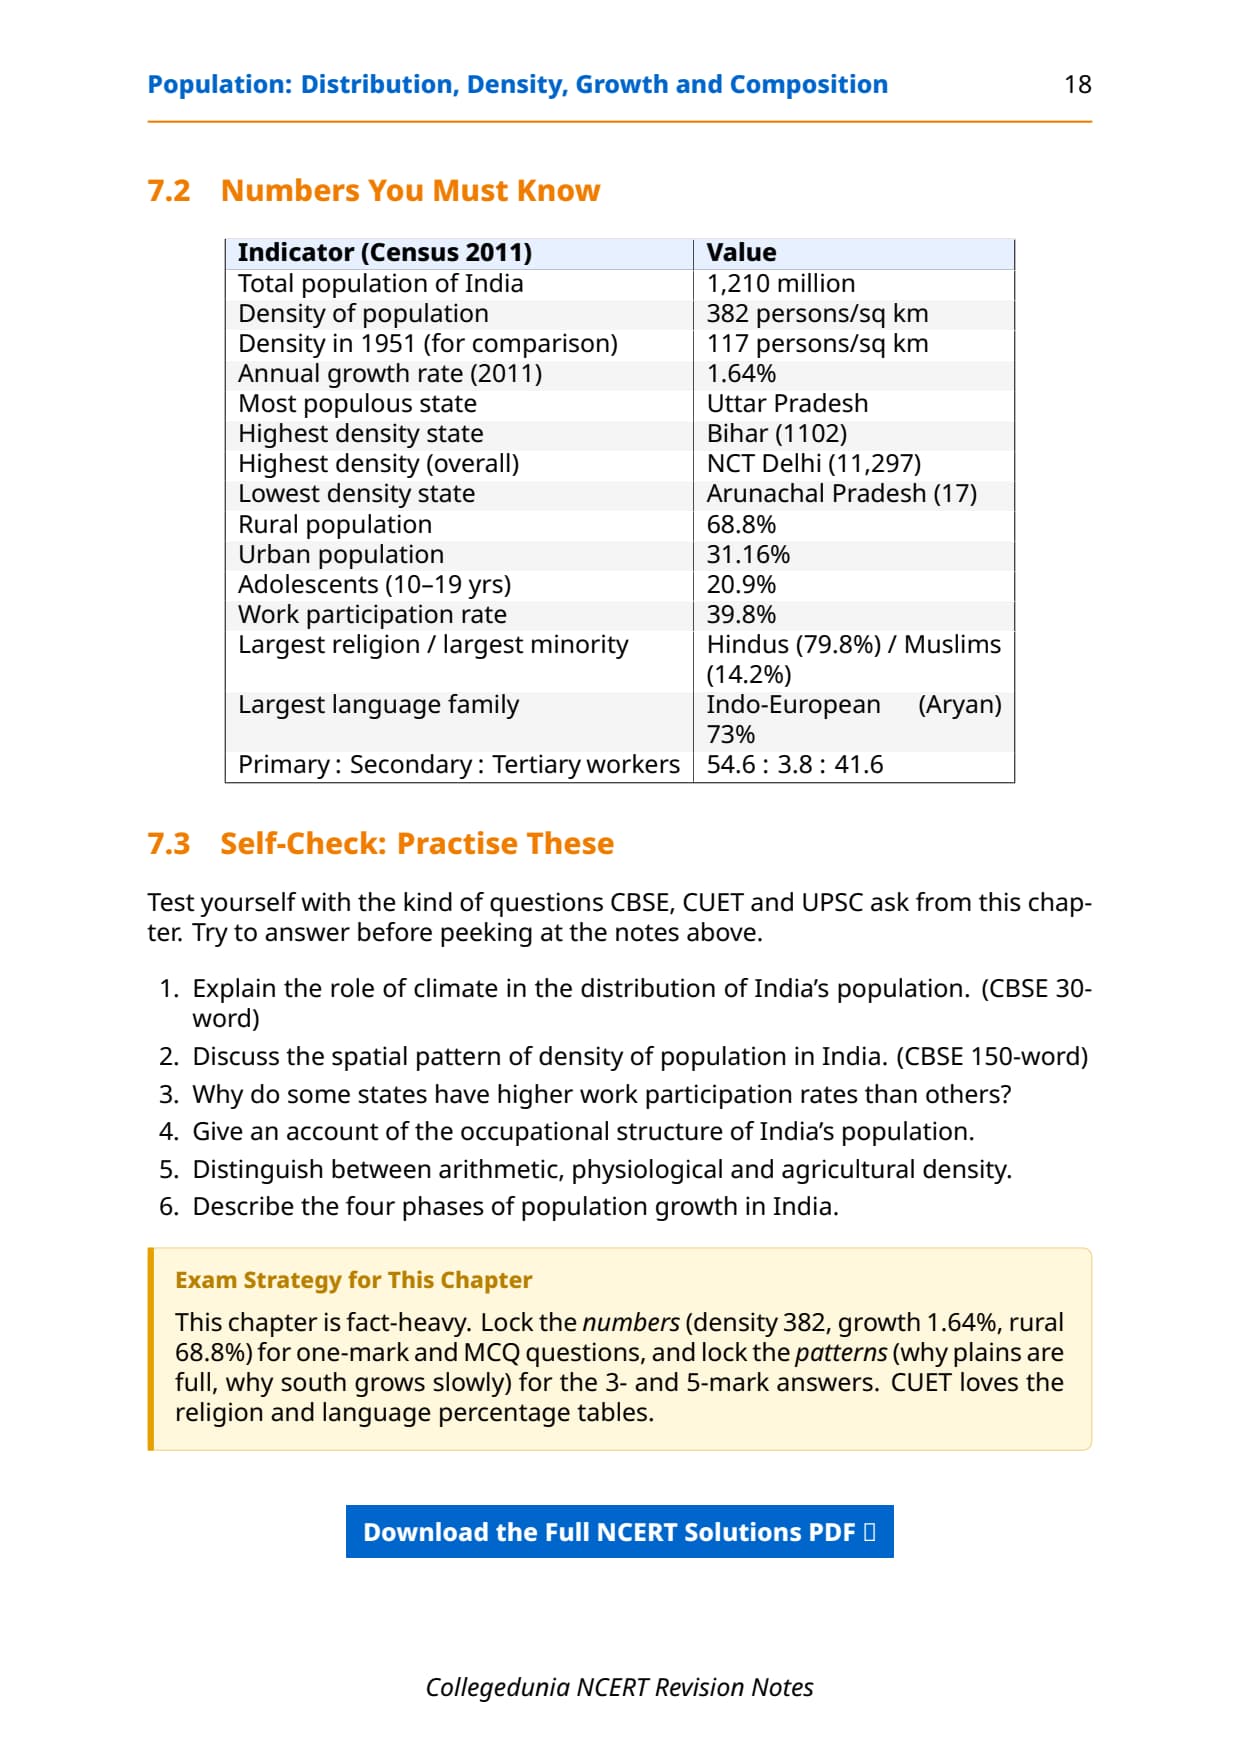
- Arithmetic density = Total Population / Total Geographical Area. The crude, most-used measure; India = 382/sq km (2011).
- Physiological density = Total Population / Net Cultivated Area. Shows population pressure on farmable land, more meaningful for an agricultural country.
- Agricultural density = Agricultural Population (cultivators, labourers and their families) / Net Cultivable Area. Shows pressure from farming families only.
- Key CBSE tip: net cultivated area (physiological) and net cultivable area (agricultural) are not the same.
Growth of Population: Four Phases from 1901 to 2011
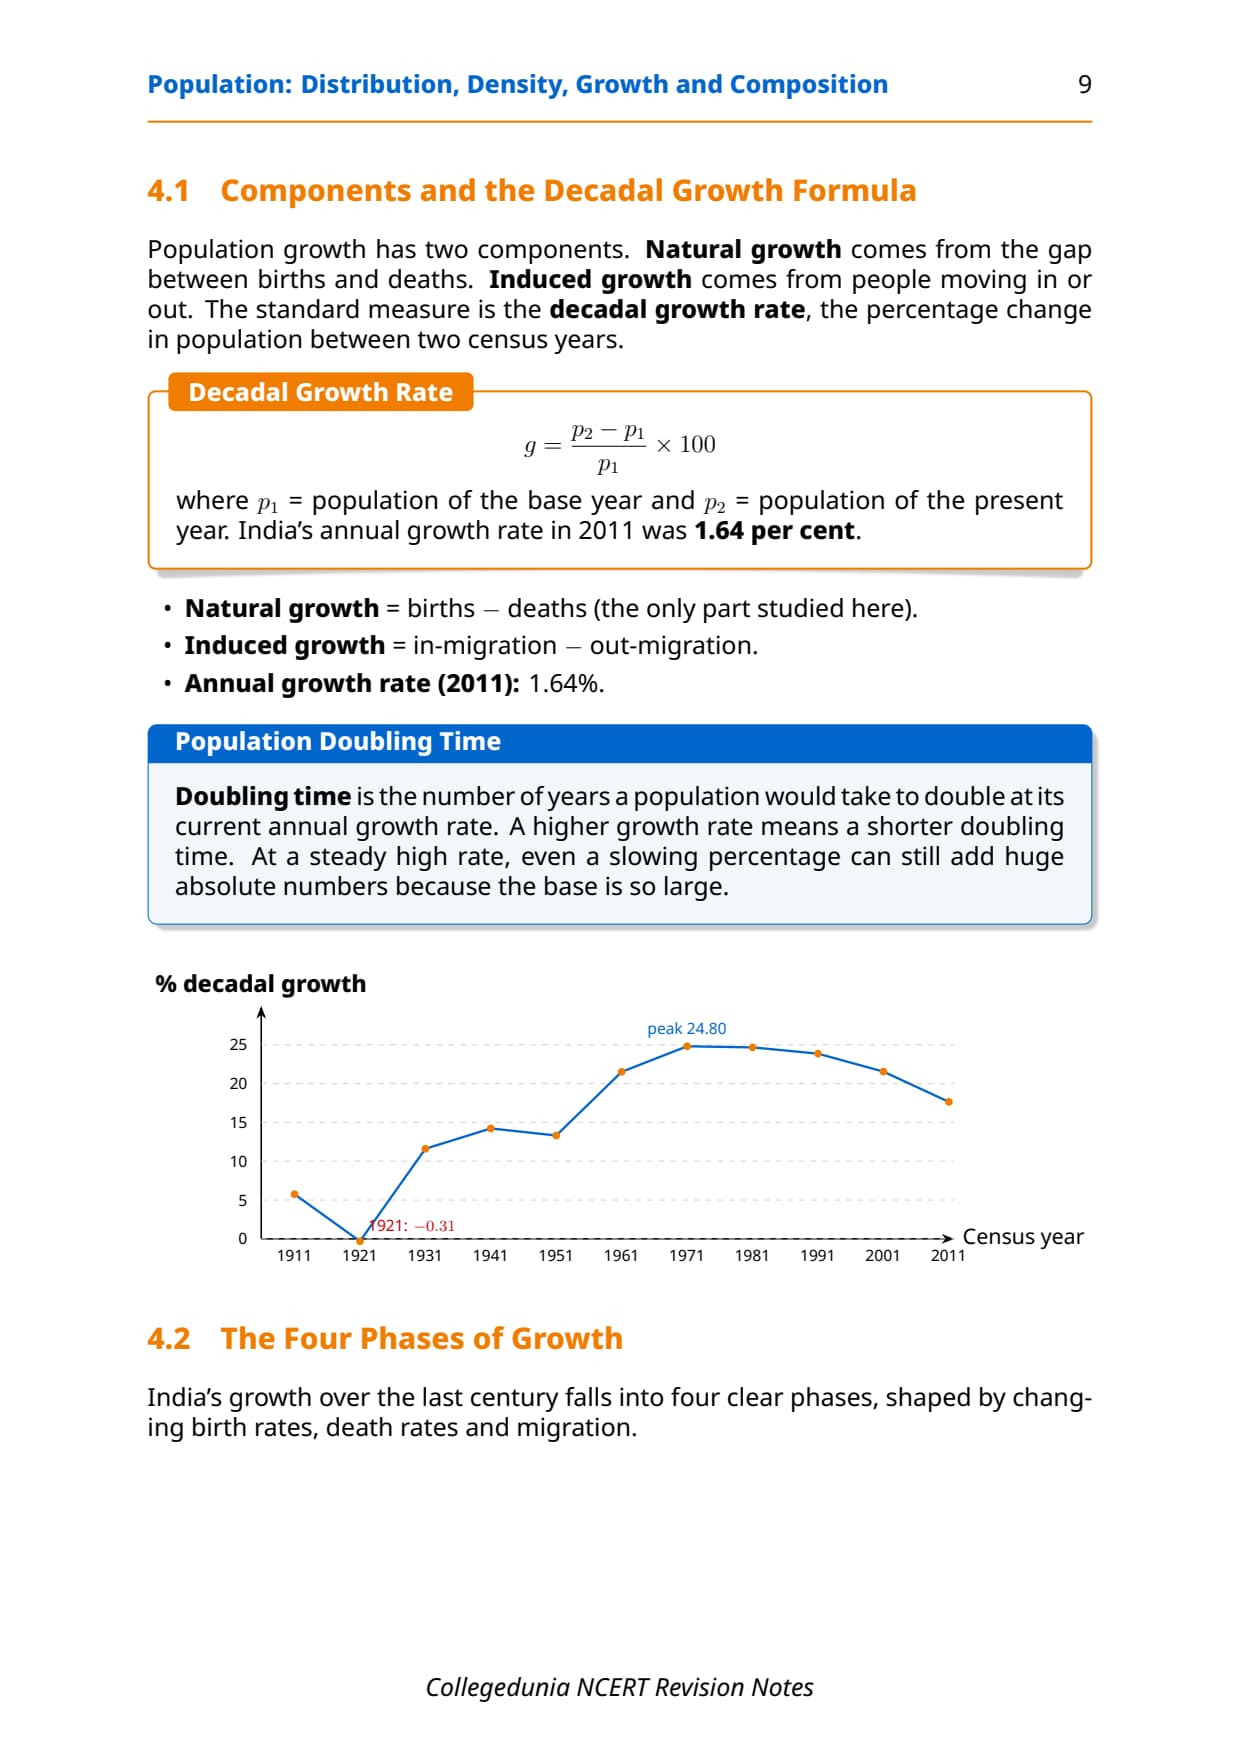
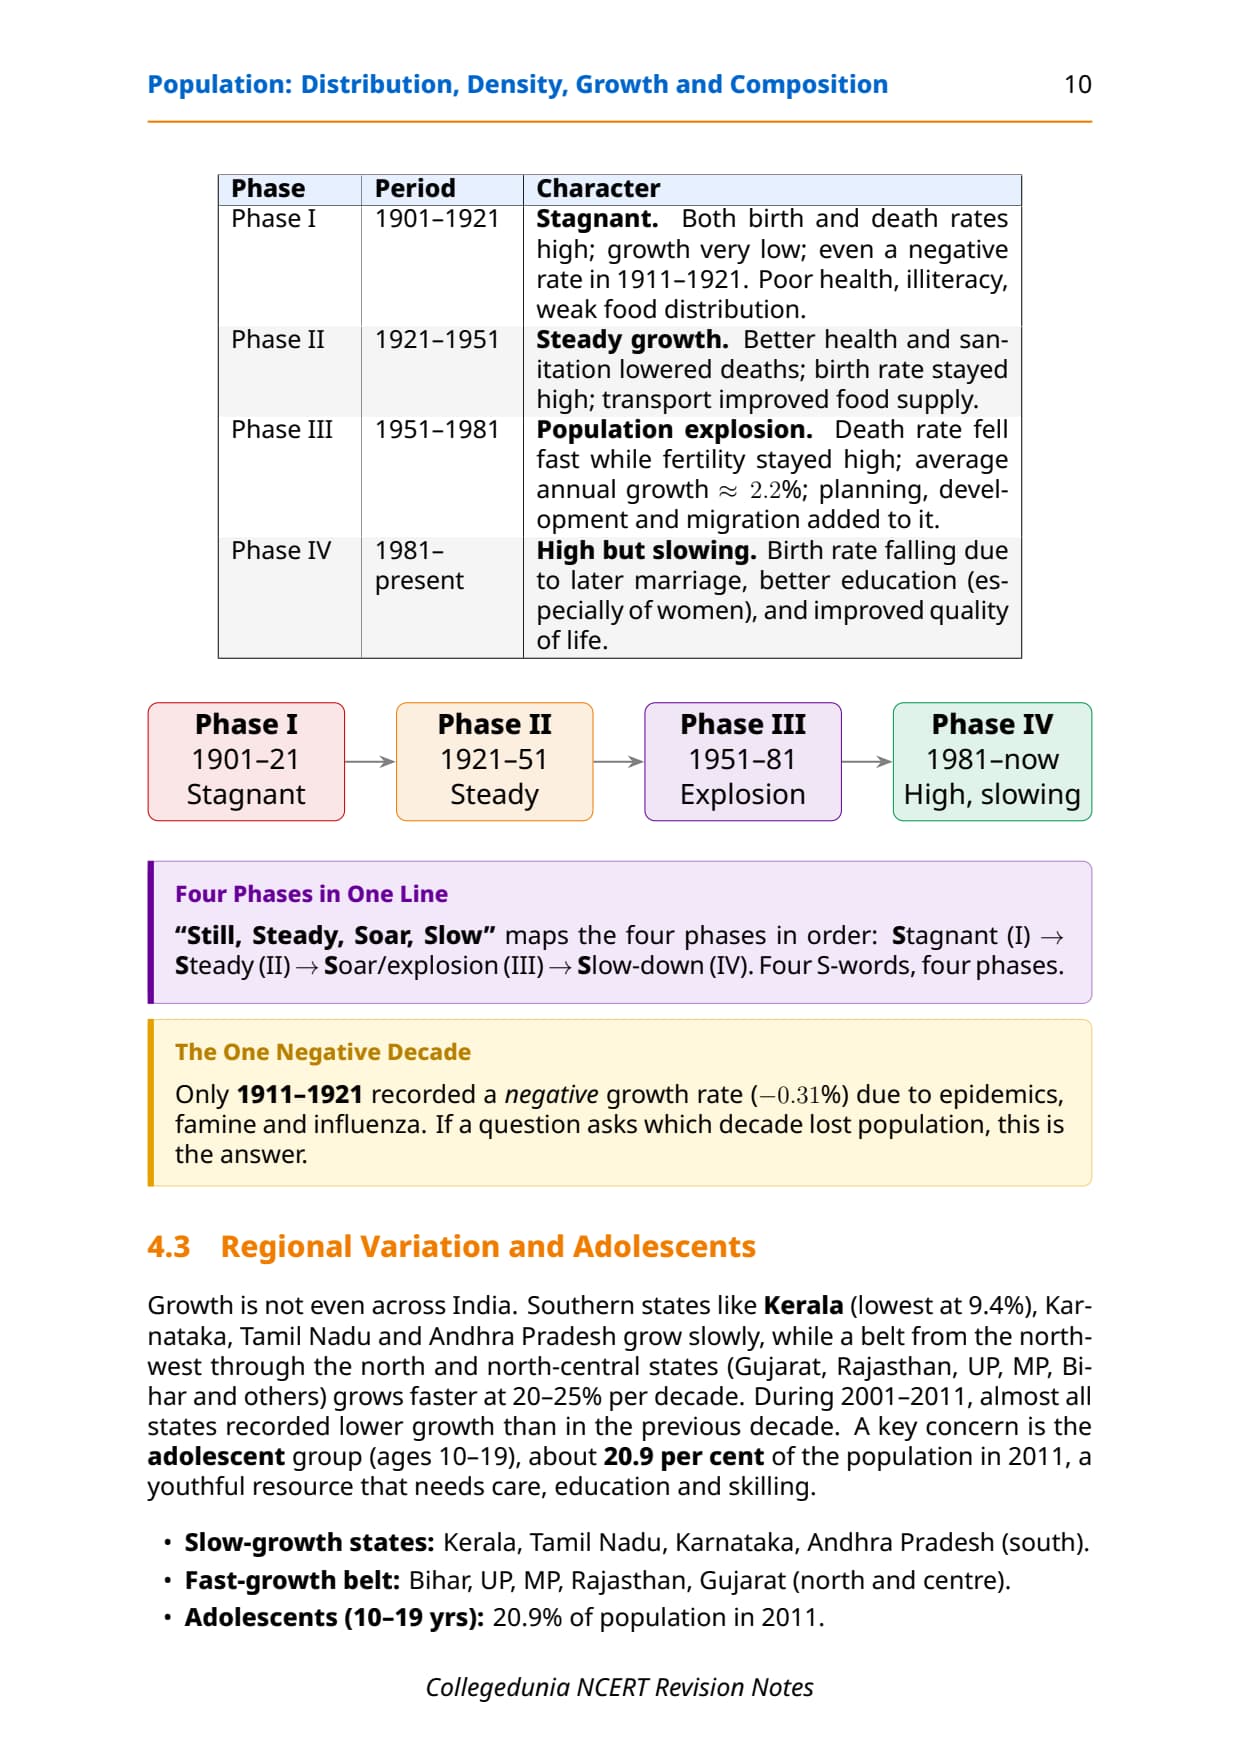
Growth of population is the change in the number of people between two points of time, shown as a percentage. India's annual growth rate was 1.64% in 2011. NCERT identifies four phases from 1901 to 2011, and CBSE picks at least one question here every year.
| Phase | Period | Trend | Key reason |
|---|---|---|---|
| Phase I: Stagnant | 1901-1921 | Very low growth; even negative growth in 1911-21 | High birth rate AND high death rate; poor health, illiteracy, famines, epidemics |
| Phase II: Steady growth | 1921-1951 | Moderate increase; 1921 called the Great Divide | Improved sanitation and health, better transport, falling death rate but high birth rate |
| Phase III: Population explosion | 1951-1981 | Rapid growth; average annual rate 2.2% | Sharp fall in death rate but high fertility rate; post-Independence development, better living conditions |
| Phase IV: Slowing growth | 1981-2011 | Still high but gradually declining | Falling birth rate due to higher age at marriage, female education, family planning |
Population doubling time is the time a population takes to double at its current growth rate; know the concept for MCQs. Regional variation: Kerala had the lowest growth (9.4%, 1991-2001); northern and north-western states (UP, Bihar, Rajasthan, MP, Jharkhand, Chhattisgarh) grow faster than southern ones. In 2001-2011 almost all states slowed down.
Memory hook: S-S-E-S (Stagnant, Steady, Explosion, Slowing). 1921 is the Great Divide, the first consistent fall in the death rate: before it is Phase I, after it up to 1951 is Phase II.
Population Composition: Rural-Urban and Linguistic
Population composition studies who lives where, what language they speak, what religion they follow and what work they do. CBSE asks at least two questions here per year, and CUET includes it in MCQs. Memorise the 2011 Census figures.
Rural-Urban Composition
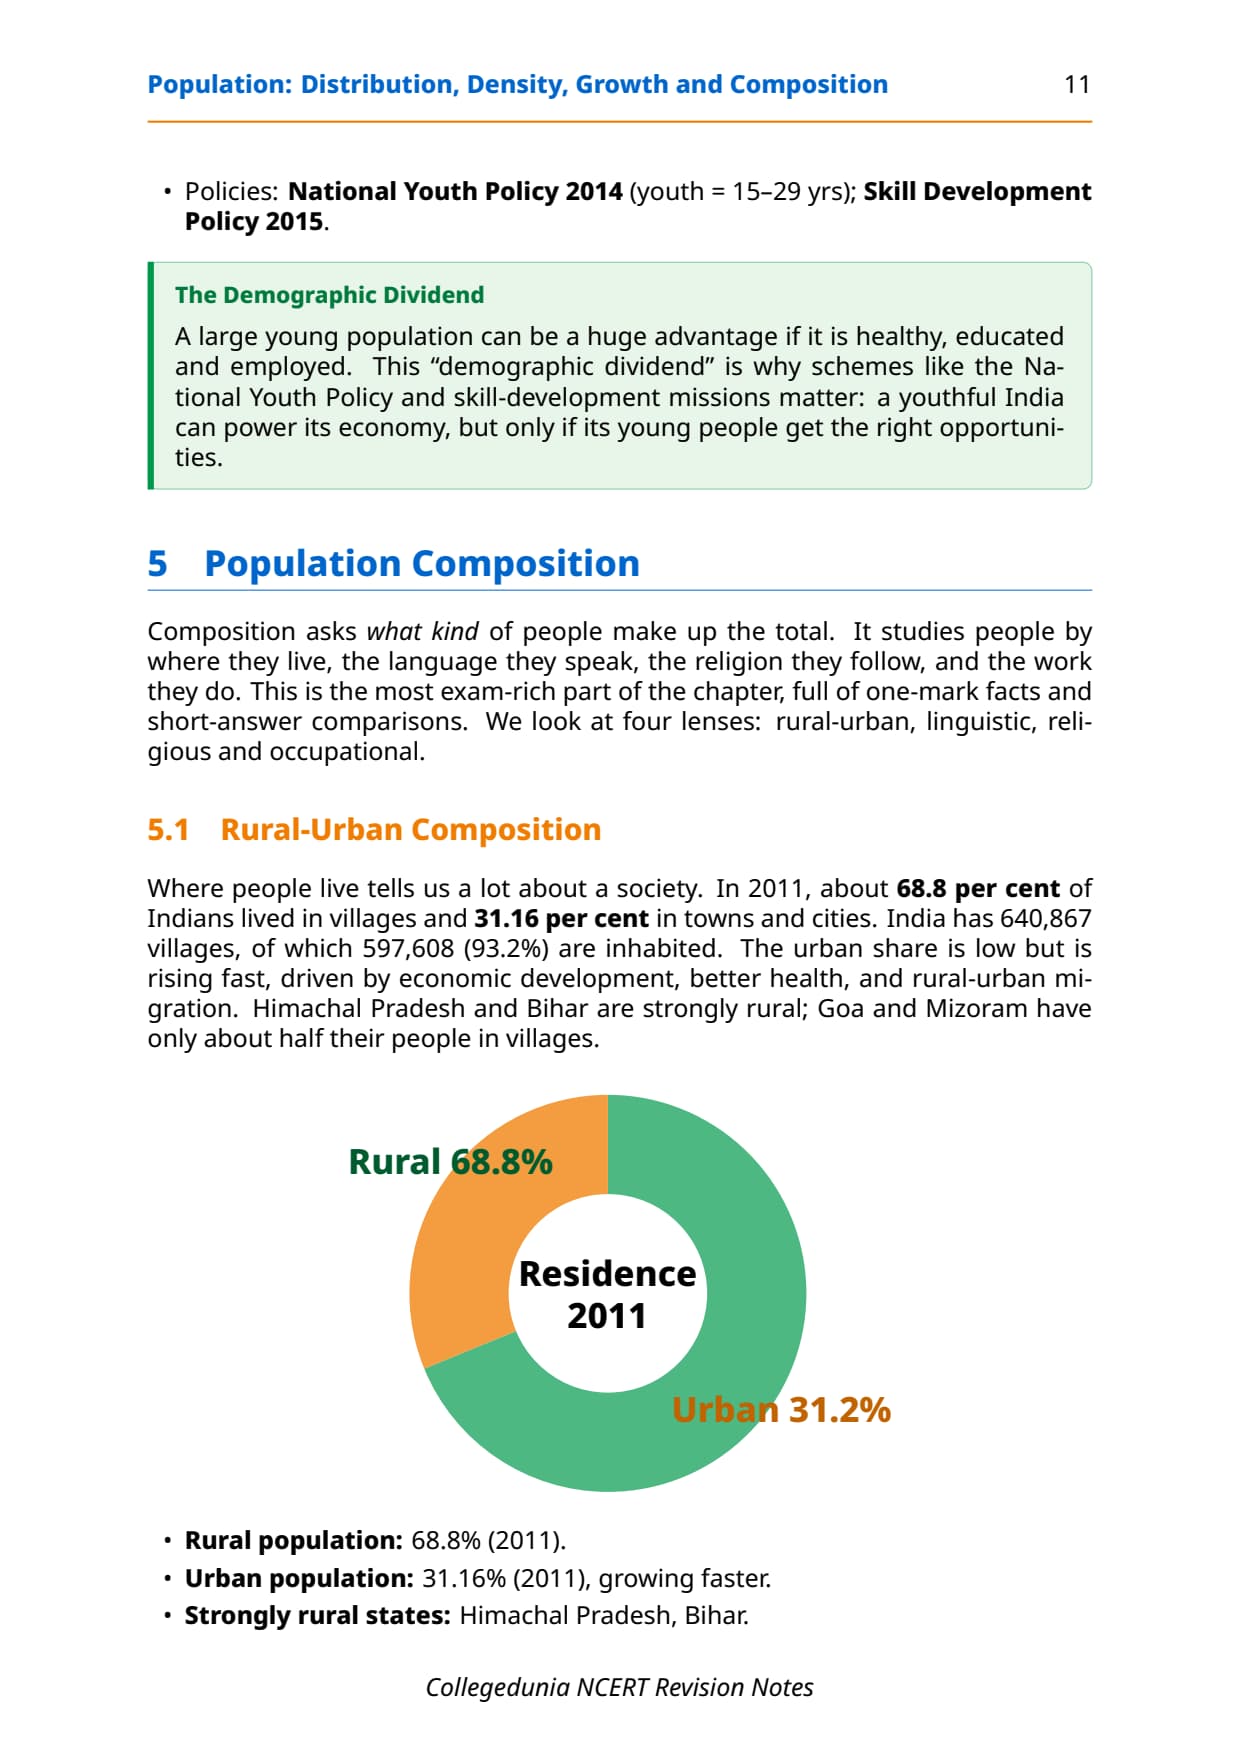
As per 2011, 68.8% of India's population lives in villages and 31.16% in urban areas. India has 640,867 villages, of which 597,608 (93.2%) are inhabited. The rural share keeps falling as urban areas grow faster.
- High rural: Himachal Pradesh, Bihar, Assam (over 80%).
- Low rural: Goa and Mizoram (just over 50%); UTs like Delhi and Chandigarh are smallest.
- Urban corridors: Delhi-Kanpur, Mumbai-Ahmedabad-Surat, Bengaluru-Mysuru and Ludhiana-Jalandhar strips.
Linguistic Composition
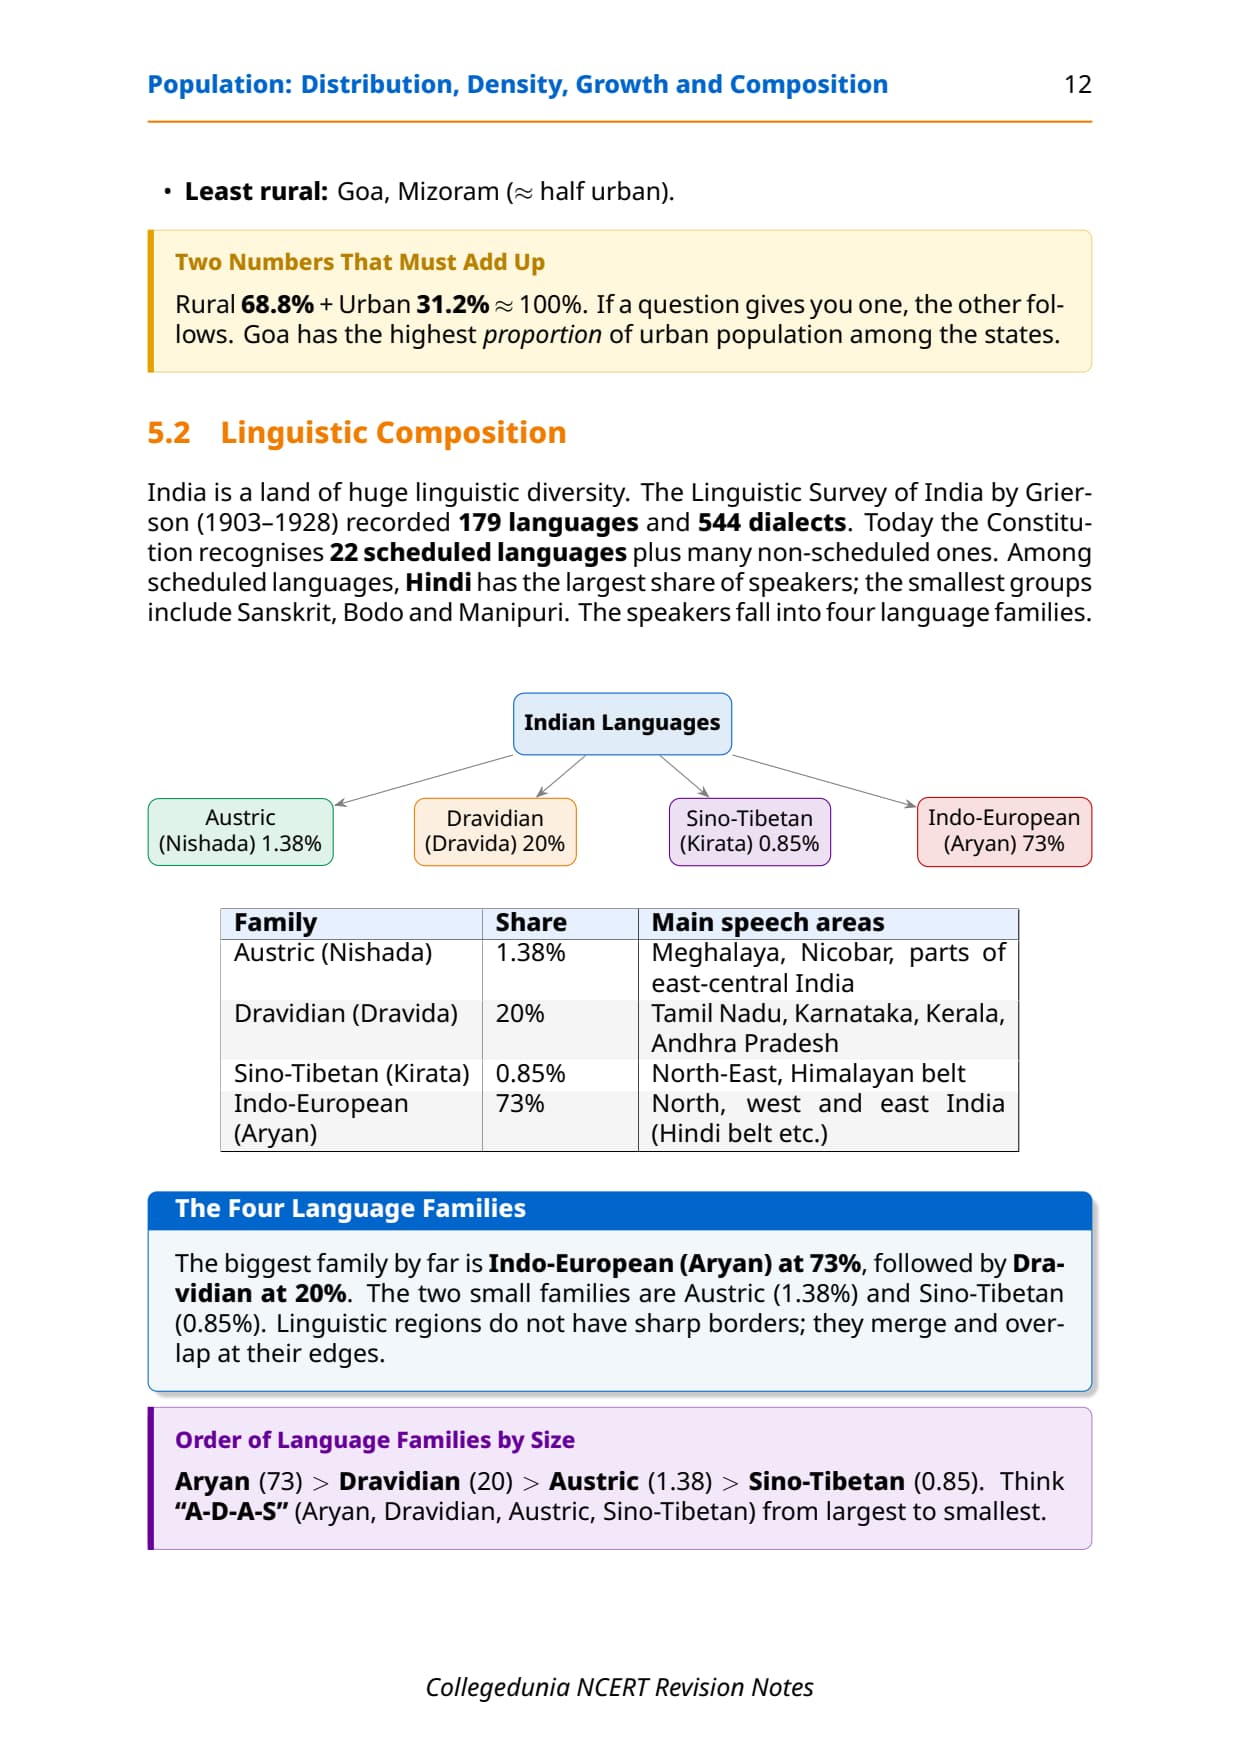
India is one of the most linguistically diverse countries. Grierson's Linguistic Survey of India (1903-1928) recorded 179 languages and 544 dialects; today there are 22 scheduled languages under the Eighth Schedule.
| Language family | Share of speakers | Major languages / speech areas |
|---|---|---|
| Indo-Aryan | Largest group | Hindi, Bengali, Marathi, Gujarati, Punjabi, Urdu, Odia (North, West, East India) |
| Dravidian | Second largest | Tamil, Telugu, Kannada, Malayalam (South India) |
| Austric (Nishada) | 1.38% | Munda, Mon-Khmer languages (WB, Bihar, Odisha, Assam, MP, Maharashtra) |
| Sino-Tibetan | Smaller group | Tibeto-Himalayan, North Assam, Siamese-Chinese branches (Himalayan states, NE India) |
Among scheduled languages, Hindi speakers have the highest percentage; the smallest are Sanskrit, Bodo and Manipuri (2011). Linguistic boundaries are not sharp and overlap in frontier zones.
Religious and Occupational Composition of India's Population
The 2011 Census records six religious groups: Hindus (majority), Muslims, Christians, Sikhs, Buddhists and Jains, each with a distinct regional concentration.
Occupational Composition
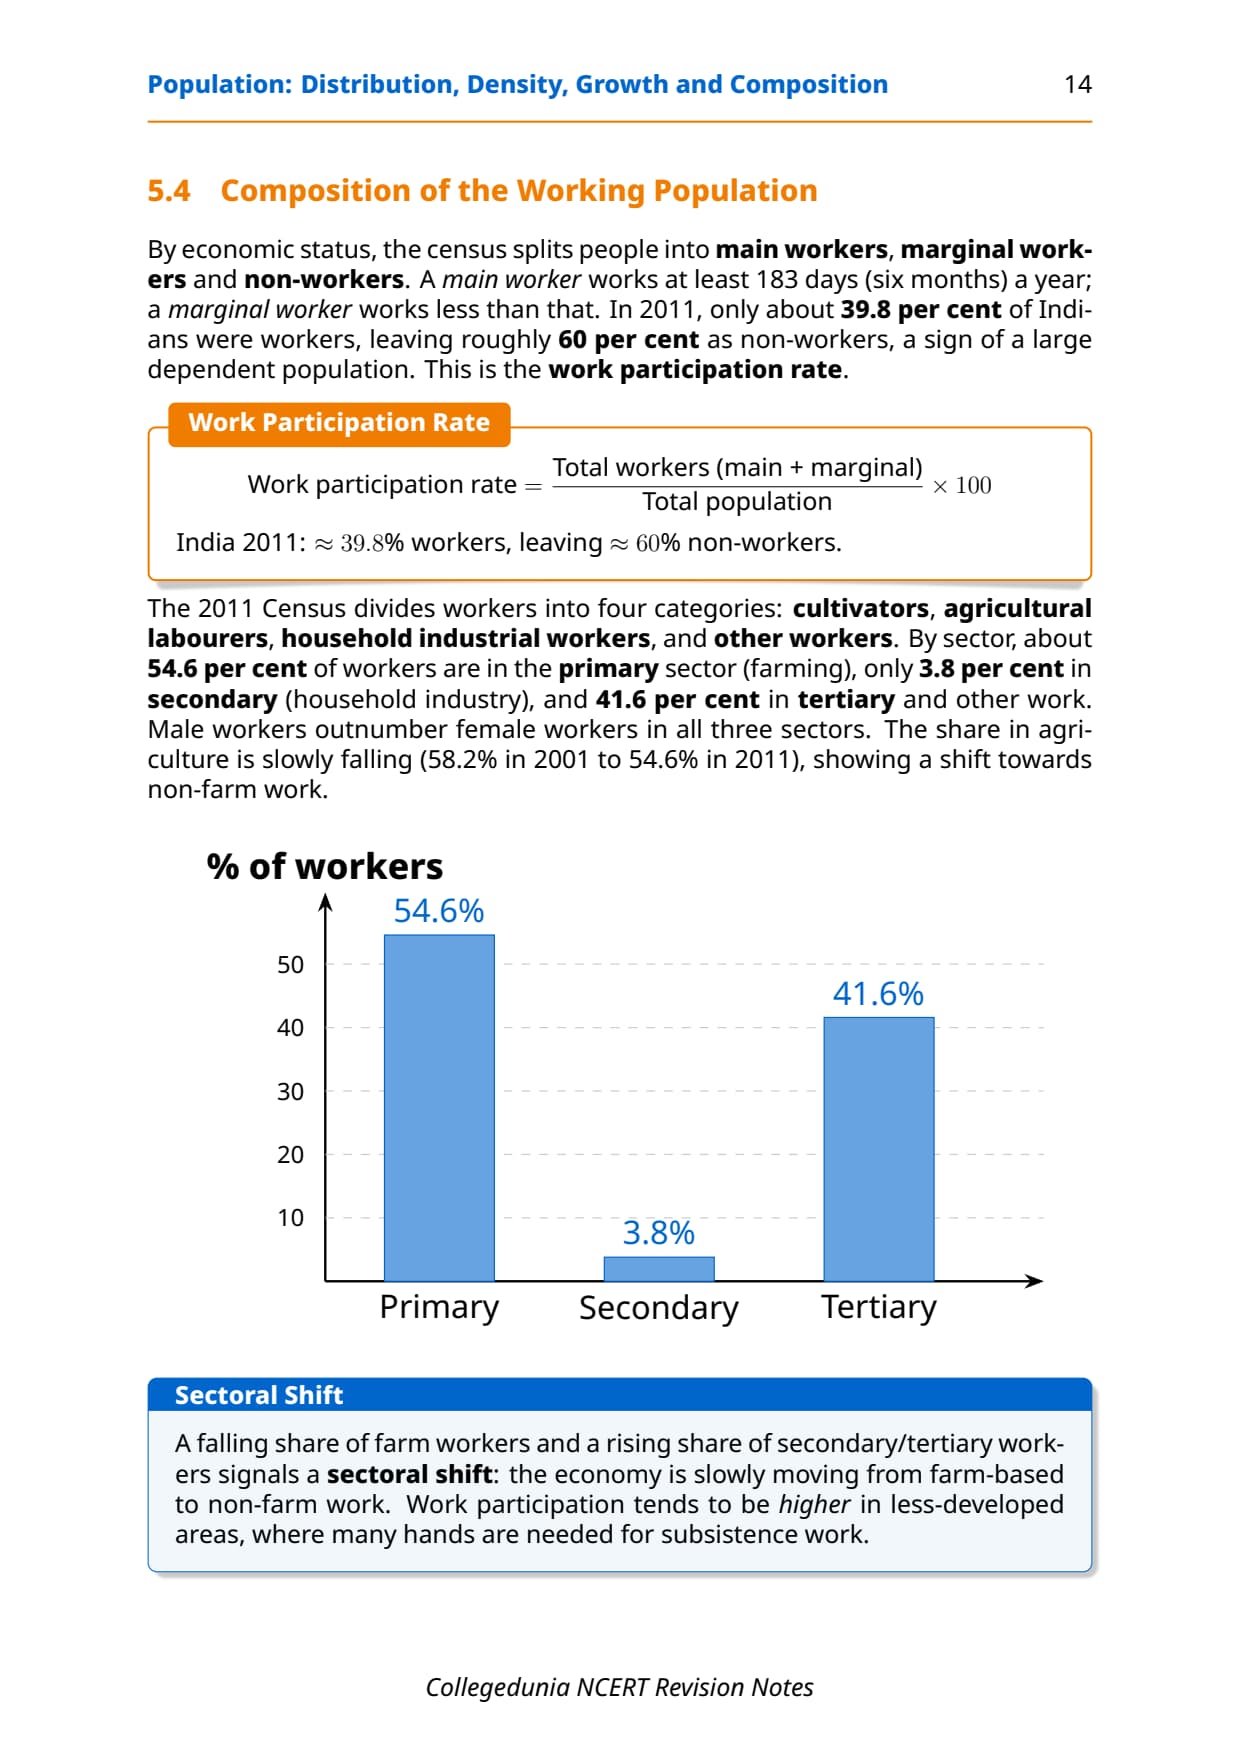
Occupational composition divides workers into three sectors, using 2011 Census data. The work participation rate varies across states and between males and females.
| Sector | Share of total workers (2011) | Male workers | Female workers |
|---|---|---|---|
| Primary (Agriculture) | 54.6% | 9,75,75,398 | 16,54,47,075 (total sector) |
| Secondary (Manufacturing) | 3.8% | 97,75,635 | 85,60,672 |
| Tertiary (Services) | 41.6% | 15,66,43,220 | 4,37,41,311 |
- Primary sector dominance: agriculture still employs the largest share (54.6%), down from 58.2% in 2001.
- Female workers: higher share in the primary sector, lower in secondary and tertiary.
- Regional variation: cultivators concentrate in HP and Nagaland; agricultural labourers in Bihar, AP, Chhattisgarh; other services in Delhi, Chandigarh and Puducherry.
- Sectoral shift: falling farm share and rising secondary/tertiary shares show structural change.
Adolescent population: about 20.9% of India's population is in the 10-19 age group (2011), split 52.7% male and 47.3% female. The National Youth Policy 2014 defines youth as ages 15-29, and the National Policy for Skill Development and Entrepreneurship (2015) aligns skilling with demand.
Common Mistakes Students Make in the Population Chapter
These are the five repeat-offender mistakes CBSE examiners flag on this chapter.
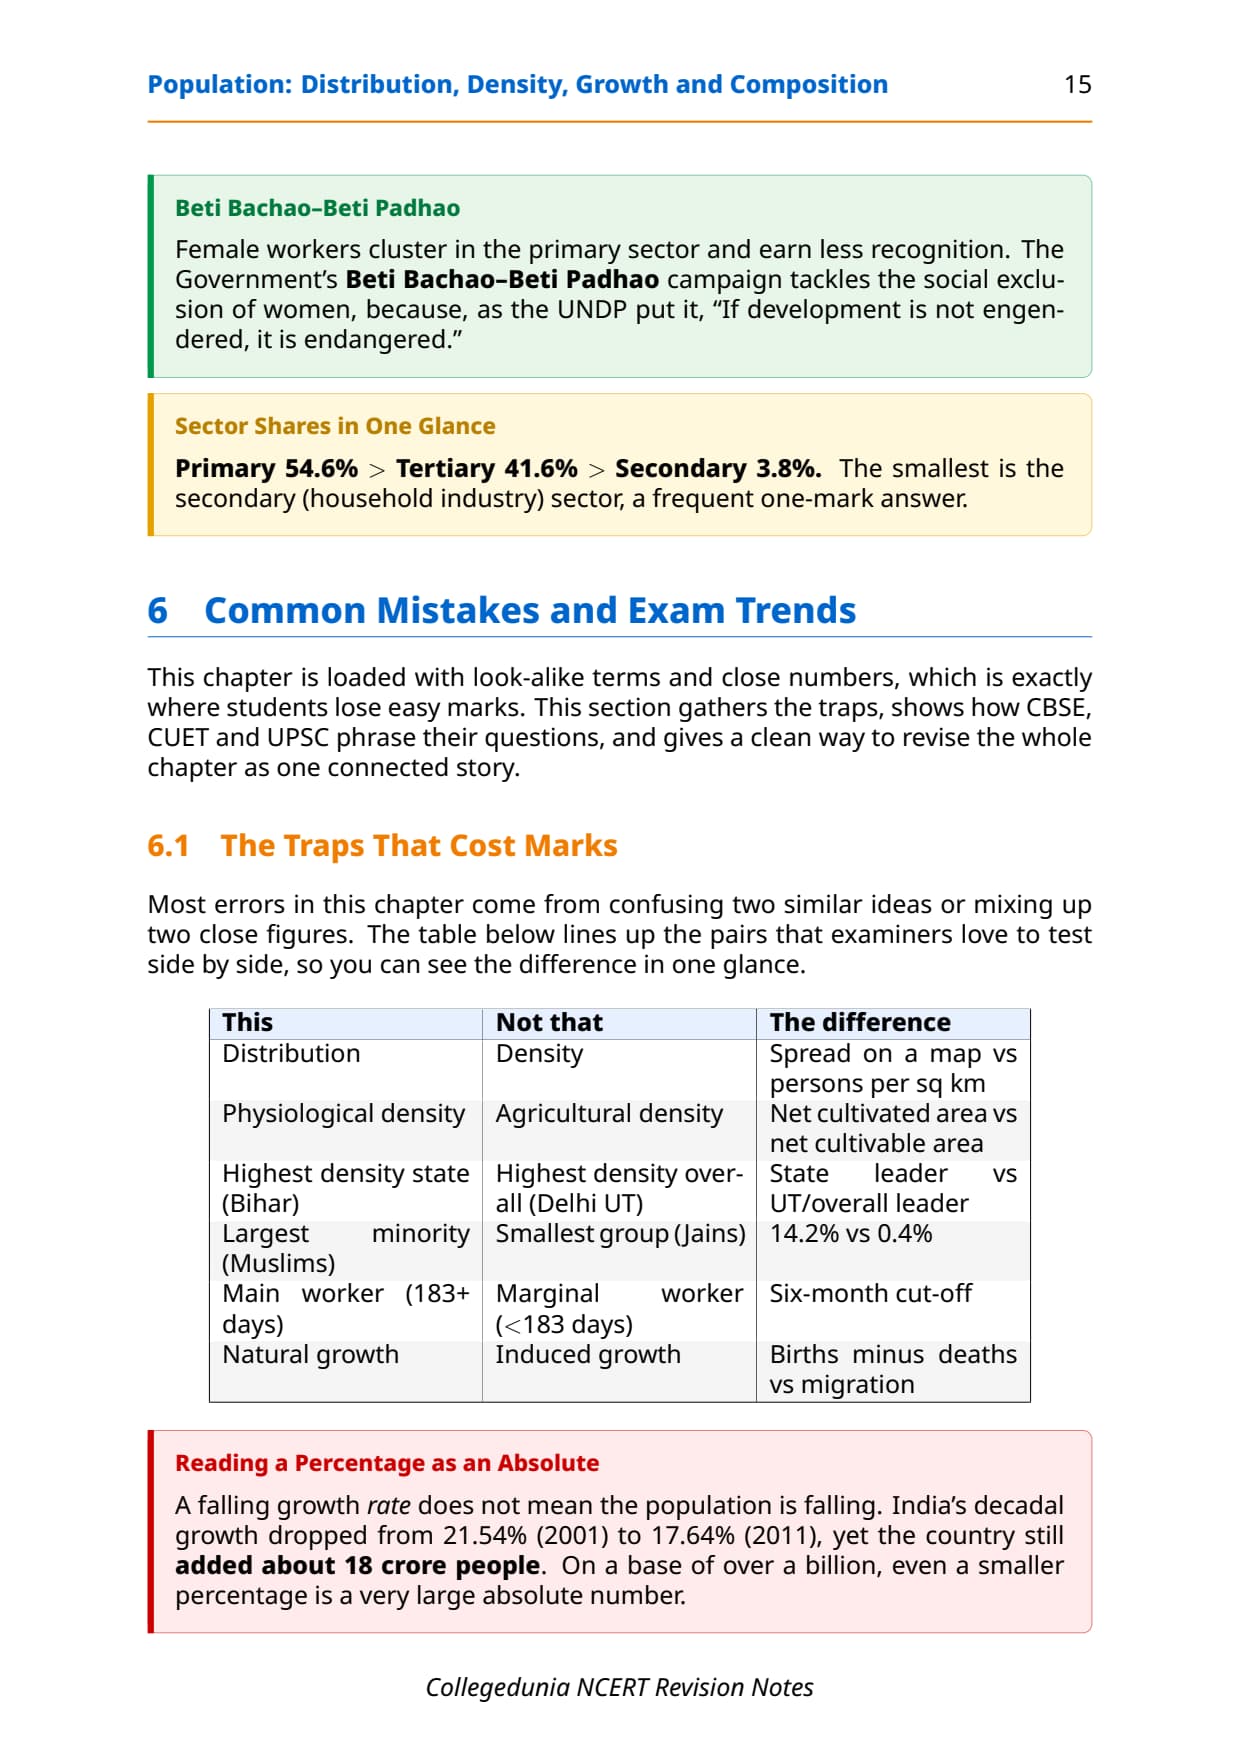
- Arithmetic vs physiological density: arithmetic uses total area, physiological uses net cultivated area only; swapping the formulas inverts the meaning.
- Wrong phase years: Phase I is 1901-1921, not 1891-1921, and the Great Divide is 1921, not 1911.
- Wrong Census year: use 382 per sq km (2011), not the old 324 (2001).
- Rural-urban mix-up: 68.8% is rural, 31.16% urban (2011), not the reverse.
- Language areas: Indo-Aryan is North/West/East, Dravidian is South; the smallest groups are Sanskrit, Bodo and Manipuri, not Hindi.
Previous Year Question Trends from Population Class 12 Geography
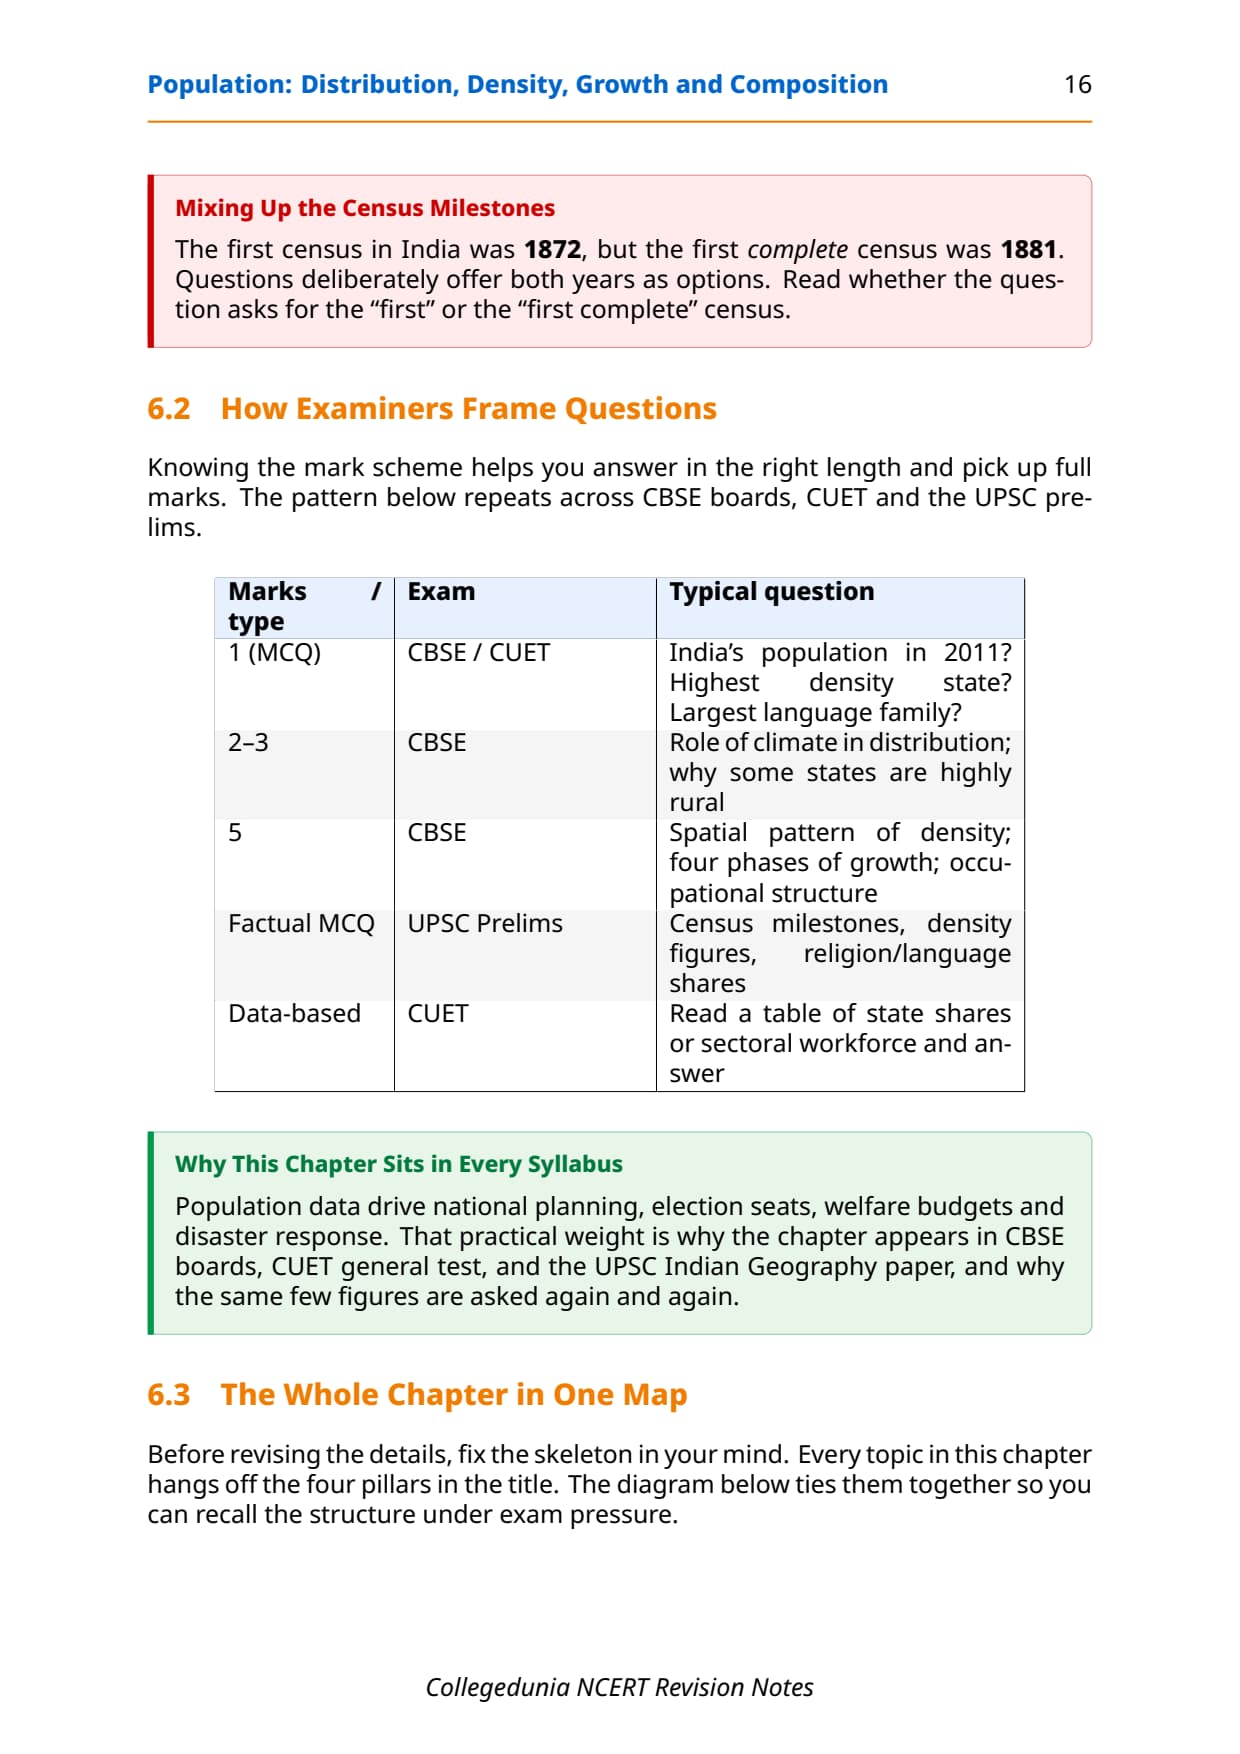
Population class 12 important questions follow a stable pattern. The table maps what CBSE has asked over five years, so students revise the right sections first.
| Year | Question type asked | Marks | Notes section to revise |
|---|---|---|---|
| 2025 | Explain the factors affecting distribution of population + define physiological density | 5 + 2 | Distribution section + Density section |
| 2024 | Describe the four phases of population growth in India with reasons | 6 | Four Phases section |
| 2023 | Rural-urban composition MCQ + short note on occupational structure | 1 + 3 | Composition section |
| 2022 | Distinguish between arithmetic and physiological density + regional variation in growth | 3 + 3 | Density section + Growth section |
| 2021 | Define population doubling time + explain linguistic composition of India | 2 + 4 | Growth section + Linguistic Composition |
The chapter carries 8 to 10 marks per year across theory and MCQ questions.
Other Resources for Class 12 Geography Chapter 1 Population
Pair these notes with the matching Solutions, Handwritten Notes and NCERT Book PDF below.
| Resource | What it covers | Open |
|---|---|---|
| Notes | Concept-first revision notes covering distribution, density formulas, four phases of growth, rural-urban and linguistic composition, and common mistakes. | You are here |
| NCERT Solutions | Step-by-step answers to all exercise questions with worked explanations for density, growth phase and composition questions. | Class 12 Geography Chapter 1 NCERT Solutions |
| Handwritten Notes | Topper's handwritten revision pages for last-minute board exam practice. | Class 12 Geography Chapter 1 Handwritten Notes |
| NCERT Book PDF | Official NCERT India: People and Economy Chapter 1 textbook in PDF form. | Class 12 Geography Chapter 1 NCERT Book PDF |
| Subject Hub | All chapters of Class 12 Geography with every resource in one place. | Class 12 Geography Subject Hub |
All Chapters Notes for Class 12 Geography (India: People and Economy)
Related Links: Use the table below for the Notes of the other Class 12 Geography (India: People and Economy) chapters.
| Chapter | Topic | Notes link |
|---|---|---|
| Chapter 1 | Population: Distribution, Density, Growth and Composition | You are here |
| Chapter 2 | Human Settlements | Class 12 Geography Human Settlements Notes |
| Chapter 3 | Land Resources and Agriculture | Class 12 Geography Land Resources and Agriculture Notes |
| Chapter 4 | Water Resources | Class 12 Geography Water Resources Notes |
| Chapter 5 | Mineral and Energy Resources | Class 12 Geography Mineral and Energy Resources Notes |
| Chapter 6 | Planning and Sustainable Development in Indian Context | Class 12 Geography Planning and Sustainable Development Notes |
| Chapter 7 | Transport and Communication | Class 12 Geography Transport and Communication Notes |
| Chapter 8 | International Trade | Class 12 Geography International Trade Notes |
| Chapter 9 | Geographical Perspective on Selected Issues and Problems | Class 12 Geography Geographical Perspective Notes |
NCERT Notes Class 12 Geography Chapter 1 Population FAQs
Ques. What does the population distribution density growth and composition class 12 notes cover?
Ans. These population distribution density growth and composition class 12 notes cover all four themes of the NCERT India: People and Economy Chapter 1: the uneven spatial pattern of population across India, three types of density (arithmetic, physiological and agricultural) with their formulas, four phases of population growth from 1901 to 2011 with causes and characteristics, and population composition by rural-urban residence, four language families, six religious groups and three occupational sectors. All data is from the 2011 Census as used in the NCERT textbook.
Ques. What is the population of India as per 2011 Census?
Ans. India's total population as per the 2011 Census was 1,210 million (1,21,01,93,422 to be exact). This made India the second most populous country in the world after China. India's population was larger than the combined populations of North America, South America and Australia. The annual growth rate of India's population at the time of the 2011 Census was 1.64 per cent.
Ques. What are the four phases of population growth in India?
Ans. The four phases of population growth in India as described in the NCERT Class 12 Geography Chapter 1 are: Phase I (1901-1921), called the stagnant phase, where growth was very low or even negative due to high birth and death rates; Phase II (1921-1951), the steady growth phase, where improved health and sanitation lowered the death rate while birth rate remained high; Phase III (1951-1981), the population explosion phase, where the death rate fell sharply but fertility remained high, resulting in an average annual growth rate of 2.2%; and Phase IV (1981 onwards), where growth is slowing gradually due to a falling birth rate, higher age at marriage and improved female education.
Ques. What is the difference between physiological density and agricultural density?
Ans. Physiological density is total population divided by net cultivated area. It measures the pressure of the entire population on farmable land. Agricultural density is the total agricultural population (cultivators, agricultural labourers and their families) divided by net cultivable area. It measures the pressure from farming families specifically on land that can be cultivated. Both measures are more meaningful than simple arithmetic density for understanding human-land relationships in an agricultural country like India. CBSE often asks students to distinguish between these two in 3-mark questions.
Ques. Which state has the highest density of population in India as per 2011 Census?
Ans. The National Capital Territory of Delhi has the highest density of population in India at 11,297 persons per sq km as per the 2011 Census. Among the full states (not Union Territories), Bihar has the highest density at 1,102 persons per sq km, followed by West Bengal at 1,029 persons per sq km and Uttar Pradesh at 828 persons per sq km. The lowest density is in Arunachal Pradesh at just 17 persons per sq km.
Ques. What is the rural-urban composition of India as per 2011 Census?
Ans. As per the 2011 Census, 68.8% of India's total population lives in villages (rural areas) and 31.16% lives in urban areas. India has 640,867 villages, of which 597,608 (93.2%) are inhabited. States like Himachal Pradesh and Bihar have very high percentages of rural population, while Goa and Mizoram have lower rural shares. Union Territories generally have smaller proportions of rural population except Dadra and Nagar Haveli at 53.38%.
Ques. How many language families are there in India according to the NCERT Class 12 Geography chapter?
Ans. The NCERT Class 12 Geography Chapter 1 identifies four major language families in India: Indo-Aryan (the largest group, spoken in north, west and east India), Dravidian (the second largest group, spoken primarily in south India), Austric or Nishada (about 1.38% of speakers, spread across West Bengal, Bihar, Odisha, Assam, MP and Maharashtra), and Sino-Tibetan (smaller group, found in Himalayan states and north-eastern India). Among the 22 scheduled languages, Hindi speakers form the highest percentage.
Ques. What is the occupational structure of India's population?
Ans. India's occupational structure as per 2011 Census divides workers into three sectors. The primary sector (agriculture, including cultivators and agricultural labourers) employs 54.6% of total workers, down from 58.2% in 2001. The secondary sector (manufacturing and household industries) employs 3.8% of workers. The tertiary sector (trade, transport, services) employs 41.6% of workers. The decline in the primary sector share and rise in secondary and tertiary shares indicates a structural shift in India's economy from farm-based to non-farm-based occupations.
Ques. Why is 1921 called the Year of the Great Divide in Indian population history?
Ans. The year 1921 is called the Year of the Great Divide because it marks the first time that India's population showed a consistent fall in the death rate, leading to a shift from the stagnant Phase I to the steady growth Phase II. Before 1921, both birth and death rates were high, keeping net growth very low and even producing a negative growth rate in 1911-1921. After 1921, improved sanitation, health services and transportation began lowering the death rate steadily while birth rate remained high, resulting in growing population numbers. This turning point separates the two very different growth eras.
Ques. What is the National Youth Policy 2014?
Ans. The National Youth Policy 2014 (NYP-2014) was launched in February 2014 by the Government of India. It defines youth as persons in the age group of 15-29 years and proposes a holistic vision: "To empower the youth of the country to achieve their full potential, and through them enable India to find its rightful place in the community of nations." The policy is relevant to the population chapter because about 20.9% of India's population in 2011 was in the 10-19 adolescent age group, presenting both opportunities and challenges for social and economic development.
Ques. How are these population notes different from the NCERT Solutions PDF?
Ans. These population distribution density growth and composition class 12 notes carry the concept summaries, definitions, data tables and common mistakes without worked exercise answers. The NCERT Solutions PDF takes each of the Chapter 1 exercise questions and works through it step by step with full explanation. The Notes file is for concept revision and formula memorisation; the Solutions PDF is for question-level practice, and the two are designed to be used together rather than as substitutes. Most students find that 30 minutes on the Notes followed by 45 minutes on the Solutions PDF covers the full chapter effectively.



Comments