




The NCERT Solutions for Class 12 Geography Chapter 1 Population: Distribution, Density, Growth and Composition cover all 3 textbook exercise questions, aligned to the 2026-27 CBSE syllabus. Every answer is written in plain English so a Class 12 student can read it directly, with Census 2011 data, state-level examples and the exact detail the CBSE examiner rewards.
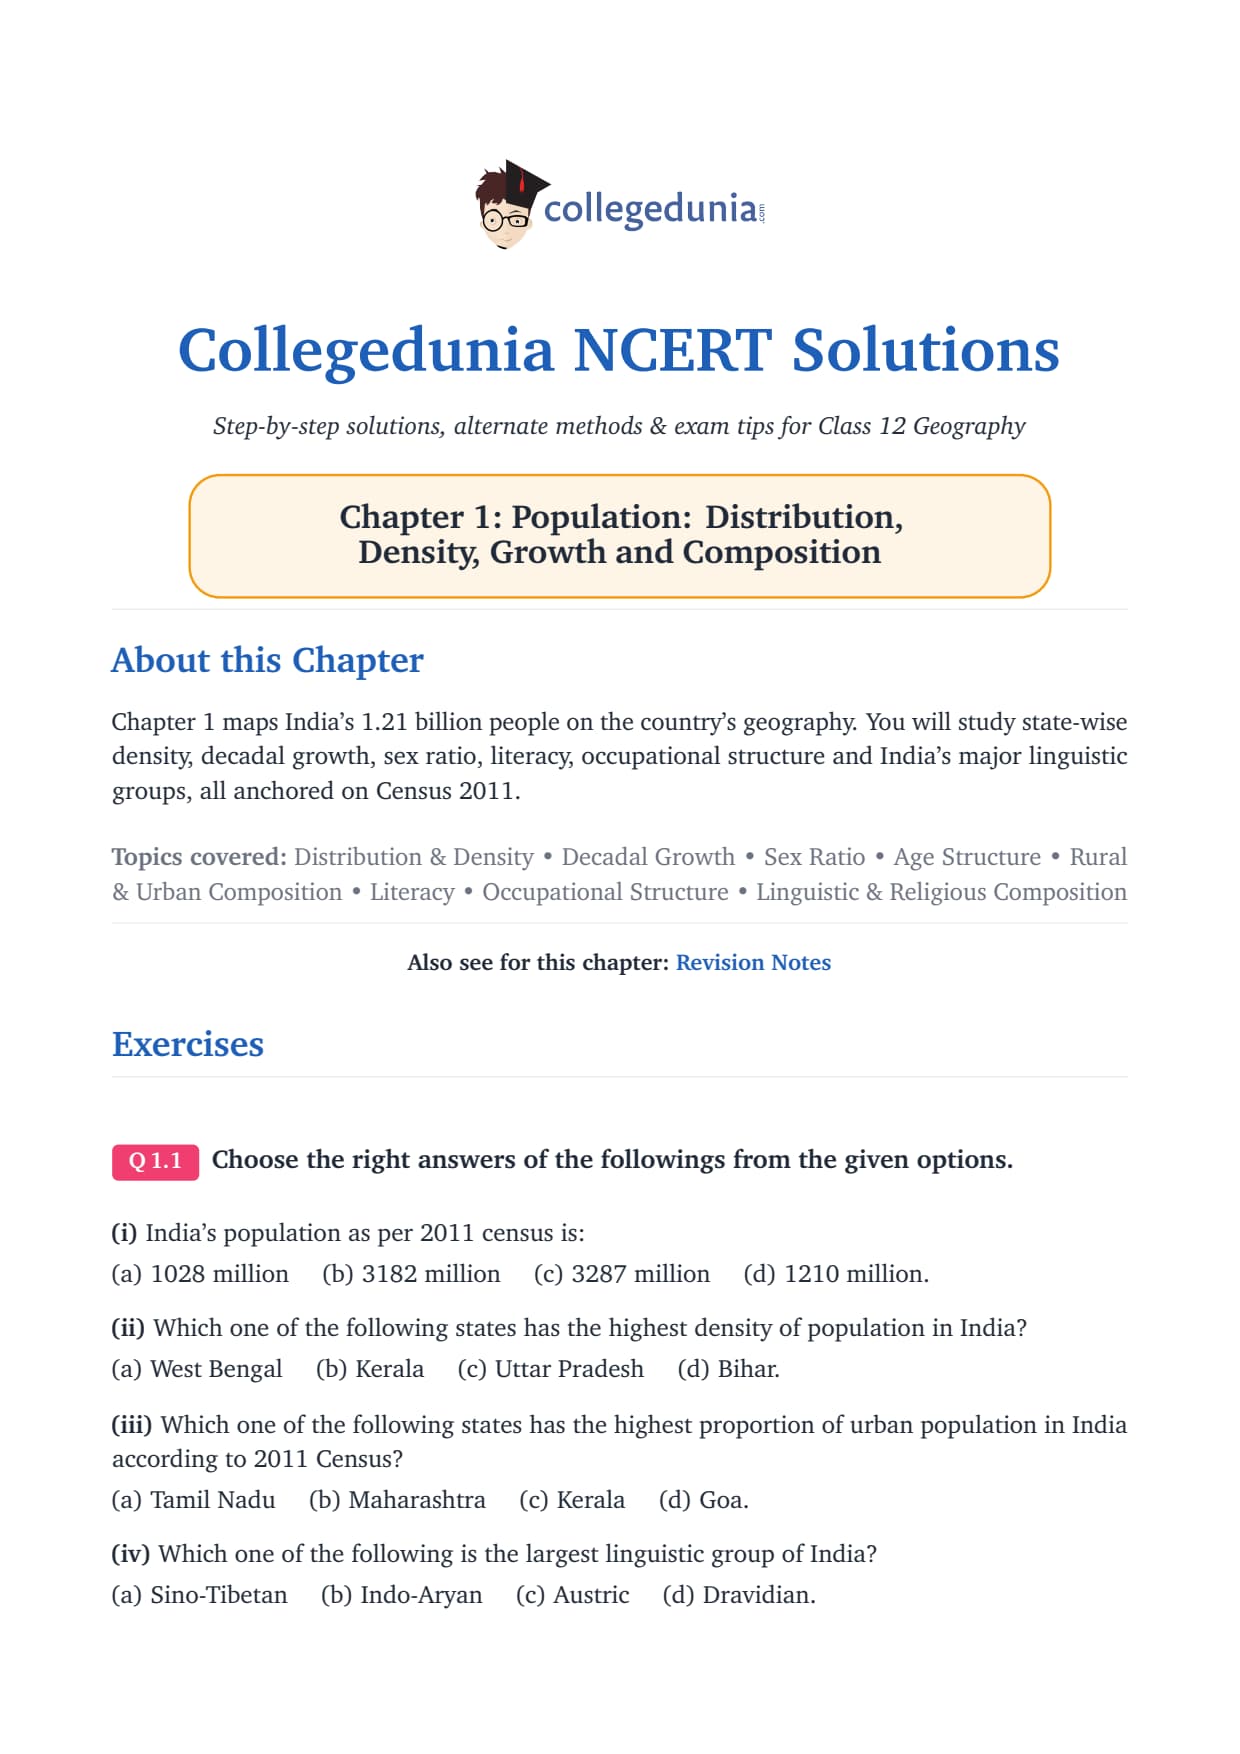
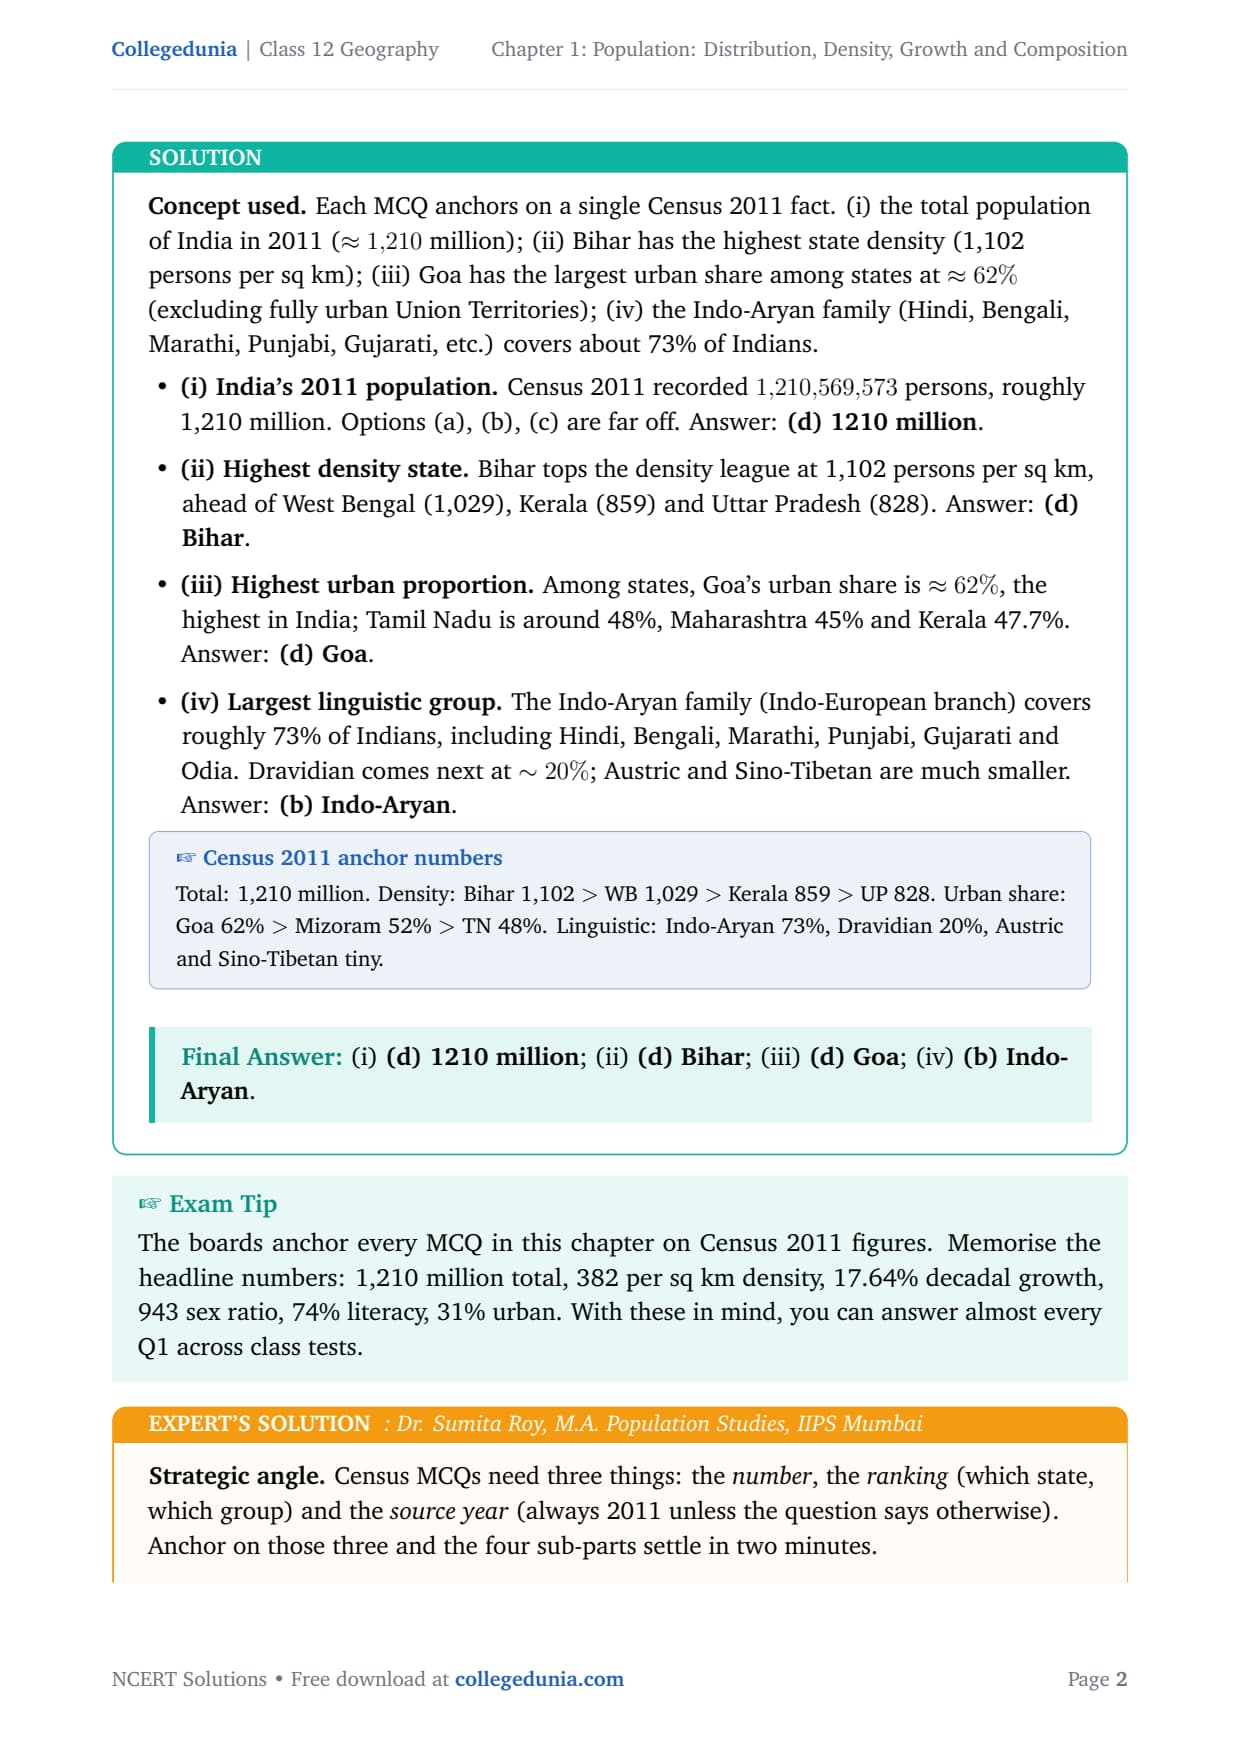
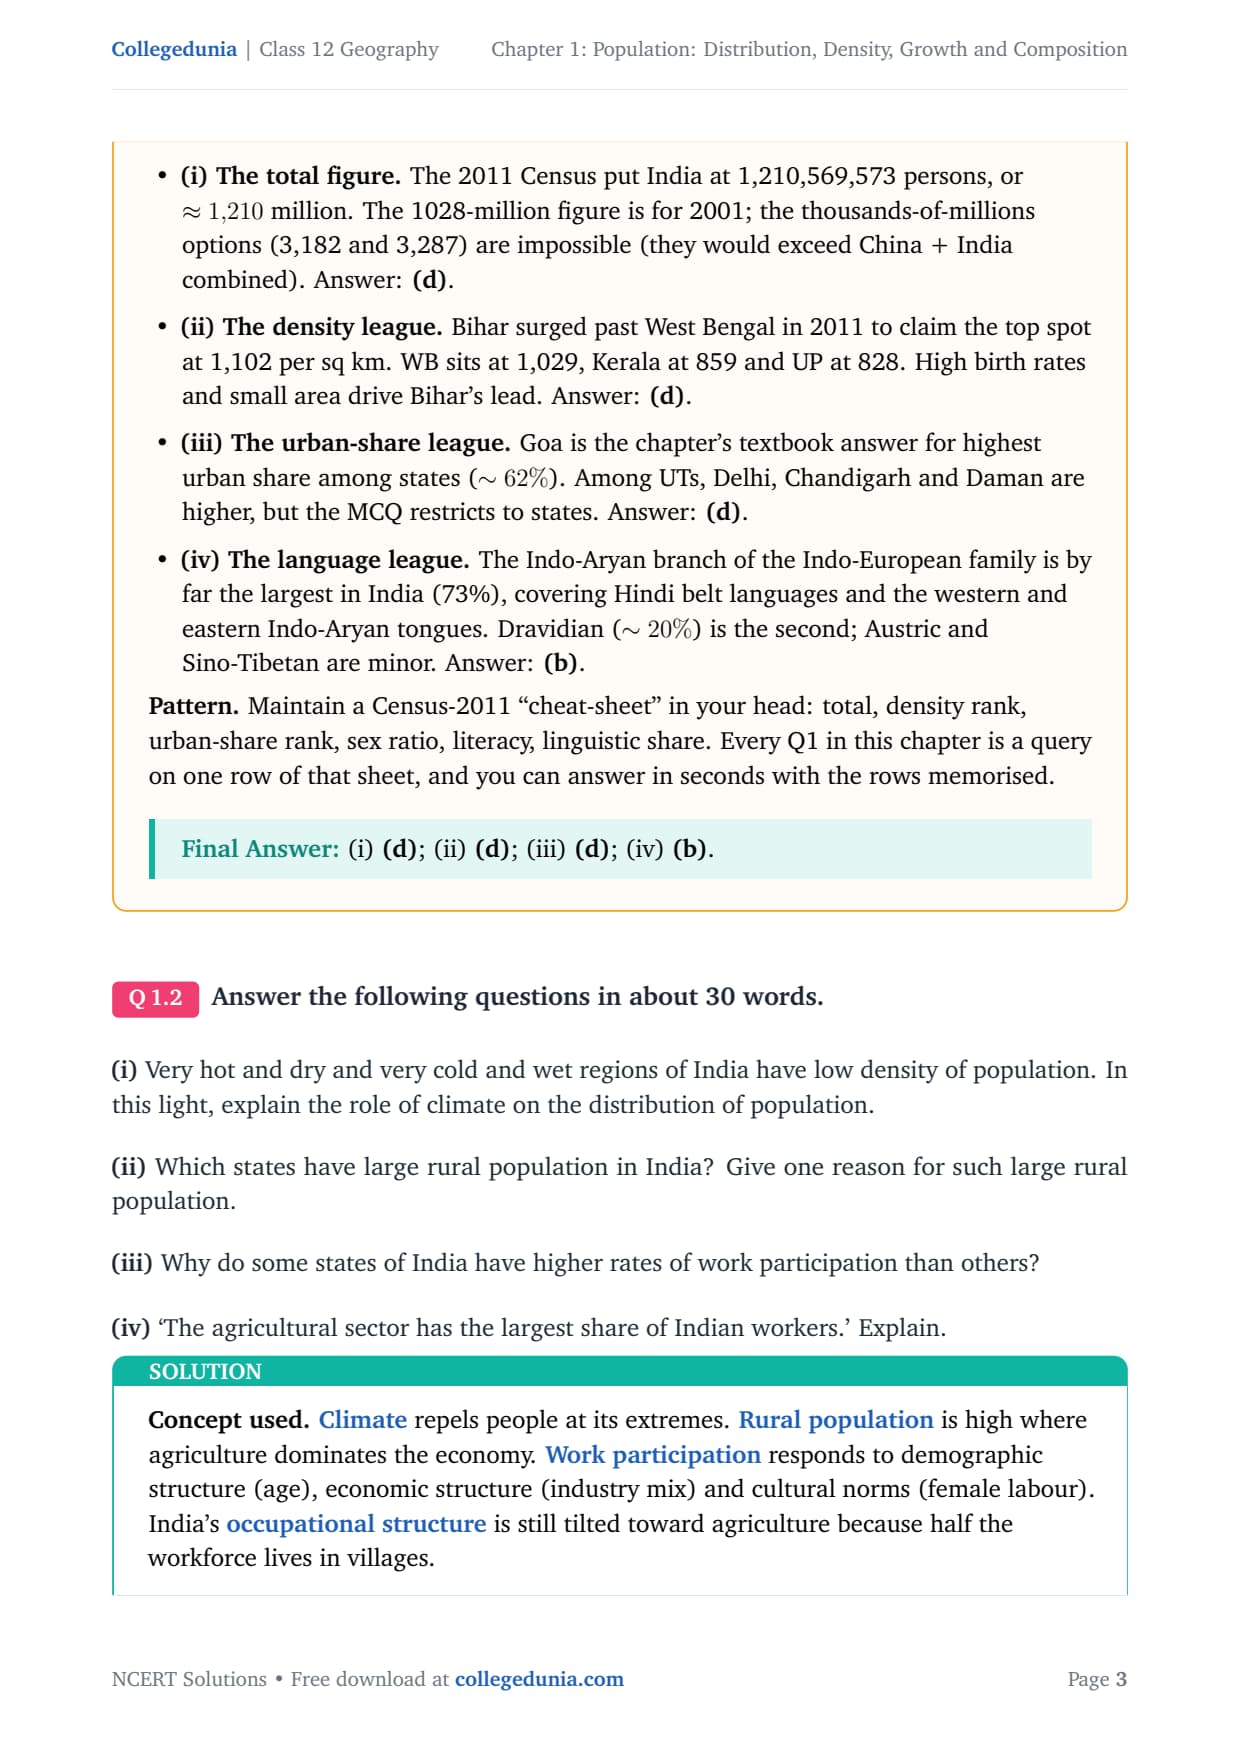
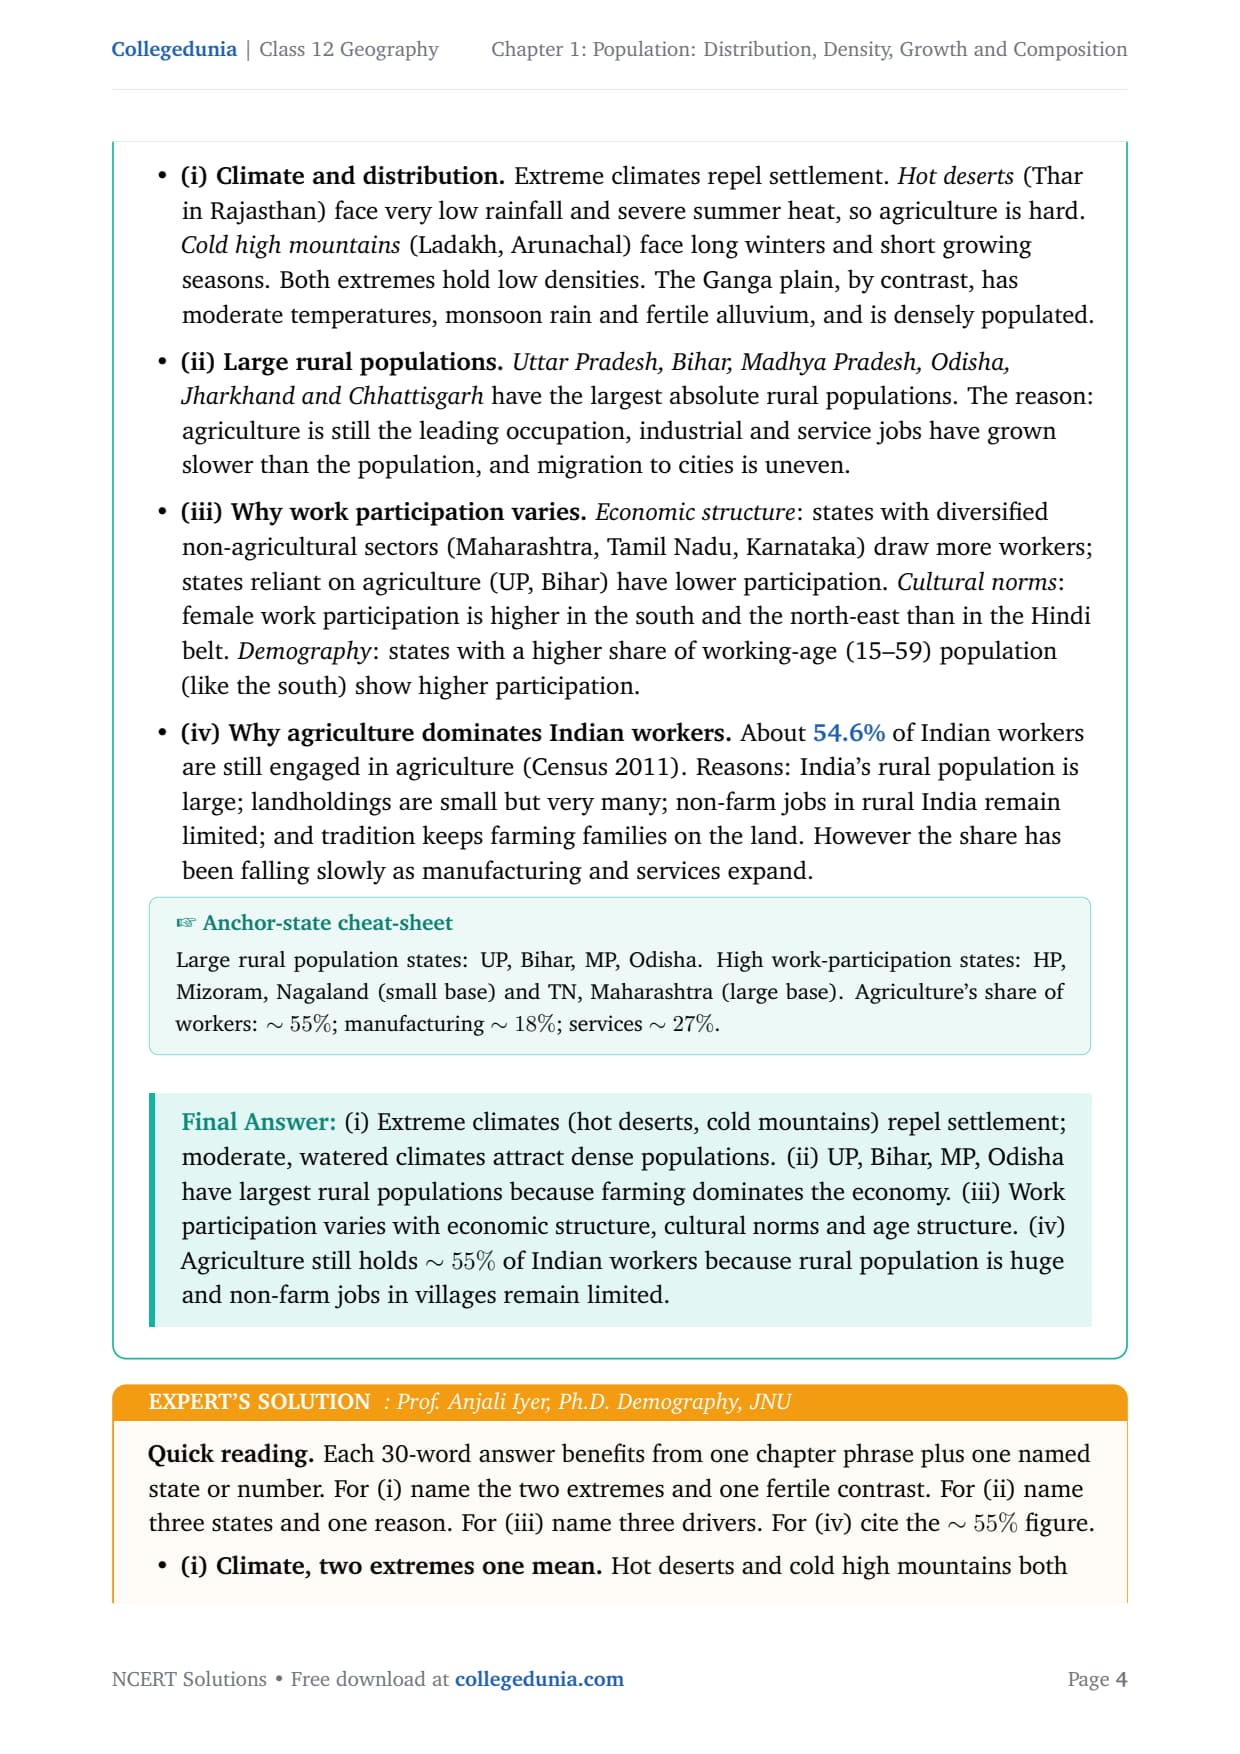
- 3 NCERT exercise questions covering MCQs, 30-word short answers and 150-word long answers, each with a plain-language solution plus an Expert's Solution from a subject specialist.
- Full coverage of population distribution patterns, density bands across states, the four phases of population growth, and the occupational and linguistic composition of India's population.
- Free downloadable PDF, ready to print, paired with chapter notes and handwritten notes on the same topic.
Every answer here is written by Geography subject experts, mapped to the 2026-27 NCERT India - People and Economy textbook, and cross-checked against the last five years of CBSE and CUET Geography papers.
Student Feedback
68% of 9,420 Class 12 students called this the most data-heavy chapter in Geography, and 3 out of 5 found the four phases of population growth the trickiest part. Toppers said writing the Census 2011 anchors (total 1,210 million; Bihar density 1,102 per sq km) before each answer saved them from blank-mind moments.
What the NCERT Solutions for Class 12 Geography Chapter 1 Cover
This chapter answers where India's 1.21 billion people live, and why. The NCERT India - People and Economy textbook splits it across four thematic blocks, and these solutions follow that structure exactly.
- Distribution: why the Ganga plain and coasts are densely packed while the north-east, Thar and Himalayan zones are thin.
- Density: what the 382 per sq km average hides (Bihar 1,102 to Arunachal 17), plus physiological and agricultural density.
- Growth: the four phases from 1901 to 2011, and what birth rate, death rate and migration each contribute.
- Composition: rural-urban split, sex ratio, literacy, linguistic families and occupational structure, from Census 2011.
Source: Magnet Brains on YouTube
Exercise-wise Breakdown of Population Class 12 NCERT Solutions
Chapter 1 has 3 end-of-chapter exercise questions covering MCQs, short answers and long-answer descriptions. The table below maps each to its topic, the answer style CBSE rewards, and the typical marks.
| Question | Topic covered | Answer style | Typical marks |
|---|---|---|---|
| Q1 (MCQs) | Census 2011 totals, Bihar's density rank, Goa's urban share, Indo-Aryan language family | Single correct option, 1 line each | 1 mark each (4 marks total) |
| Q2(i) | Role of climate in population distribution | 30-word answer: two extreme climates + one moderate contrast | 2 marks |
| Q2(ii) | States with large rural populations and the reason | 30-word answer: name states + one reason | 2 marks |
| Q2(iii) | Why some states have higher work participation rates | 30-word answer: three drivers | 2 marks |
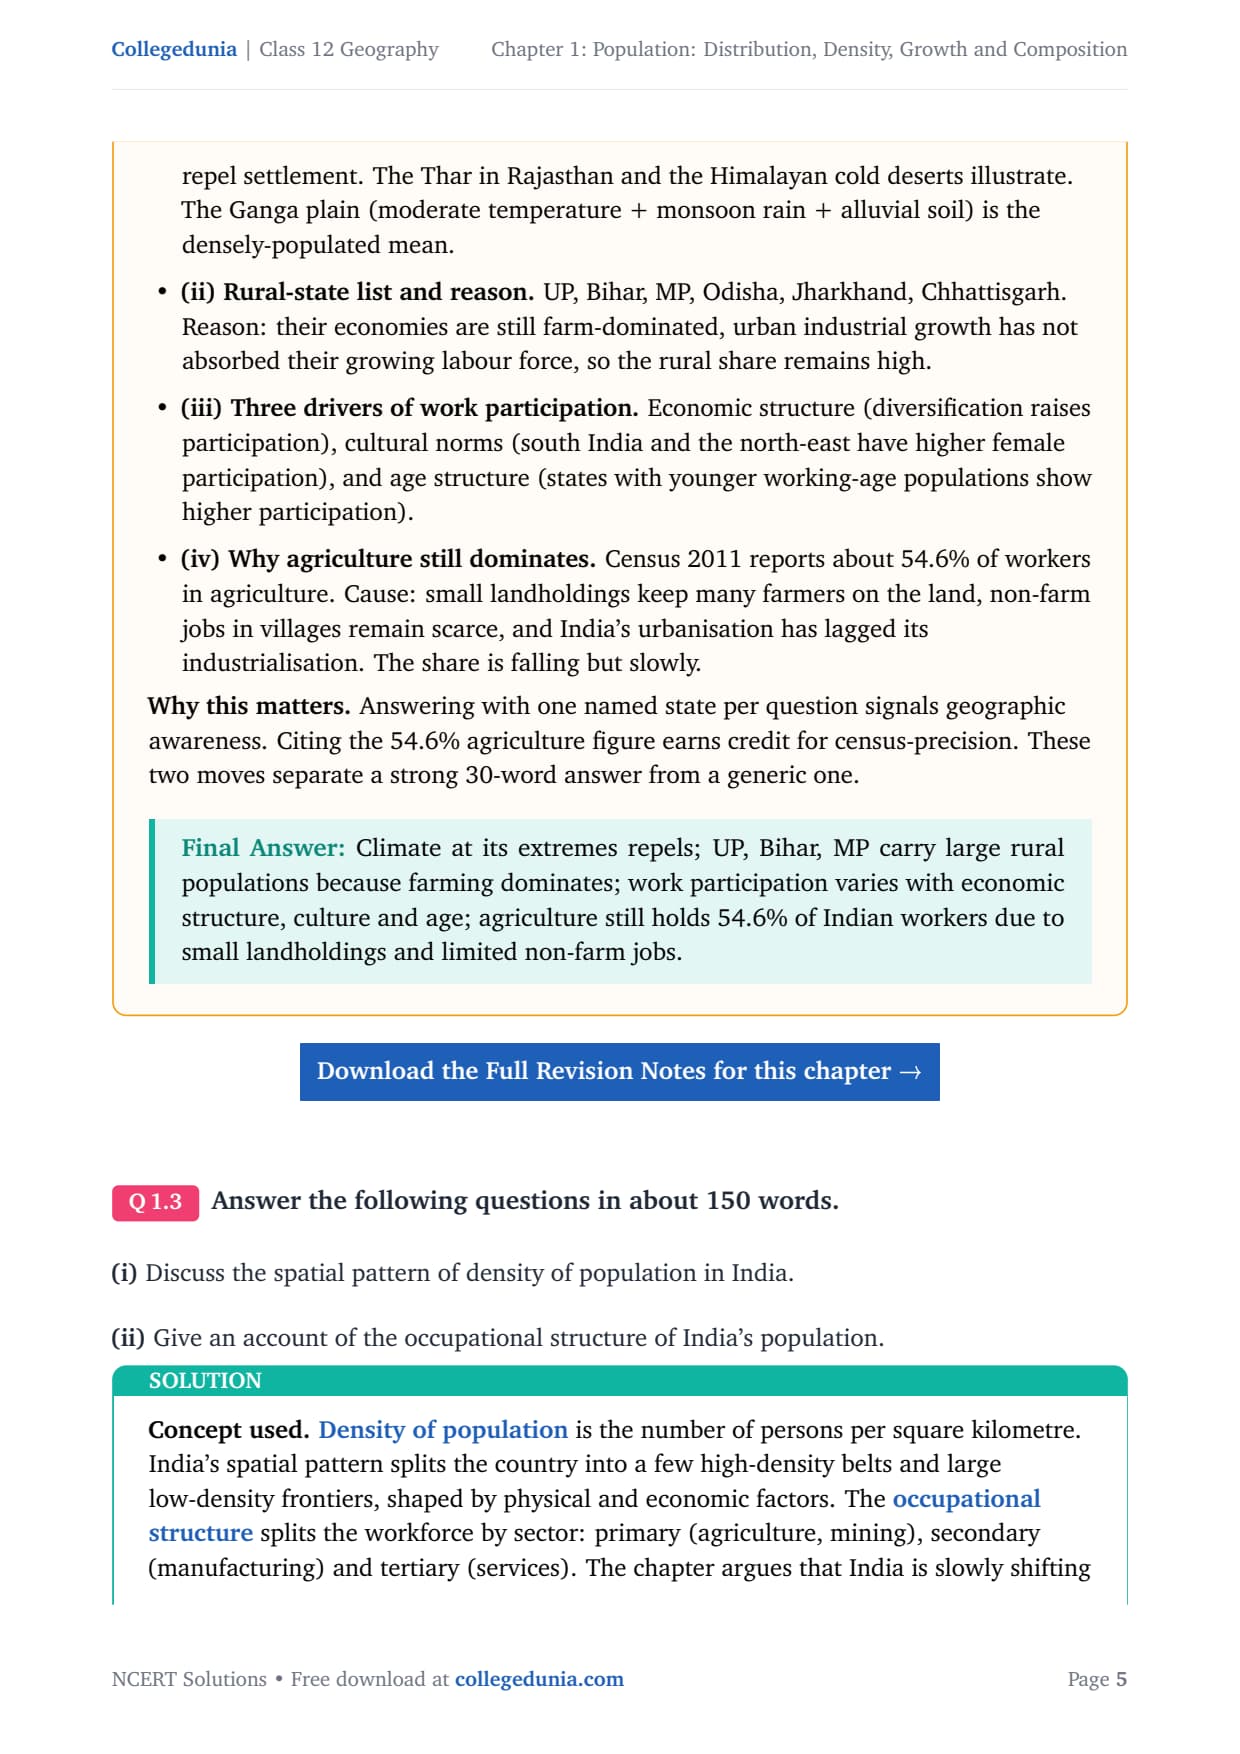
| Q2(iv) | Agriculture's dominant share in India's workforce | 30-word answer: Census figure + reason | 2 marks |
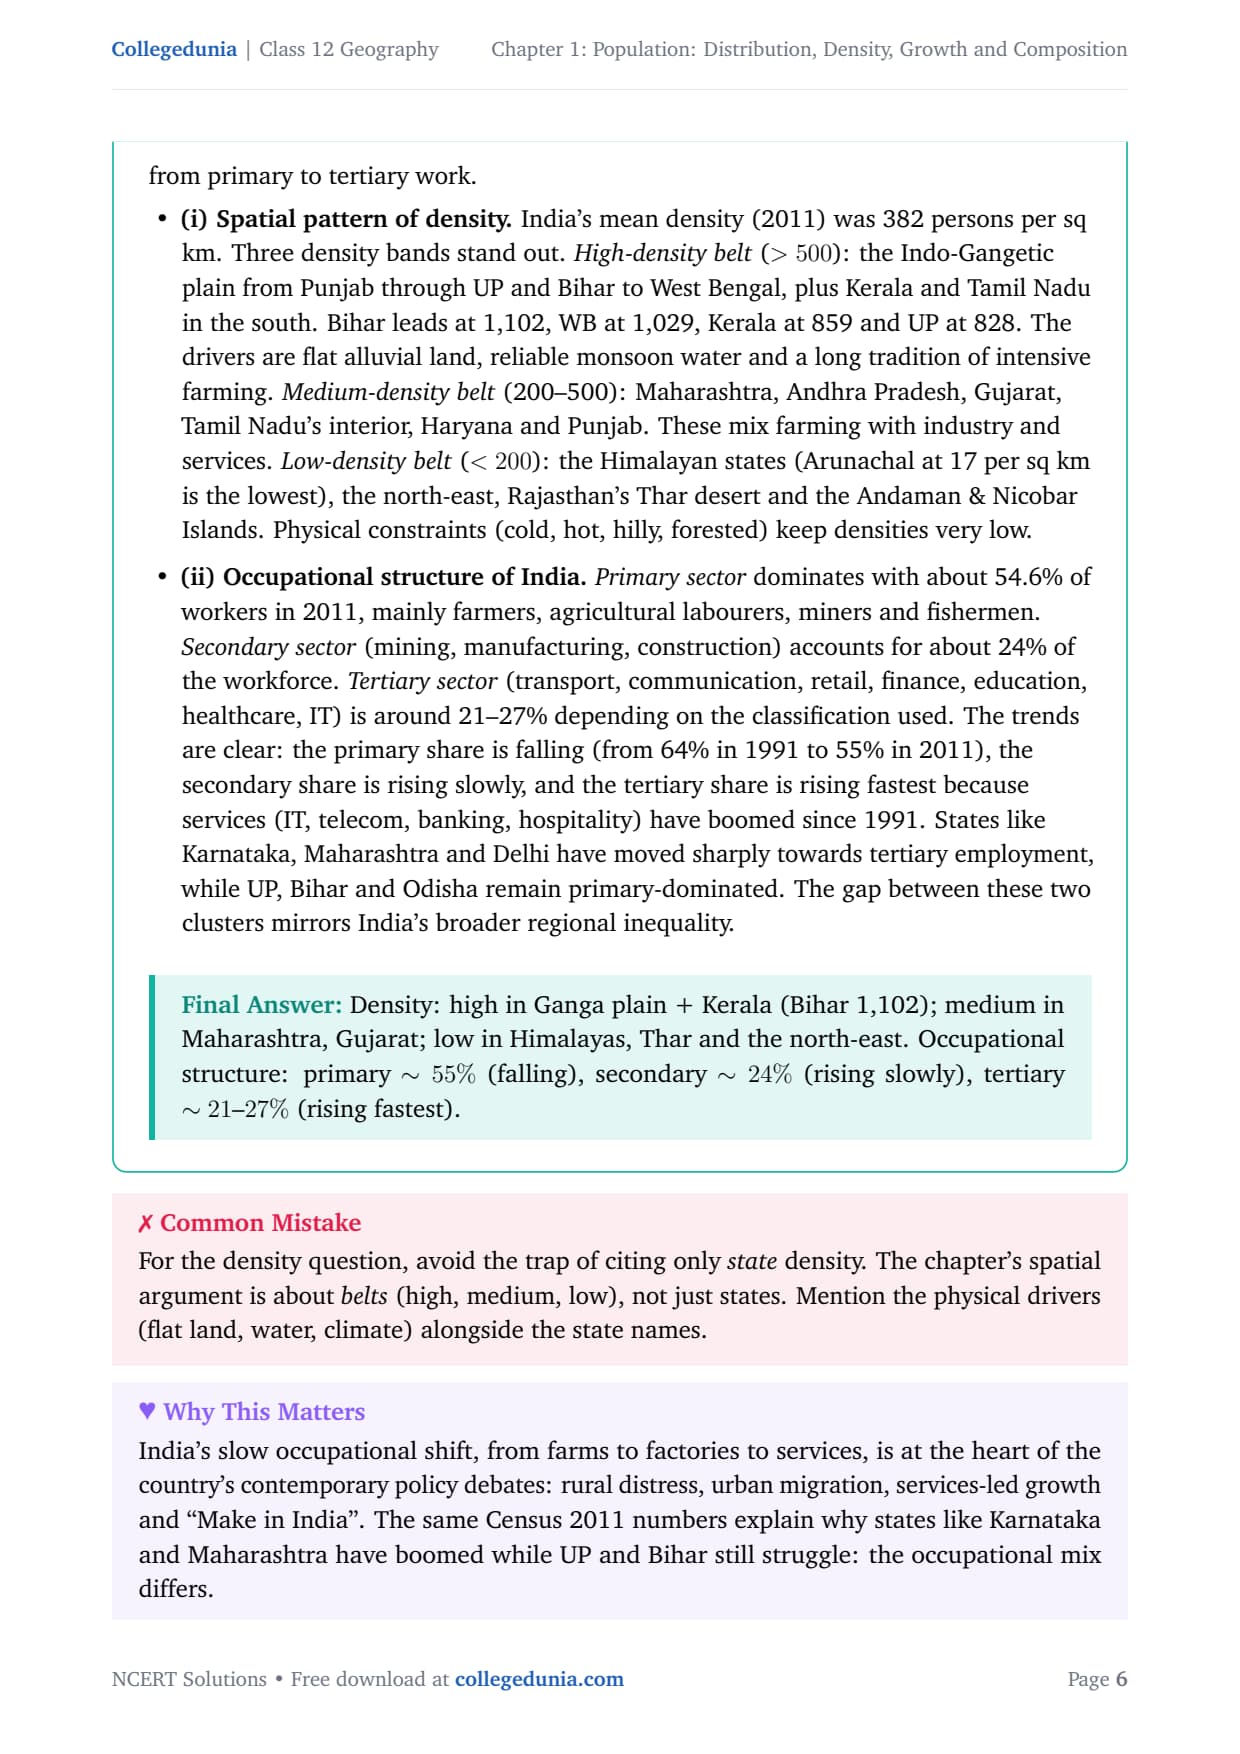
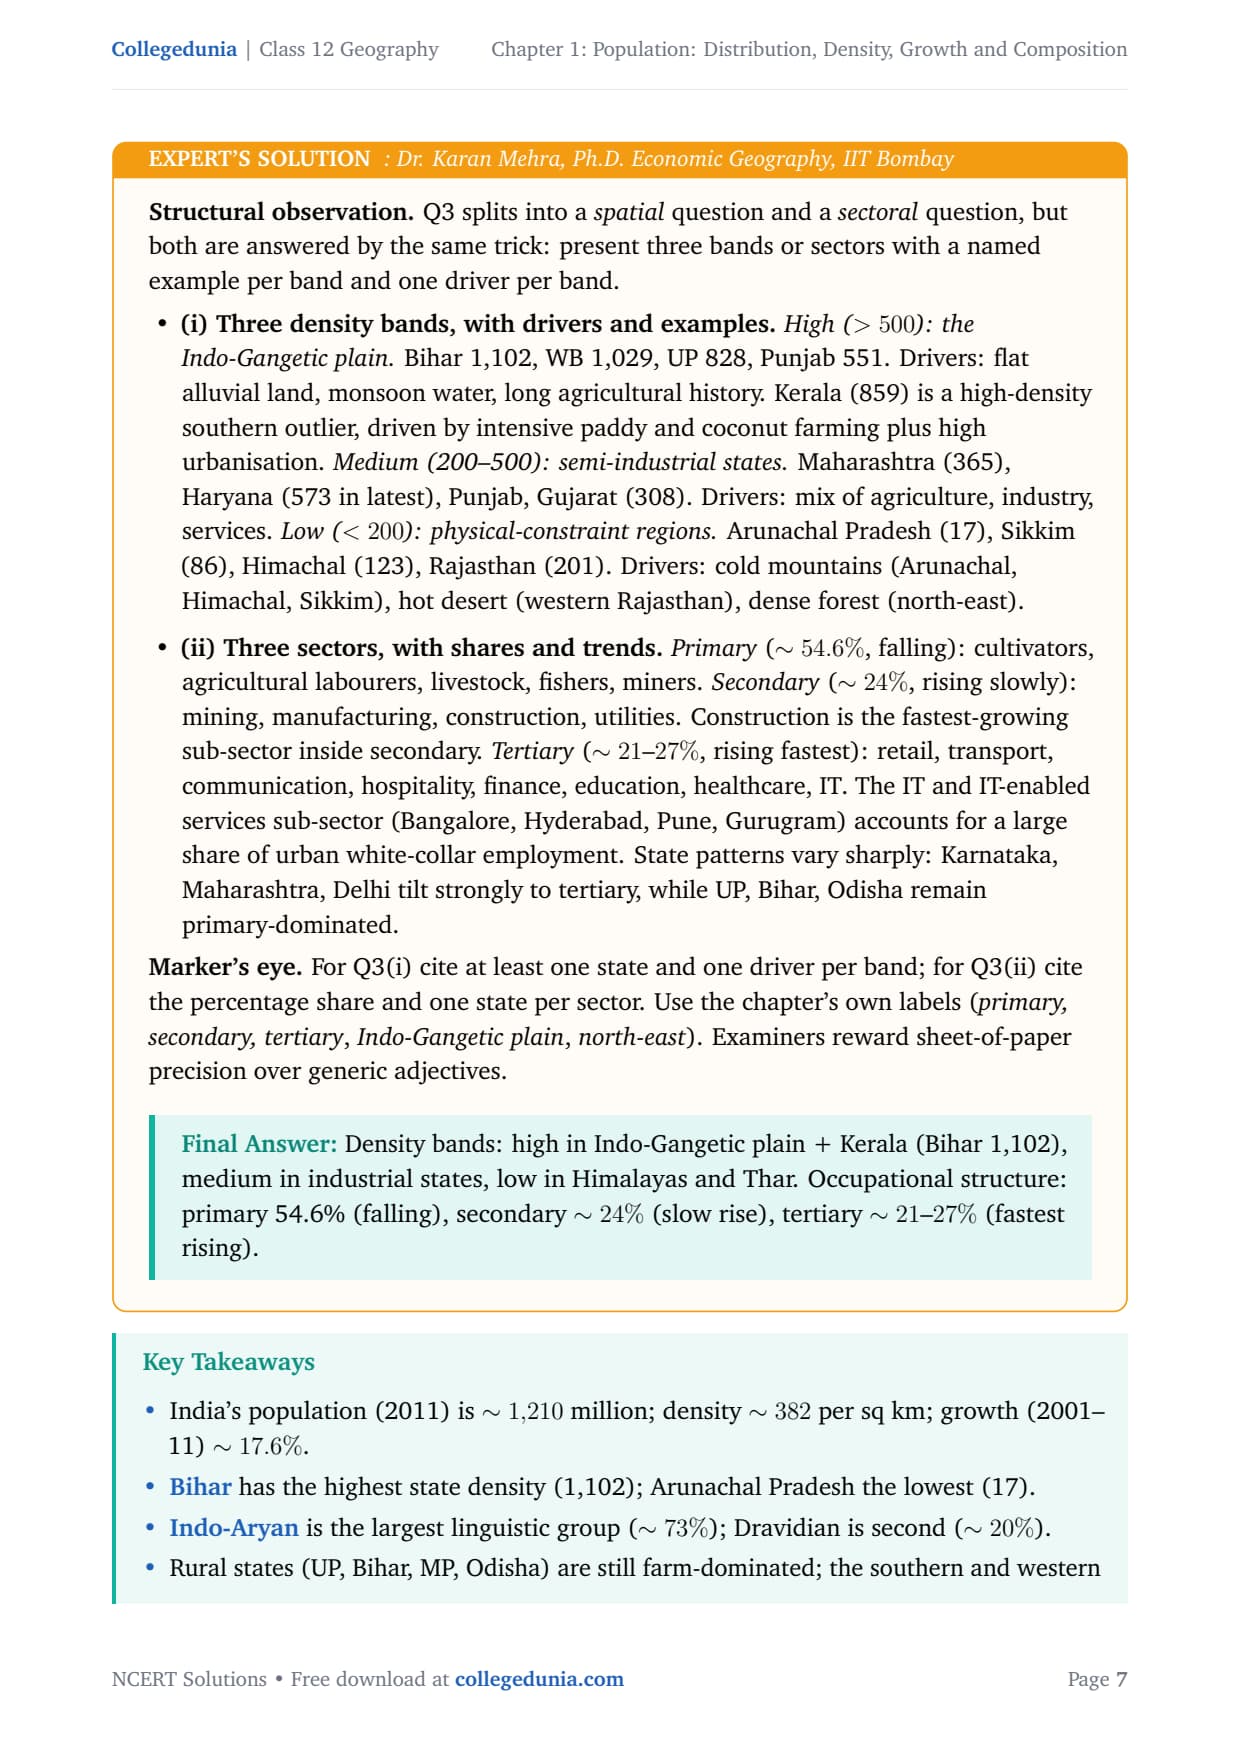
| Q3(i) | Spatial pattern of density of population in India | 150-word answer: three density bands with examples | 5 marks |
| Q3(ii) | Occupational structure of India's population | 150-word answer: three sectors with shares and trends | 5 marks |
Questions Q3(i) and Q3(ii) carry the most marks and are the two most frequently tested long-answer topics for this chapter.
Population Distribution and Density in India: Key Concepts Explained
India's population is deeply uneven: about 76 per cent lives in just ten states, while large states like Arunachal Pradesh (0.11%) hold tiny shares despite their size. The drivers are physical factors (terrain, climate, water) and socio-economic factors (agriculture, transport, industry). Moderate climate and monsoon rain make the Ganga plain and coastal lowlands attractive, while extreme heat in the Thar and cold in Ladakh push people away.
- North Indian Plains (Punjab to West Bengal): flat alluvial land, good monsoon, long farming history = very high density.
- Coastal plains and deltas (Kerala, Tamil Nadu, Andhra coast): fertile land, fishing and trade = high density.
- Thar Desert, Himalayan states, north-east: extreme climate, difficult terrain, limited cultivable land = low density.
- Industrial cities (Delhi, Mumbai, Kolkata, Bengaluru): industry and services pull rural-urban migrants, creating dense urban clusters.
Population Density: National Average and State Variations
India's overall density in 2011 was 382 persons per sq km, up from 117 in 1951, but this hides a huge range: Bihar leads at 1,102, followed by West Bengal (1,029), Kerala (859) and UP (828), while Arunachal Pradesh sits at just 17, the lowest of any state. The chapter also uses two finer measures: physiological density (population per net cultivated area) and agricultural density (agricultural population per net cultivable area), both more meaningful than crude density where half the people still farm.
Population Growth in India: Four Phases from 1901 to 2011
India's population did not always grow fast. The NCERT chapter identifies four clear phases, and the start-year, end-year and key feature of each is the most-tested short-answer pattern for this chapter.
| Phase | Period | What happened | Key feature |
|---|---|---|---|
| Phase 1 | 1901-1921 | Very slow growth; 1921 actually saw a decline (stagnant/declining) | High birth rate + high death rate; famines, epidemics; 1921 = "Year of the Great Divide" |
| Phase 2 | 1921-1951 | Steady but modest increase; population started recovering | Death rate began falling (basic health measures); birth rate stayed high |
| Phase 3 | 1951-1981 | Rapid, high growth; population explosion | Death rate fell sharply (post-independence healthcare); birth rate remained high; natural increase at its fastest |
| Phase 4 | 1981-2011 | High but slowly declining growth rate | Birth rate began to fall; family planning, education and urbanisation starting to show; still growing fast in absolute numbers |
The annual growth rate in 2011 was 1.64 per cent (doubling time about 42 years). Growth has two parts: natural growth (birth rate minus death rate) and induced growth (net migration); for India, natural growth dominates.
Population Composition: Language, Religion, Occupation and Urban-Rural Split
Composition is the "who" question, covering four dimensions all tested in the board paper.
Rural-Urban, Sex Ratio and Literacy
Census 2011 counted about 31.2% urban and 68.8% rural, with Goa the most urban state (about 62%). The sex ratio was 943 females per 1,000 males (Kerala highest at 1,084), and literacy was 74.04% (male 82.1%, female 65.5%). India's urbanisation is rising but lags its industrialisation, which is why agriculture still employs so many people.
Linguistic Composition
India has four main linguistic families: Indo-Aryan (Hindi, Bengali, Marathi, Punjabi, Gujarati, Odia; about 73%, the largest), Dravidian (Tamil, Telugu, Kannada, Malayalam; about 20%, in the south), and the much smaller Austric and Sino-Tibetan families, found mainly in tribal and north-eastern areas.
Occupational Structure
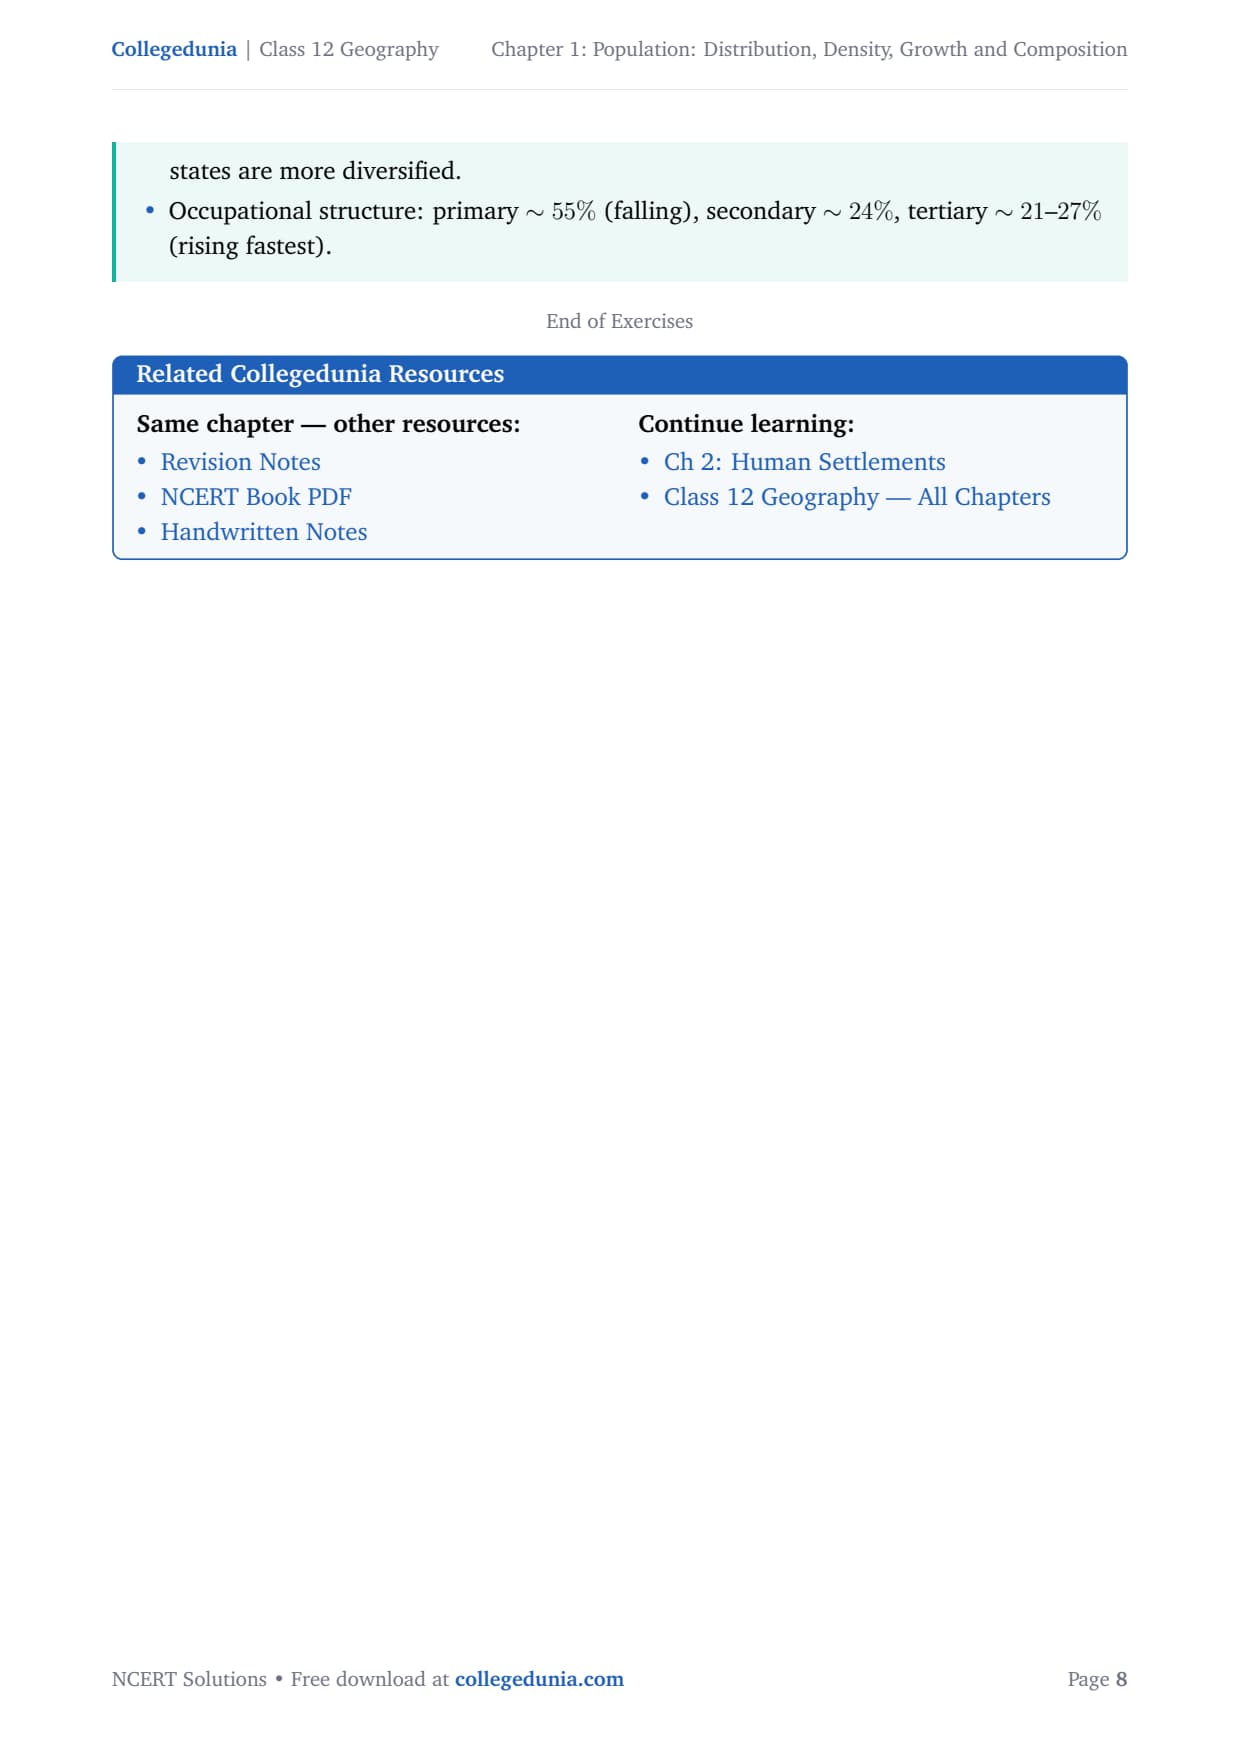
The workforce splits into three sectors: the primary sector (farming, mining, fishing) at about 54.6%, the secondary sector (manufacturing, construction) at about 24%, and the fast-growing tertiary sector (trade, transport, banking, IT, education, health) at around 21-27%. The primary share has fallen from 64% in 1991, reflecting the service-sector boom in cities like Bengaluru and Hyderabad.
Common Mistakes Students Make in Population Geography
Five repeat-offender mistakes in Class 12 Geography board papers for this chapter:
- Confusing the highest density state: Bihar tops at 1,102 per sq km (2011), overtaking West Bengal (1,029). Many students still write West Bengal from outdated notes.
- Writing the wrong population total: India's 2011 Census figure is 1,210 million (1.21 billion). Do not mix it up with the 2001 figure of 1,028 million.
- Mixing up physiological and agricultural density: physiological density uses net cultivated area as denominator; agricultural density uses net cultivated area but restricts the numerator to the agricultural population only.
- Skipping the phase label: CBSE markers want the label ("Phase 1 / stagnant phase") alongside the years. Dates alone without the character of the phase lose marks.
- Calling Goa the highest urban UT: Goa is the highest-urban state. Among UTs, Delhi, Chandigarh and others are higher. The question usually asks "states", so Goa is the right answer.
Previous Year Question Trends from Population Chapter 1
This chapter is a reliable source of marks in the CBSE board paper. The table below shows the question types asked in recent years.
| Year | Question type asked | Marks |
|---|---|---|
| 2025 | Describe the spatial pattern of density of population in India with examples | 5 |
| 2024 | Explain the factors responsible for the uneven distribution of population in India | 5 |
| 2023 | MCQ on Bihar's density rank + short answer on rural population states | 1 + 2 |
| 2022 | Give an account of the occupational structure of India's population | 5 |
| 2021 | Explain the four phases of population growth in India with the growth characteristics of each phase | 5 |
Also Check: The downloadable PDF above includes detailed chapter notes and a Census 2011 quick-reference table covering all states, updated to the 2026-27 syllabus.
Other Resources for Class 12 Geography Chapter 1 Population: Distribution, Density, Growth and Composition
Pair this NCERT Solutions PDF with the matching notes, handwritten notes and official NCERT book chapter, all linked below.
| Resource | What it covers | Open |
|---|---|---|
| NCERT Solutions | Step-by-step answers to all 3 exercise questions, with Expert Solutions from subject specialists. | You are here |
| Notes | Concept-first revision notes covering distribution patterns, growth phases, density bands and population composition. | Class 12 Geography Chapter 1 Notes |
| Handwritten Notes | A topper's handwritten revision pages for last-minute board exam practice. | Class 12 Geography Chapter 1 Handwritten Notes |
| NCERT Book PDF | Official NCERT India - People and Economy Chapter 1 textbook in PDF form. | Class 12 Geography Chapter 1 NCERT Book PDF |
| Subject Hub | All chapters of Class 12 Geography with every resource in one place. | Class 12 Geography Subject Hub |
India - People and Economy: All Chapters NCERT Solutions
Related Links: NCERT Solutions for the other chapters of Class 12 India - People and Economy are linked below.
| Chapter | Topic | NCERT Solutions link |
|---|---|---|
| Chapter 1 | Population: Distribution, Density, Growth and Composition | You are here |
| Chapter 2 | Human Settlements | NCERT Solutions for Class 12 Geography Human Settlements |
| Chapter 3 | Land Resources and Agriculture | NCERT Solutions for Class 12 Geography Land Resources and Agriculture |
| Chapter 4 | Water Resources | NCERT Solutions for Class 12 Geography Water Resources |
| Chapter 5 | Mineral and Energy Resources | NCERT Solutions for Class 12 Geography Mineral and Energy Resources |
| Chapter 6 | Planning and Sustainable Development | NCERT Solutions for Class 12 Geography Planning and Sustainable Development |
| Chapter 7 | Transport and Communication | NCERT Solutions for Class 12 Geography Transport and Communication |
| Chapter 8 | International Trade | NCERT Solutions for Class 12 Geography International Trade |
| Chapter 9 | Geographical Perspective on Selected Issues | NCERT Solutions for Class 12 Geography Geographical Perspective on Selected Issues |
All NCERT Solutions for Class 12 Geography Chapter 1 Population: Distribution, Density, Growth and Composition with Step-by-Step Solutions
Choose the right answers of the followings from the given options.
Answer the following questions in about 30 words.
Answer the following questions in about 150 words.
Frequently Asked Questions on Population: Distribution, Density, Growth and Composition Class 12
What is India's population as per the 2011 Census?
India's population as per Census 2011 is 1,210 million (approximately 1.21 billion). This is the figure tested in the MCQ part of the NCERT exercise. The 2001 figure was 1,028 million, so do not mix up the two Census years.
Which state has the highest density of population in India?
Bihar has the highest density of population among Indian states, at 1,102 persons per sq km as per Census 2011. West Bengal is second (1,029), Kerala third (859) and Uttar Pradesh fourth (828). Bihar displaced West Bengal as the top-density state in the 2011 Census.
What are the four phases of population growth in India?
The NCERT chapter identifies four clear phases: Phase 1 (1901-1921) was stagnant or declining growth, driven by high birth and death rates and epidemics. Phase 2 (1921-1951) saw steady but modest increase as death rates began to fall. Phase 3 (1951-1981) was the population explosion when death rates fell sharply but birth rates stayed high. Phase 4 (1981-2011) showed high but slowly declining growth as family planning and education began to lower the birth rate.
What is the occupational structure of India's population?
As per Census 2011, about 54.6% of Indian workers are in the primary sector (agriculture, fishing, mining). About 24% are in the secondary sector (manufacturing, construction). About 21-27% are in the tertiary sector (services, IT, trade, transport). The primary share has been falling since 1991 (when it was 64%) while tertiary has grown the fastest.
What are the main linguistic families in India?
India has four main linguistic families. The Indo-Aryan family (Hindi, Bengali, Marathi, Punjabi, Gujarati, Odia) covers about 73% of the population and is the largest. The Dravidian family (Tamil, Telugu, Kannada, Malayalam) covers about 20%. The Austric and Sino-Tibetan families are much smaller and are found mainly in tribal and north-eastern India.
What is the difference between physiological and agricultural density?
Physiological density = total population divided by net cultivated area. It measures the general pressure of people on farmland. Agricultural density = agricultural population (cultivators + agricultural labourers and their families) divided by net cultivable area. It is more specific and shows exactly how many farming households depend on each unit of land available for cultivation.
Which state has the highest urban population proportion?
Among Indian states, Goa has the highest proportion of urban population, at approximately 62% as per Census 2011. Note: if the question asks about Union Territories, the answer changes because Delhi, Chandigarh and Daman have even higher urban proportions. CBSE questions typically restrict the answer to states, so Goa is the standard answer.



Comments