



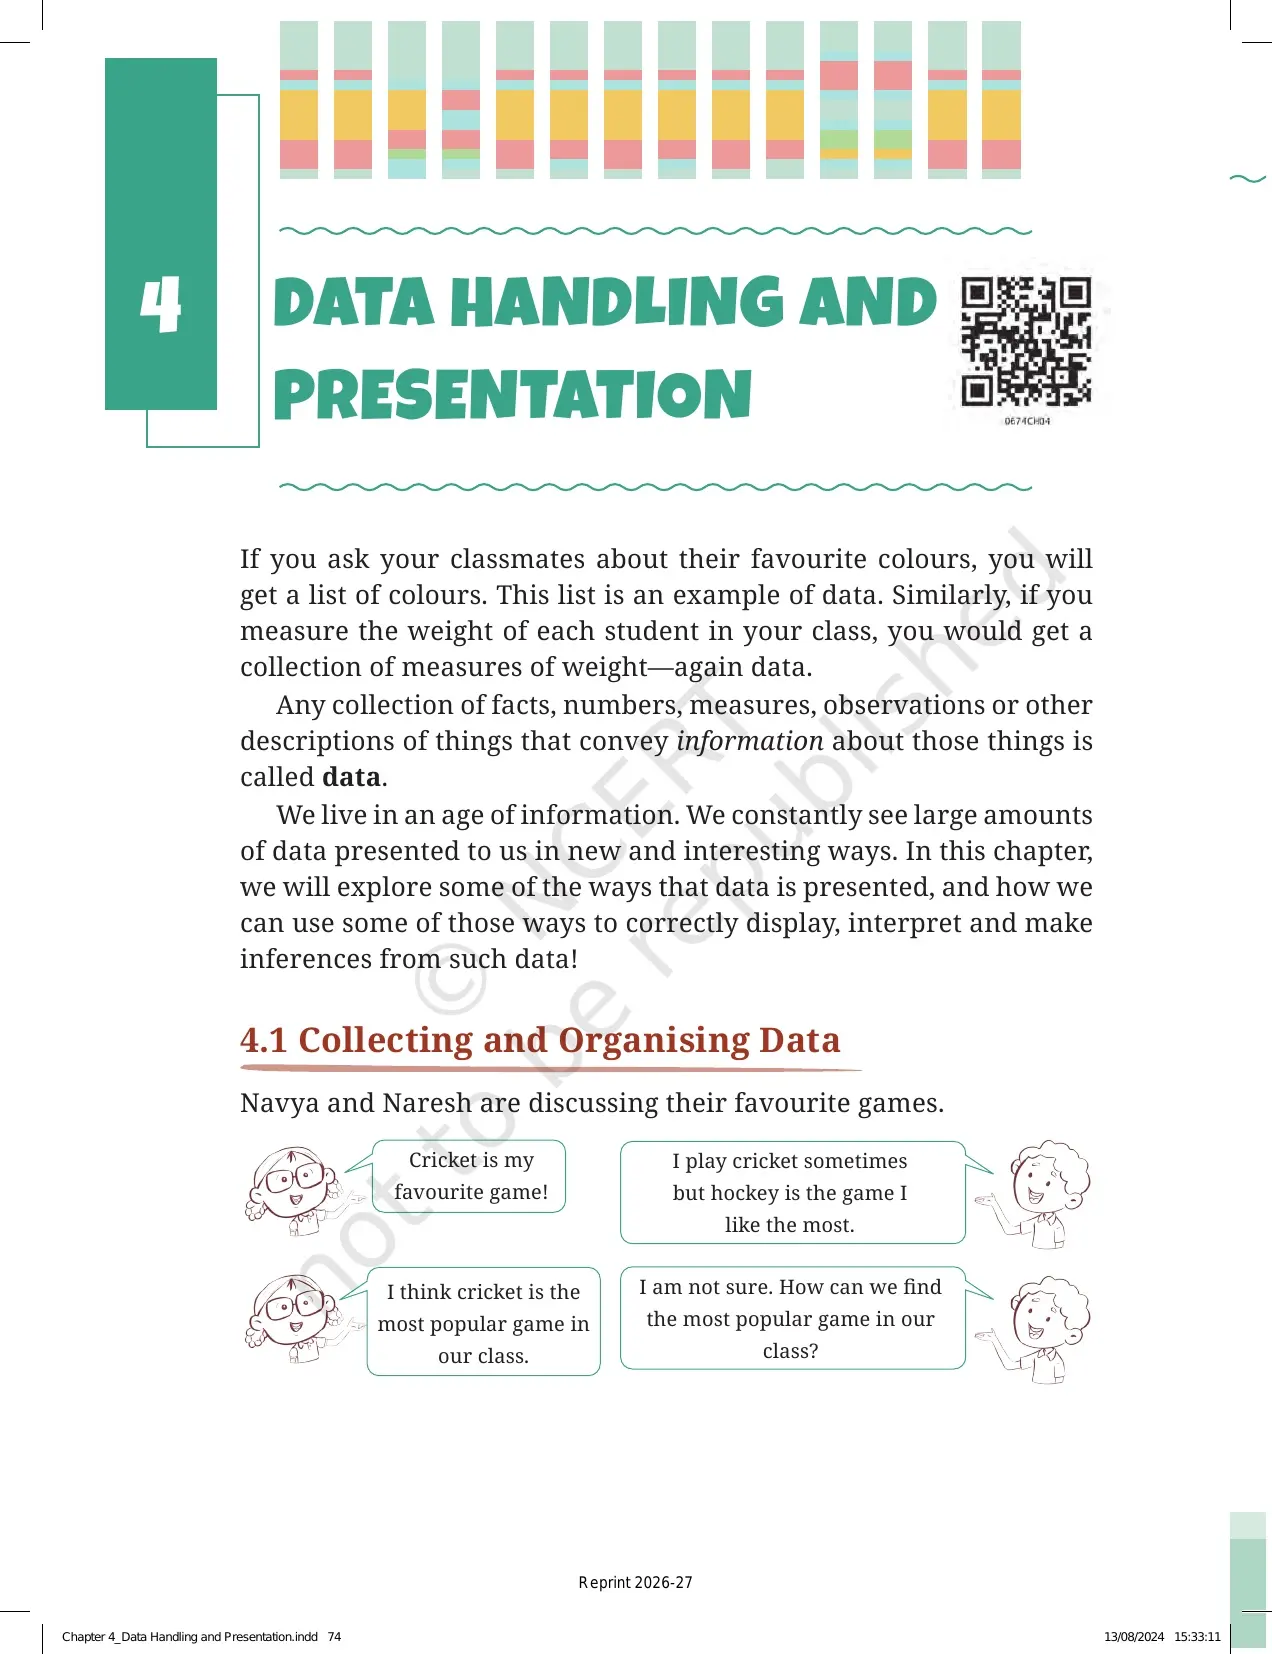
The NCERT Class 6 Mathematics Chapter 4 Data Handling and Presentation Book PDF gives students the official Ganita Prakash chapter for the 2026-27 session. The chapter explains how data is collected, counted, arranged in tables, and shown through pictographs and bar graphs.
- PDF length: 44 official NCERT pages from the 2026-27 reprint.
- Main focus: reading data, making tables, and comparing quantities through visual displays.
- Best use: read the PDF first, then practise the Figure it Out tasks in order.
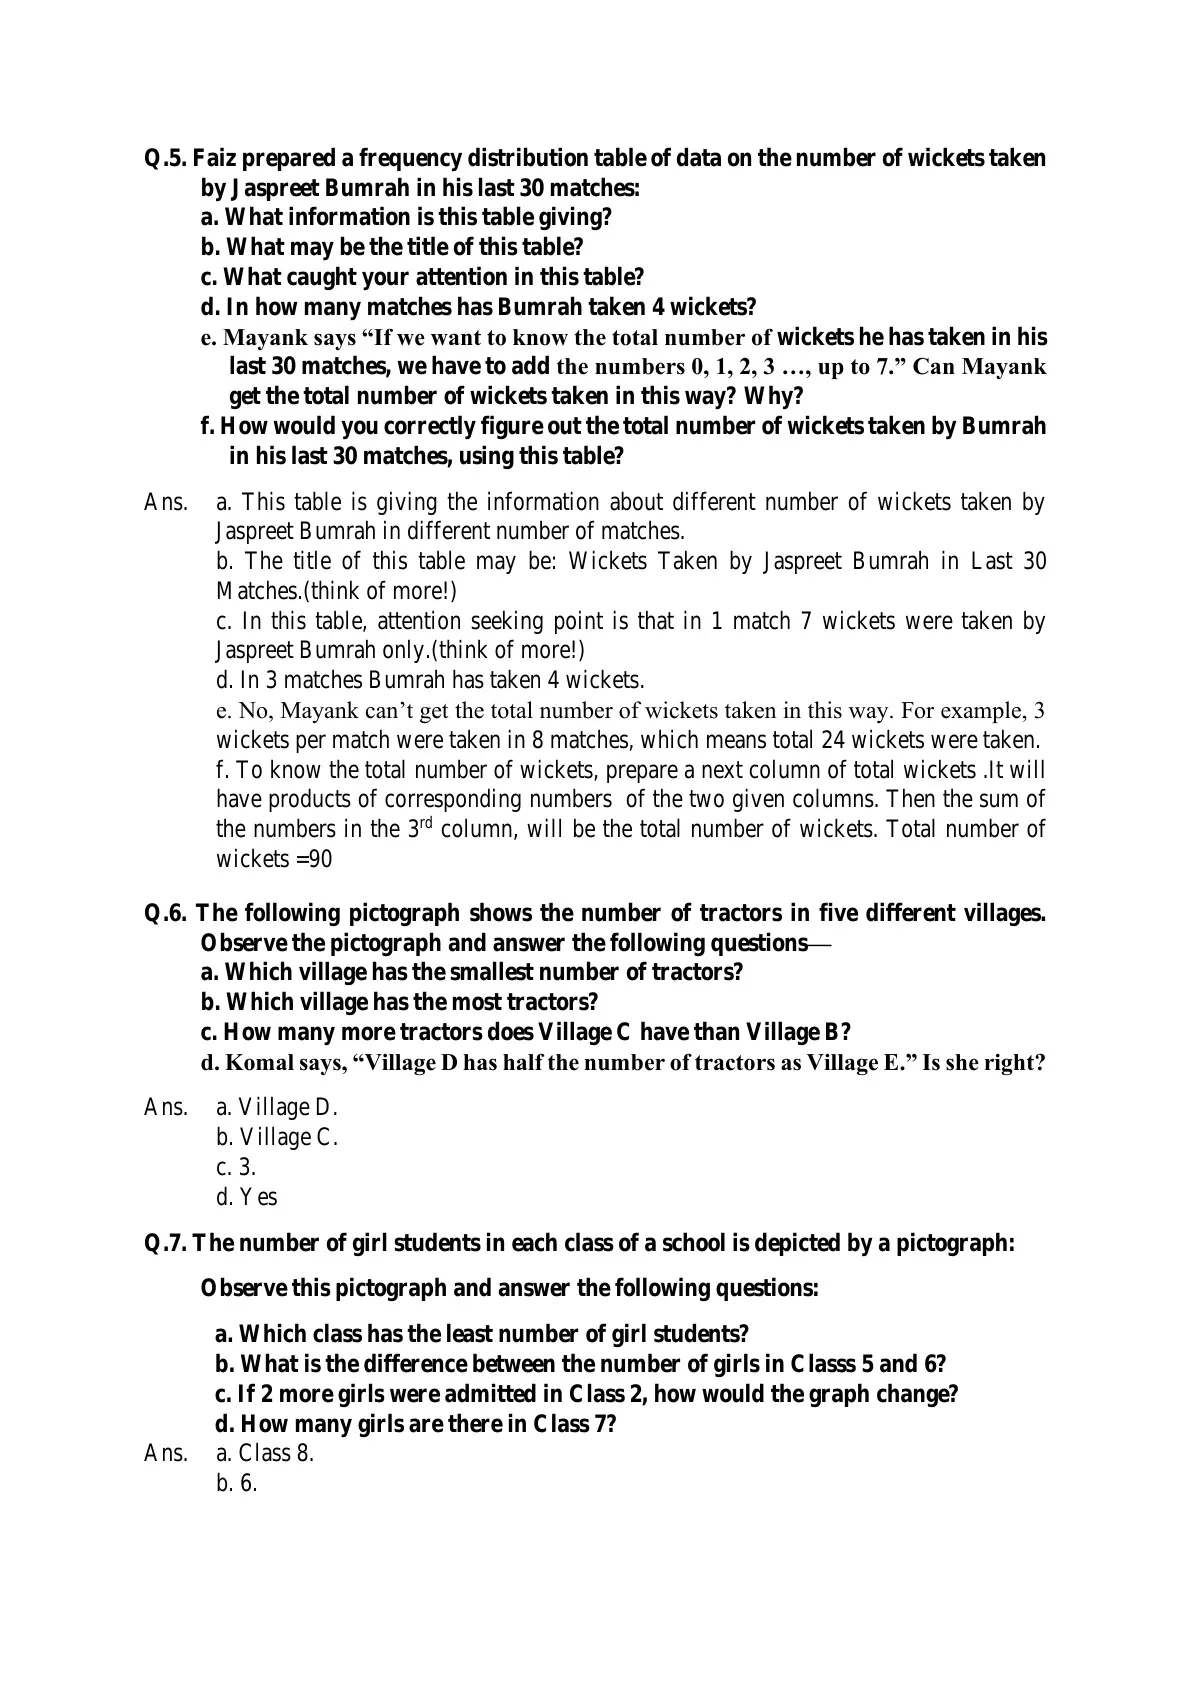
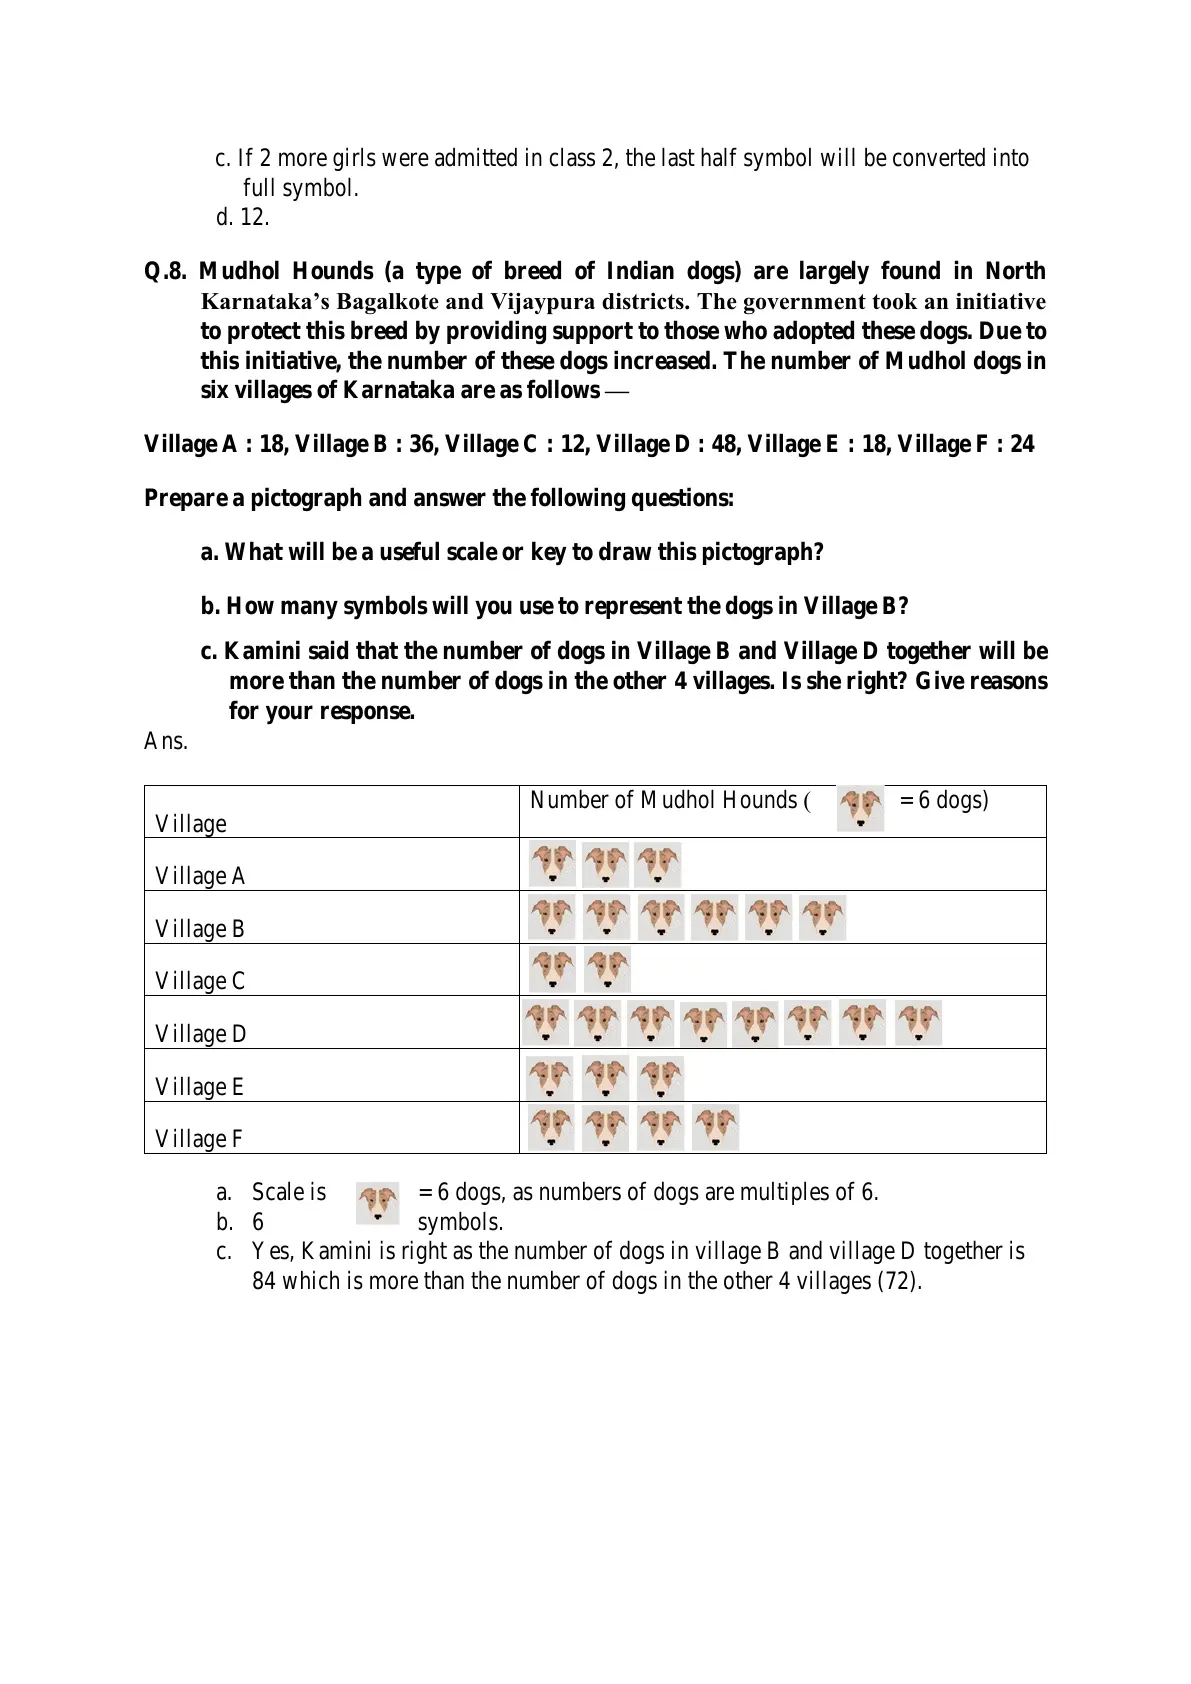
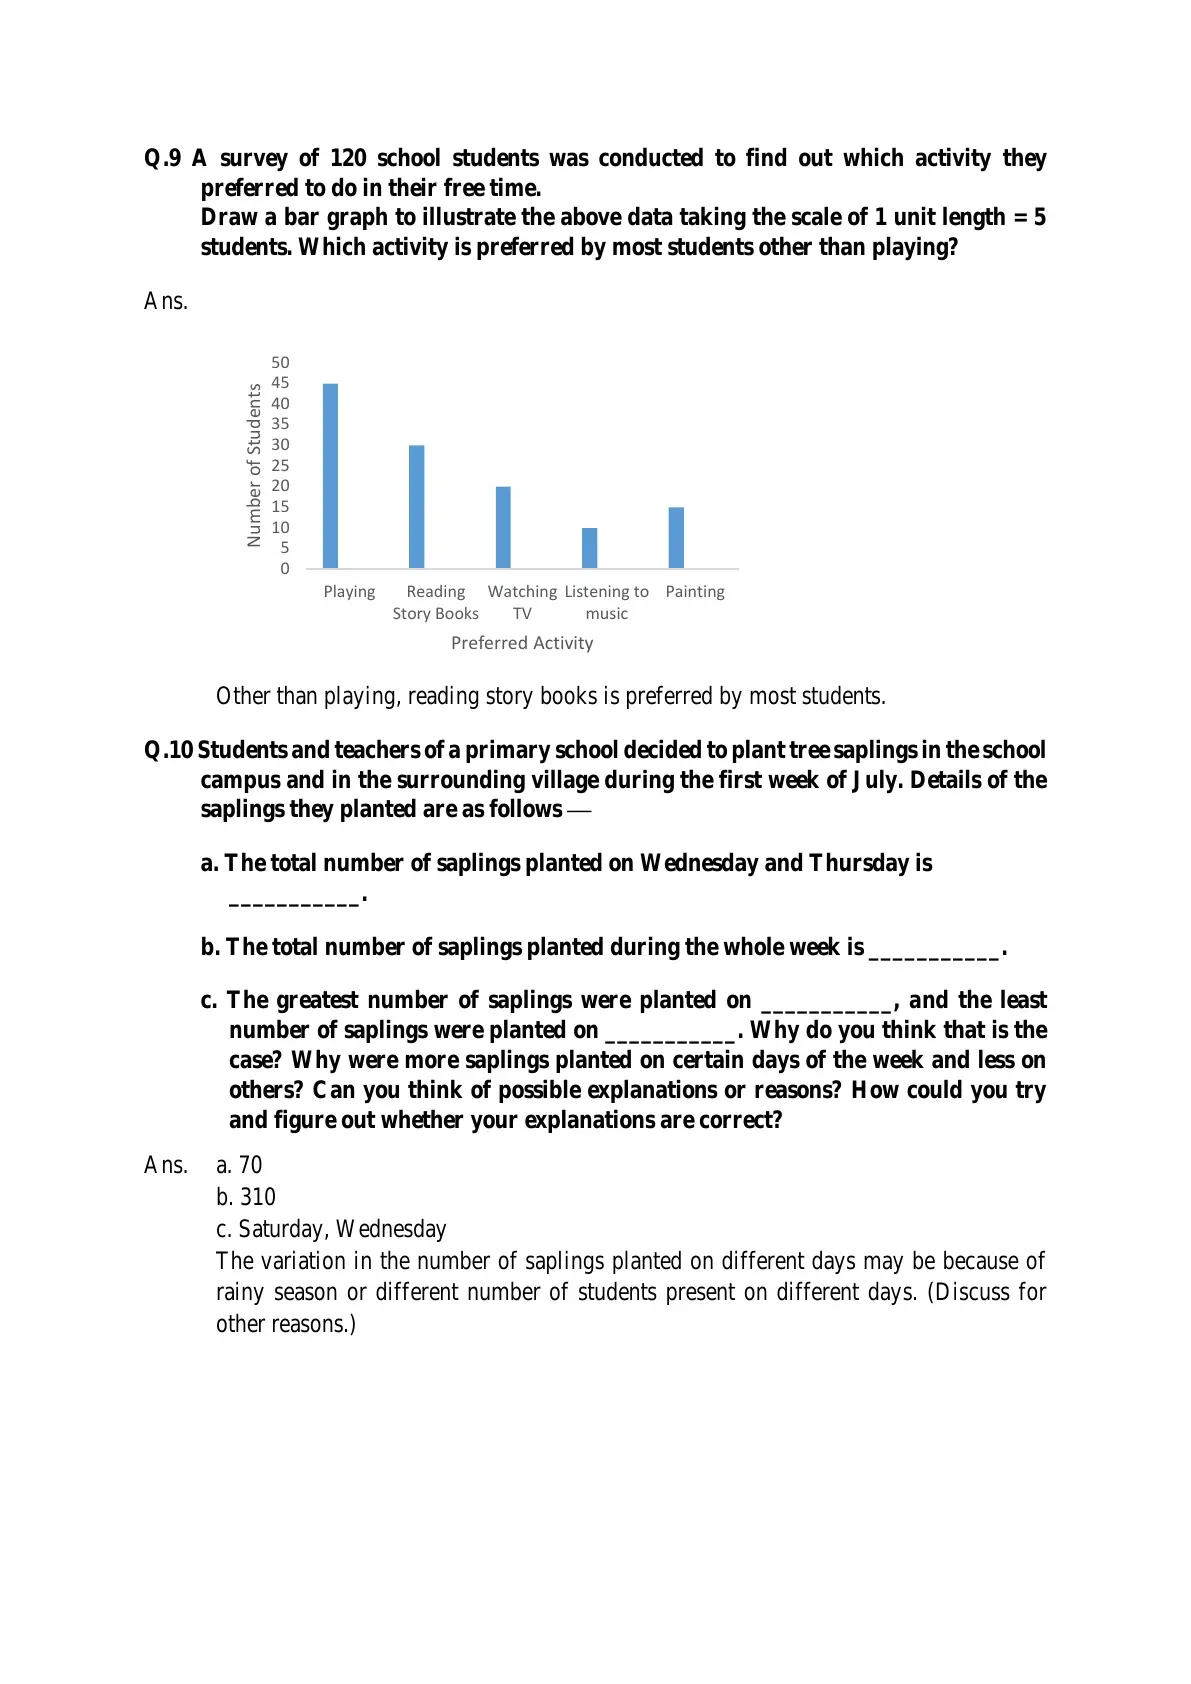
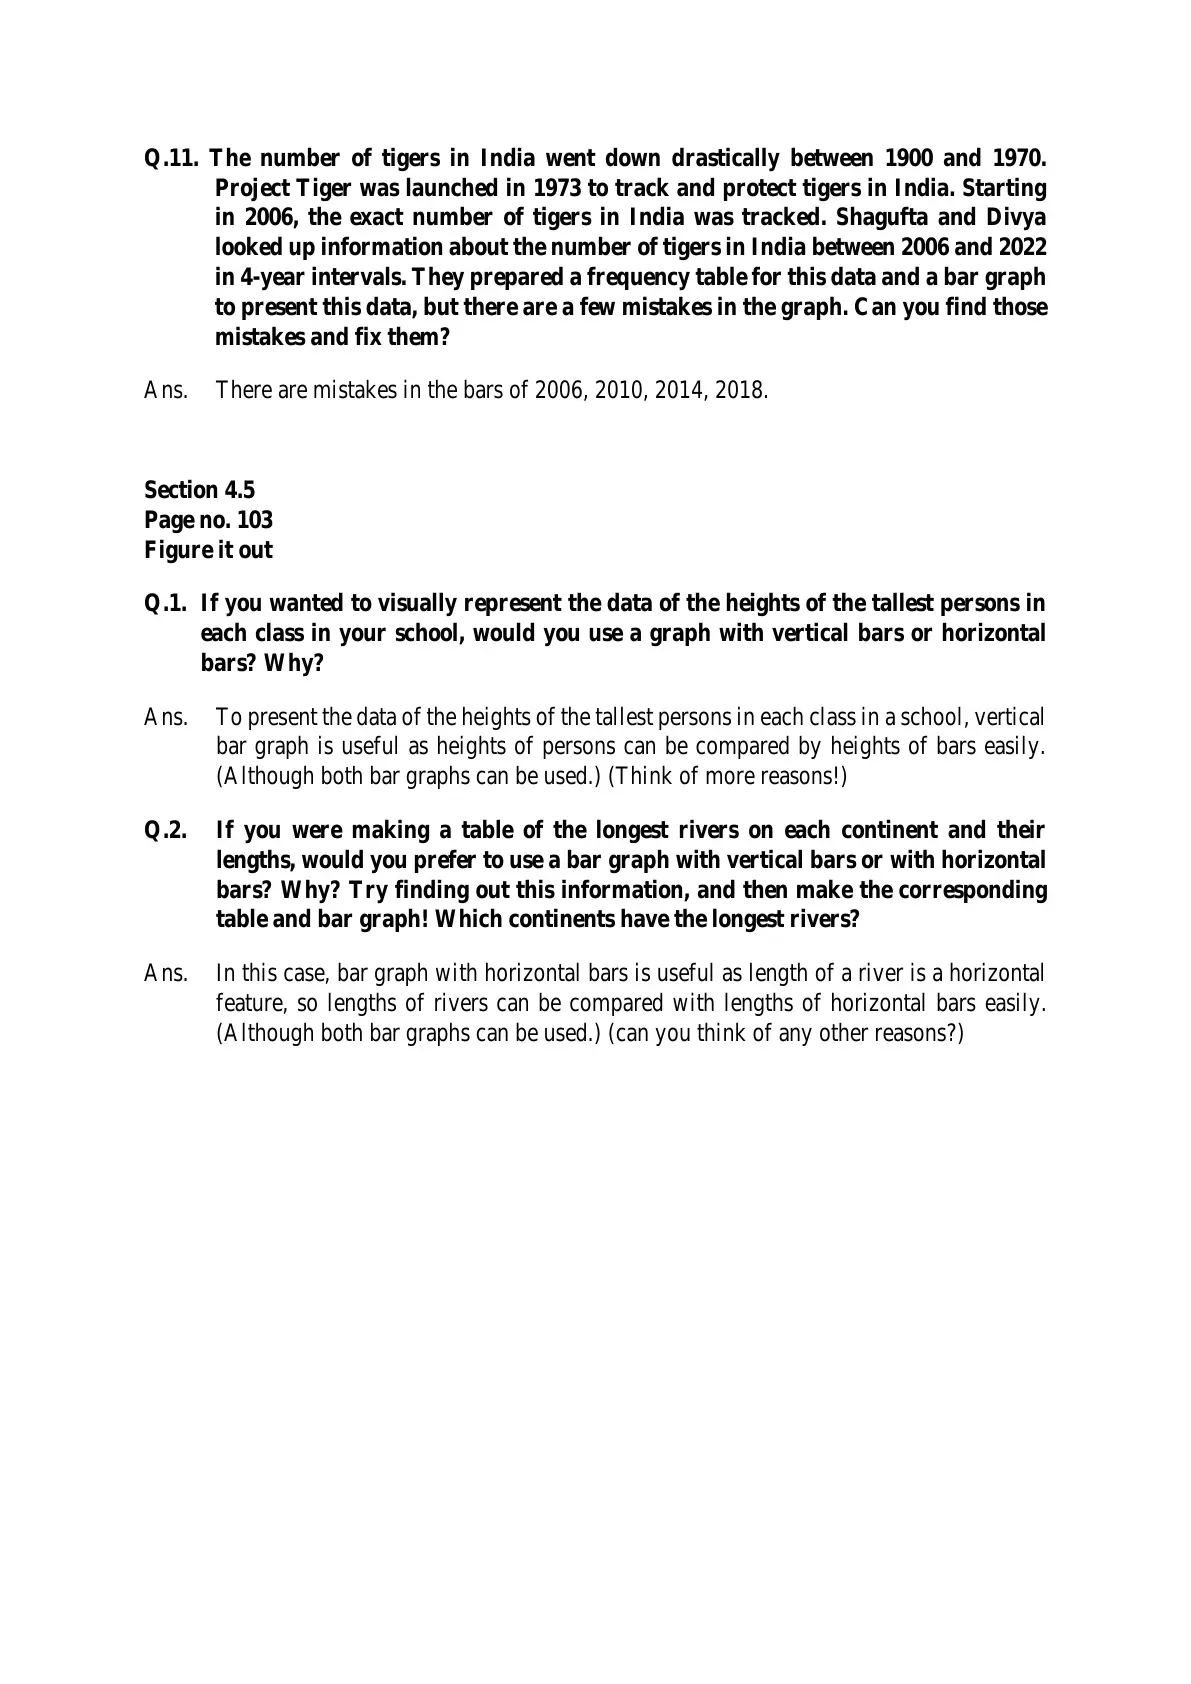
Student Feedback: In a Collegedunia study poll of 10,980 Class 6 students, most students said Chapter 4 became easier after they wrote raw data as tally marks before drawing any graph. Bar graphs helped them compare groups faster.
Source: 2026-27 Class 6 Mathematics student poll across CBSE schools.
This page hosts the official NCERT Ganita Prakash Chapter 4 PDF, so students can read the same Data Handling and Presentation chapter used in the 2026-27 classroom.
Data Handling and Presentation Chapter PDF for Class 6 Students
The Data Handling and Presentation chapter shows how numbers become useful only after they are organised. Students learn to ask a question, collect responses, count them carefully, and then choose a clear display.
The PDF is useful because every table, pictograph, and bar graph task stays in the official NCERT order. Students can match classroom page numbers with the same chapter shown here.
- Early pages show how to collect and classify data.
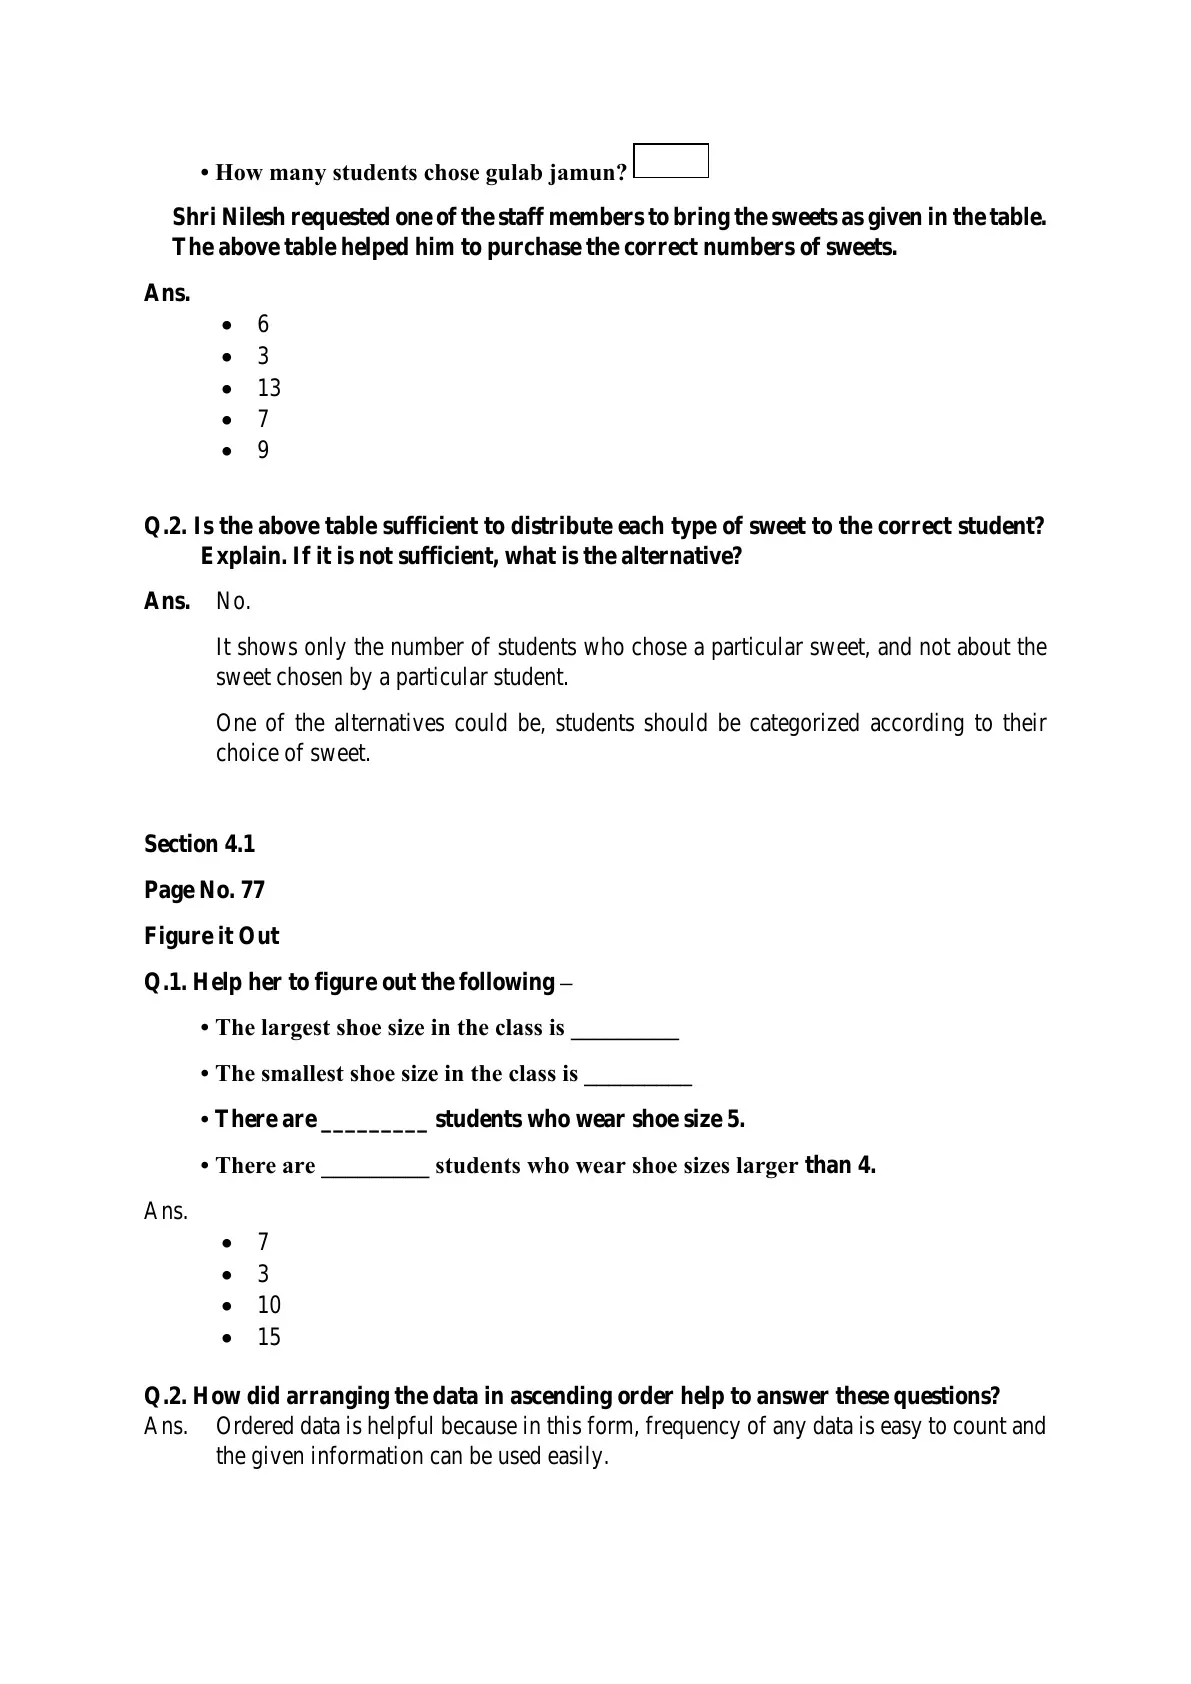
- Middle pages use tally marks and frequency tables.
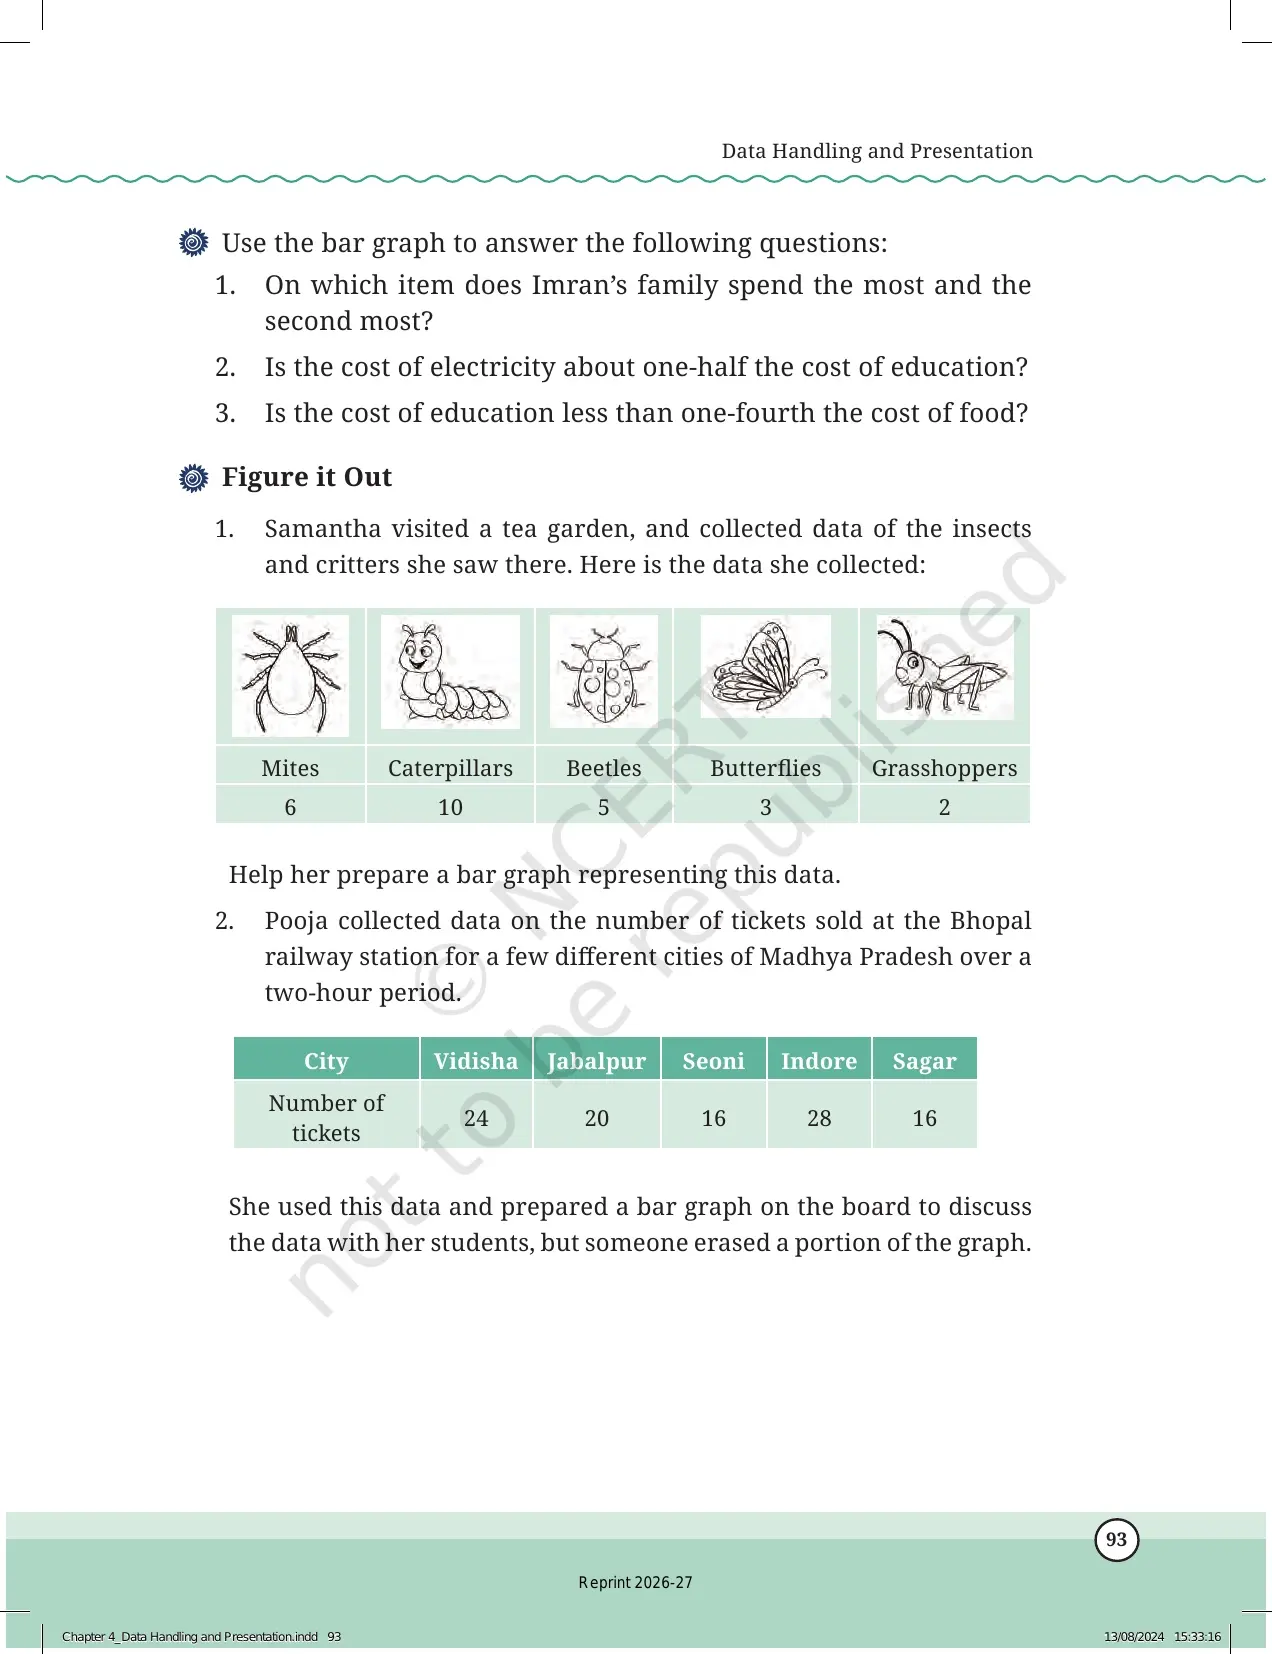
- Later pages compare pictographs, bar graphs, and interpretation questions.
Data Handling Class 6 Graphs Video Recap
Source: Magnet Brains on YouTube
Data Collection and Tally Tables in Chapter 4
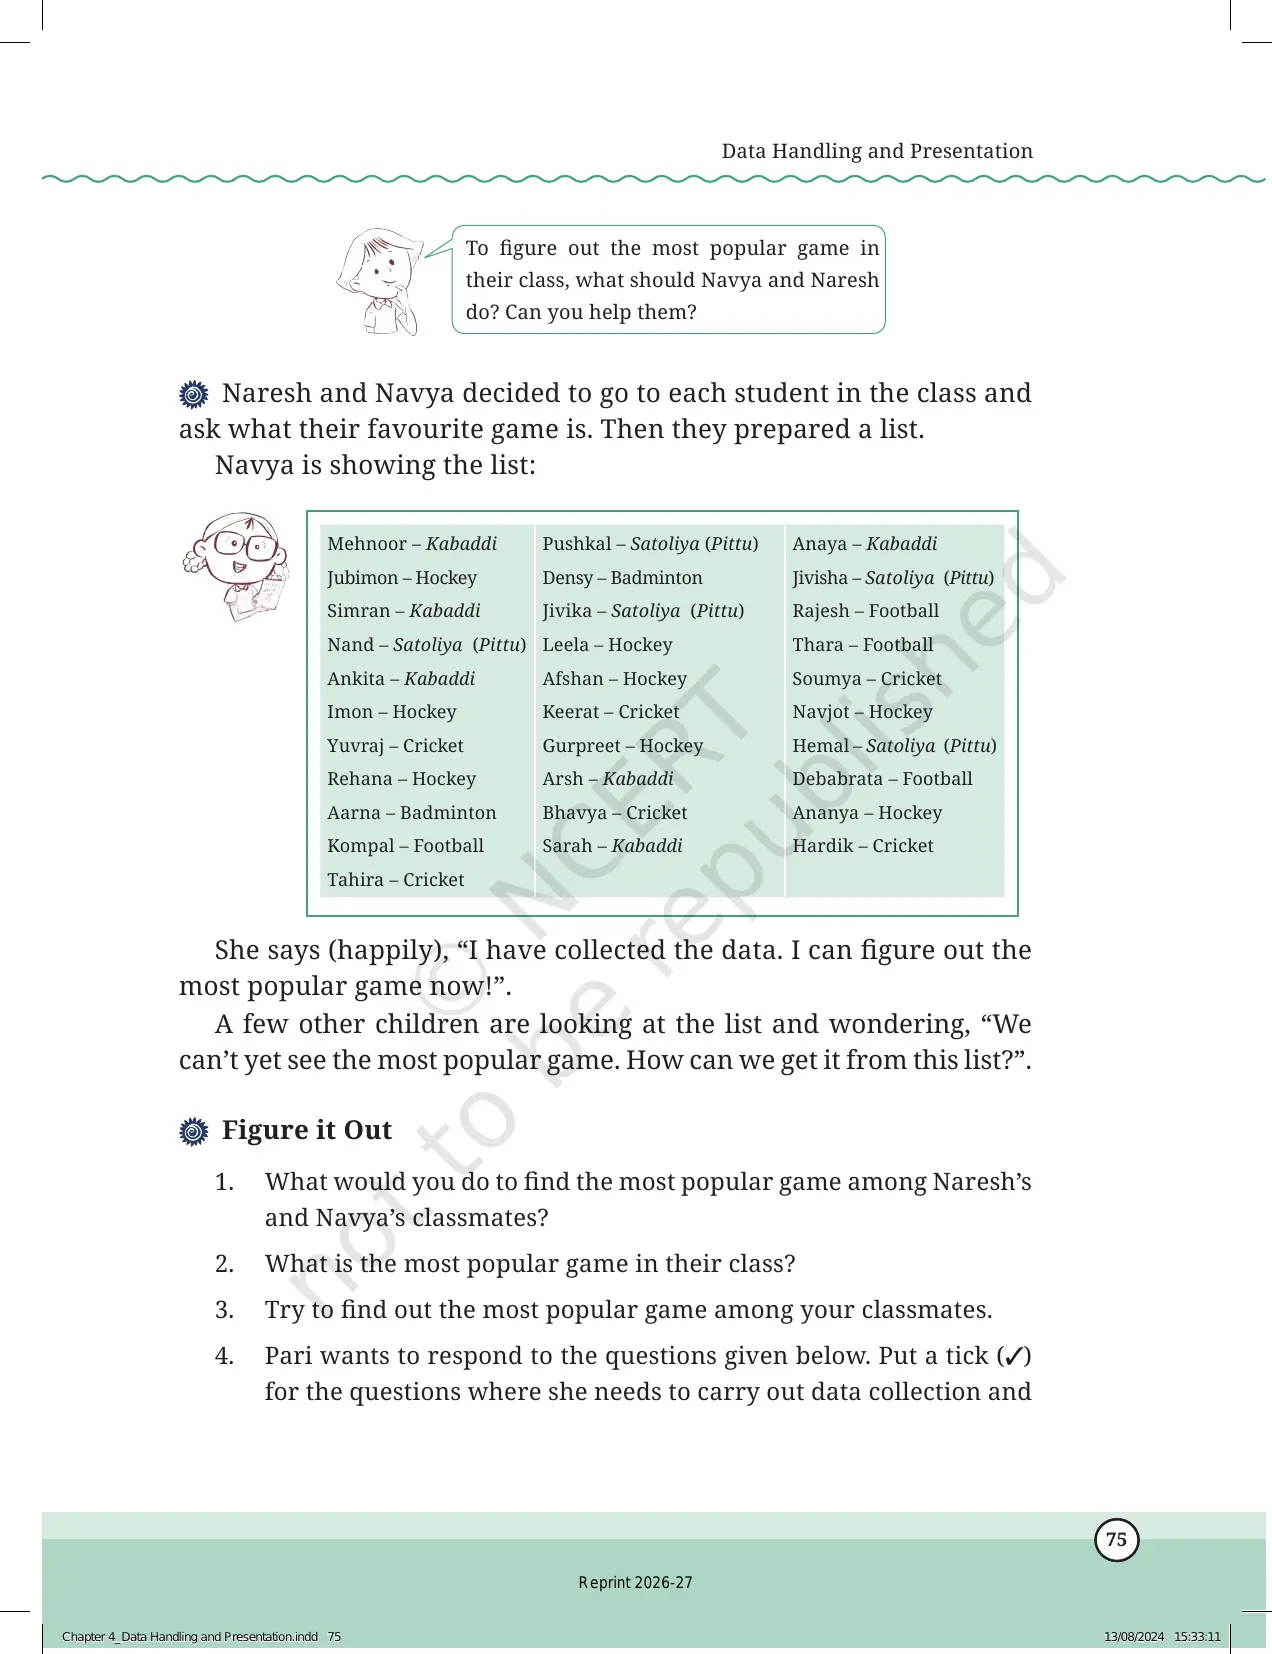
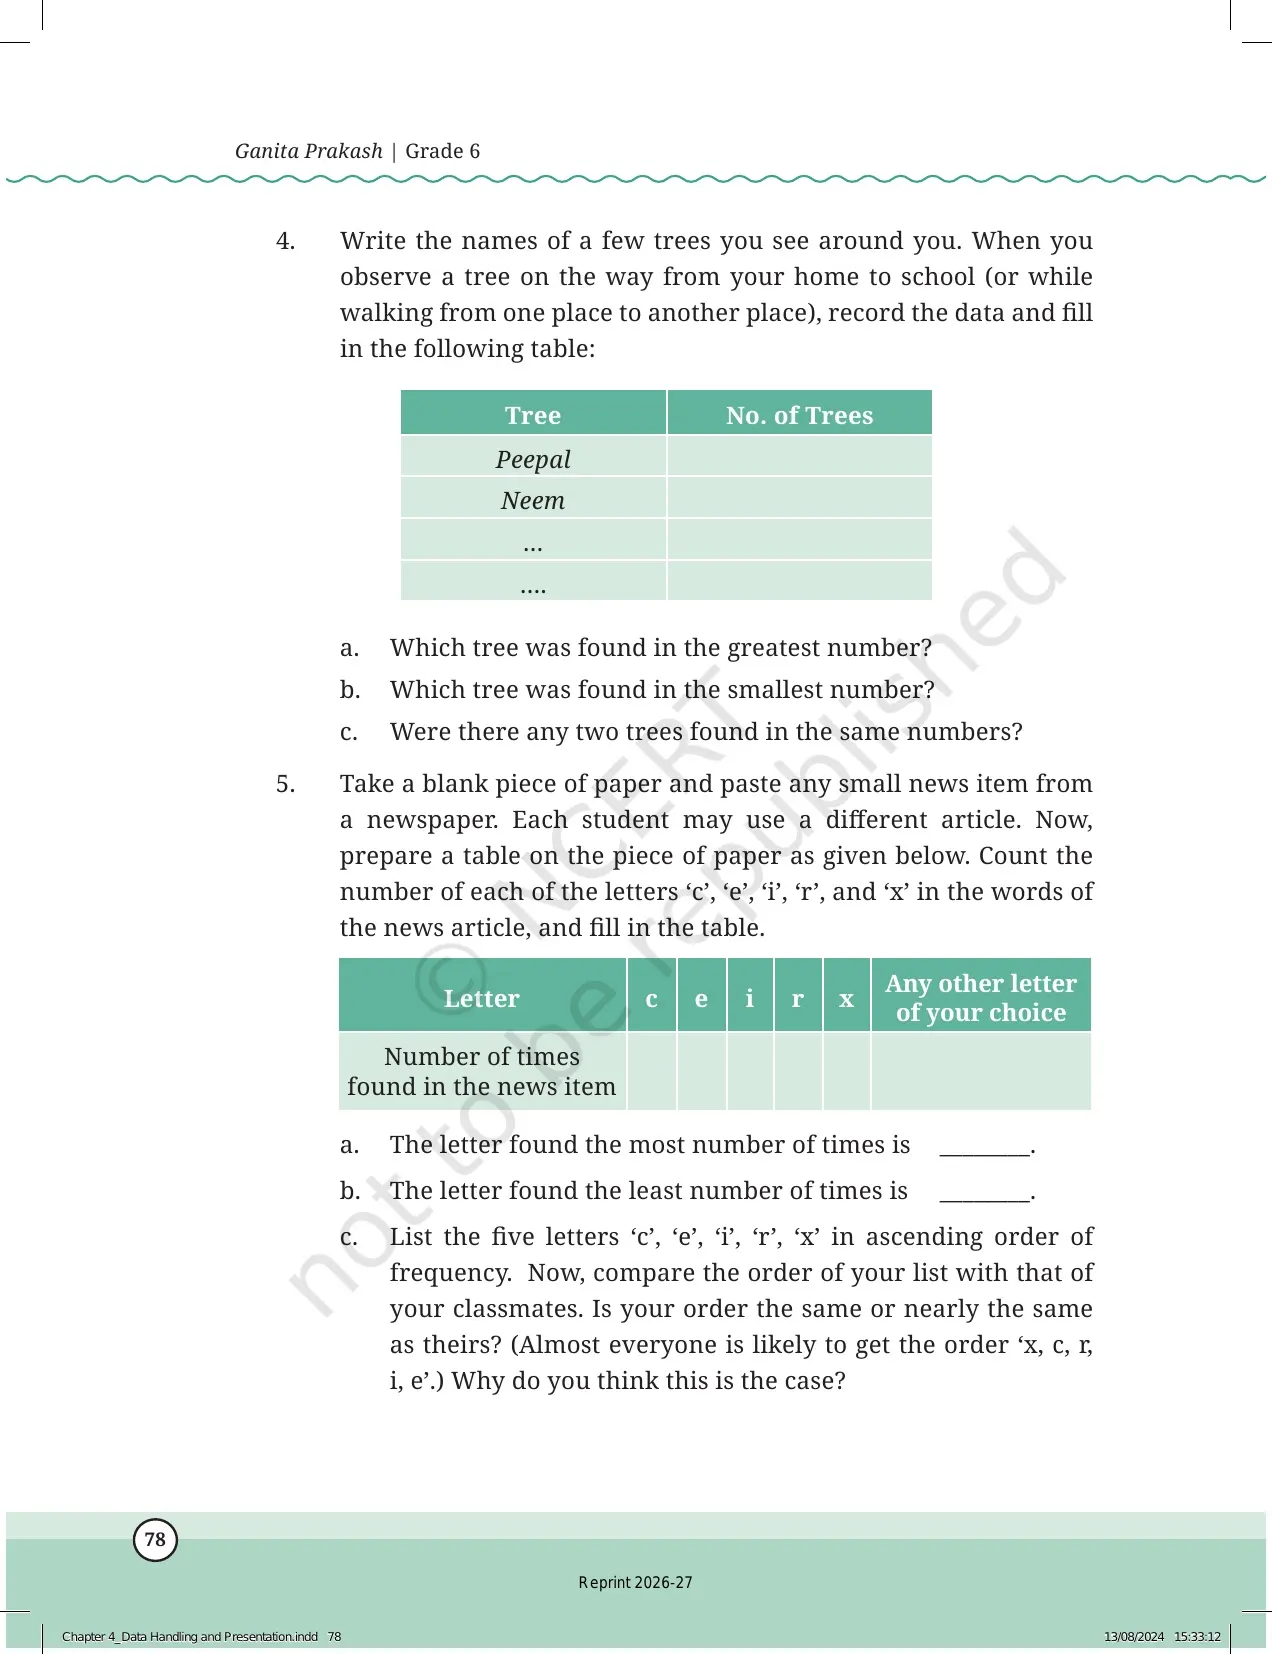
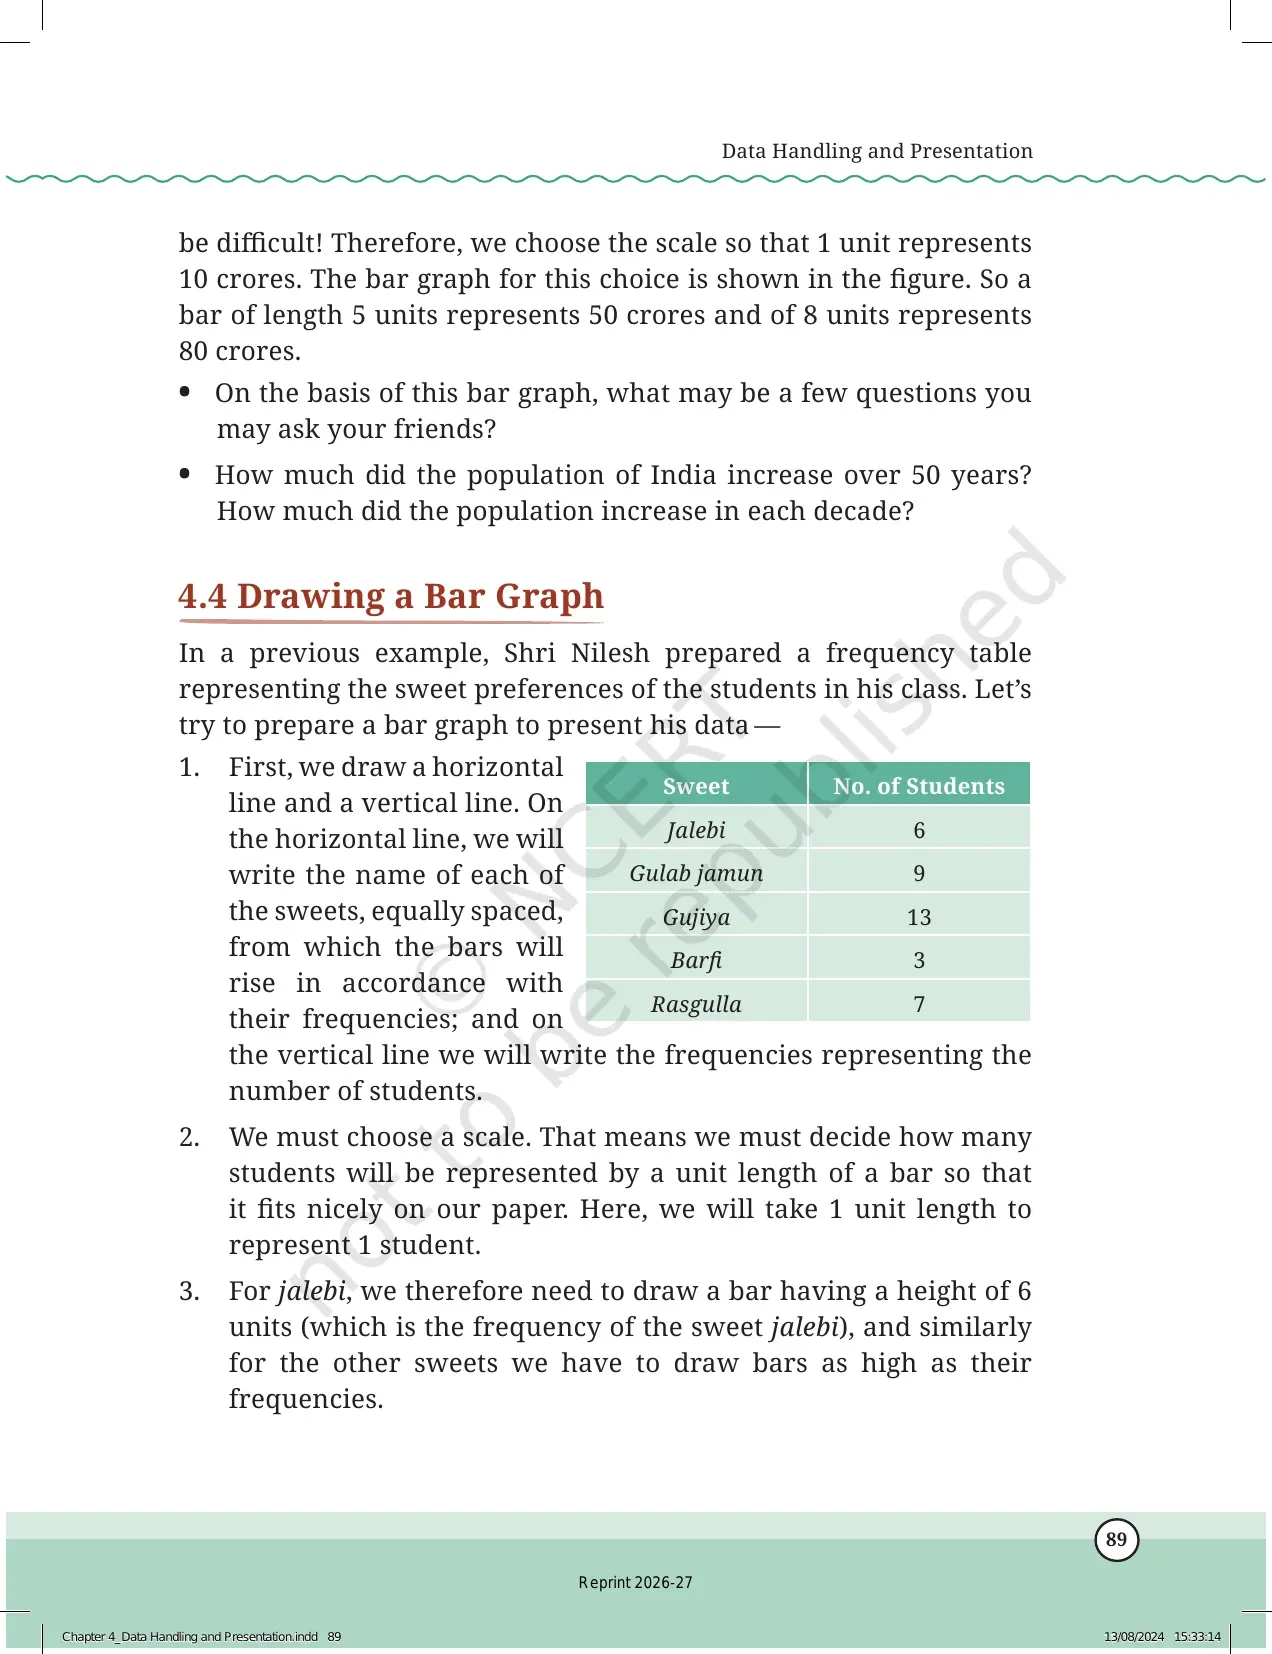
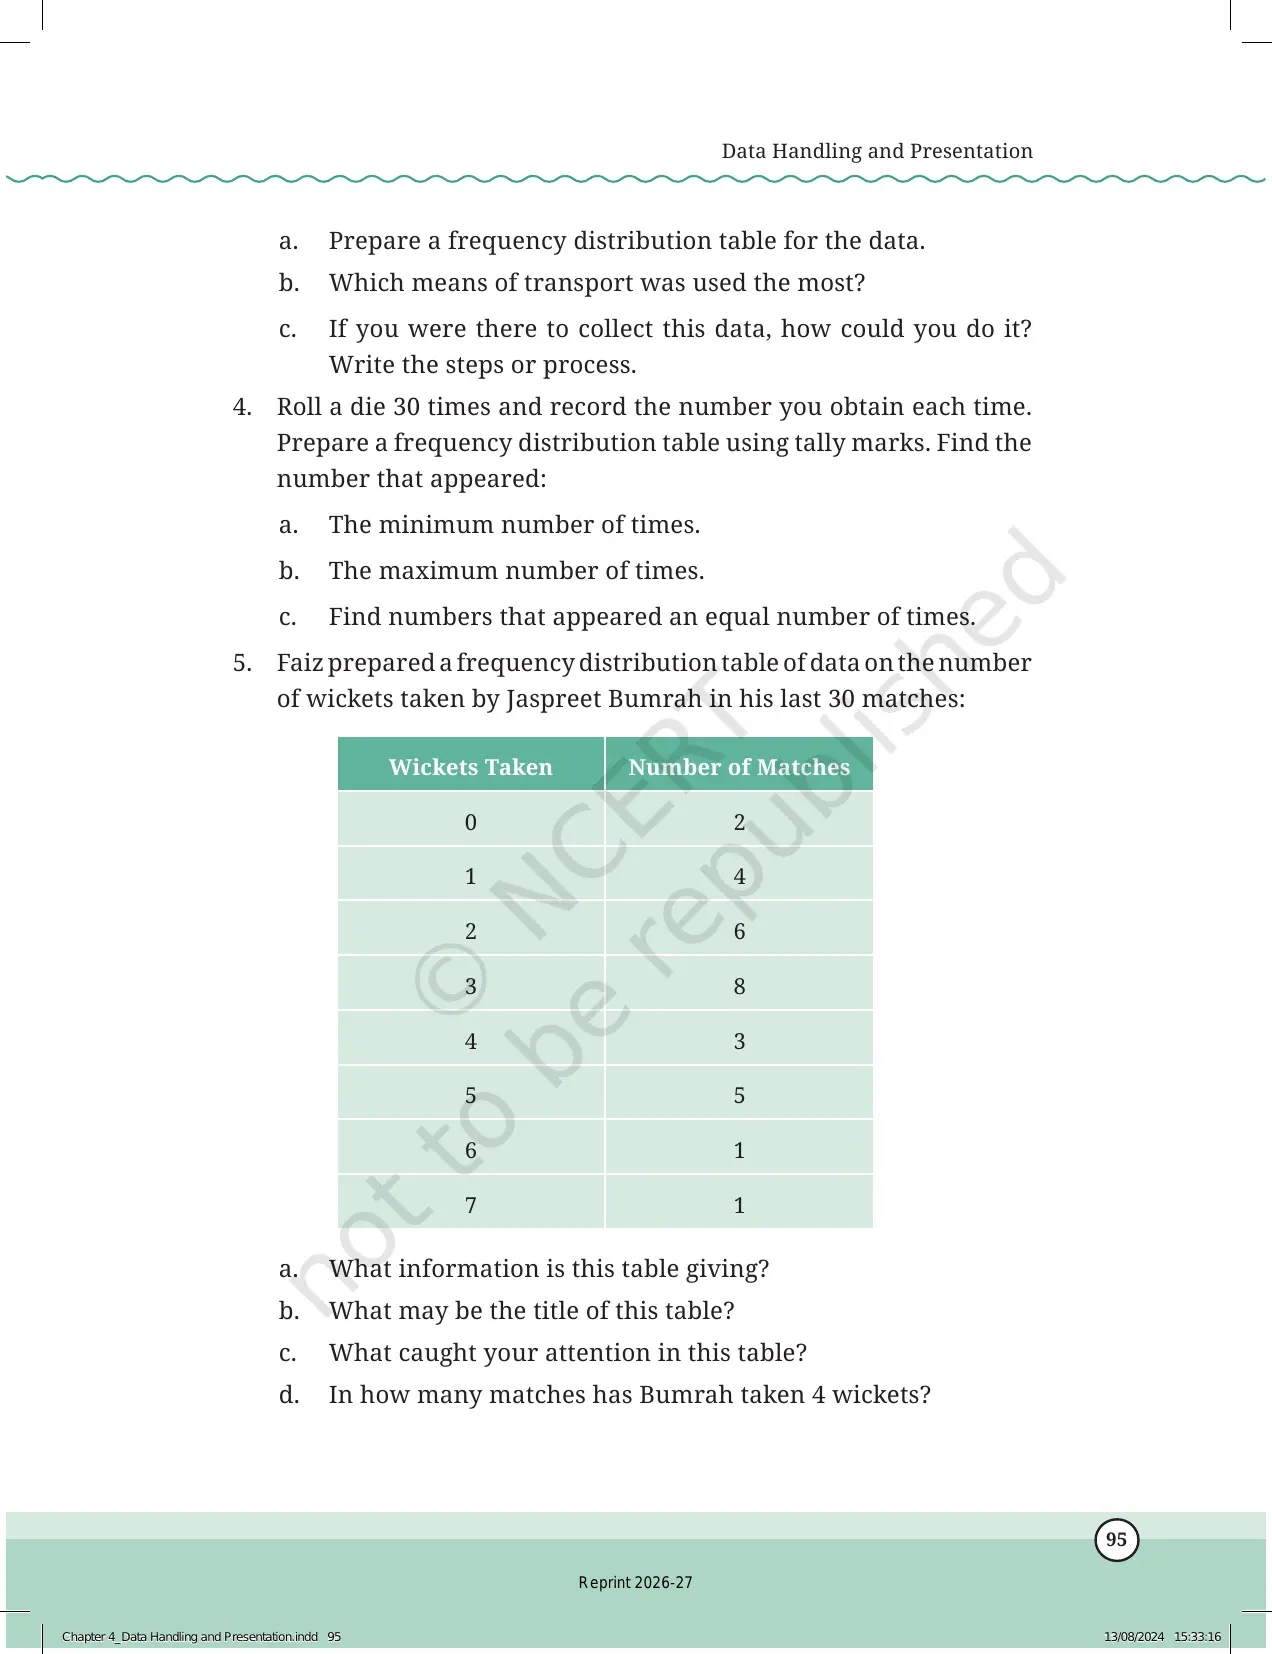
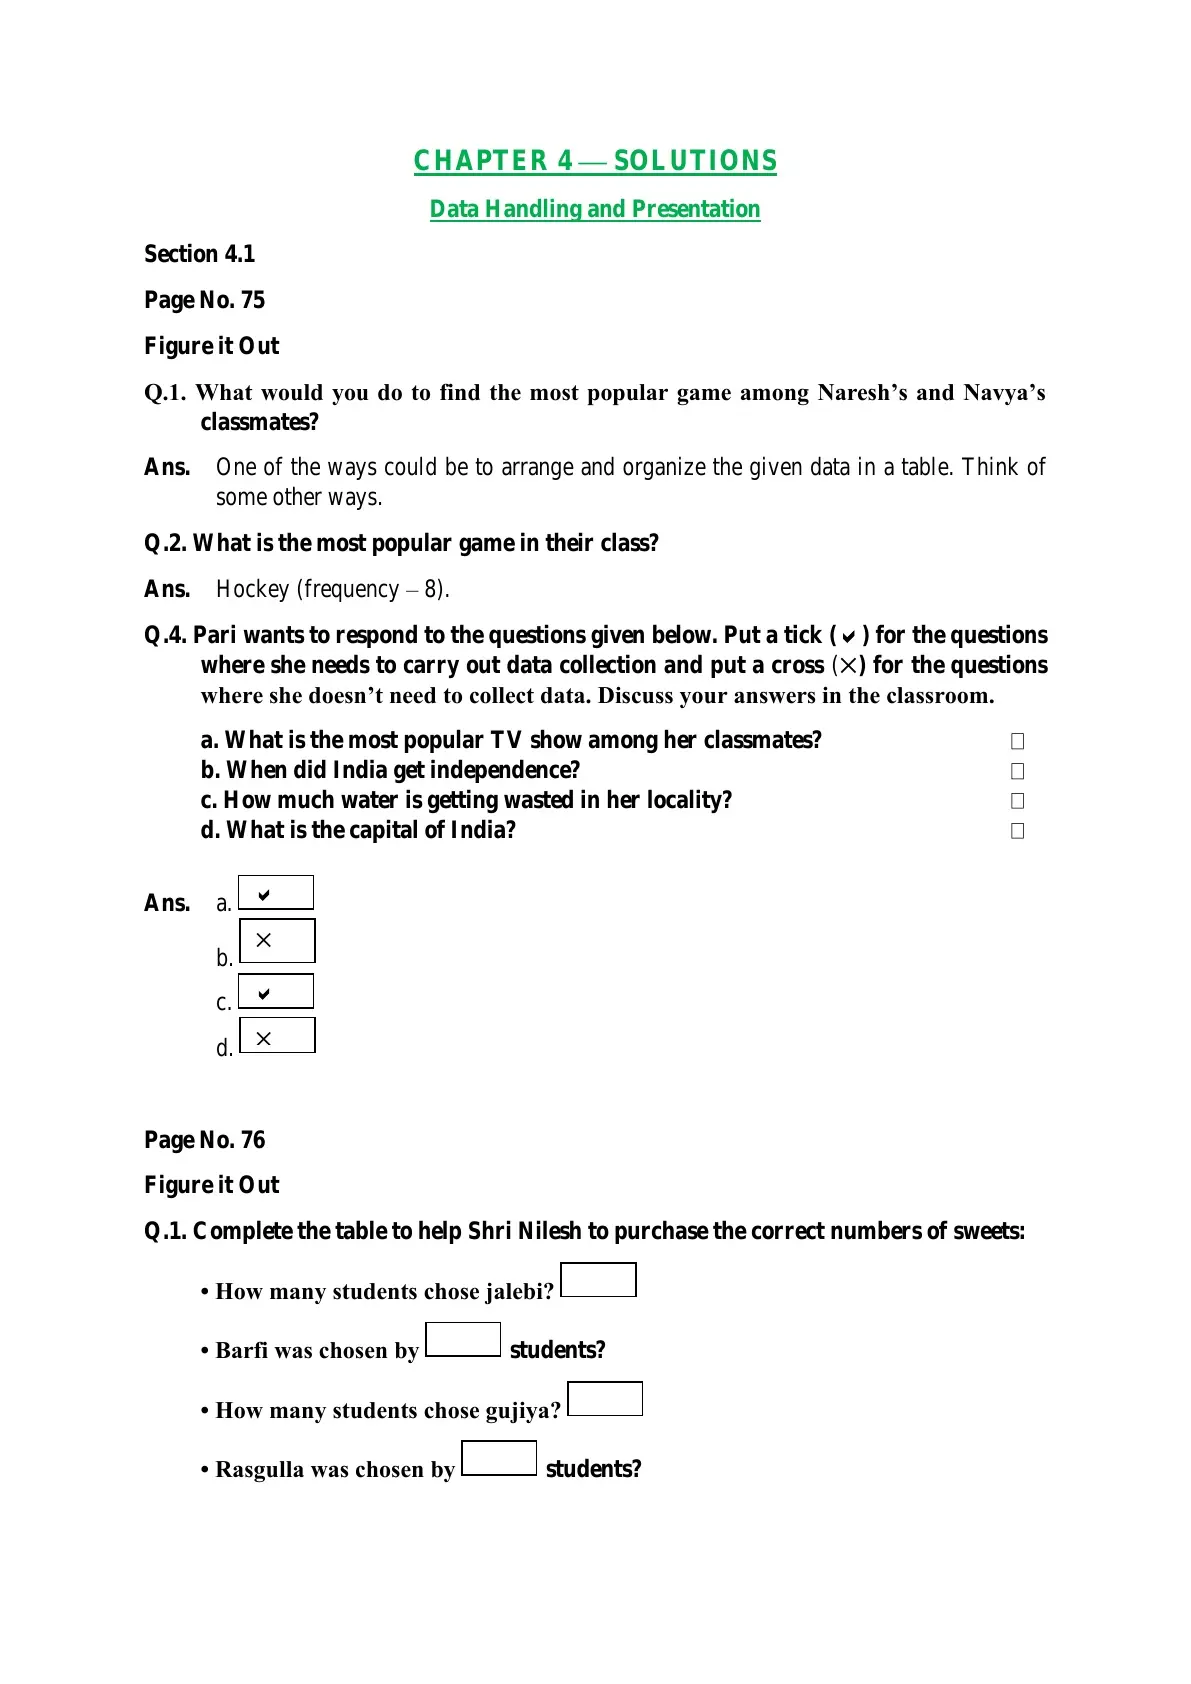
Chapter 4 starts with a simple idea: data should answer a question. A student may ask which fruit, game, transport, or colour is most common in a group. The answers are then counted with tally marks.
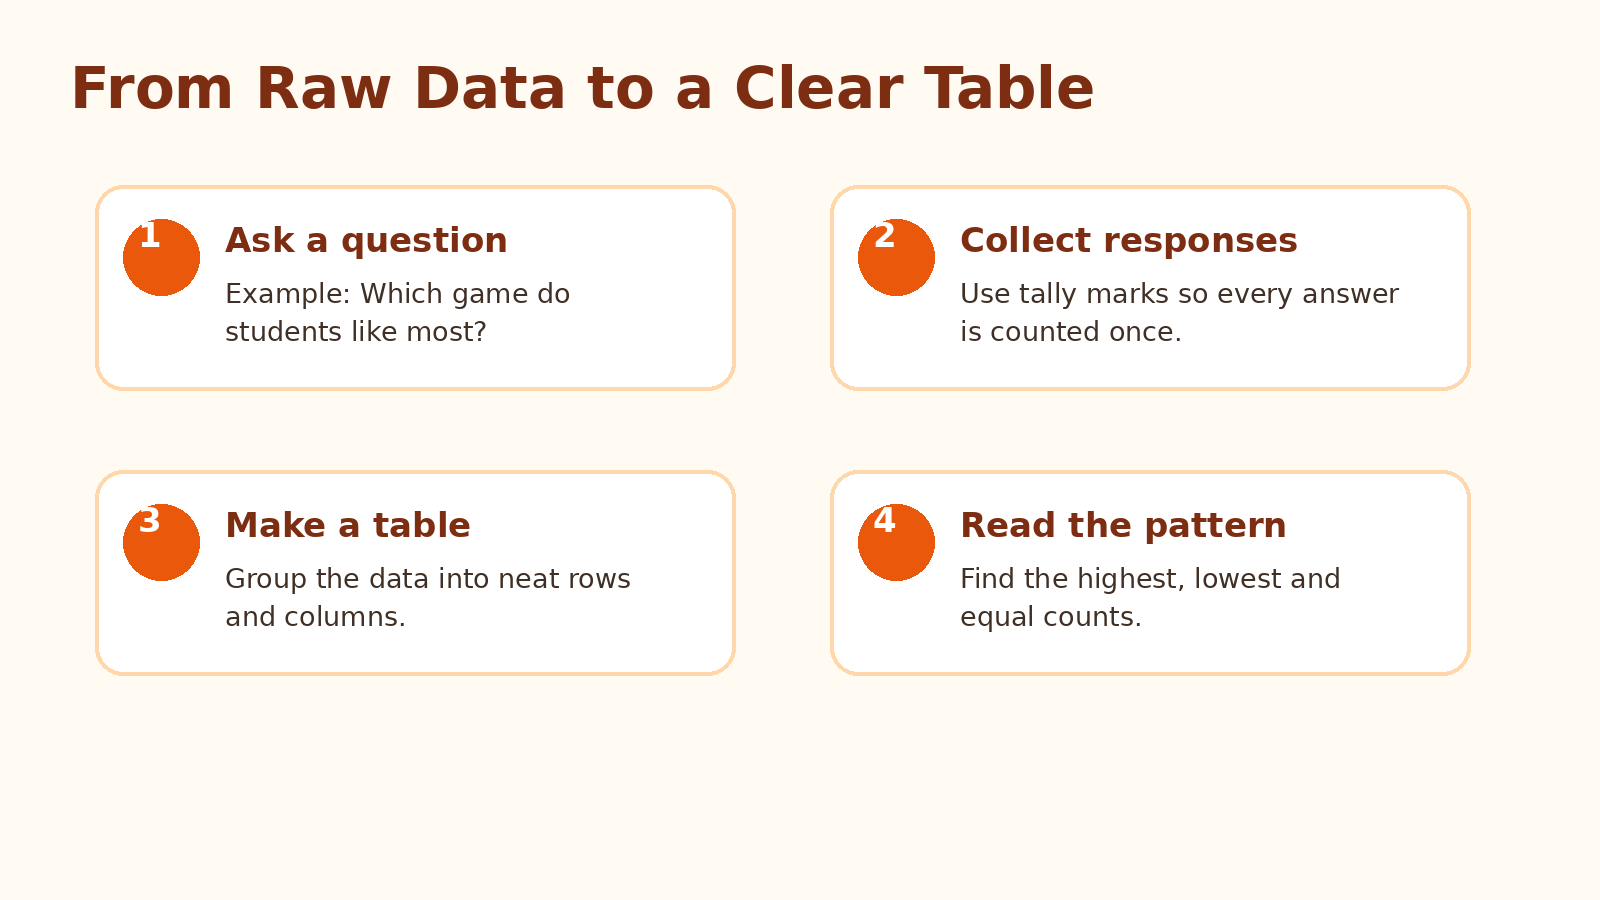
| Task Type | What Students Do | Math Skill Built |
|---|---|---|
| Survey question | Decide what information has to be collected. | Planning and clarity. |
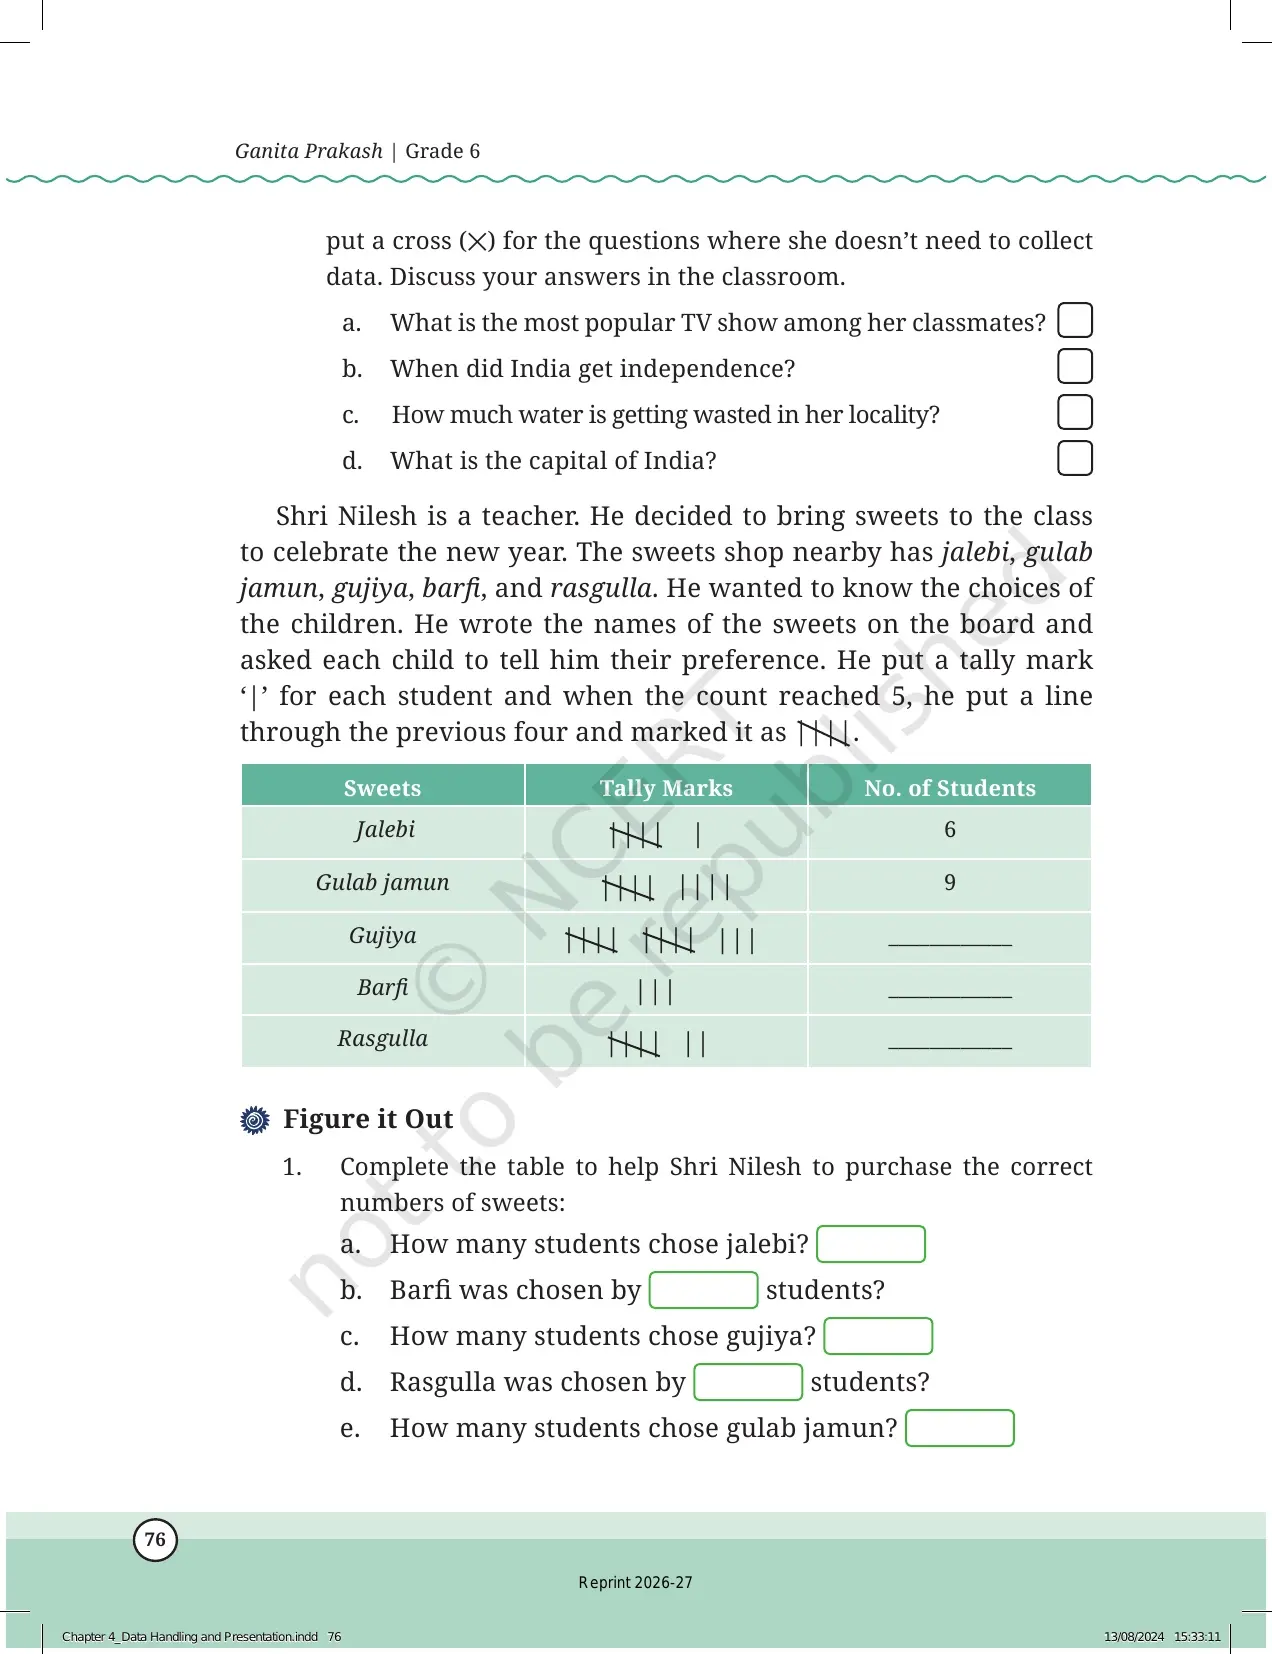
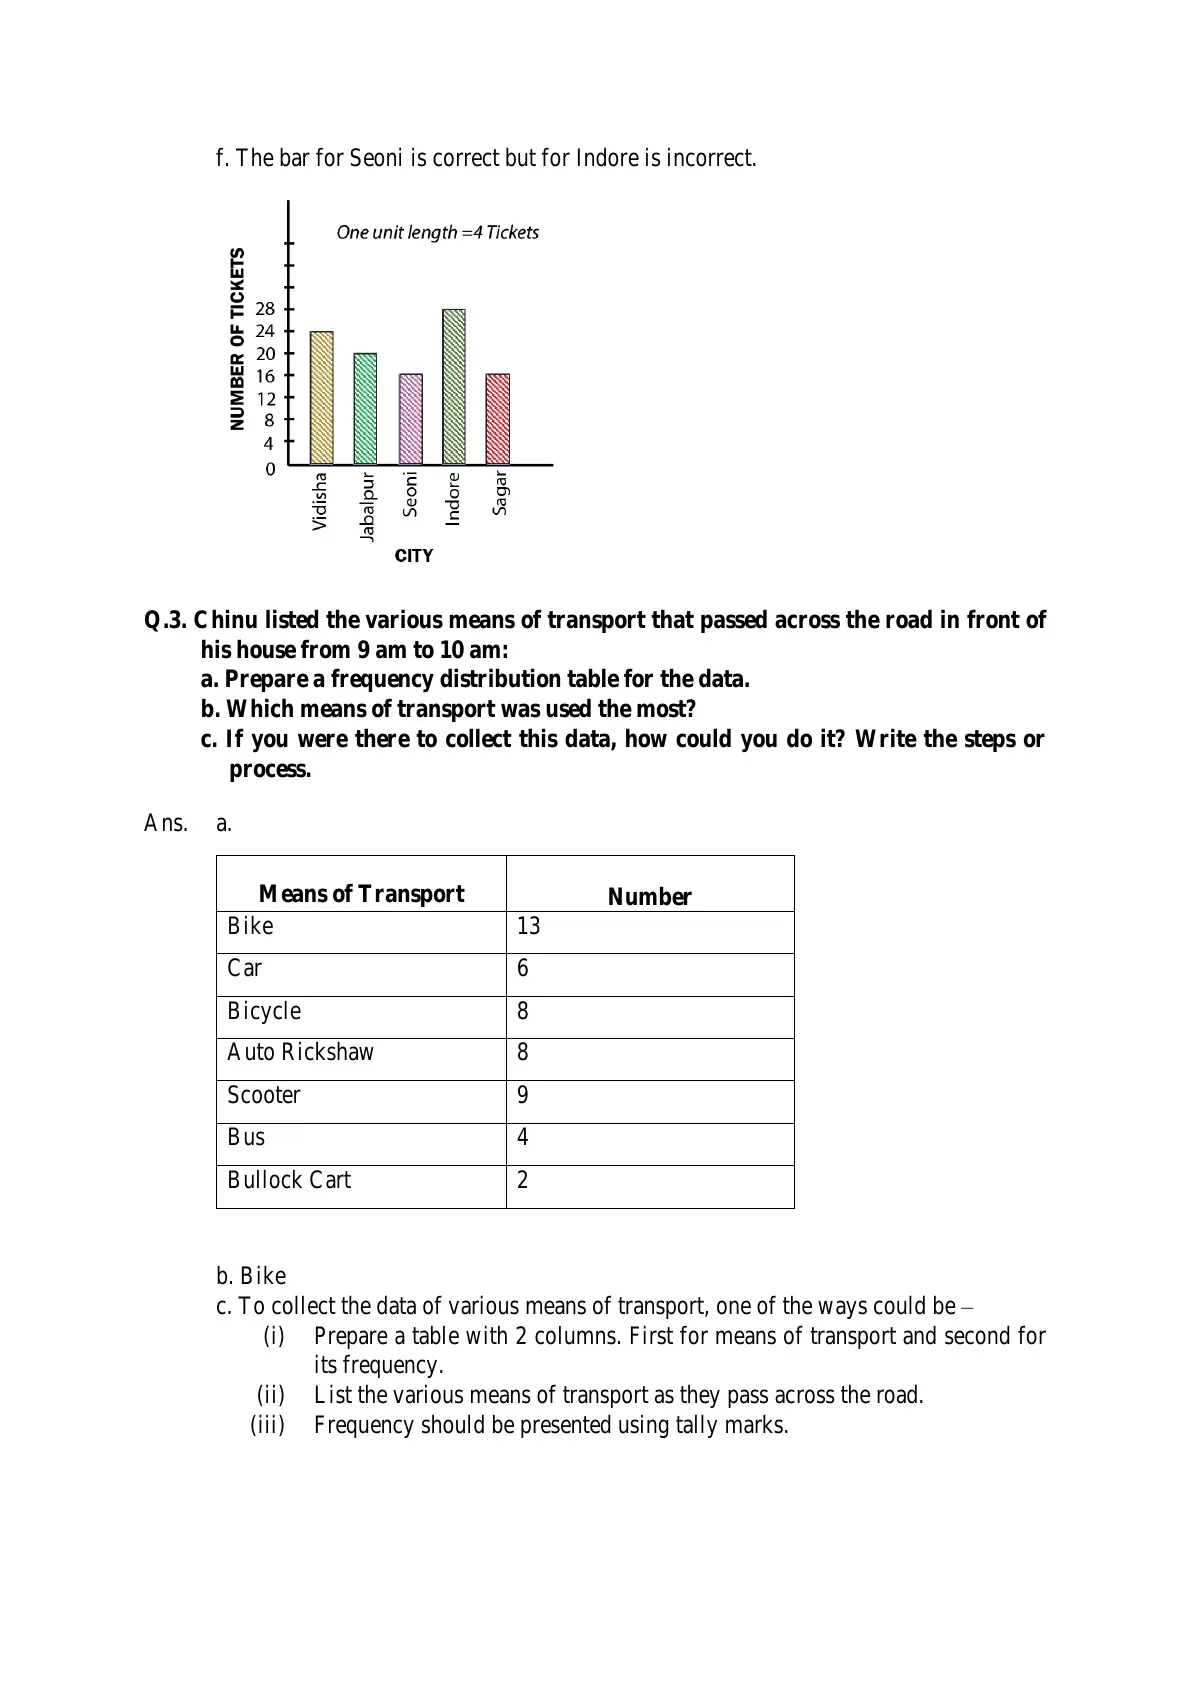
| Tally marks | Record every response once, usually in groups of five. | Counting without missing data. |
| Frequency table | Convert tally marks into numbers. | Organisation and comparison. |
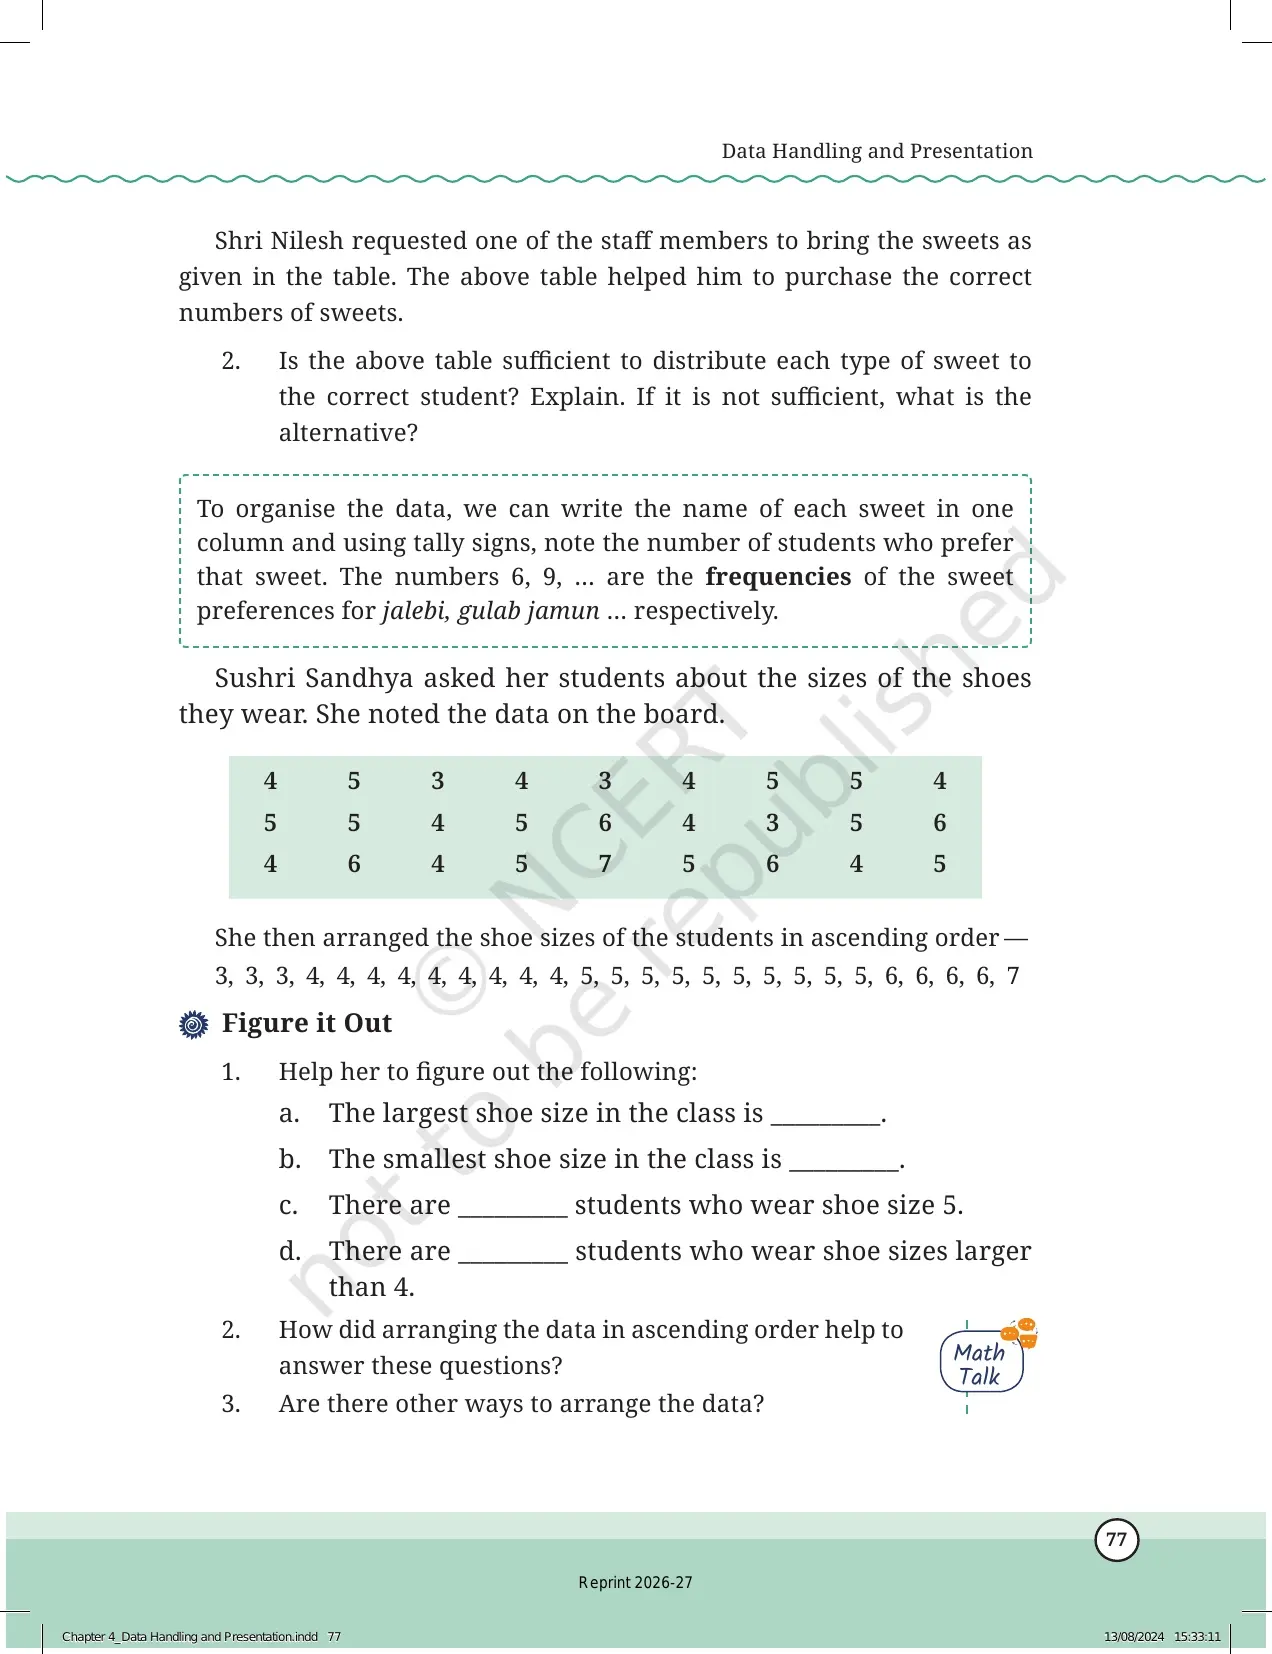
| Interpretation | Find the most, least, difference, and total. | Reasoning from data. |
Pictographs and Bar Graphs in Data Handling and Presentation
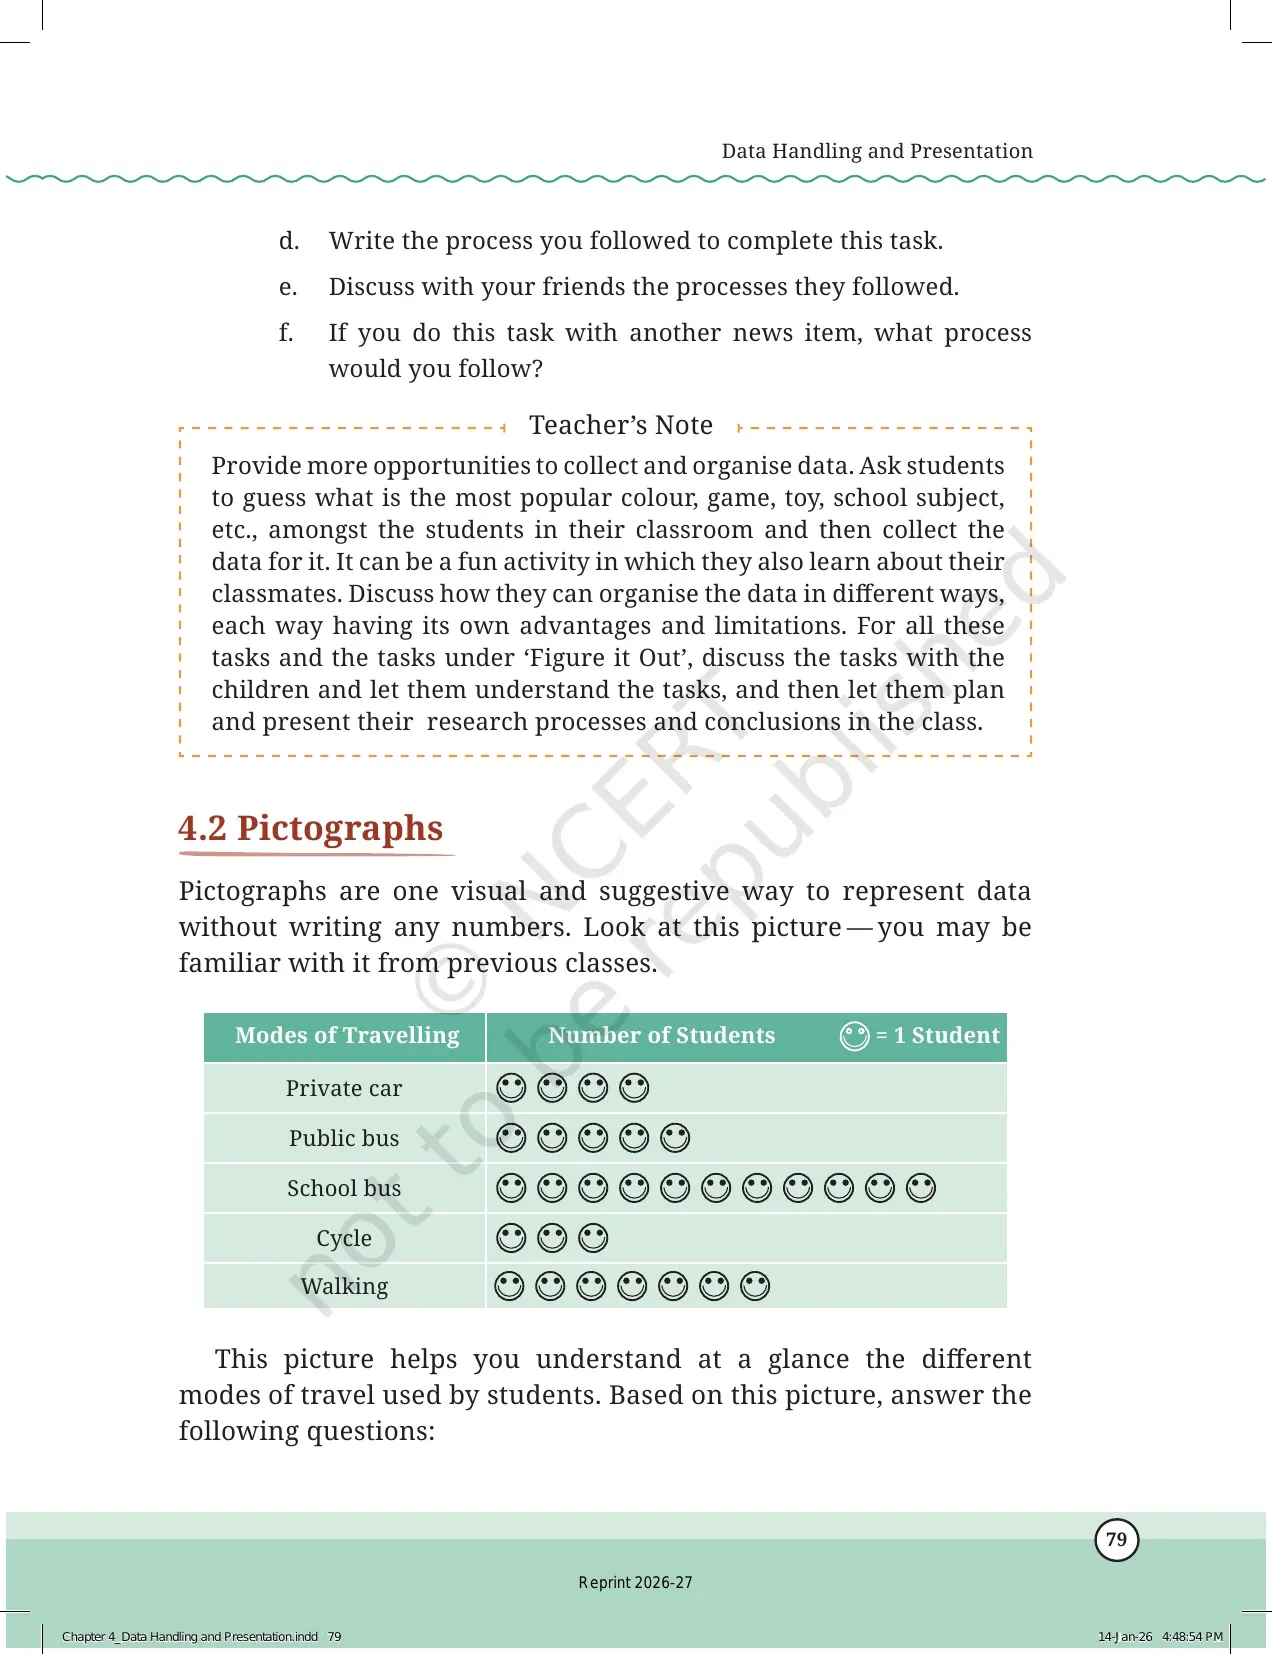
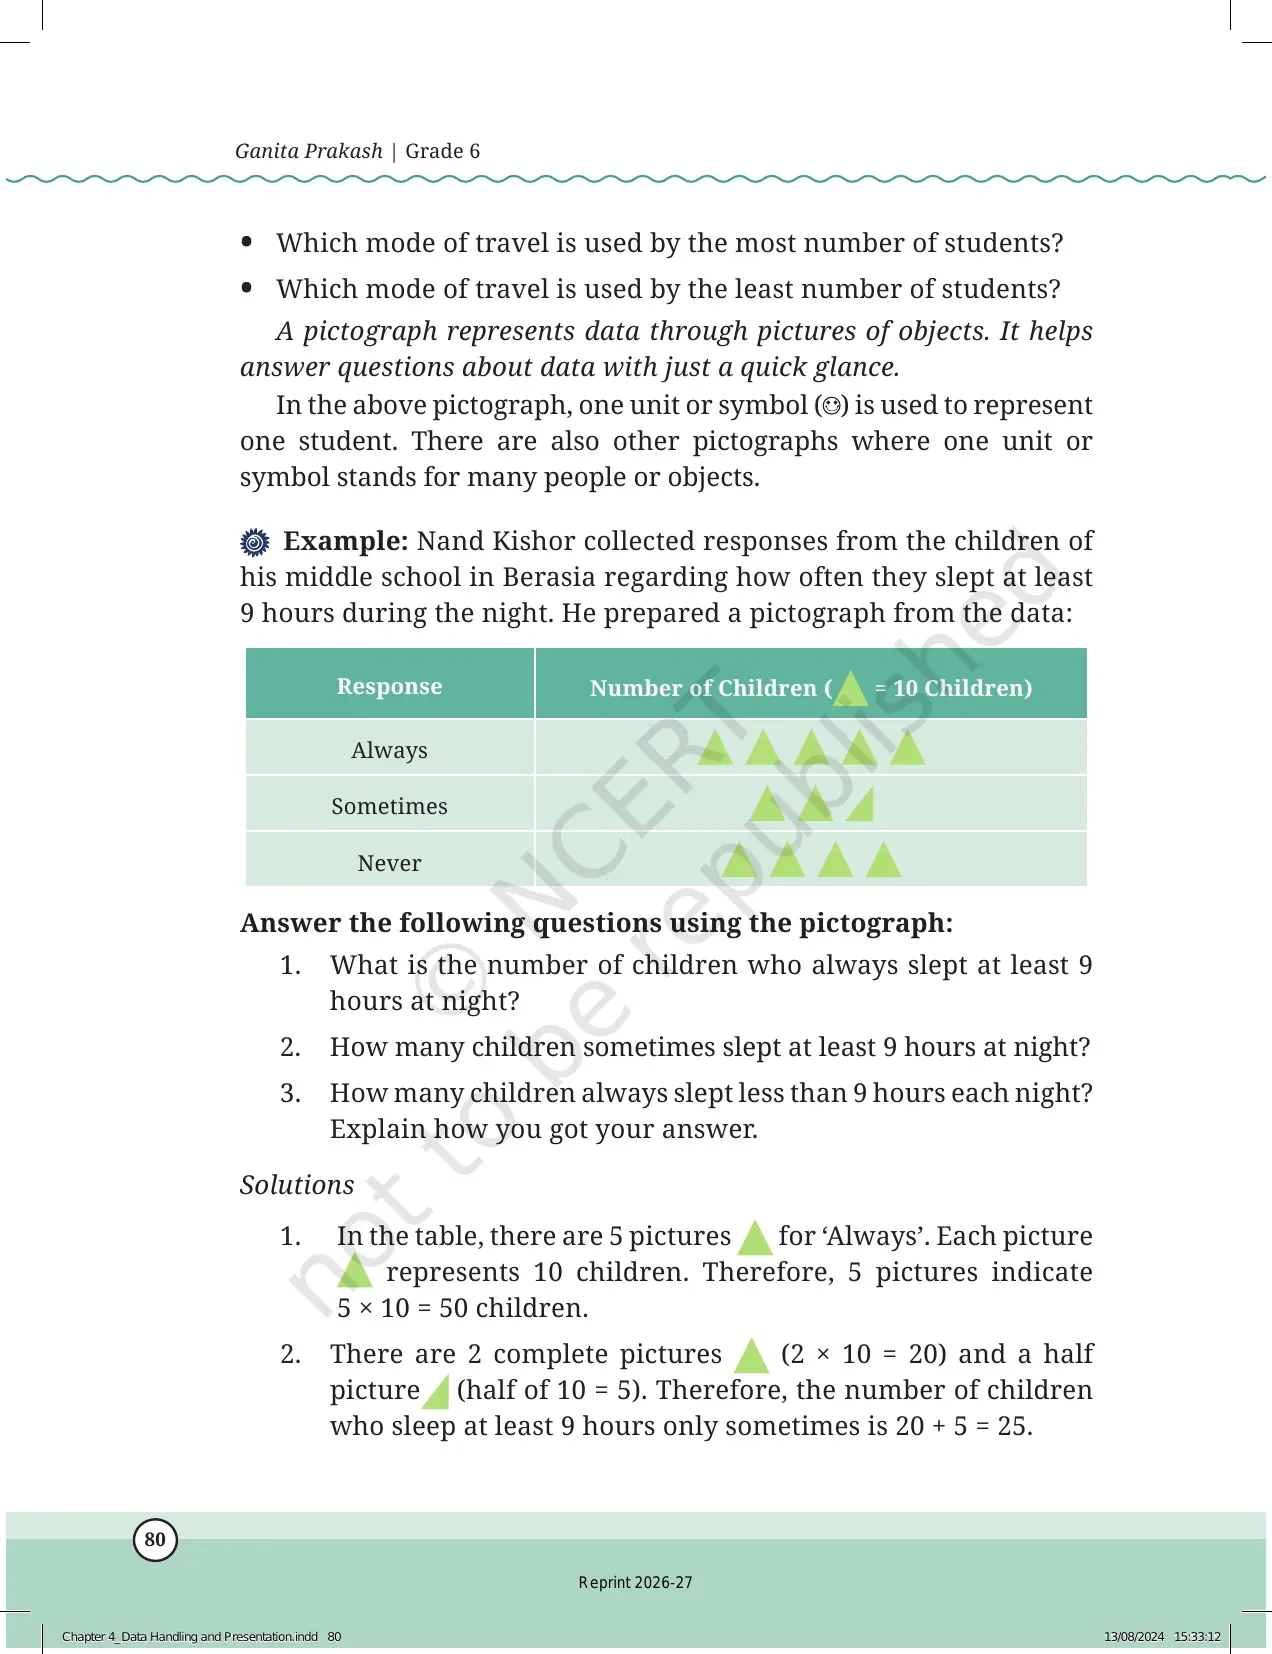
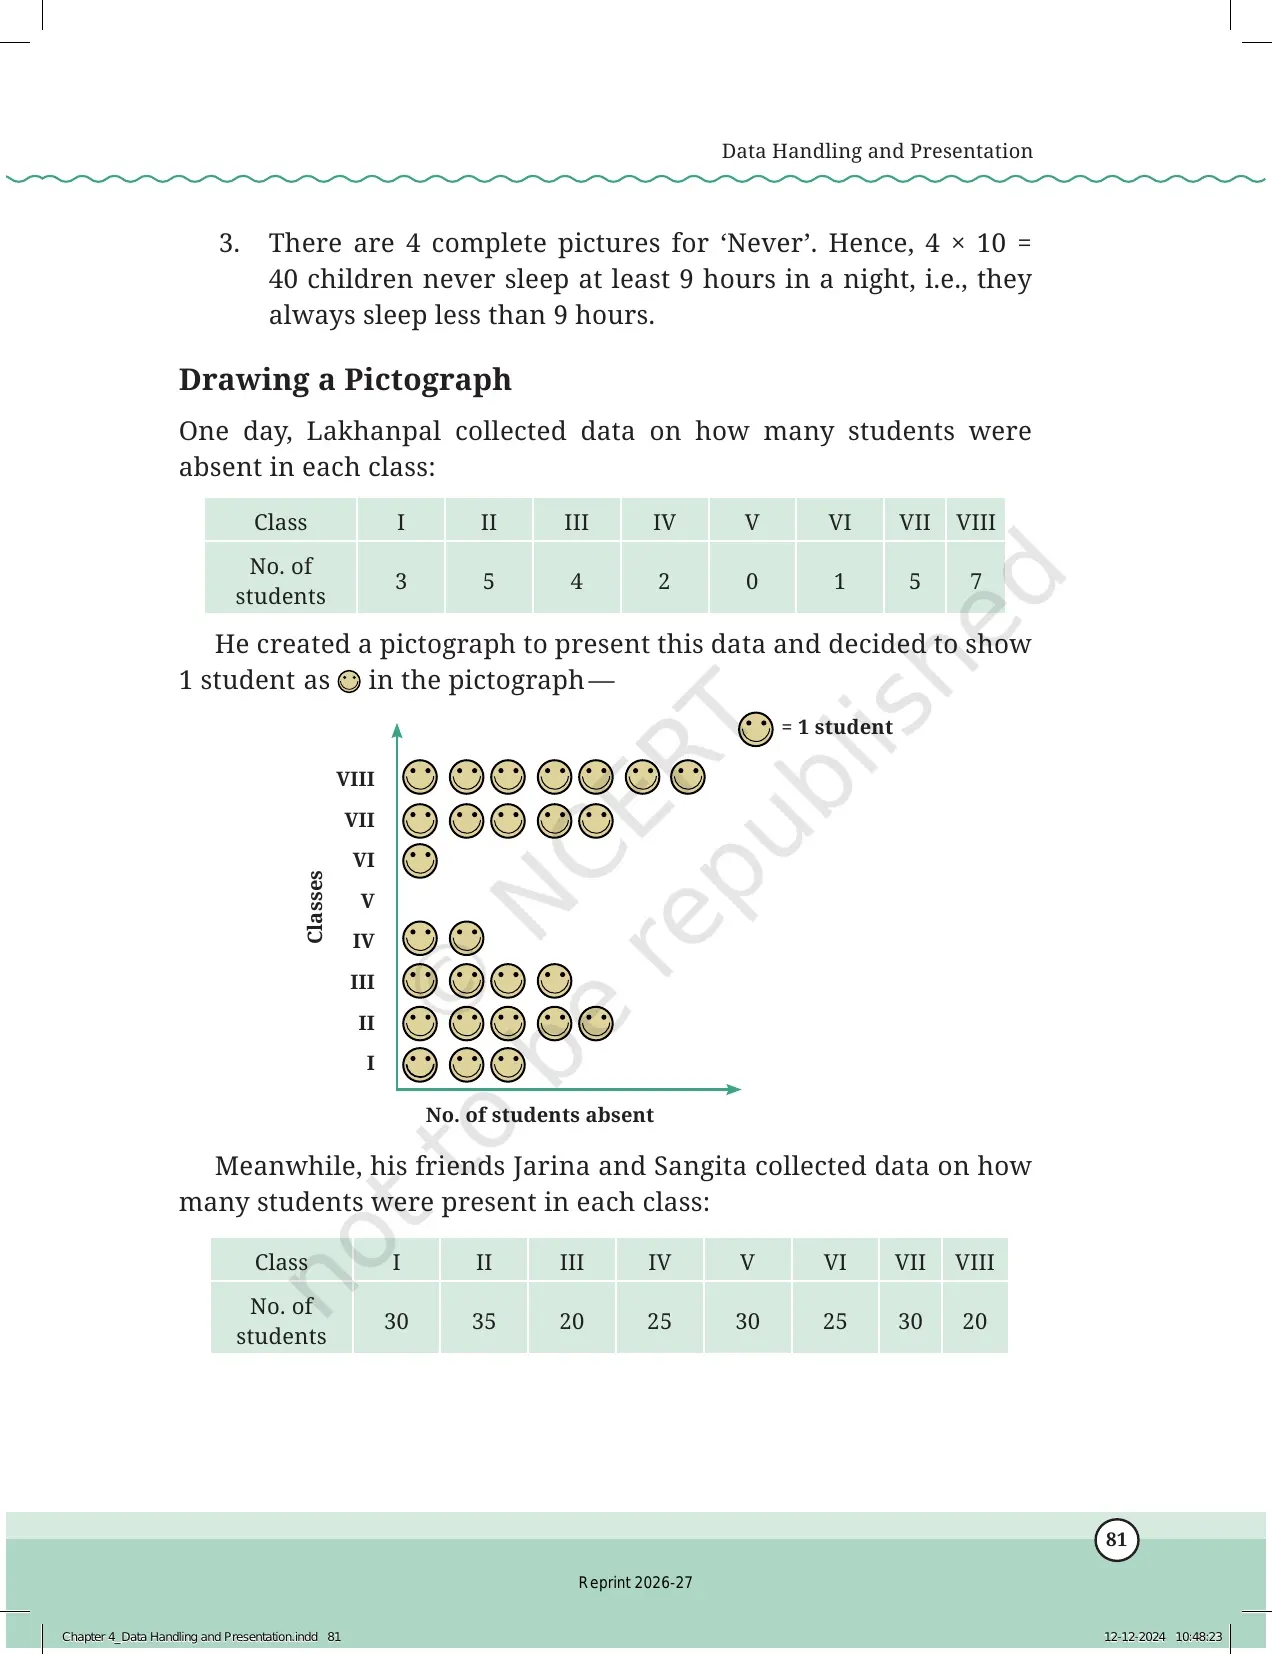
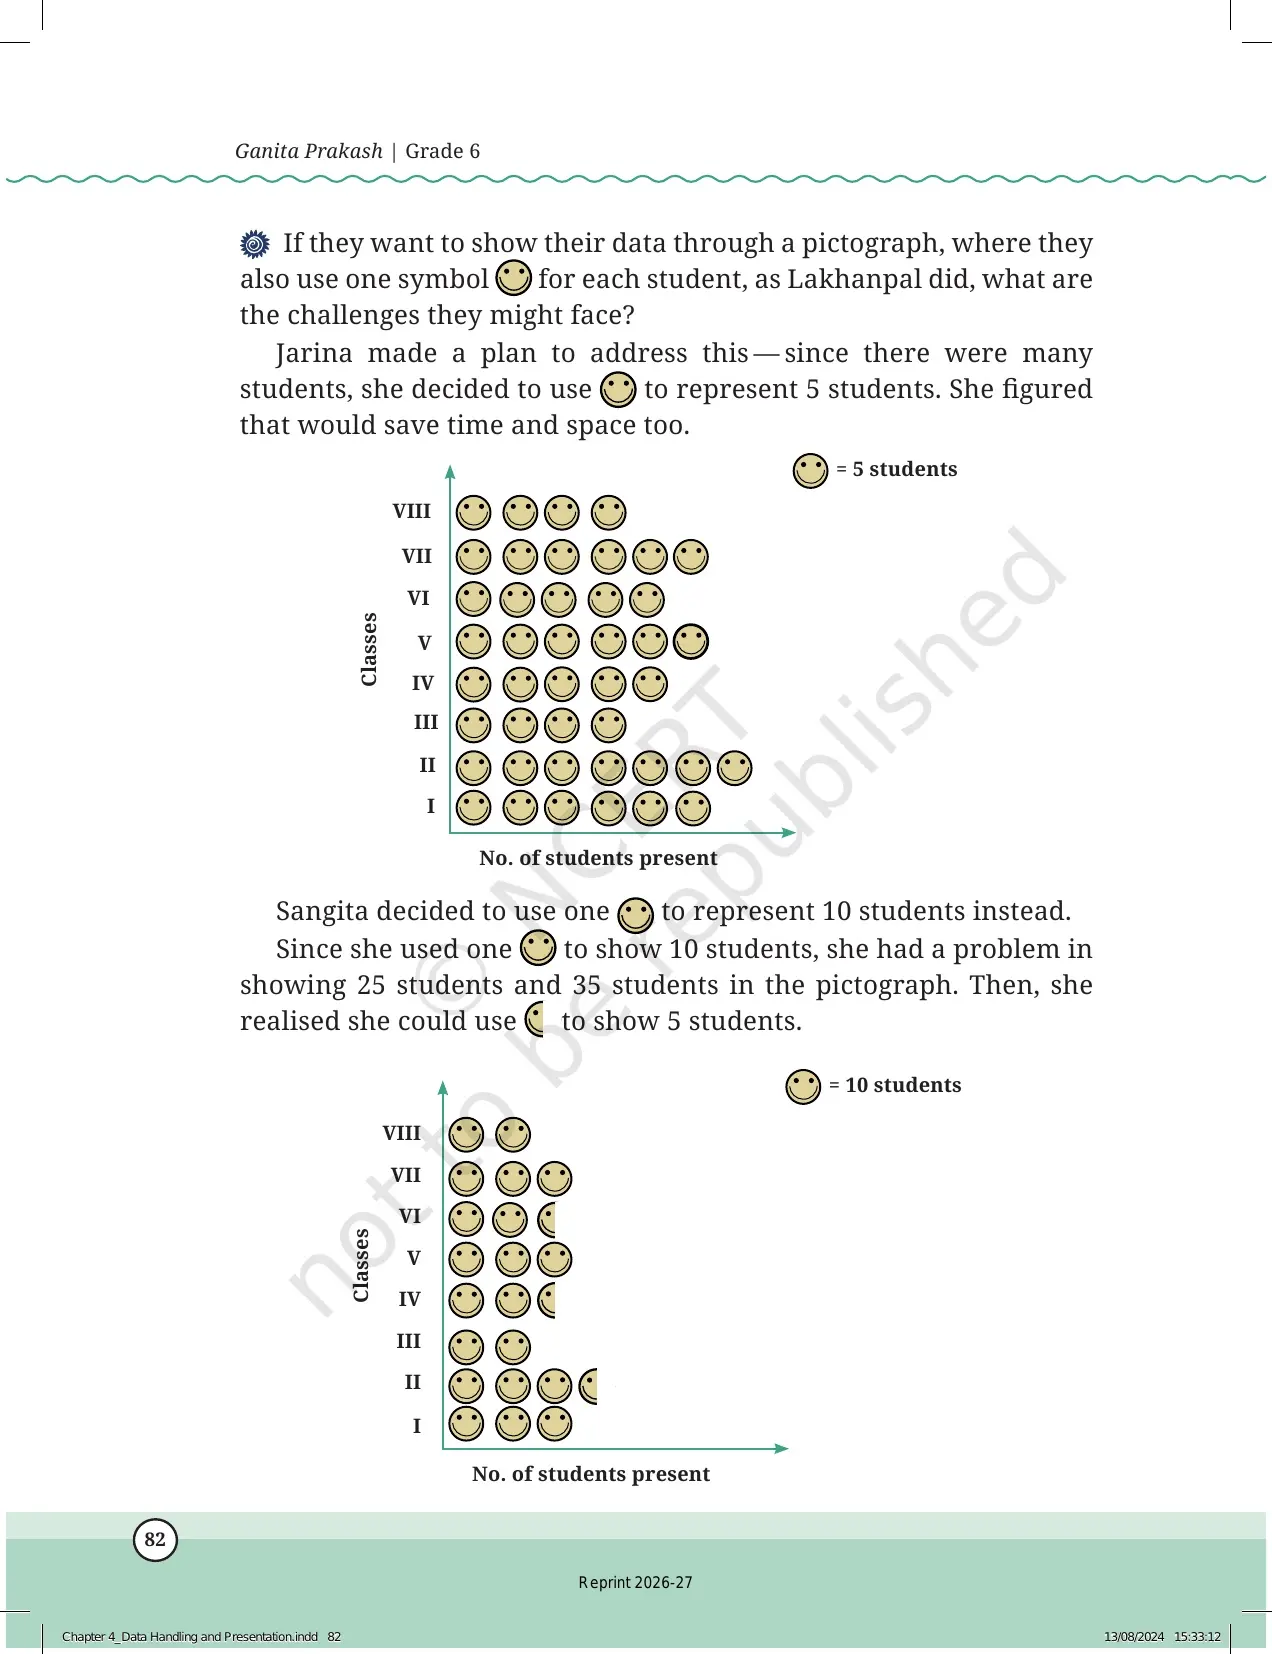
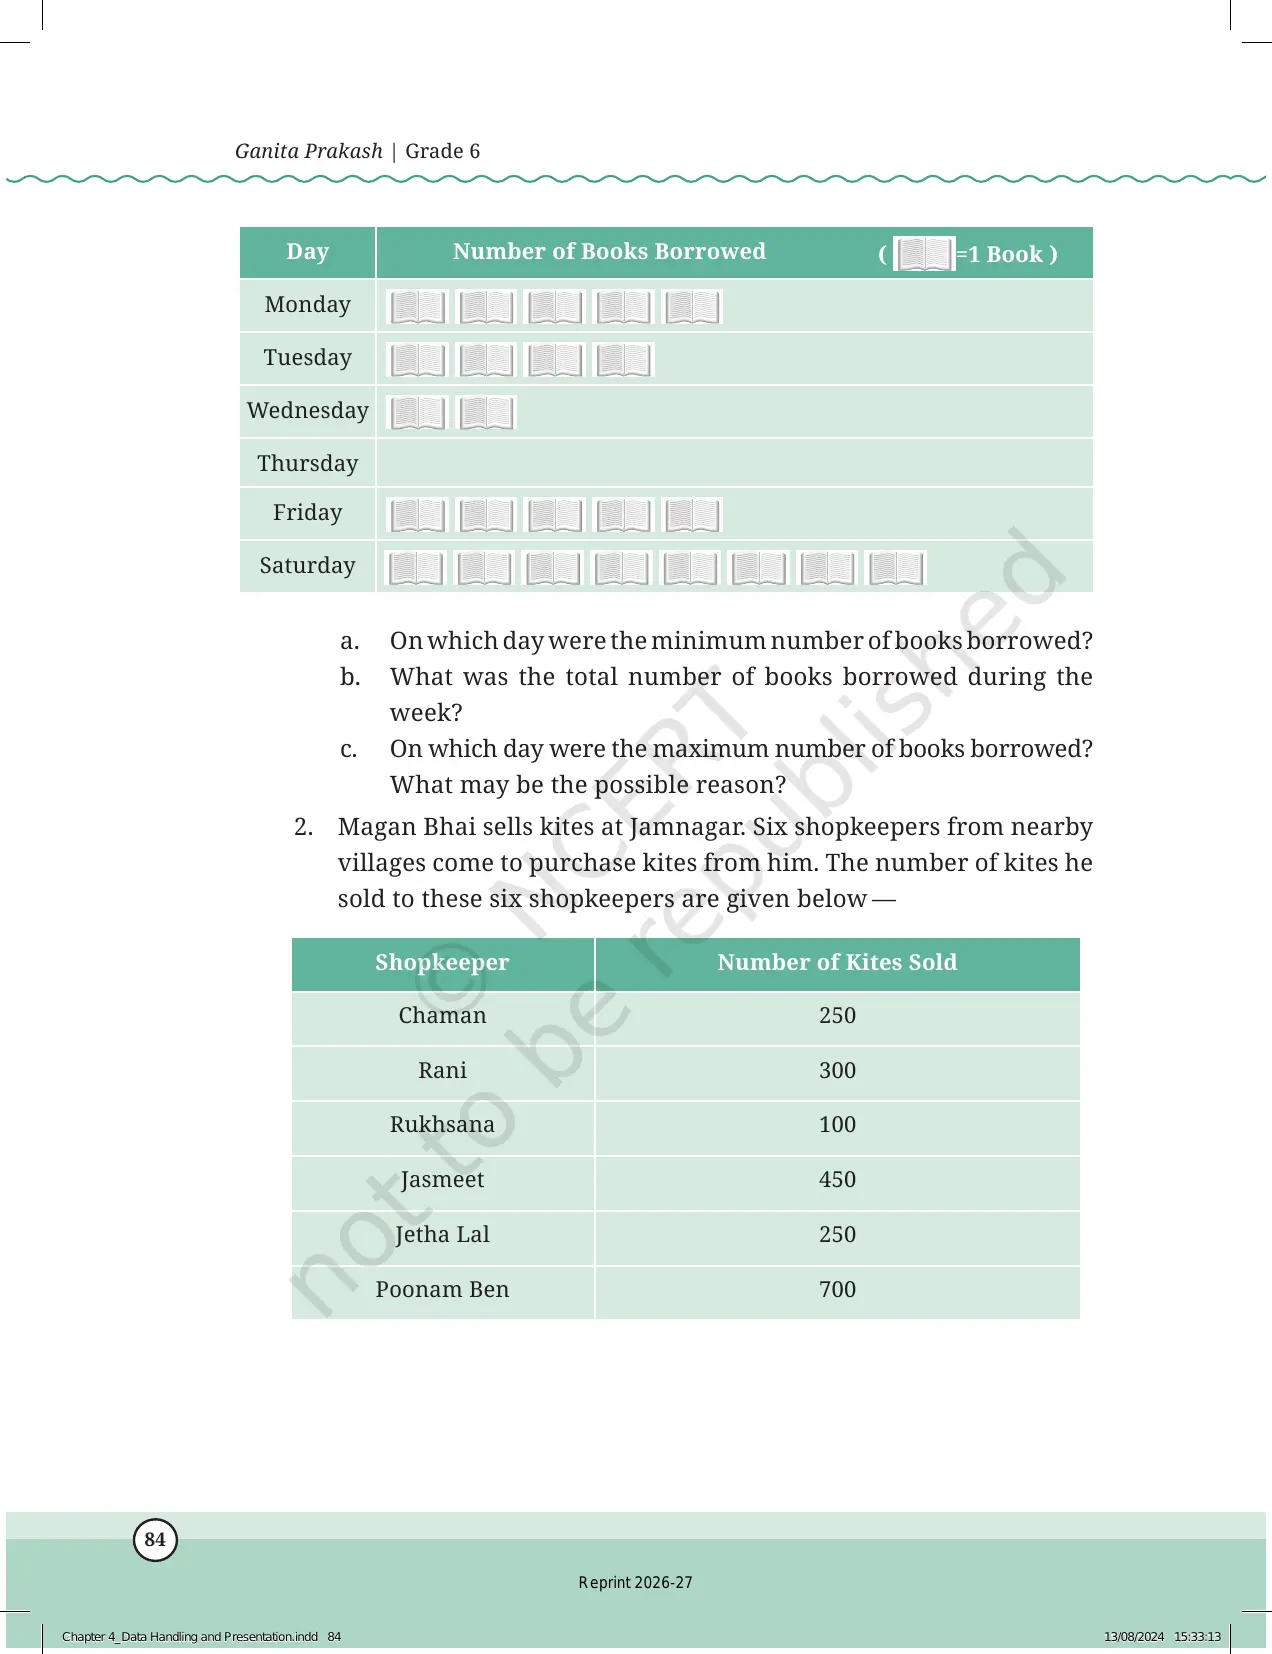
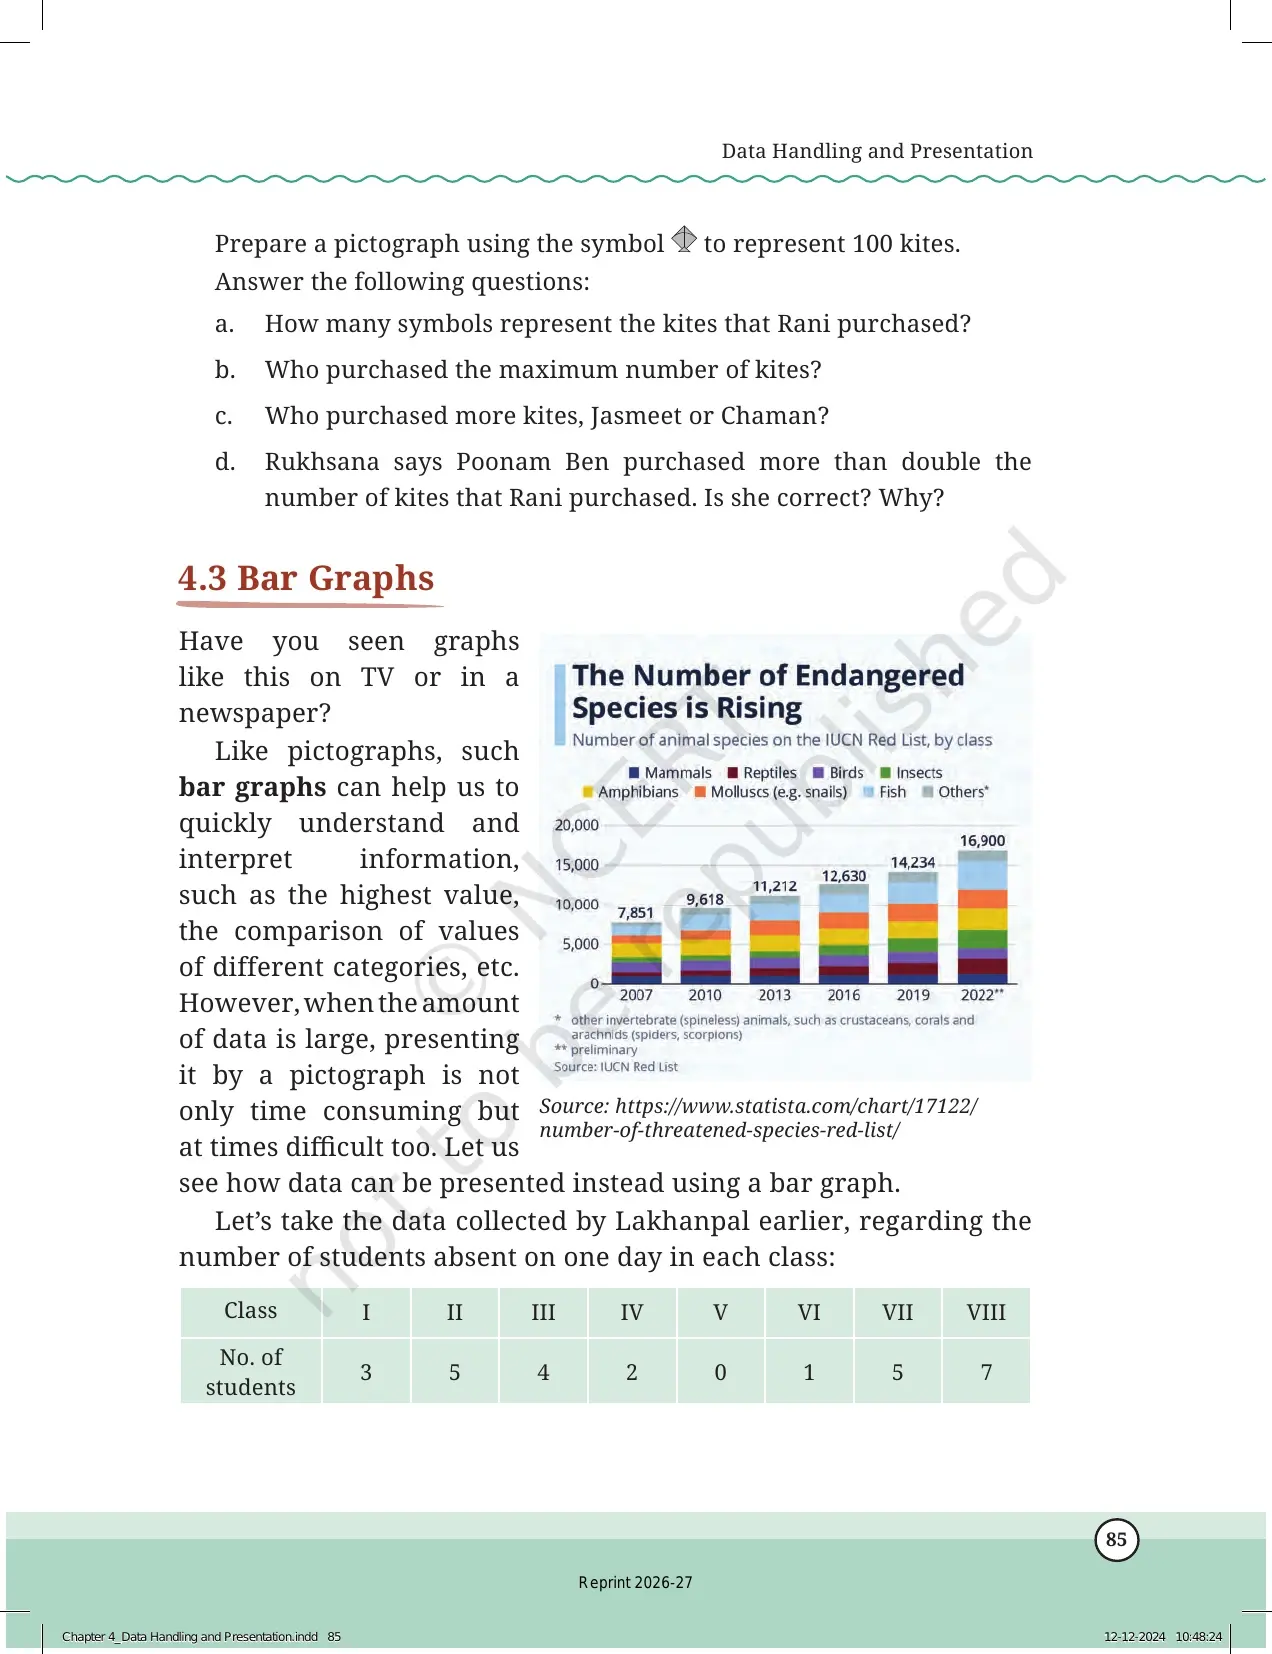
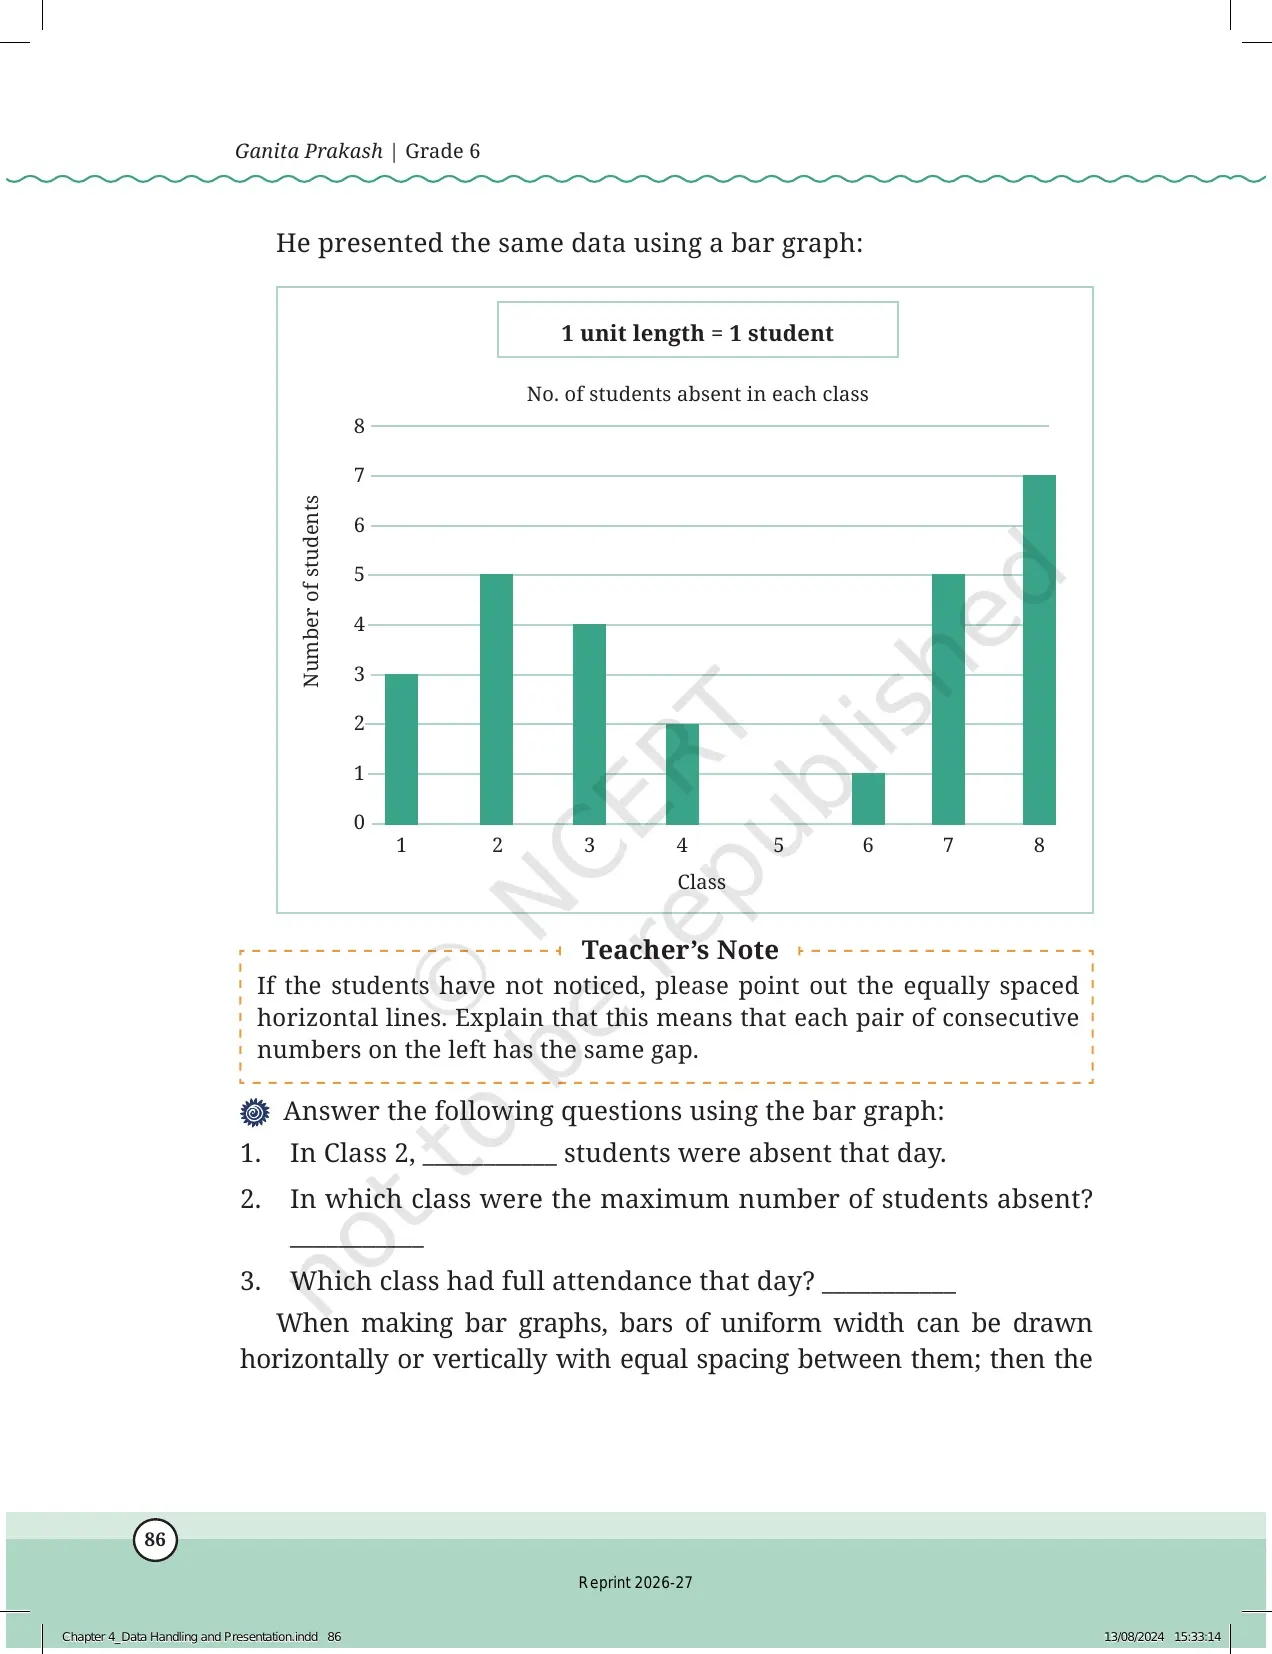
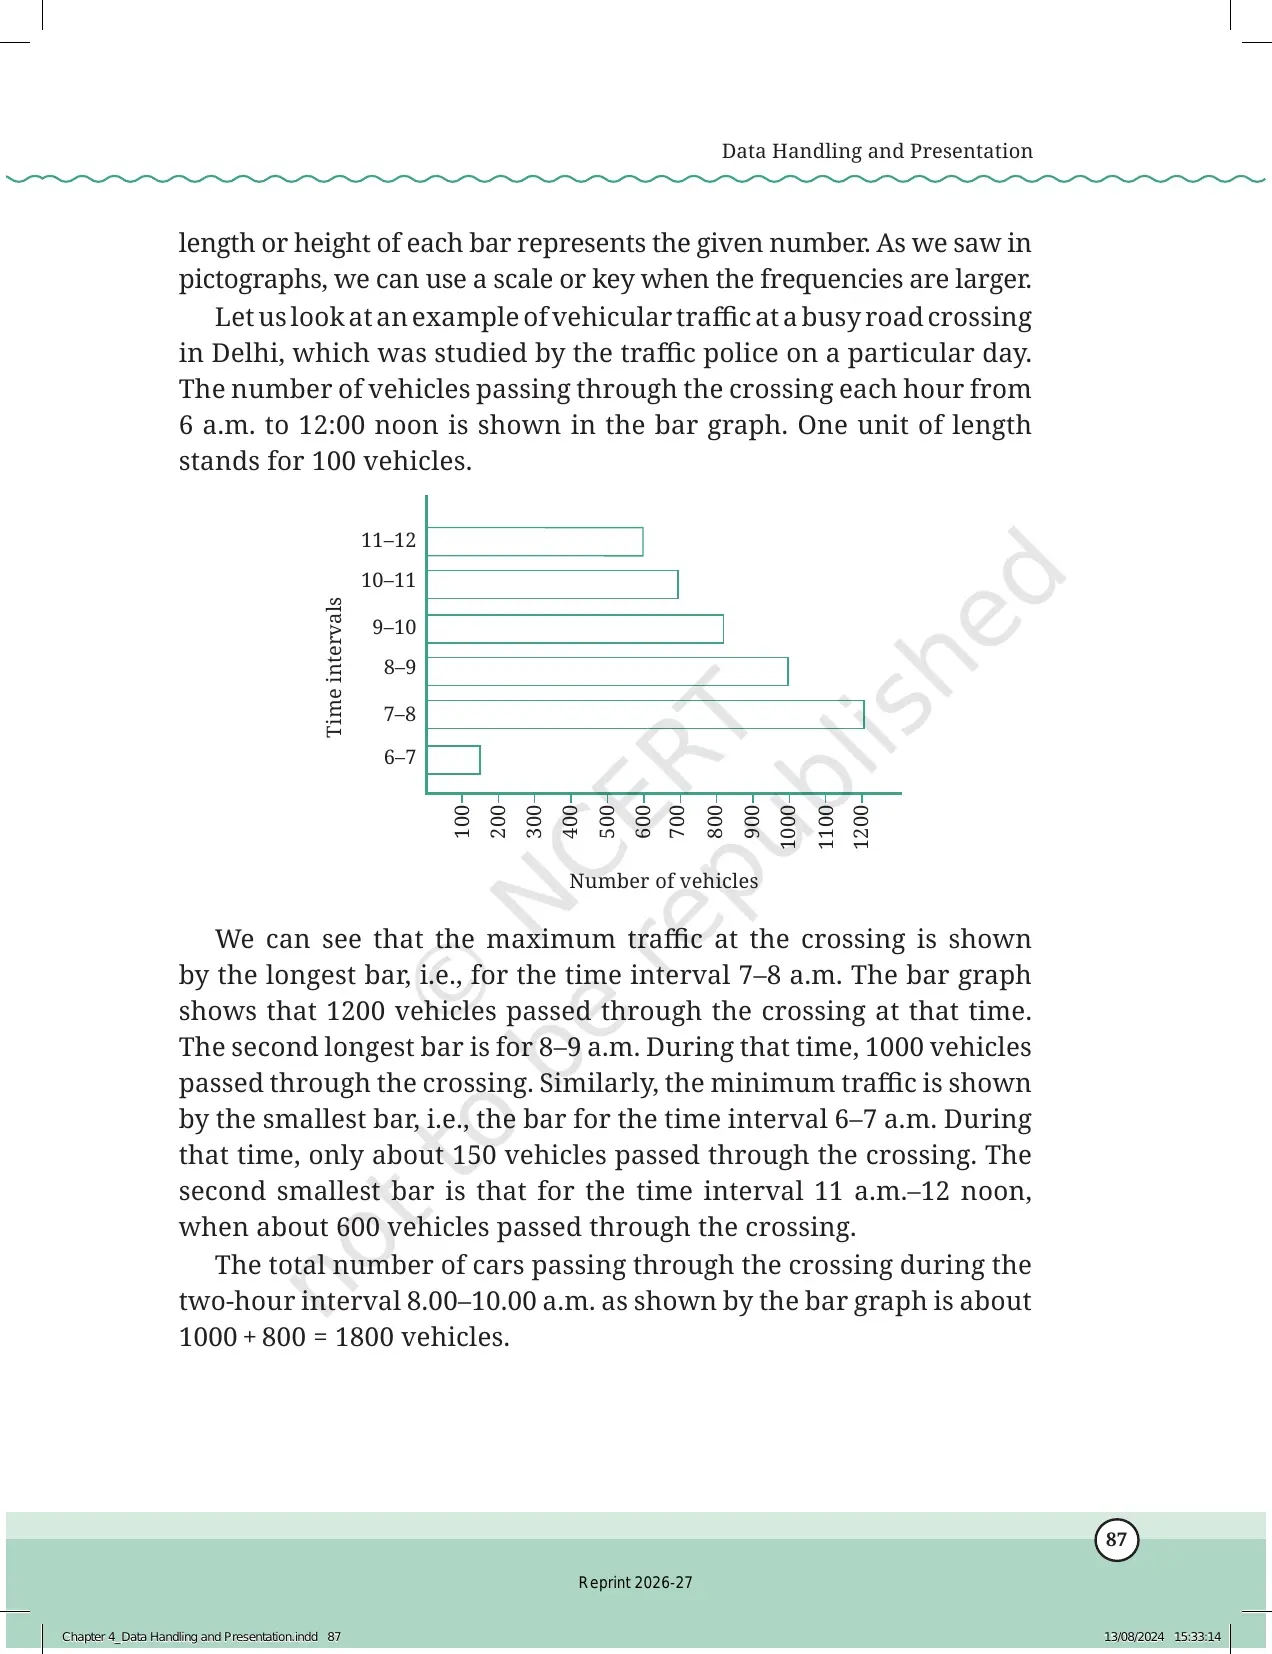
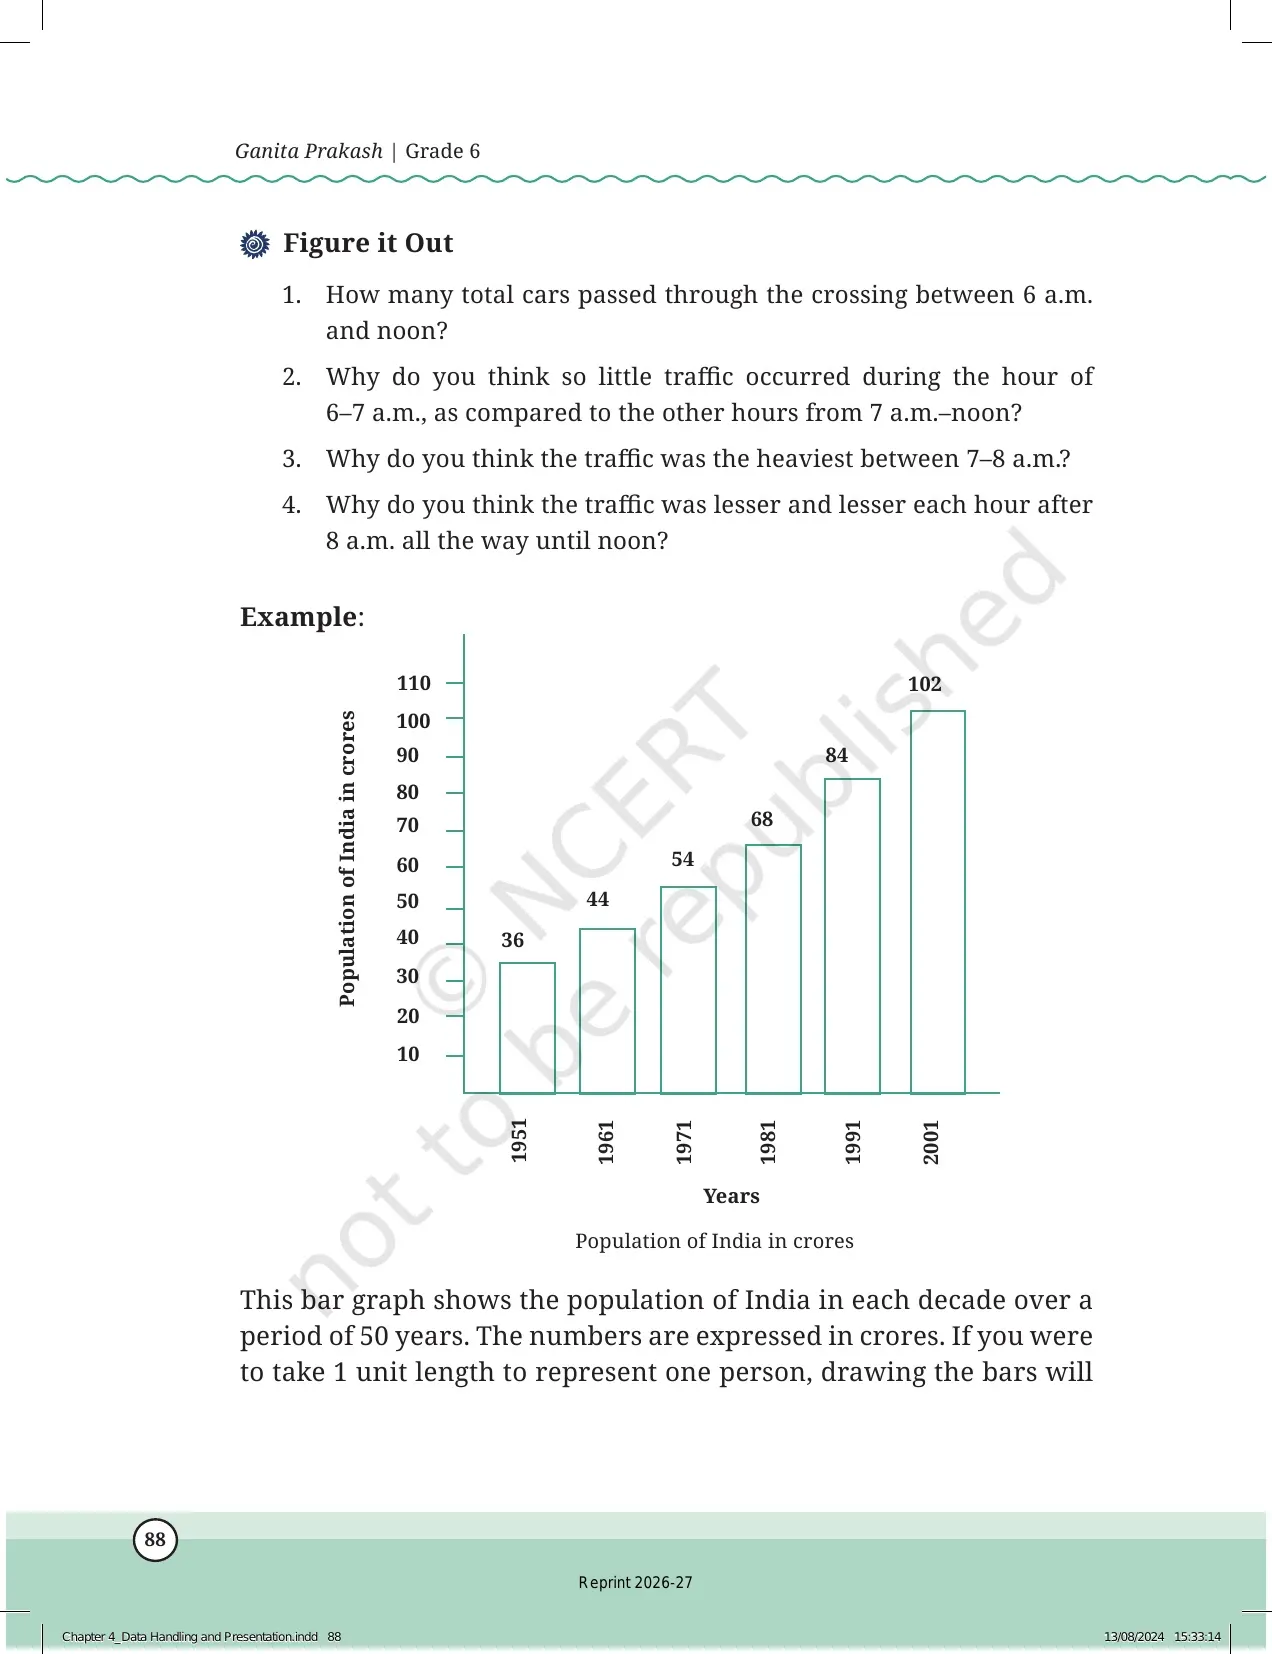
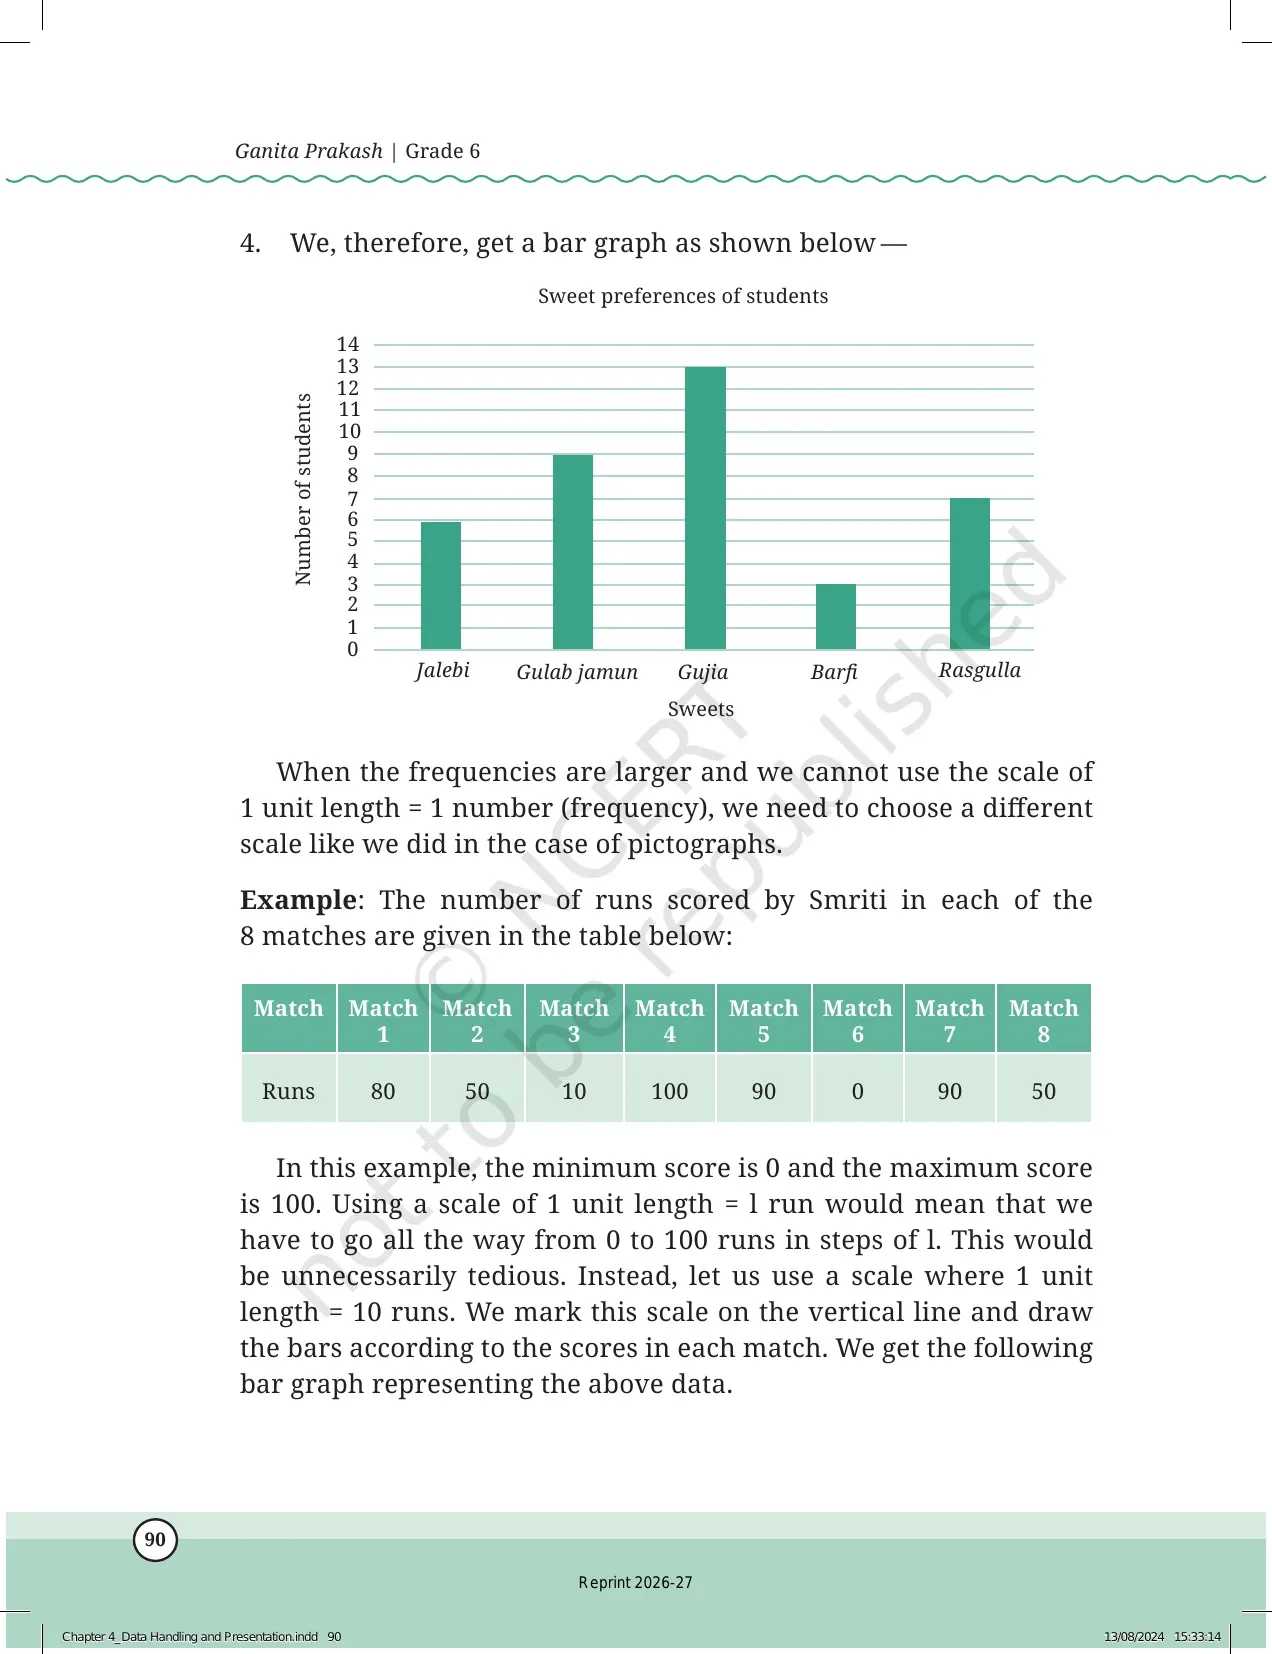
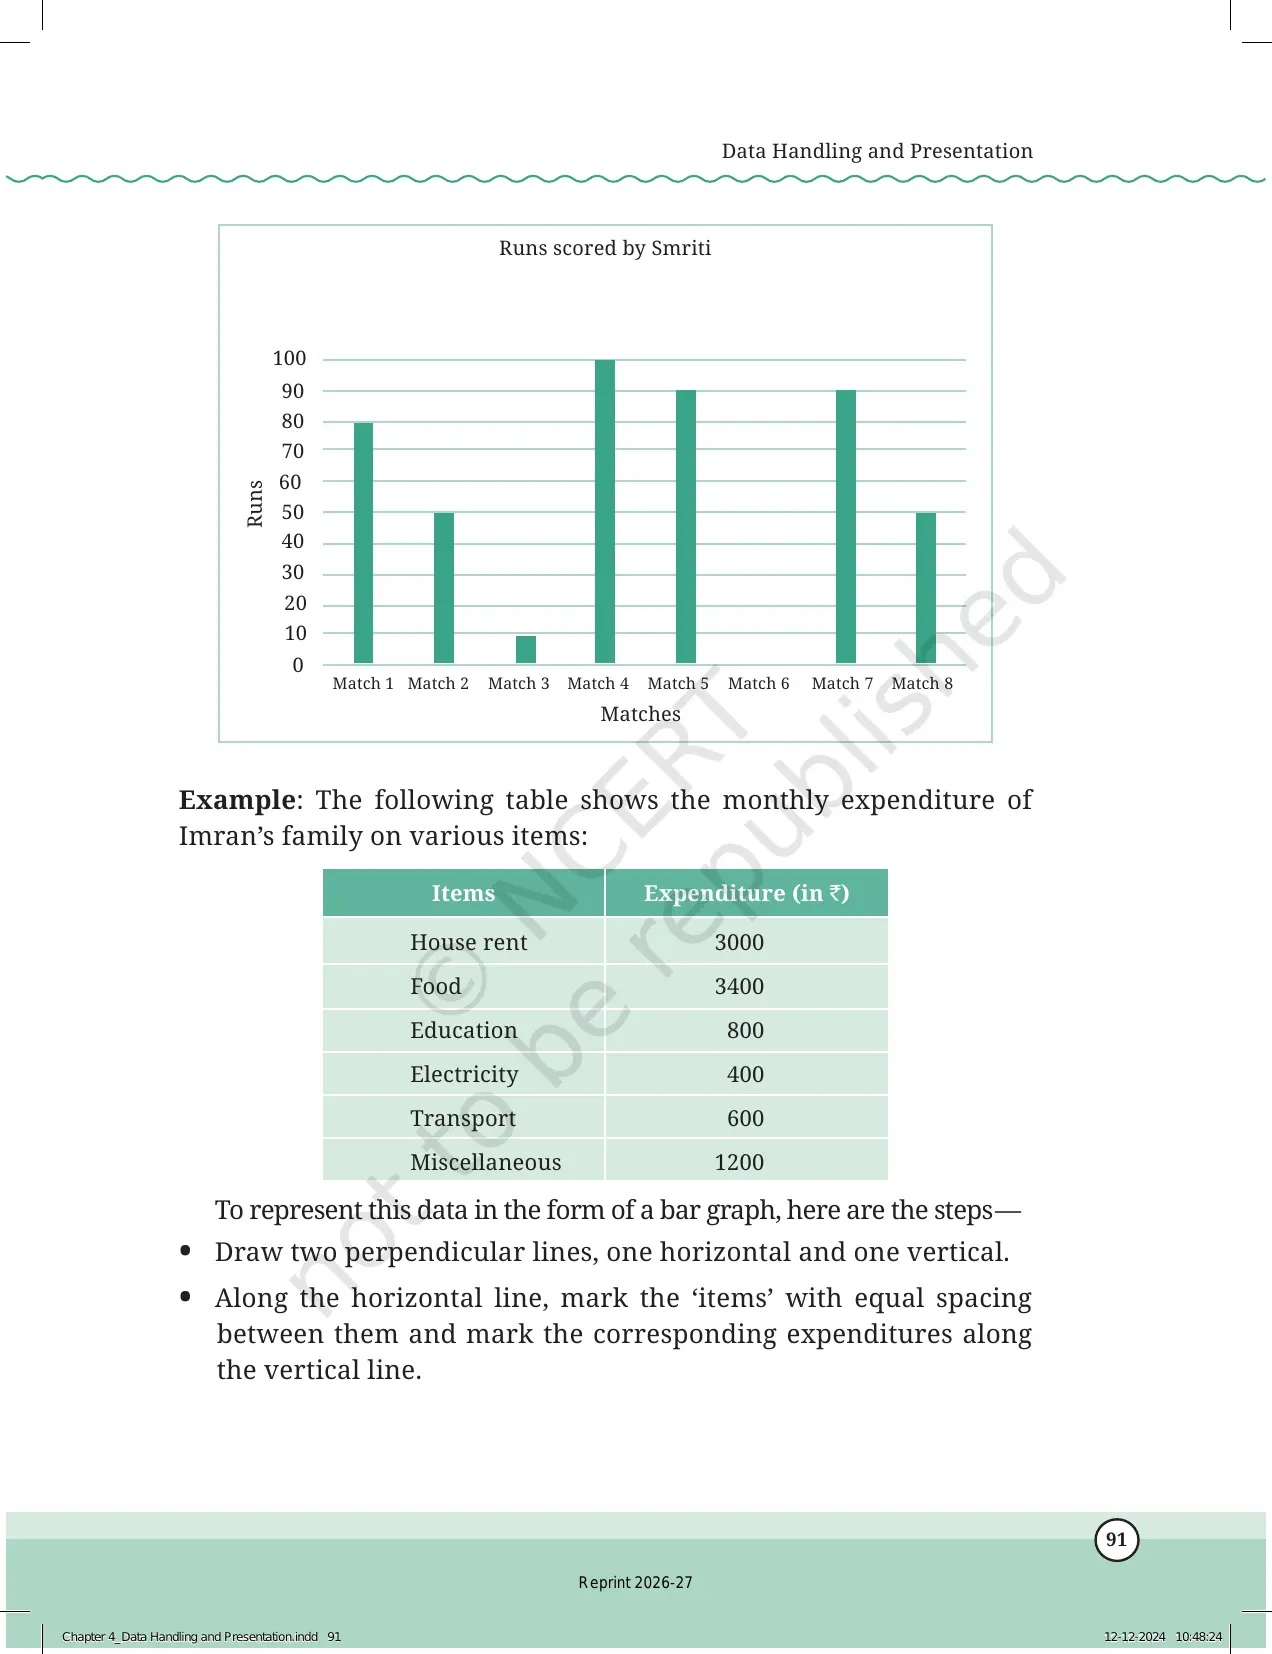
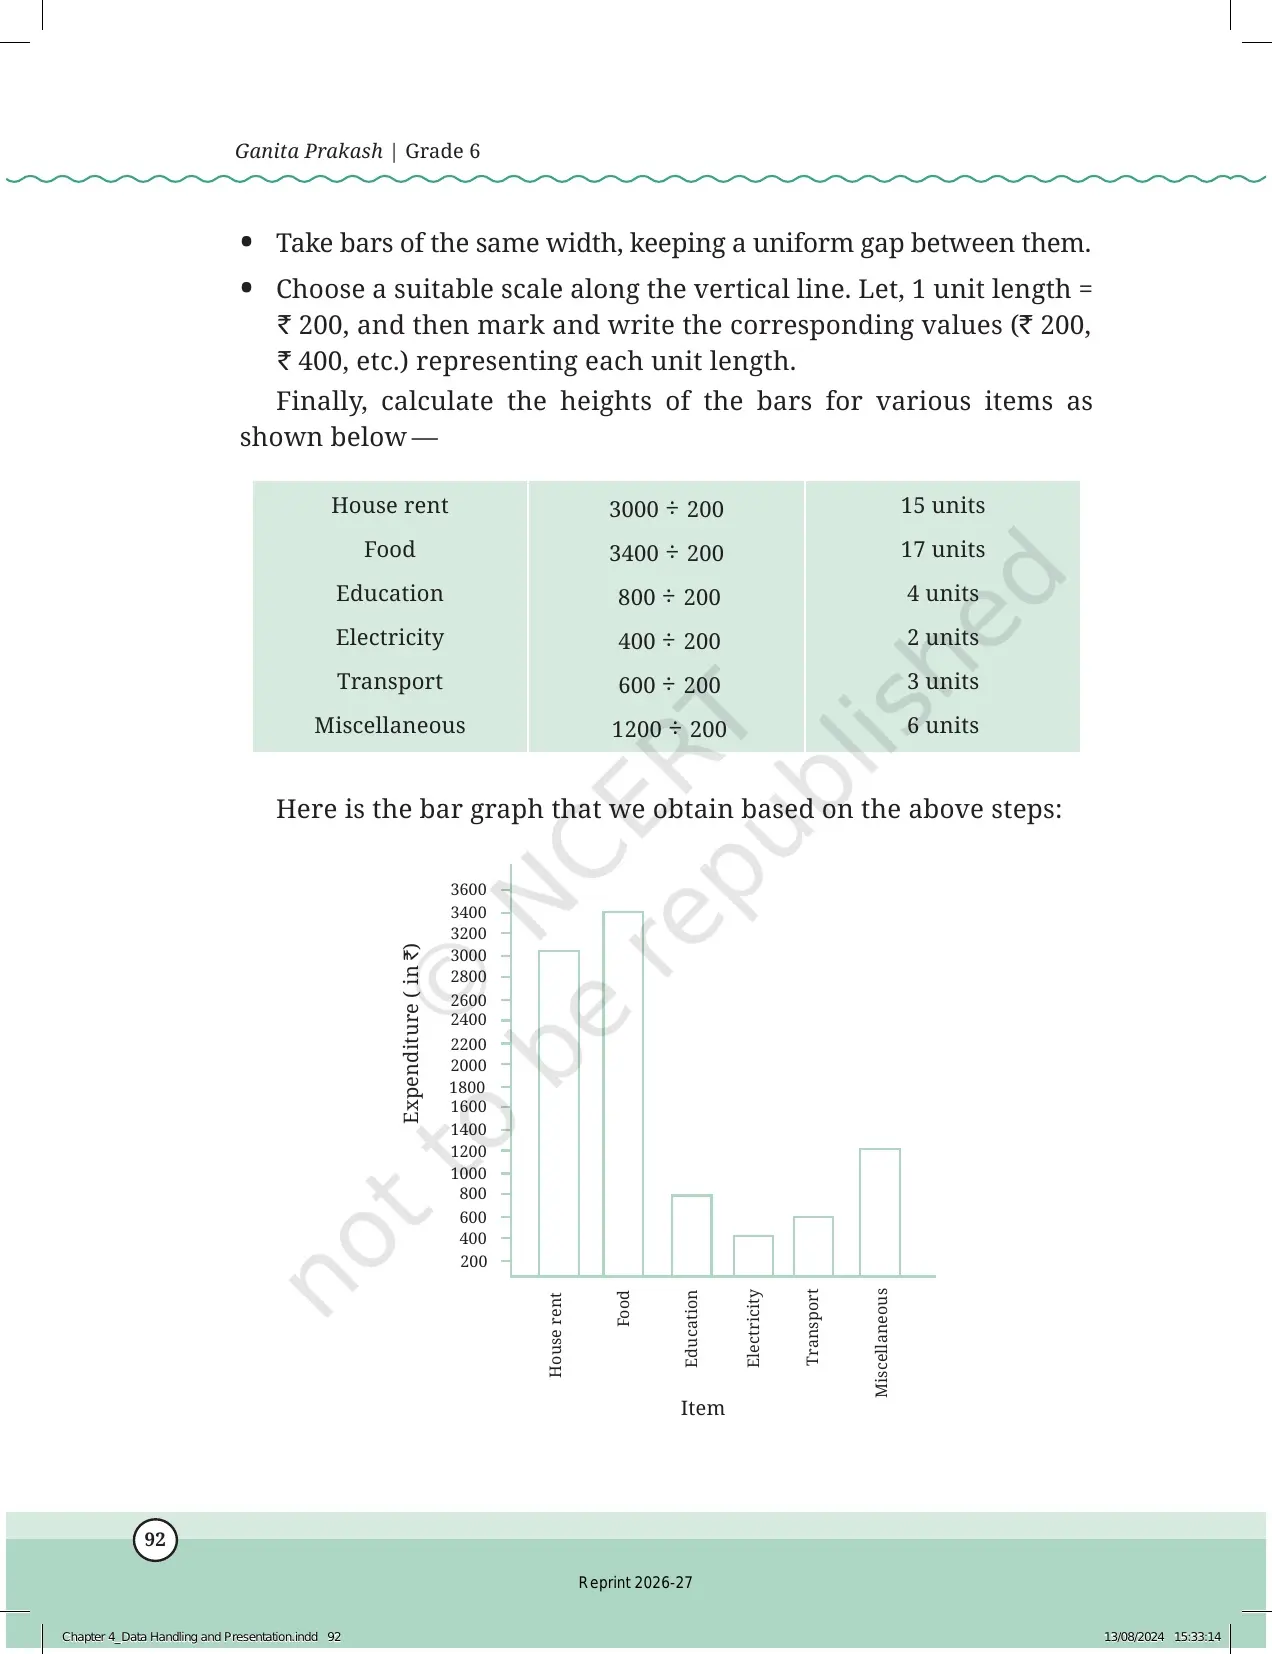
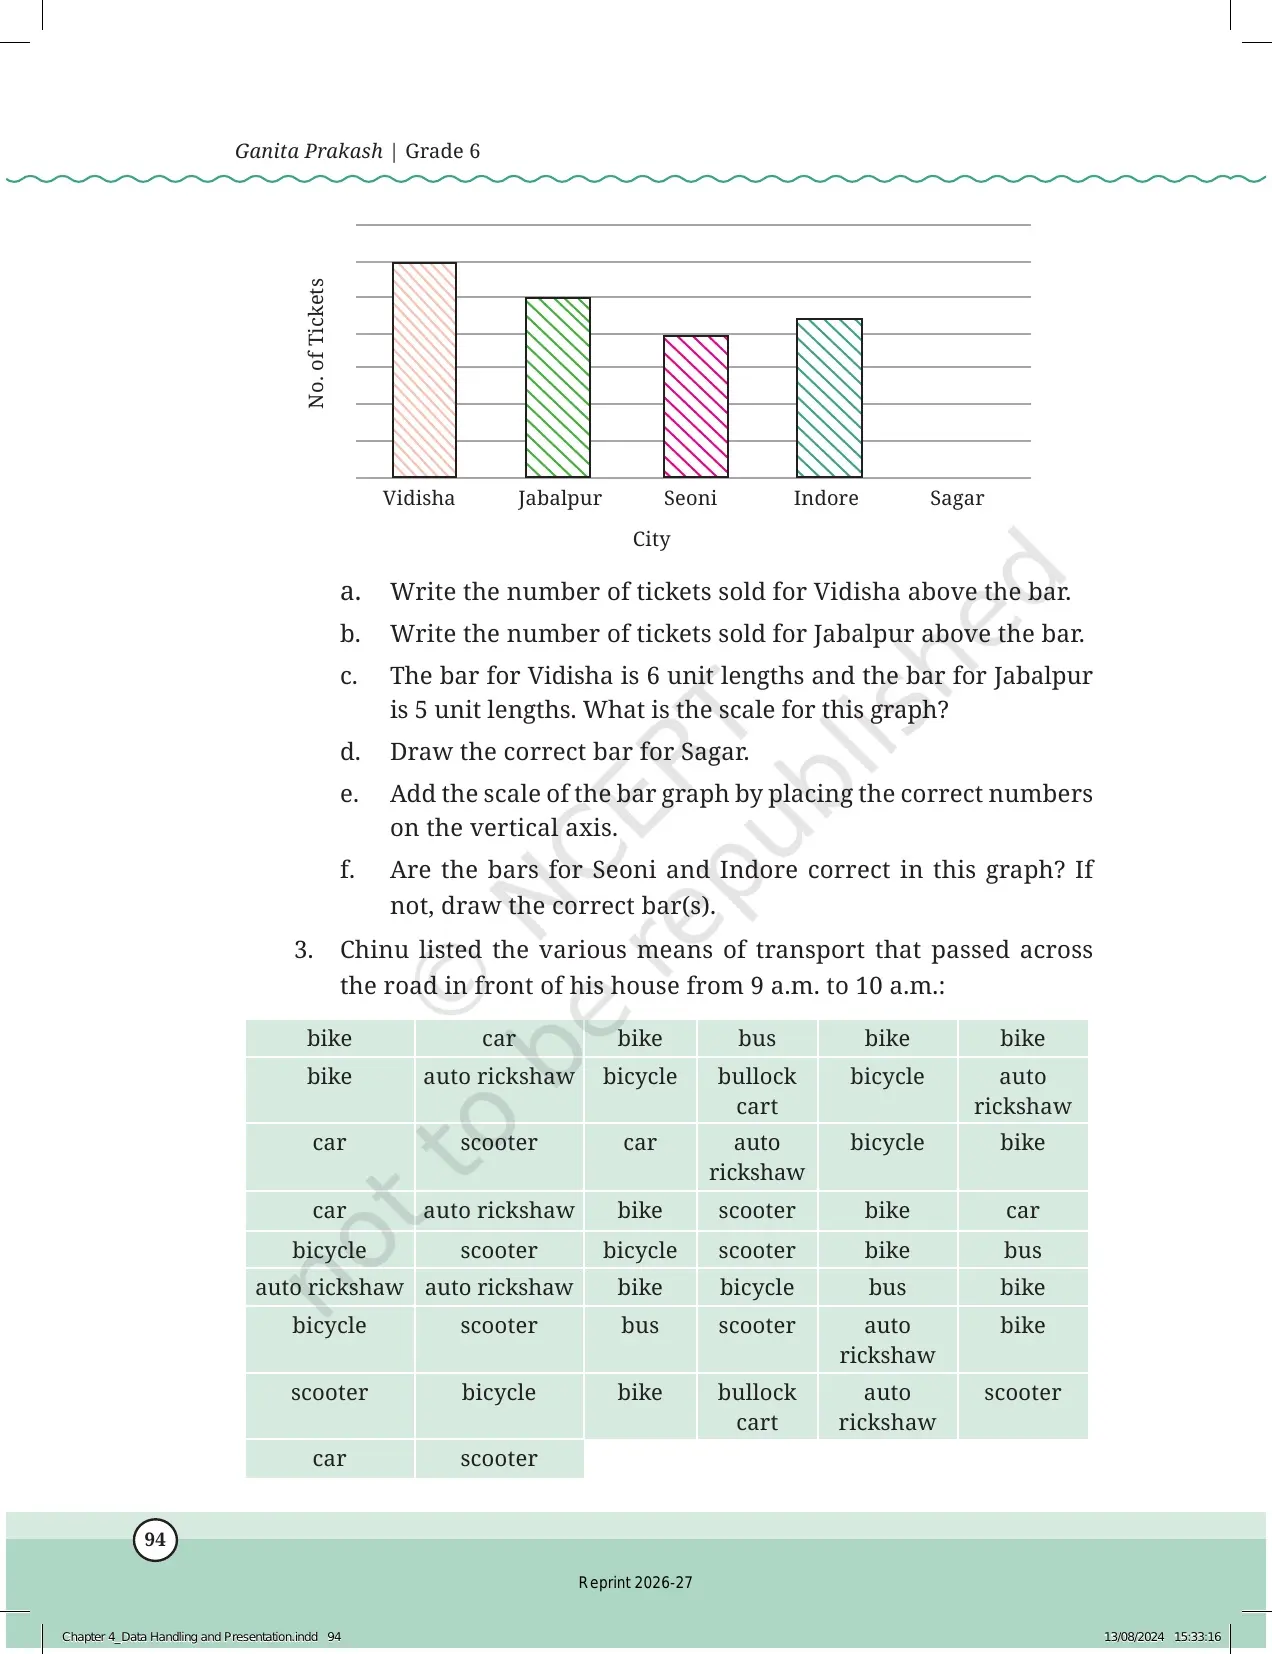
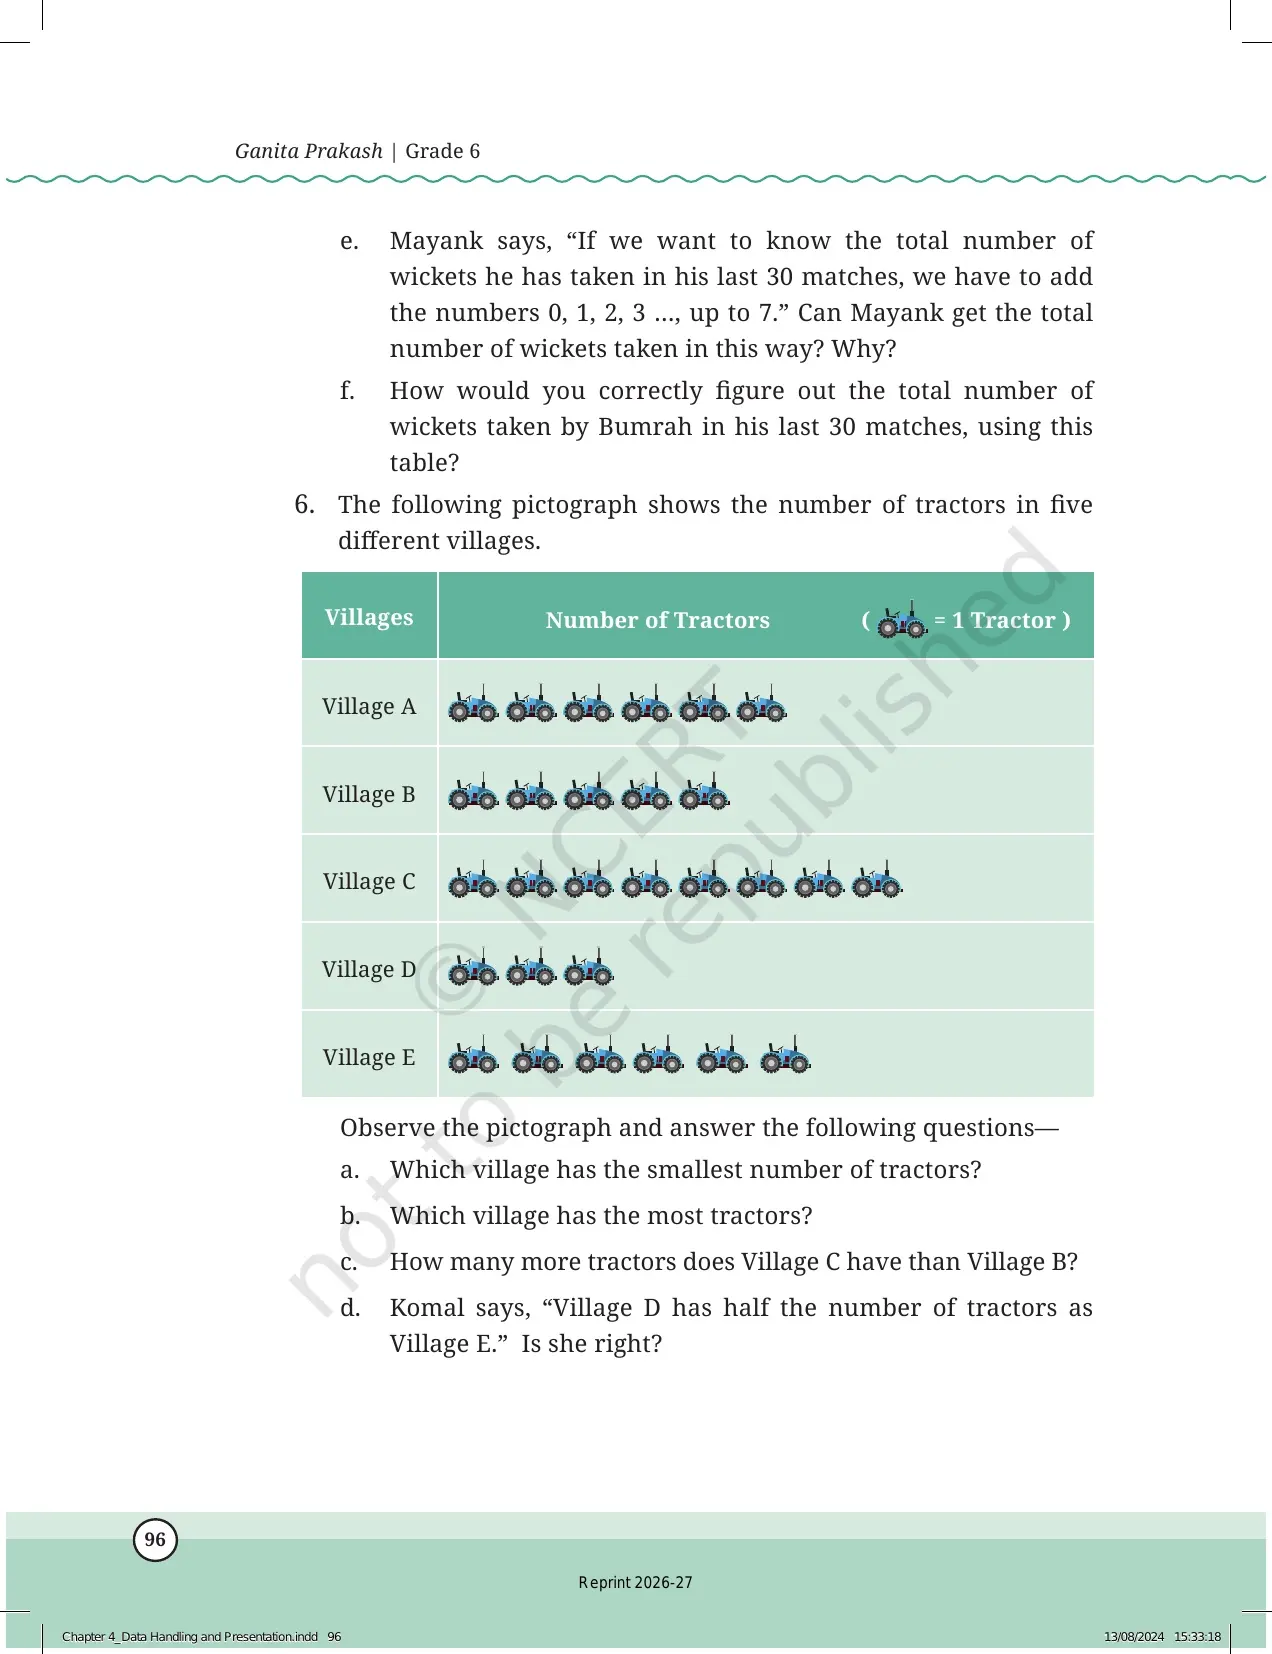
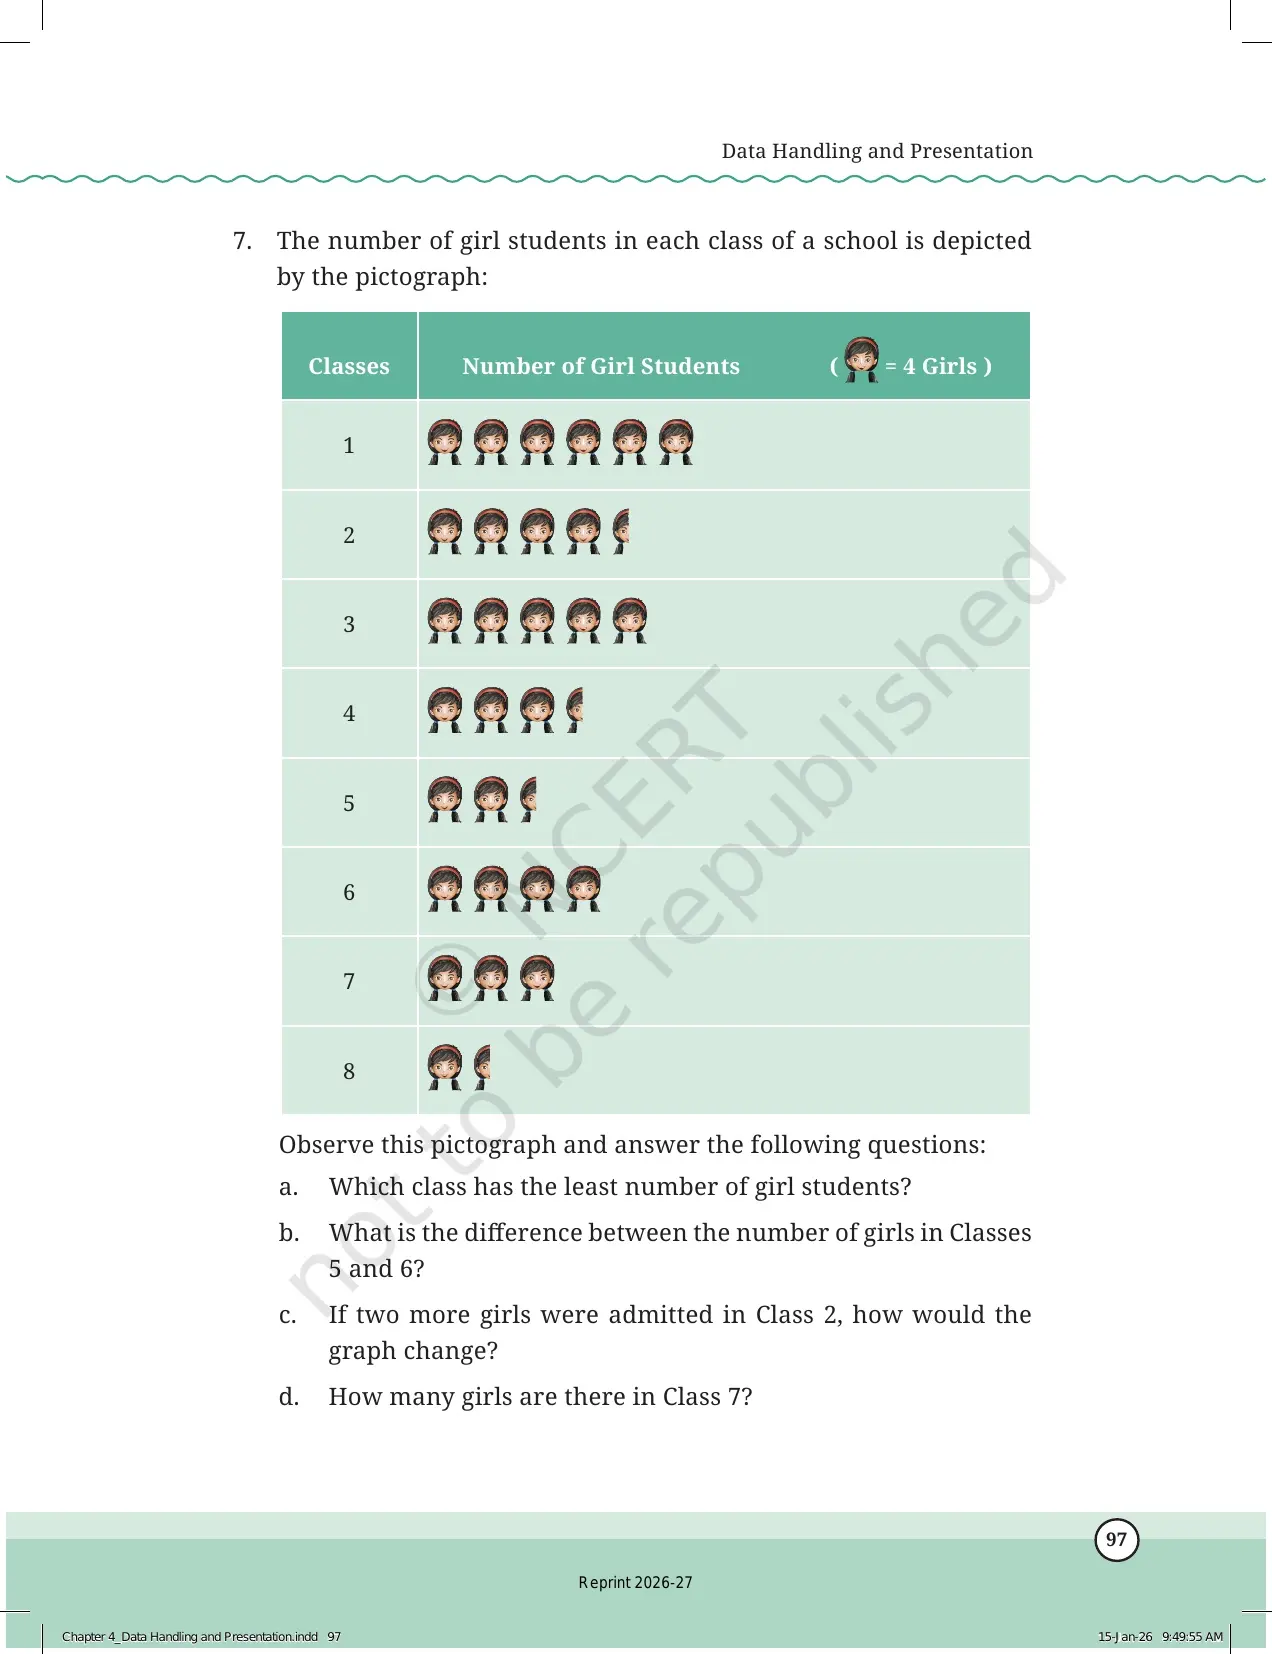
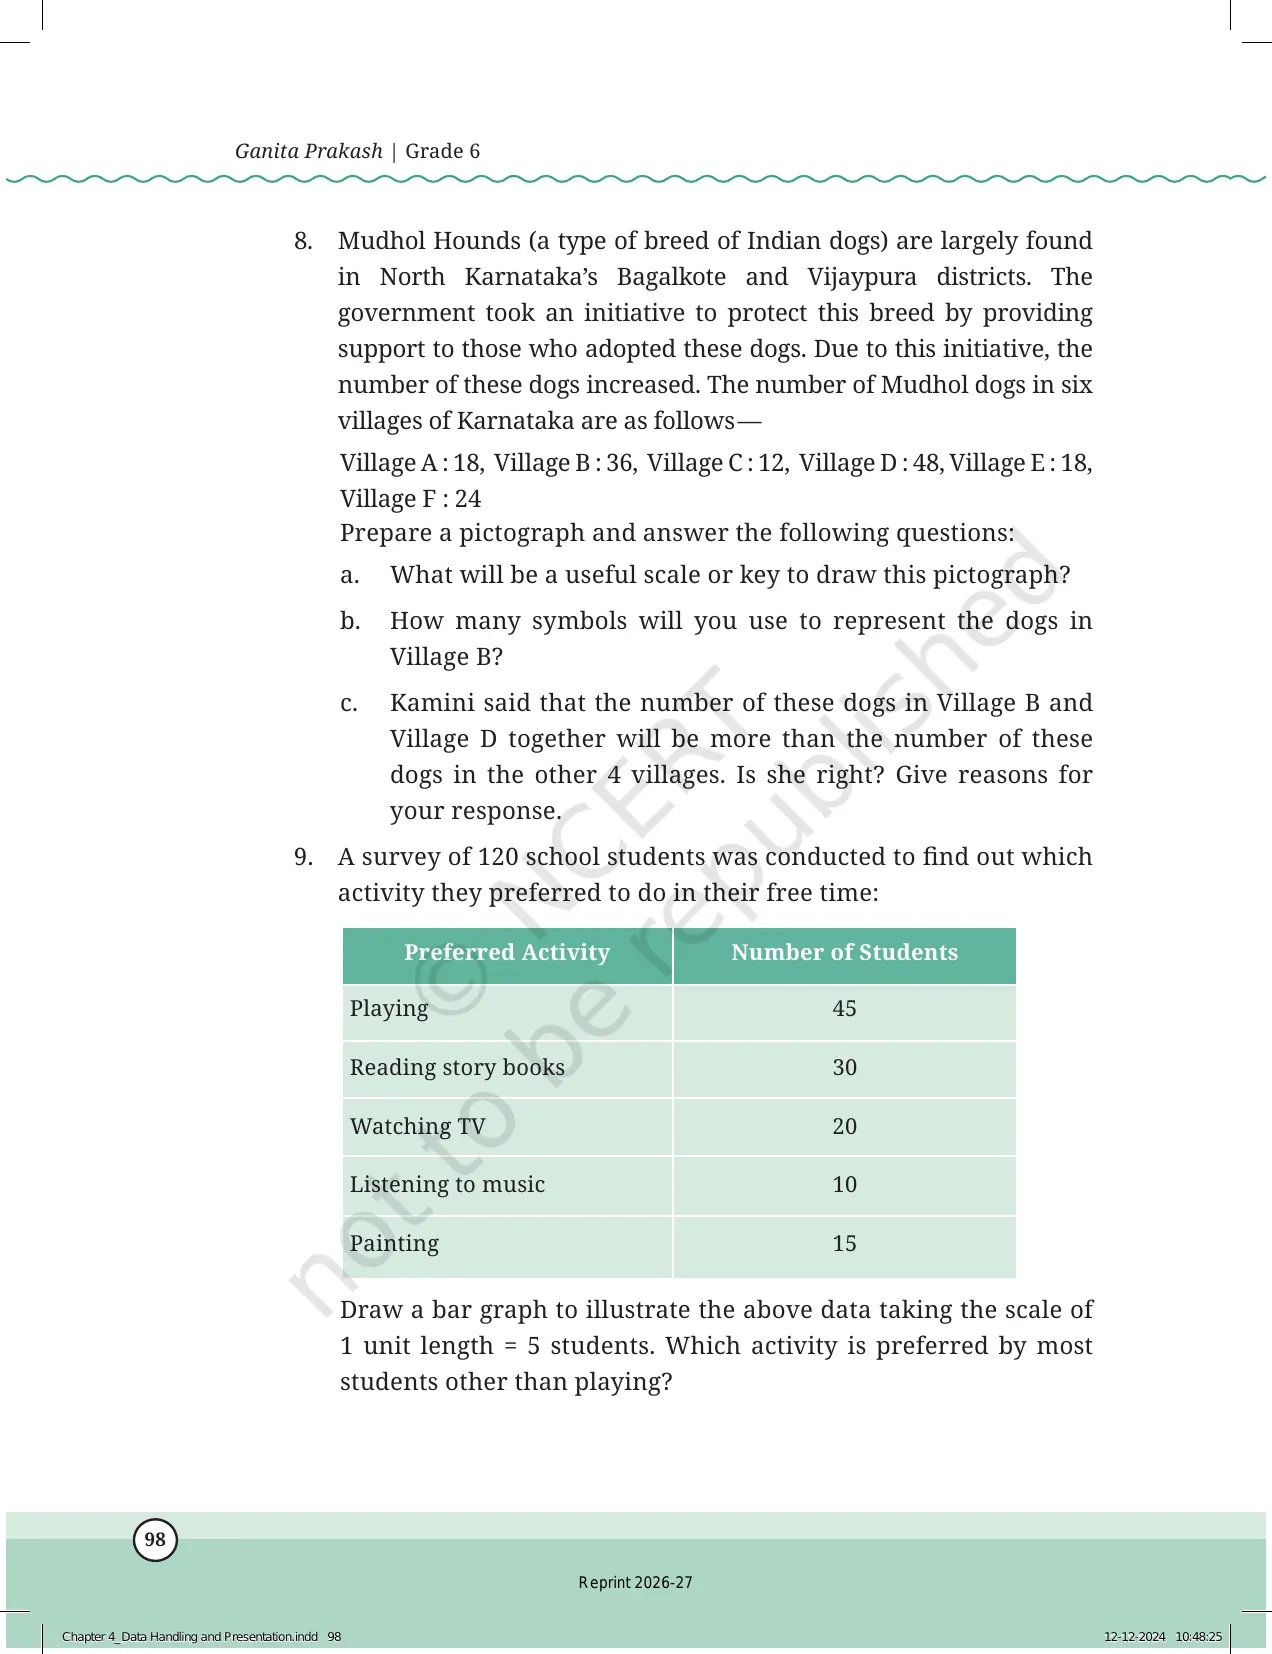
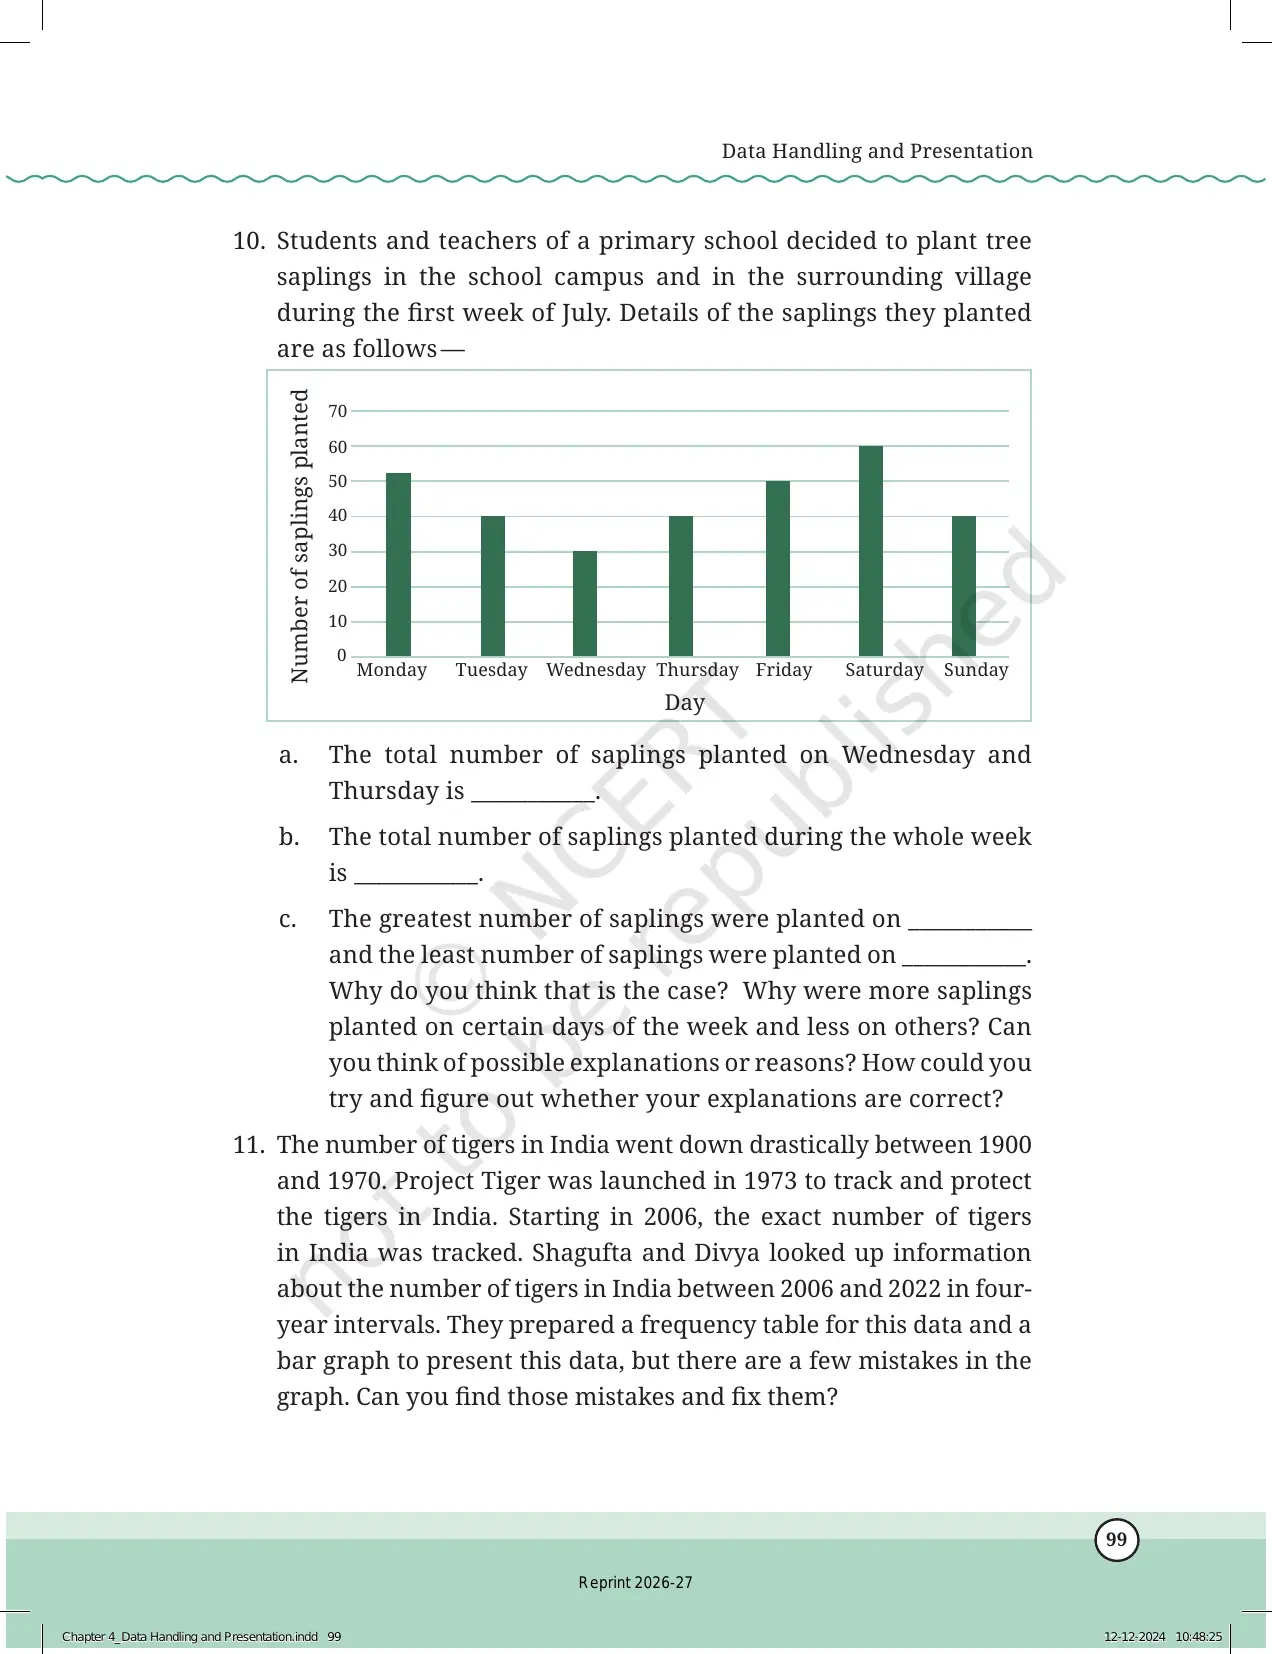
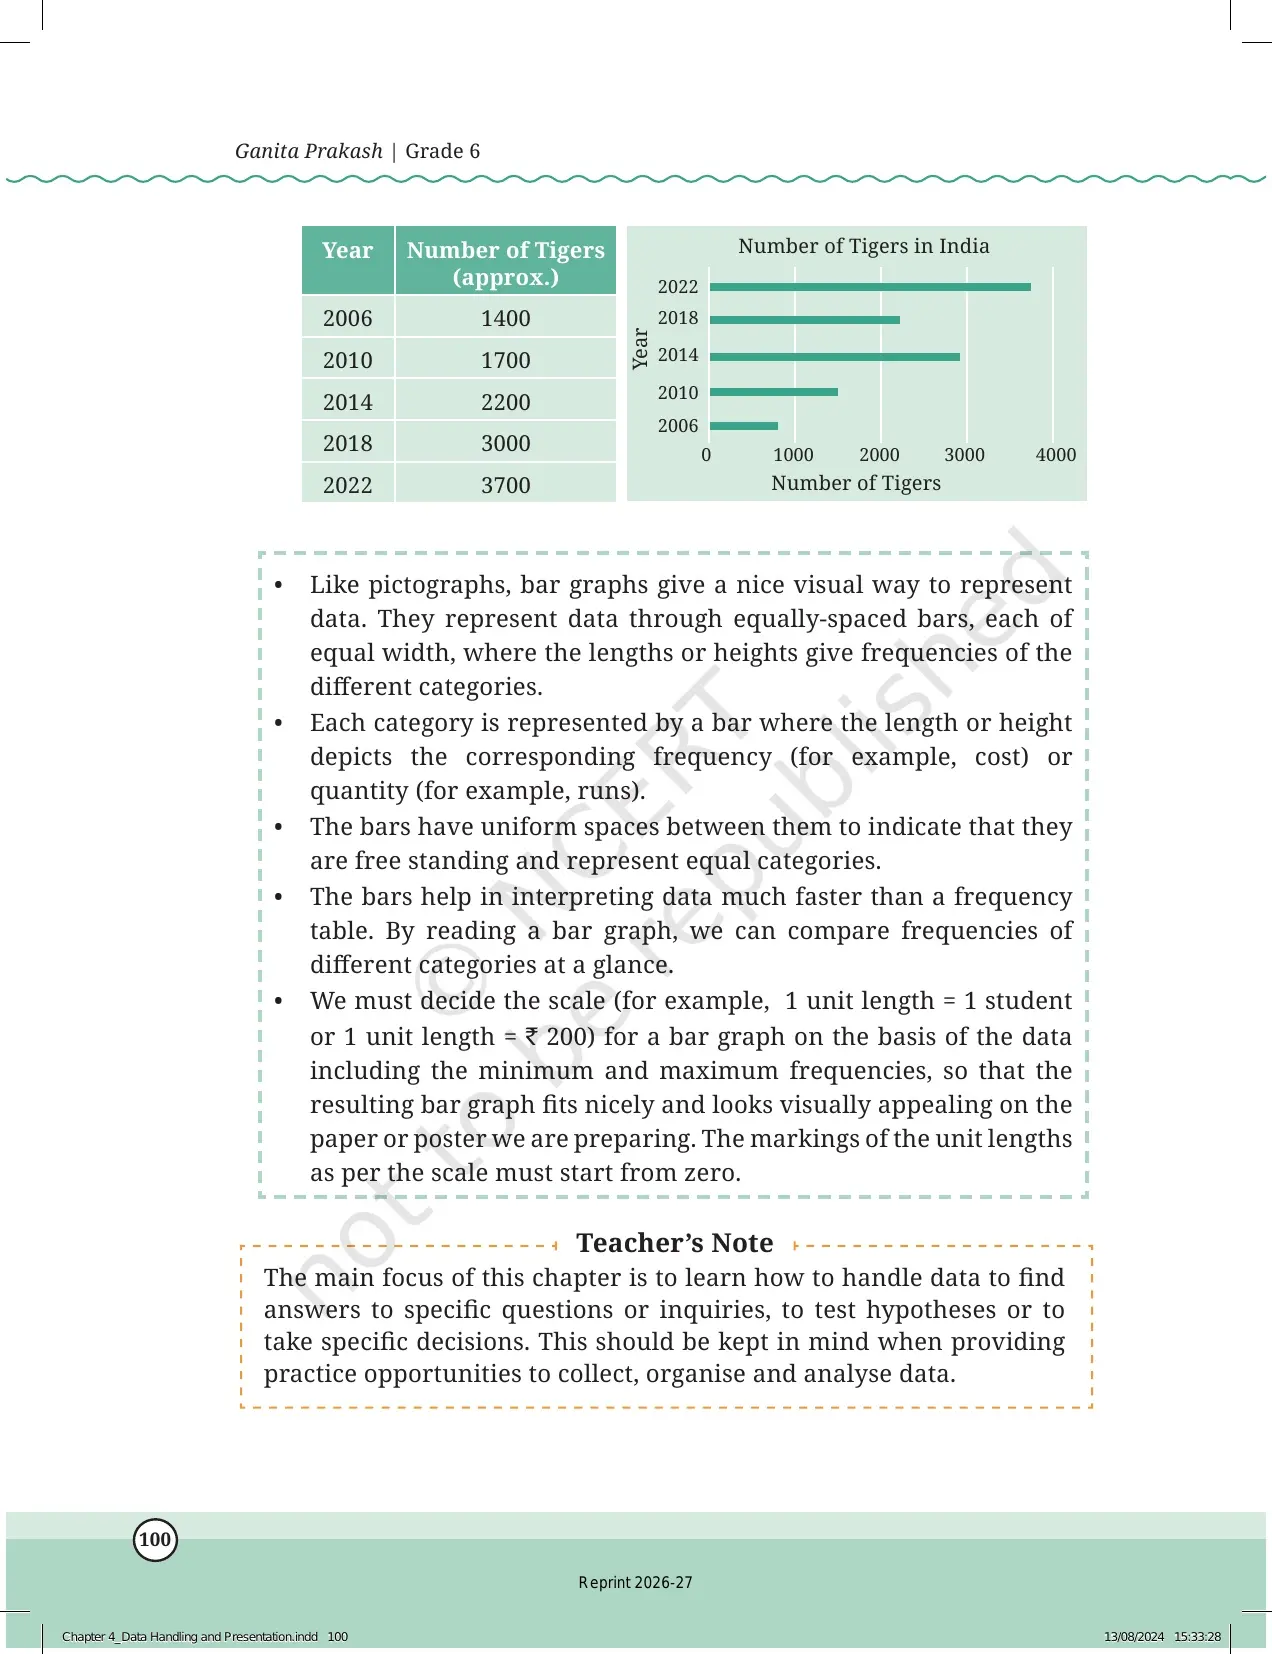
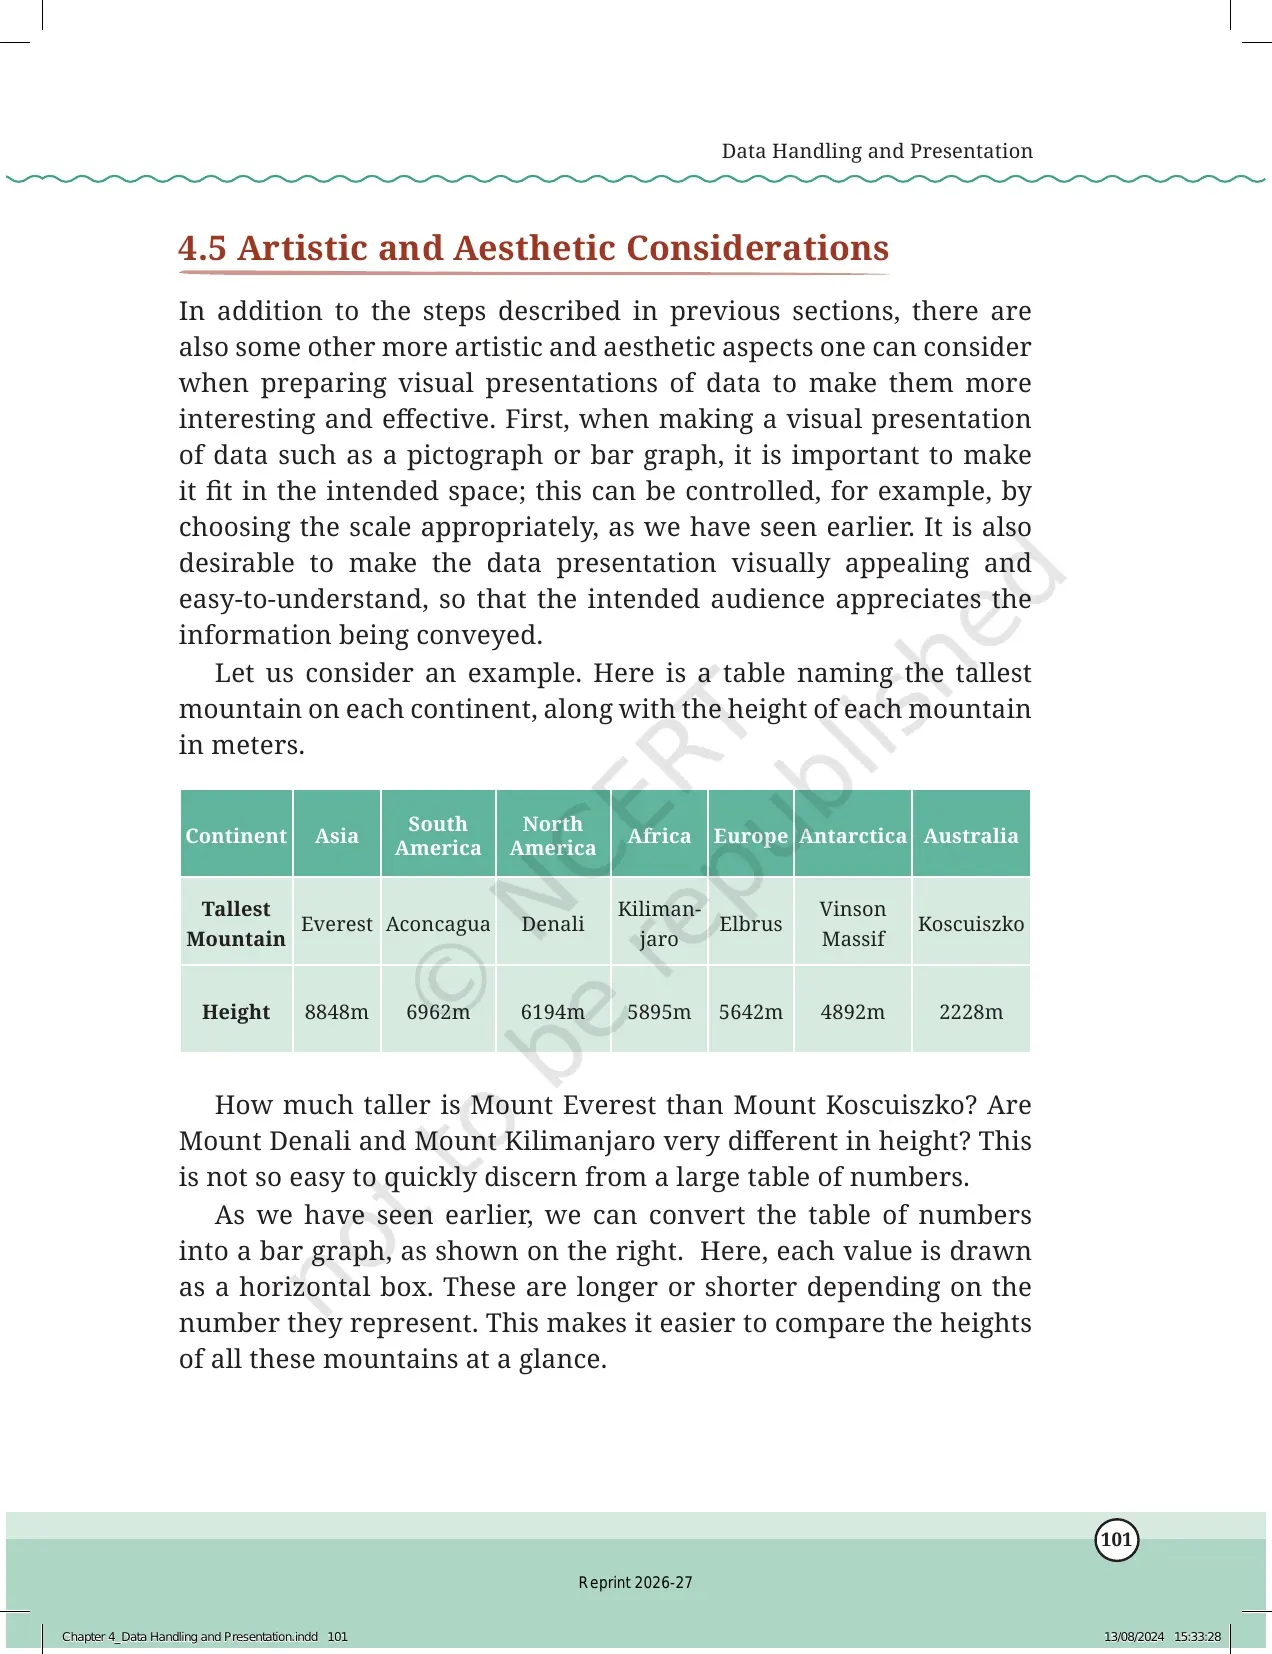
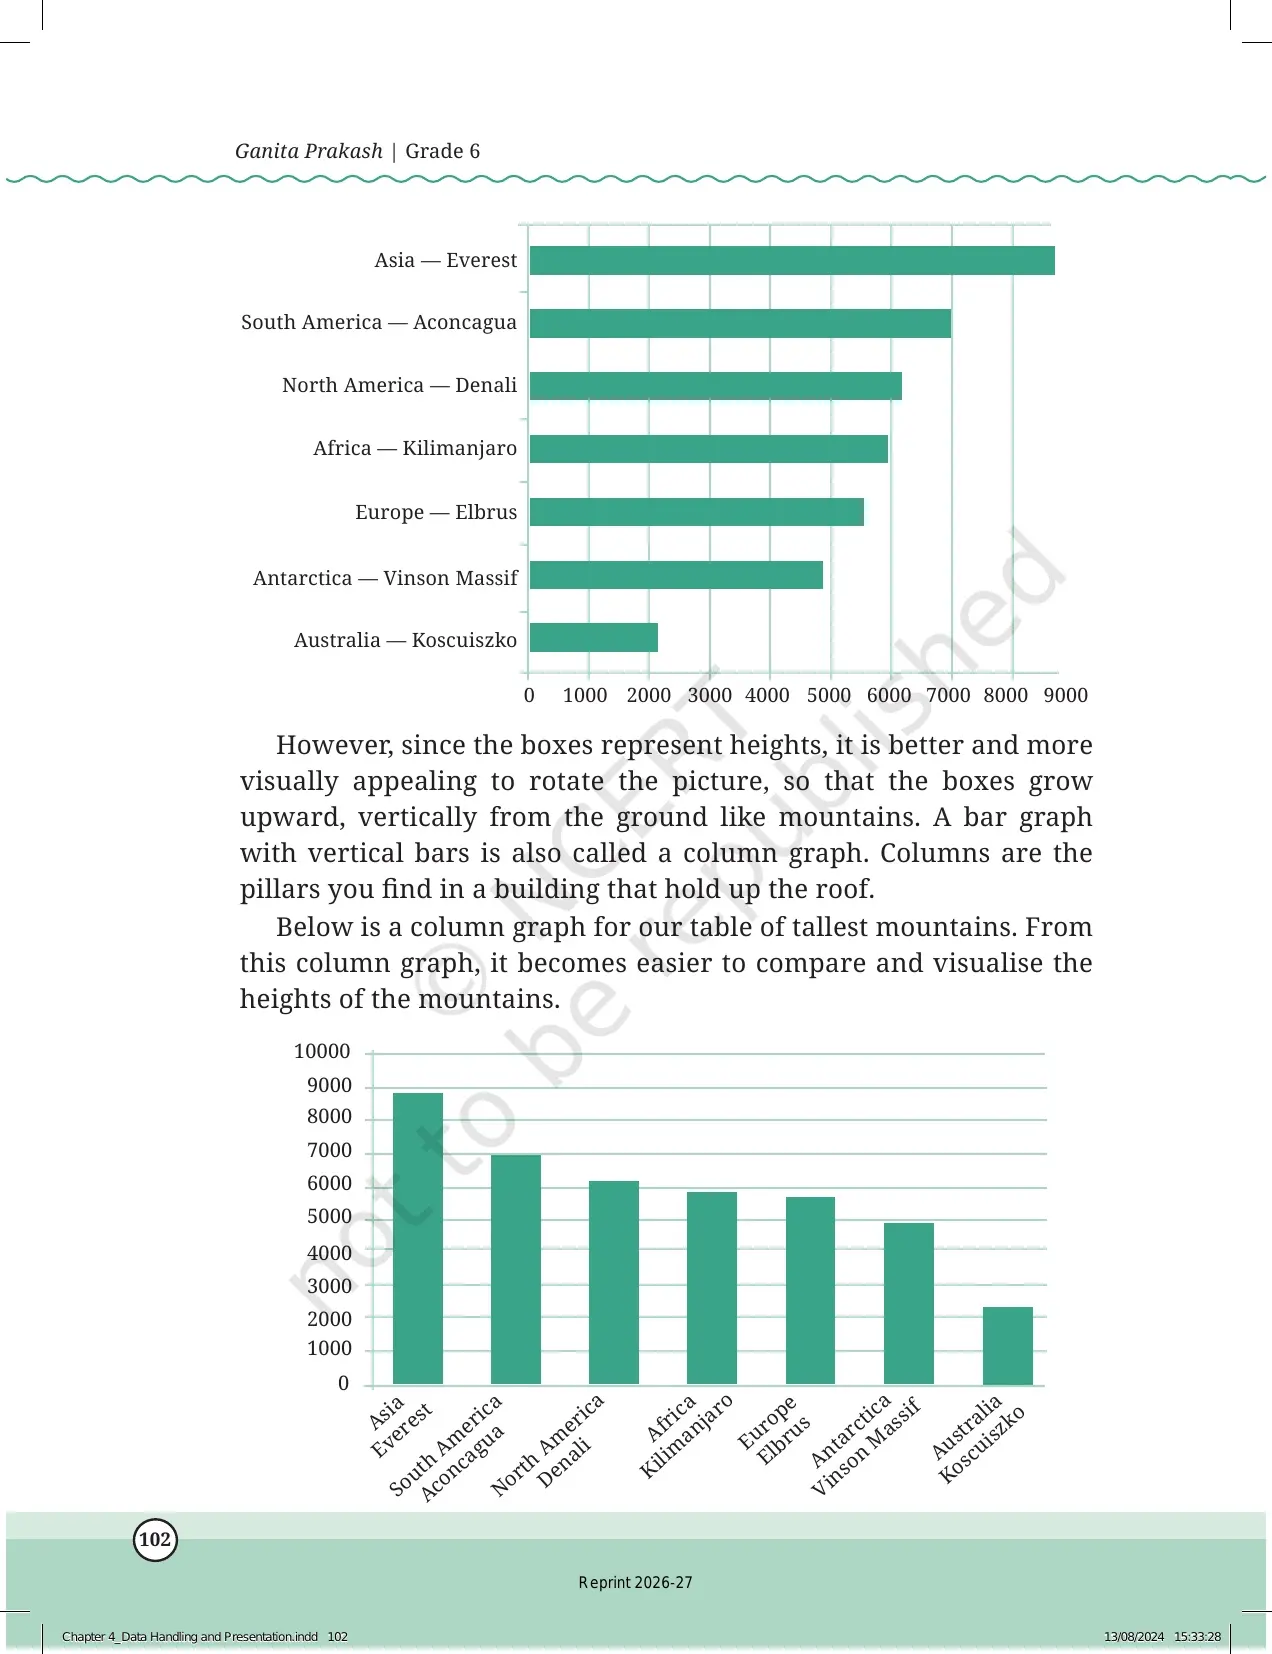
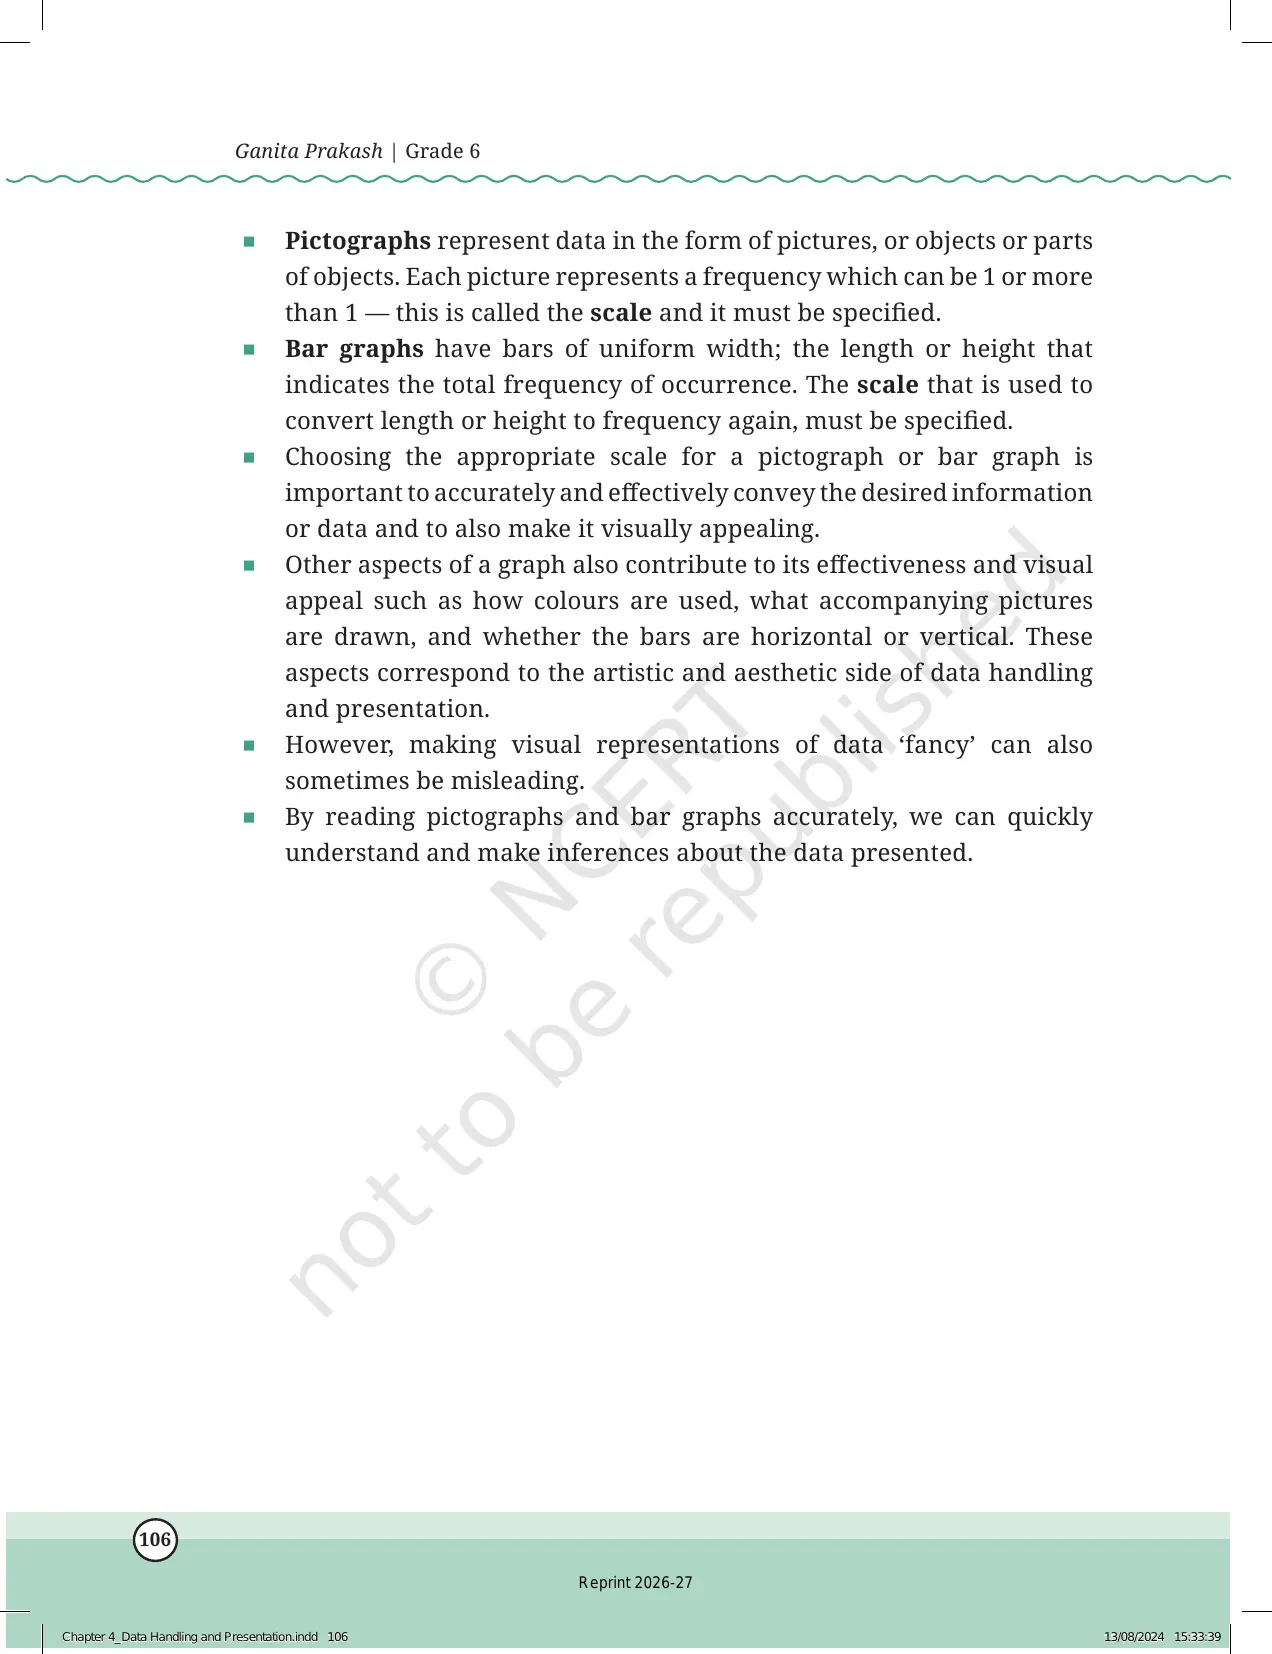
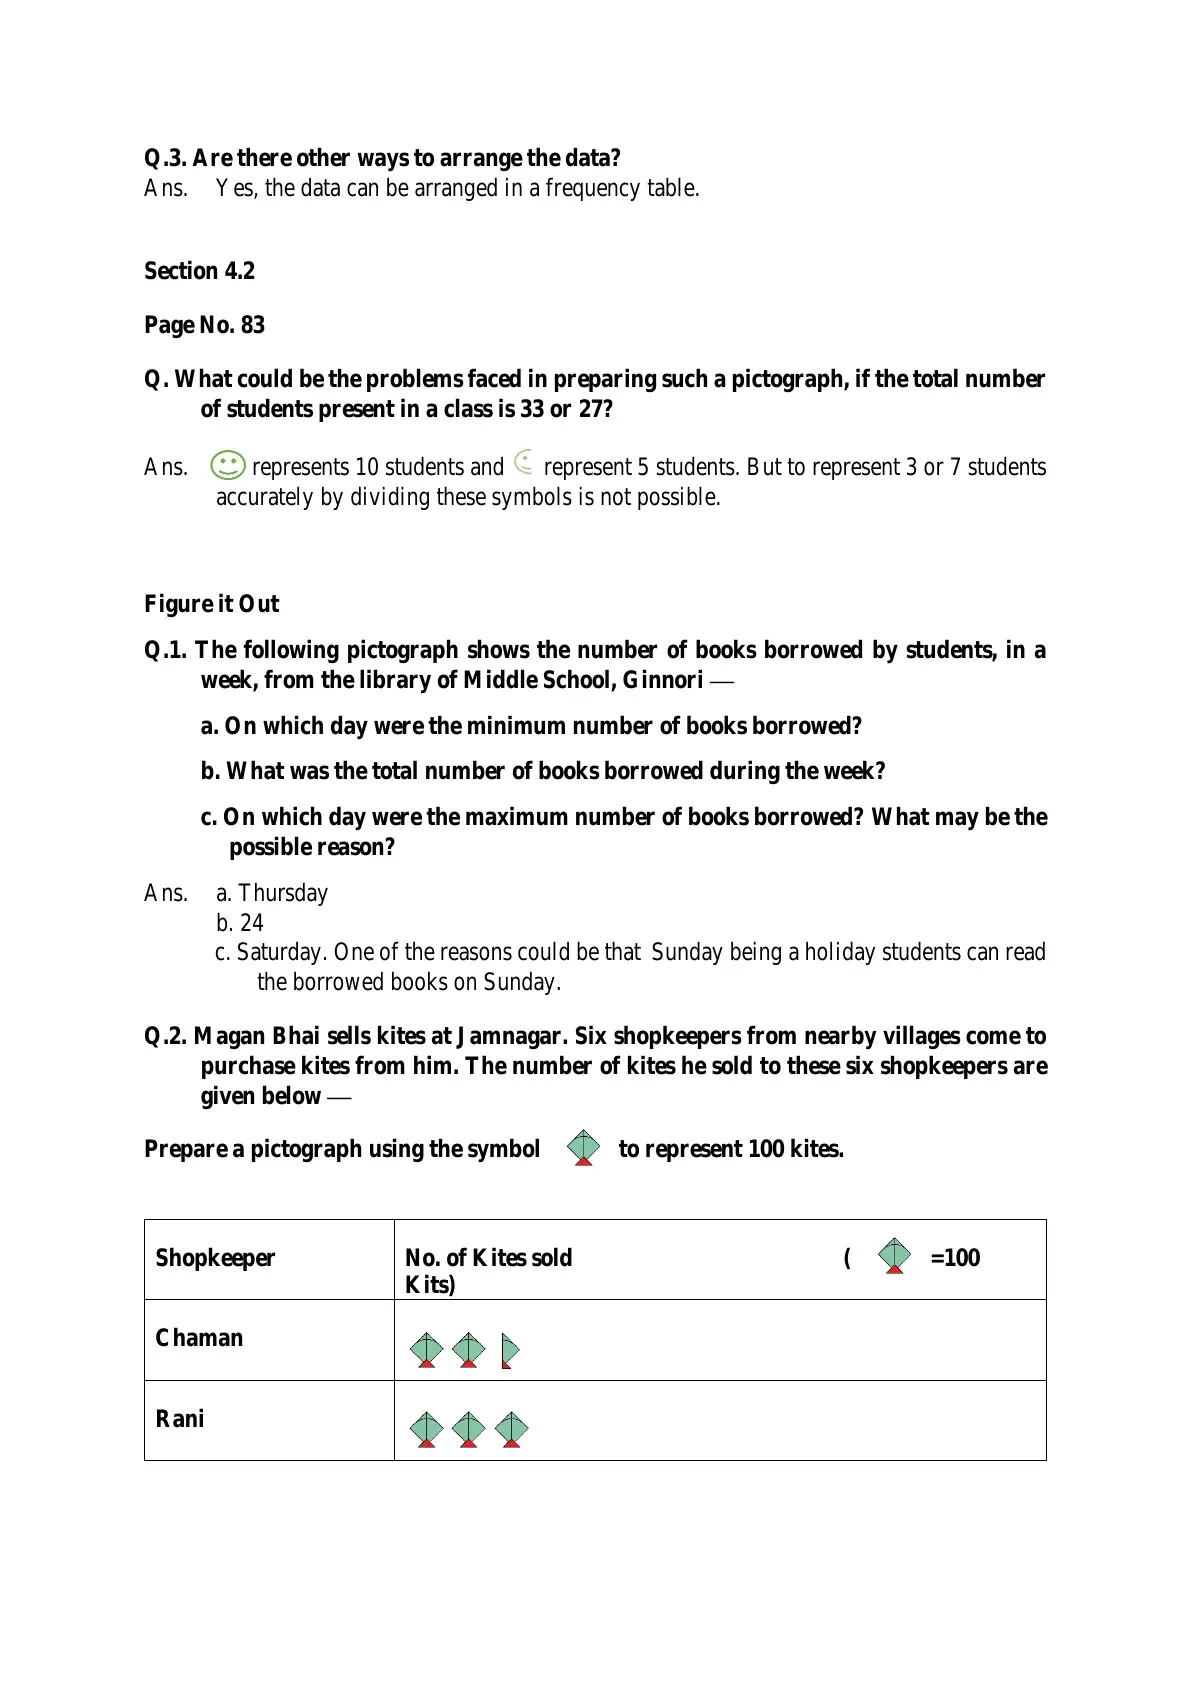
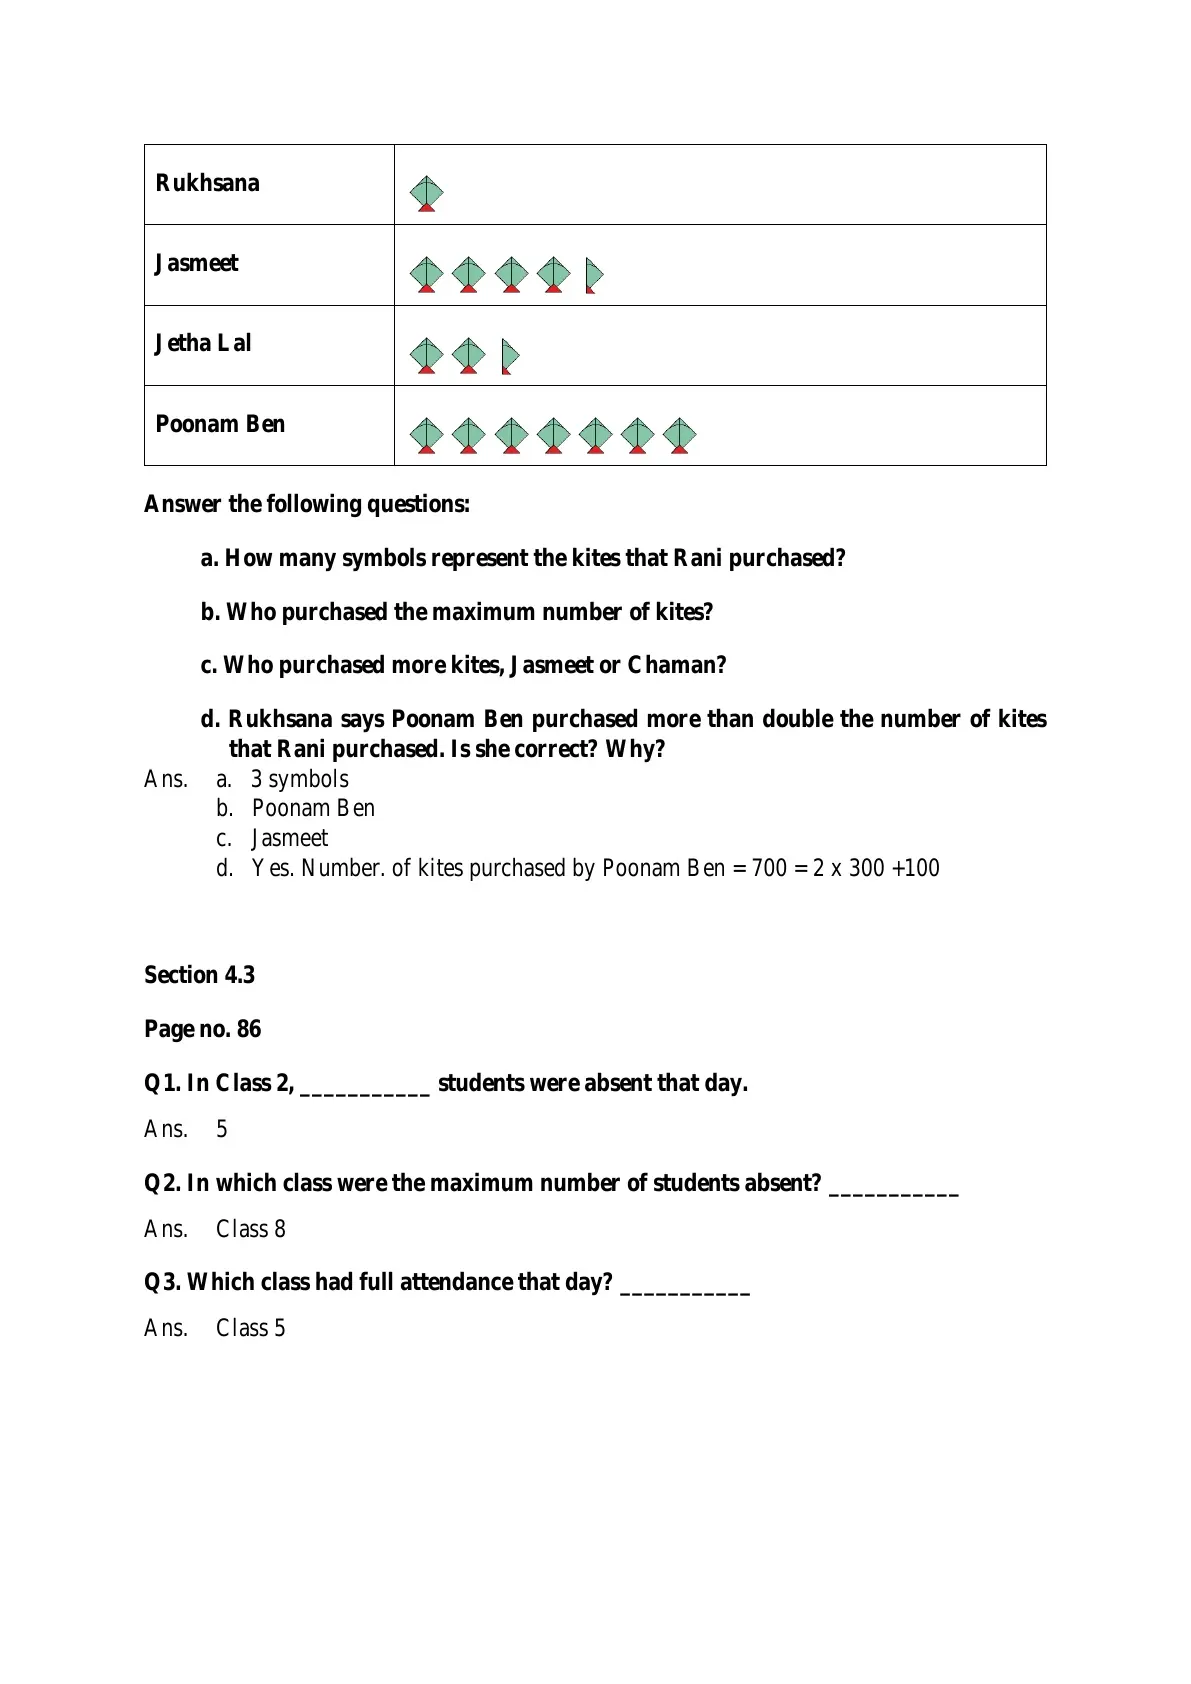
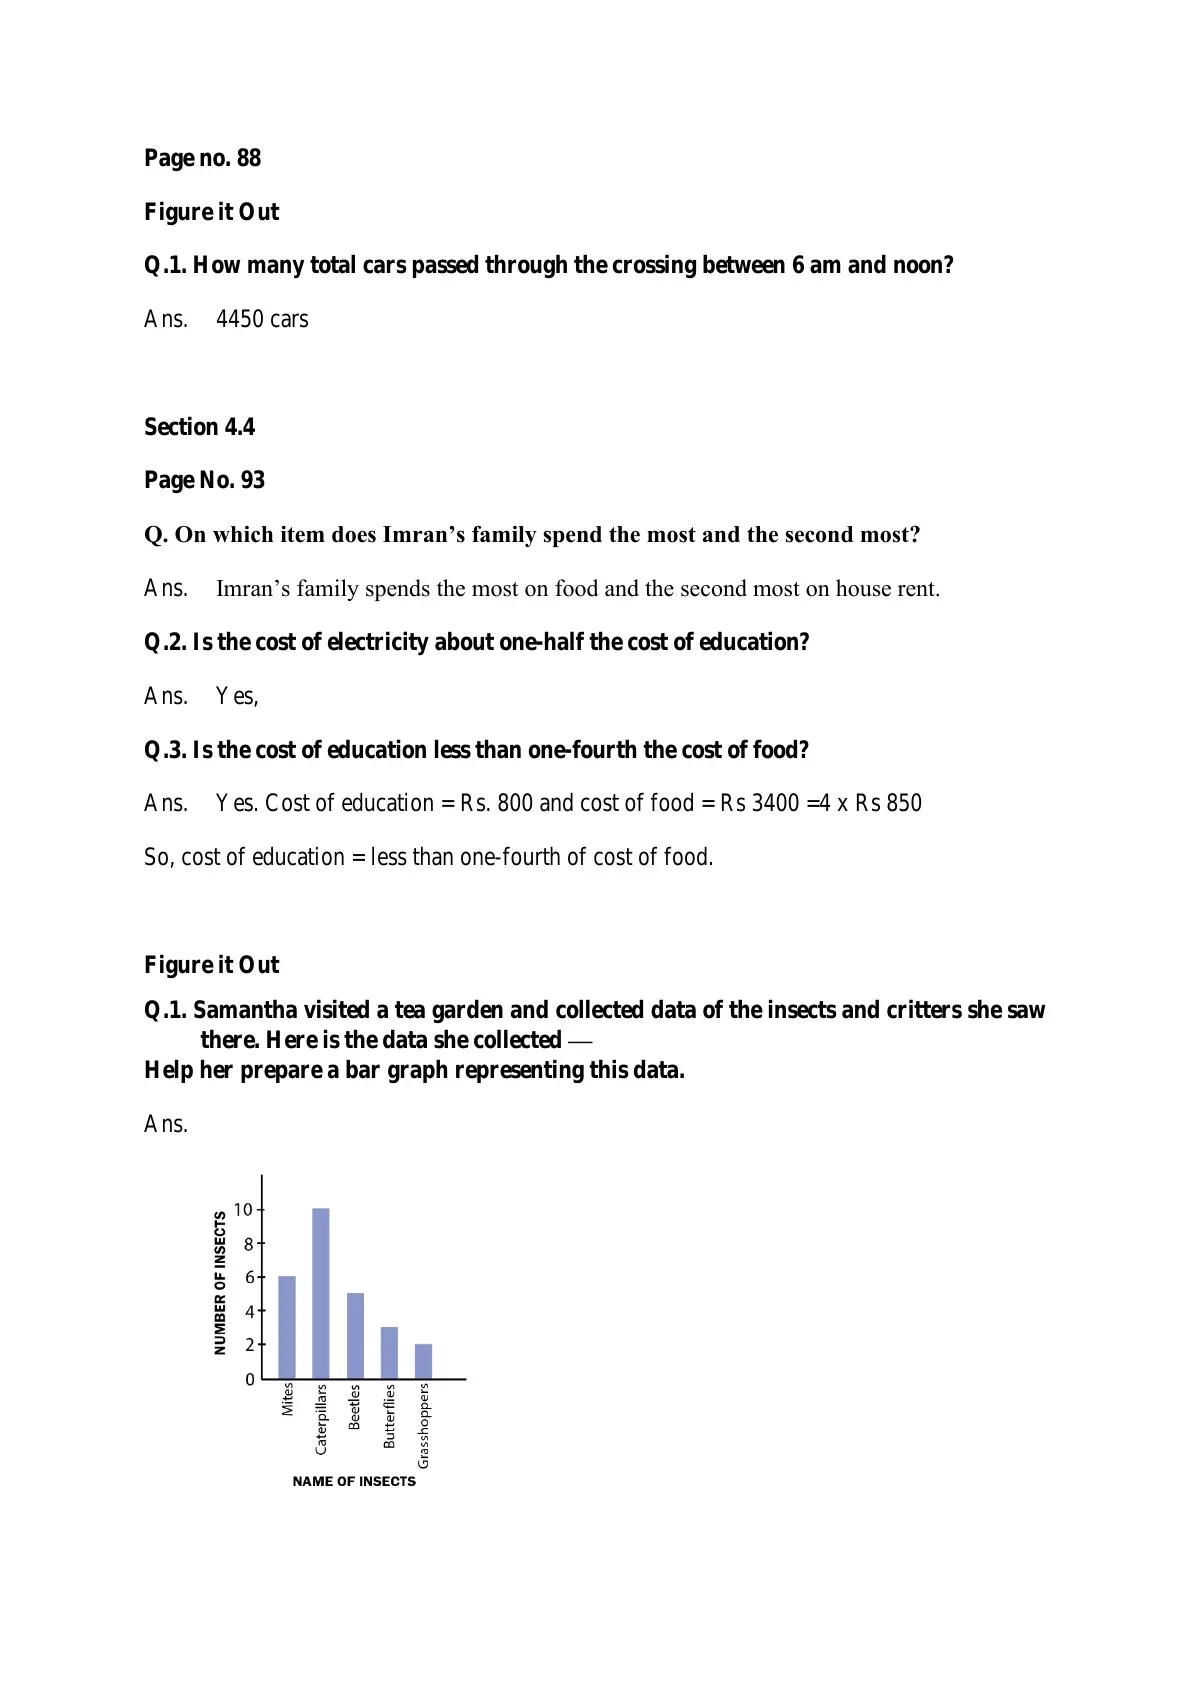
After data is counted, the chapter moves to presentation. A pictograph uses symbols, while a bar graph uses equal-width bars. Both help students compare groups without reading a long list of numbers.
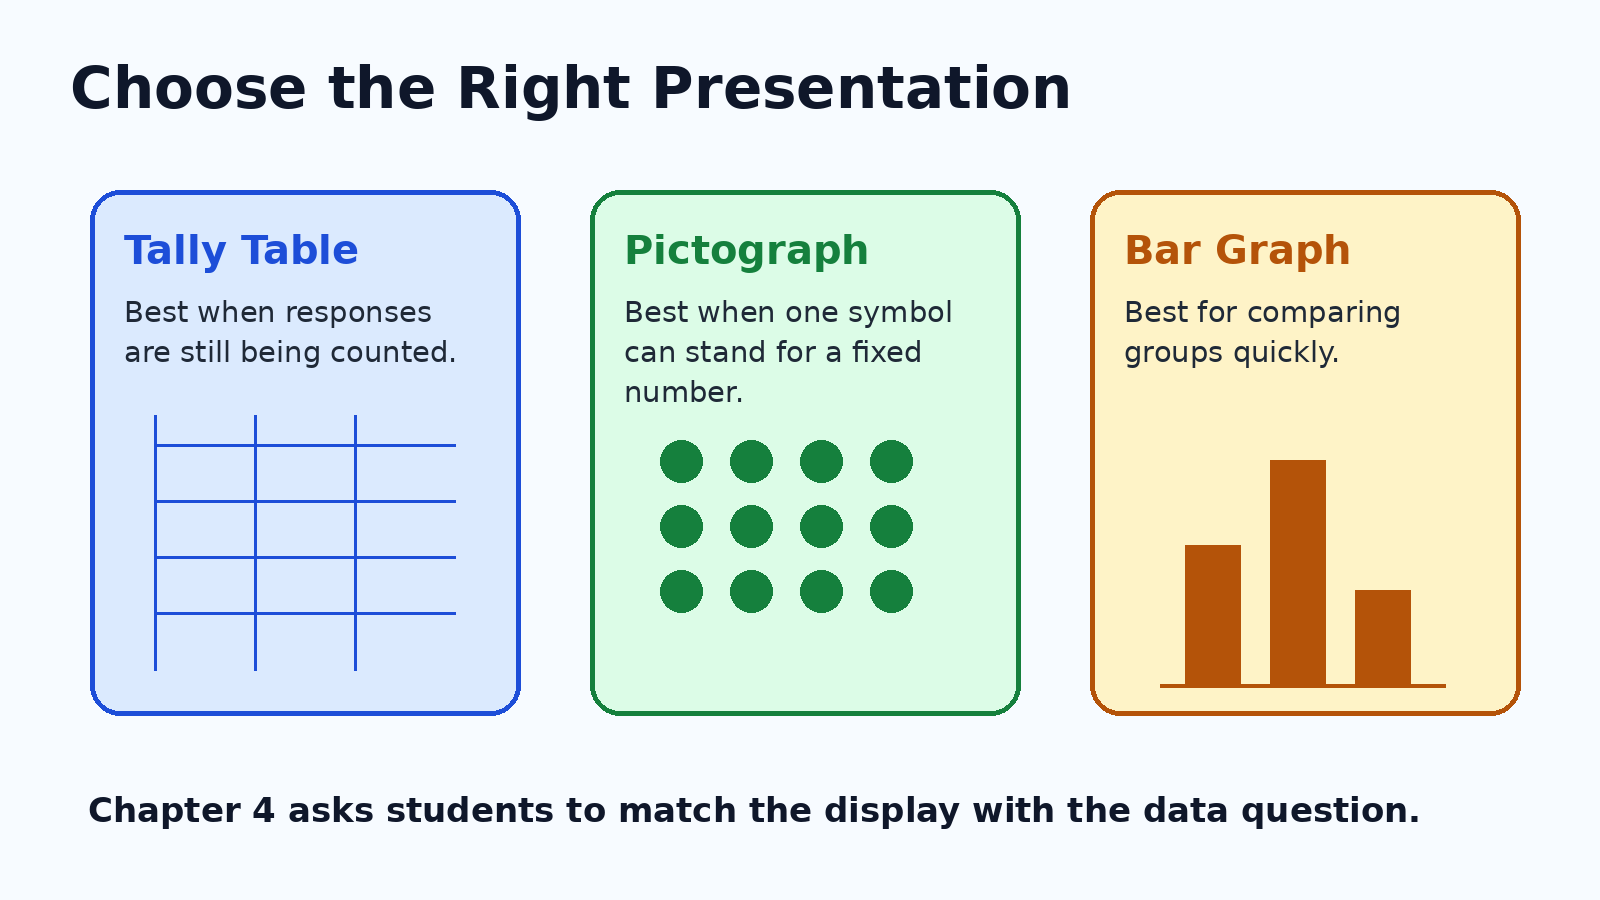
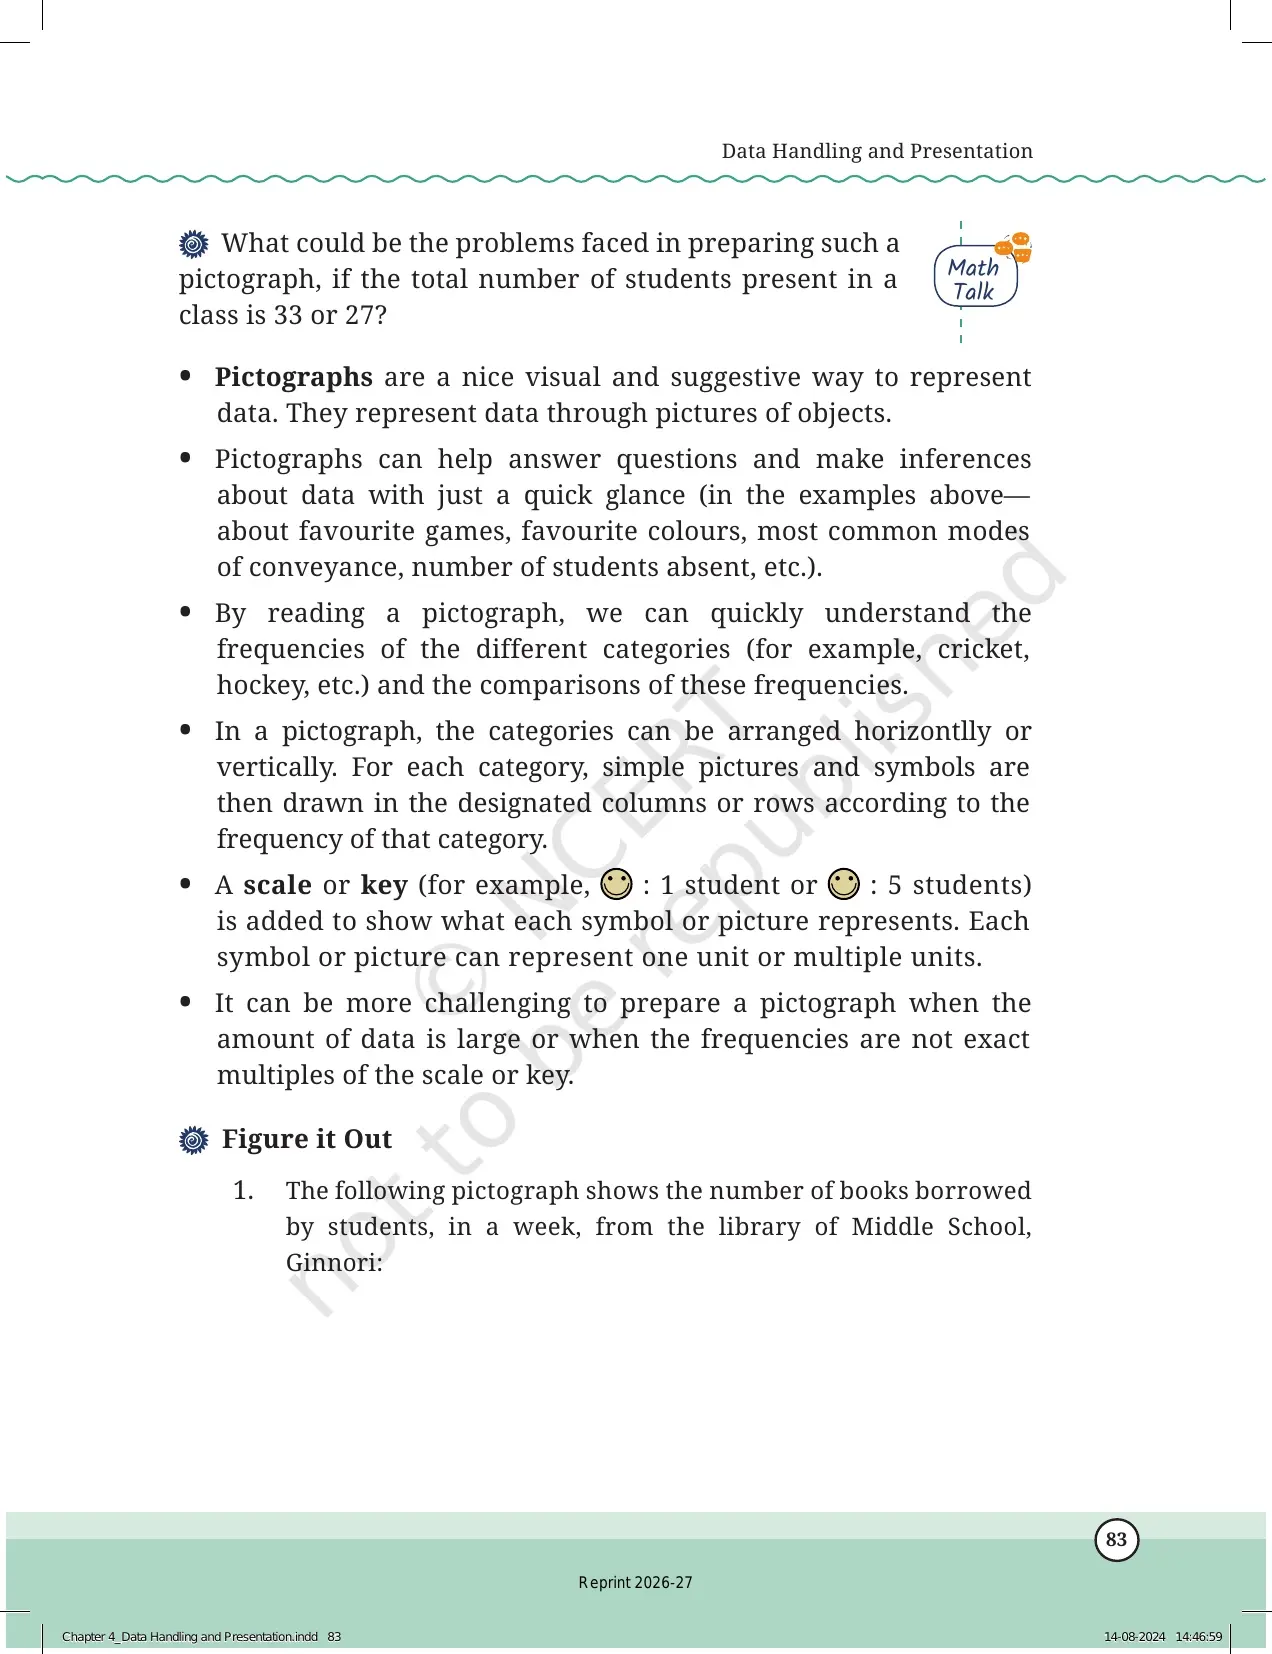
- Pictographs work well when one symbol stands for a fixed number.
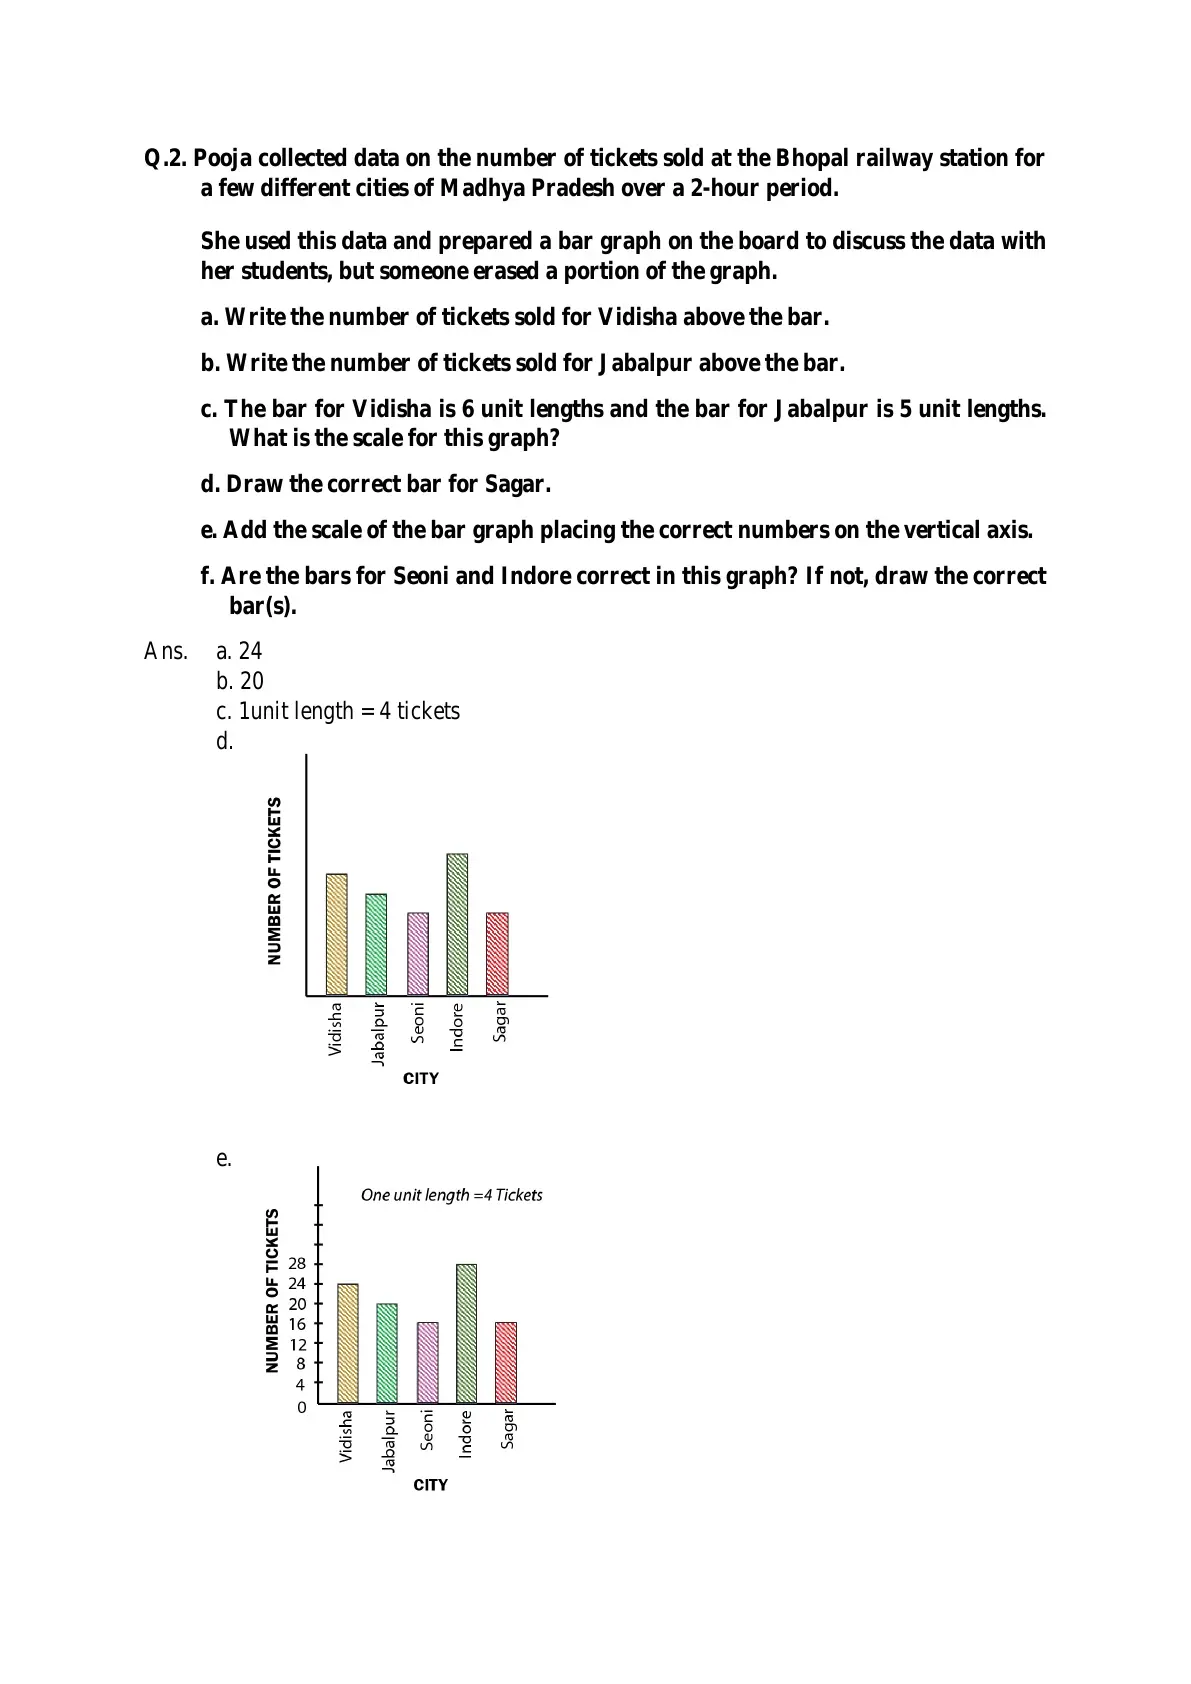
- Bar graphs make higher and lower values easy to compare.
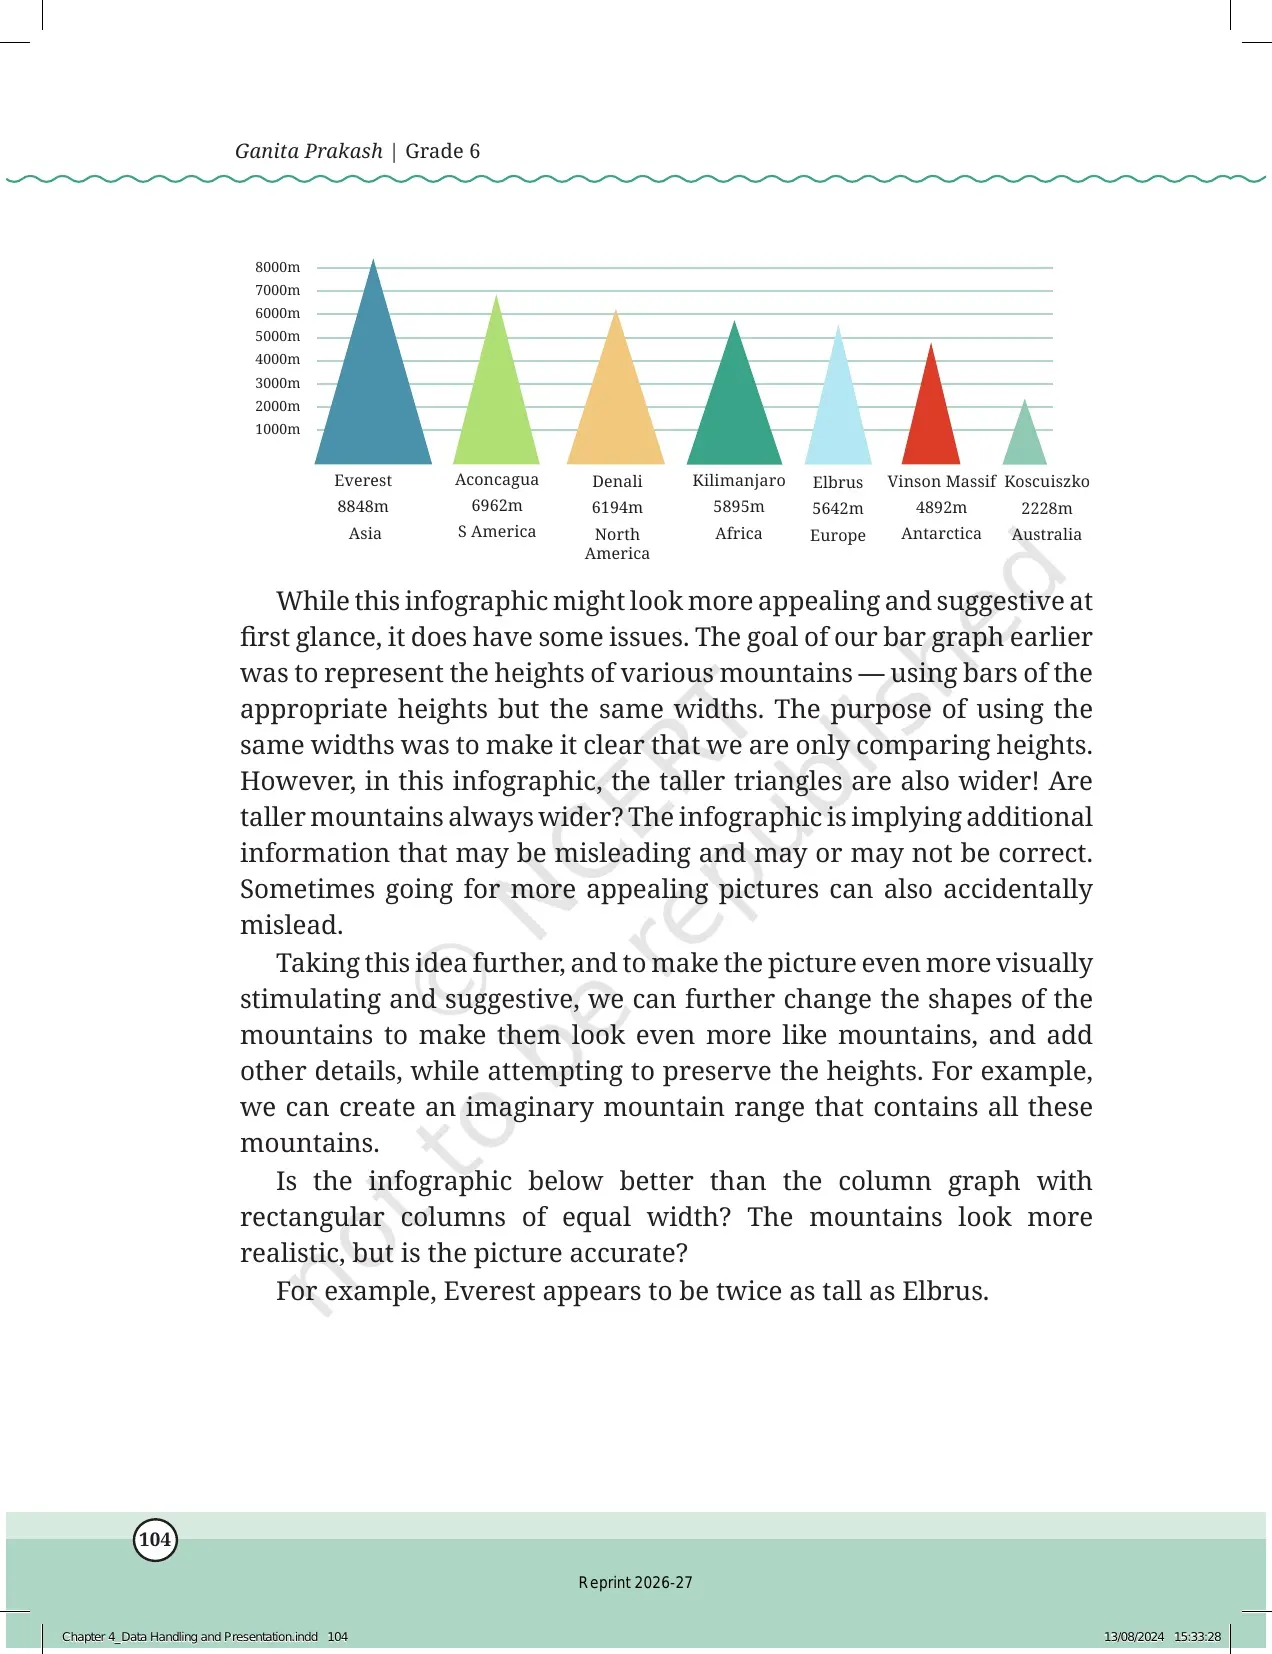
- Scale choice matters because a poor scale can make a graph hard to read.
- Questions below graphs train students to read exact values and differences.
How to Use the Class 6 Mathematics Chapter 4 PDF
Students should keep a notebook beside the PDF. Data Handling and Presentation becomes easier when each table is redrawn neatly before answering comparison questions.
- Write the survey question before making the table.
- Check the total after every tally table.
- Read the graph scale before comparing bars.
- Solve the linked NCERT Solutions only after trying the PDF tasks once.
Data Handling and Presentation Class 6 Chapter Links
Use these linked resources with the official PDF. They help students move from reading the chapter to solving and revising it.
| Resource | Use It For |
|---|---|
| Data Handling and Presentation Class 6 NCERT Solutions | Step-by-step answers after reading the chapter. |
| Data Handling and Presentation Class 6 Handwritten Notes | Quick revision of tables, graphs, and comparison rules. |
| Data Handling and Presentation Class 6 Notes | Short explanation of main ideas and practice tips. |
NCERT Class 6 Mathematics Book Chapter PDFs
The Ganita Prakash textbook has 10 chapters. Students can move from the Data Handling and Presentation PDF to other chapter PDFs as each page goes live.
| Chapter | NCERT Book PDF |
|---|---|
| Chapter 1 | Patterns in Mathematics Class 6 NCERT Book PDF |
| Chapter 2 | Lines and Angles Class 6 NCERT Book PDF |
| Chapter 3 | Number Play Class 6 NCERT Book PDF |
| Chapter 4 | Data Handling and Presentation Class 6 NCERT Book PDF |
| Chapter 5 | Prime Time Class 6 NCERT Book PDF |
Data Handling and Presentation Class 6 NCERT Book PDF FAQs
Ques. Is the Class 6 Mathematics Chapter 4 Data Handling and Presentation PDF official?
Ans. Yes. This page hosts the official NCERT Ganita Prakash Chapter 4 PDF for the 2026-27 session.
Ques. How many pages are in the Data Handling and Presentation Class 6 PDF?
Ans. The chapter PDF has 44 pages. It includes data collection, tally tables, pictographs, bar graphs, and interpretation tasks.
Ques. What is the main idea of Data Handling and Presentation in Class 6?
Ans. The main idea is to collect data carefully, organise it in tables, and present it so comparisons are easy to read.
Ques. Does Chapter 4 teach bar graphs?
Ans. Yes. The chapter explains how bar graphs represent quantities and how students should read the scale before comparing bars.
Ques. Where can I get answers for the Data Handling and Presentation questions?
Ans. Use the linked NCERT Solutions page after trying the PDF questions once. It gives step-by-step answers for the chapter tasks.



Comments