



Education Journalist | Study Abroad Lead
Correlation coefficient is a statistical measure that quantifies the strength and direction of the relationship between two variables. The correlation coefficient provides a numerical value that ranges between -1 and +1, representing the strength and direction of the relationship.
- The strength of the correlation is indicated by the absolute value of the coefficient.
- A value closer to +1 or -1 indicates a stronger relationship, while a value closer to 0 suggests a weaker or no relationship.
- The direction of the relationship is determined by the sign of the coefficient.
- A positive coefficient indicates a positive correlation, meaning that as one variable increases, the other variable also tends to increase.
- Conversely, a negative coefficient signifies a negative correlation, where one variable tends to decrease as the other variable increases.
Read More: Linear Regression
| Table of Content |
Key Terms: Correlation, Correlation Coefficient, Data, Statistics, Pearson’s r, Spearman’s rho, Mean, Standard Deviation.
Definition of Correlation Coefficient
[Click Here for Sample Questions]
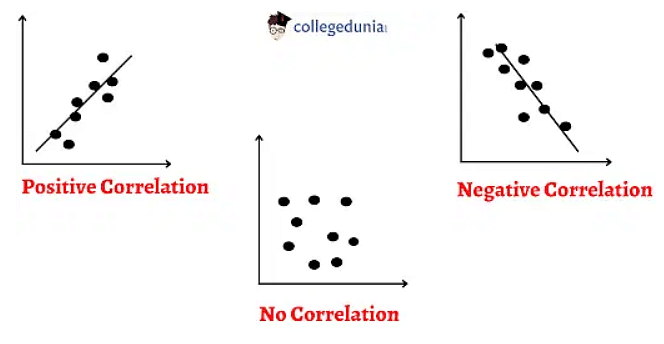
The correlation coefficient is a statistical way of analyzing the strength and direction of the relationship between two variables. It provides a numerical value that summarizes the degree to which changes in one variable are associated with changes in another variable. The coefficient ranges between -1 and +1, where -1 represents a perfect negative correlation, +1 represents a perfect positive correlation, and 0 indicates no correlation.
- The correlation coefficient is often denoted by the symbol "r". By examining the relationship between these variables, it can be determined whether they are positively correlated, negatively correlated, or not correlated at all.
- When the correlation coefficient is positive (r > 0), it indicates a positive correlation between the variables.
- This means that as one variable increases, the other variable tends to increase as well. In other words, there is a direct relationship between the two variables, and they move in the same direction.
- The closer the correlation coefficient is to +1, the stronger the positive correlation.
- On the other hand, when the correlation coefficient is negative (r < 0), it indicates a negative correlation between the variables.
- This means that as one variable increases, the other variable tends to decrease.
- In this case, the variables move in opposite directions.
- The closer the correlation coefficient is to -1, the stronger the negative correlation.
- When the correlation coefficient is close to 0 (|r| ≈ 0), it suggests little to no linear relationship between the variables.
- This means that changes in one variable do not predict or explain changes in the other variable.
Correlation Coefficient
Read More: Bivariate Analysis
Correlation Coefficient Meaning and Examples
[Click Here for Sample Questions]
| Correlation Coefficient | Correlation Type | Meaning |
|---|---|---|
| 1 | Perfect Positive | Strong, direct relationship |
| 0 | No Correlation | No linear relationship |
| -1 | Perfect Negative | Strong, inverse relationship |
- A correlation coefficient of 1 represents a perfect positive correlation. This means that the variables are strongly and directly related.
- As one variable increases, the other variable also increases in a consistent and predictable manner.
- Example: The increase in hours spent studying is directly proportional to the increase in exam scores.
- When the correlation coefficient is 0, it indicates no correlation or no linear relationship between the variables.
- Changes in one variable do not predict or explain changes in the other variable.
- However, it's important to note that there may still be other types of relationships or non-linear associations that are not captured by the correlation coefficient.
- Example: There is no significant relationship between the amount of rainfall and the number of cars passing by on a particular road.
- For a correlation coefficient of -1, it represents a perfect negative correlation.
- This means that the variables are strongly inversely related.
- As one variable increases, the other variable decreases in a consistent and predictable manner.
- Example: As the temperature outside increases, the sales of winter coats decline in a perfectly consistent manner.
Read More: Statistics Revision Notes
Types of Correlation Coefficients
[Click Here for Sample Questions]
Correlation coefficients come in different types, depending on the nature of the variables being analyzed. The three commonly used types are the Pearson correlation coefficient, Spearman correlation coefficient, and Kendall correlation coefficient.
- Pearson Correlation Coefficient (r):
The Pearson correlation coefficient measures the linear relationship between two continuous variables.
- It is the most widely used correlation coefficient and assumes that the variables follow a bivariate normal distribution.
- It calculates the strength and direction of the linear relationship between variables, ranging from -1 to +1.
- Spearman Correlation Coefficient (ρ):
The Spearman correlation coefficient assesses the monotonic relationship between variables, capturing both linear and nonlinear associations.
- It is suitable for both continuous and ordinal variables. Instead of analyzing the raw data.
- Spearman's correlation looks at the ranks or order of the observations, providing a value between -1 and +1.
- Kendall Correlation Coefficient (τ):
The Kendall correlation coefficient also evaluates the rank-based association between variables.
- It is used when dealing with nonparametric data, ordinal variables, or cases with ties.
- Kendall's correlation ranges from -1 to +1, with 0 indicating no correlation.
| Correlation Coefficient | Type of Relationship | Levels of Measurement | Data Distribution Assumptions |
|---|---|---|---|
| Pearson (r) | Linear | Continuous | Bivariate Normal |
| Spearman (ρ) | Monotonic | Continuous or Ordinal | Any Distribution |
| Kendall (τ) | Monotonic | Continuous or Ordinal | Any Distribution |
Read More: Frequency Distribution Table
Pearson correlation coefficient
[Click Here for Sample Questions]
The Pearson correlation coefficient measures the strength and direction of the linear relationship between two continuous variables.
The basic formula is–
r = \(\frac{n \sum xy - (\sum x)(\sum y)}{\sqrt{[n \sum x^2 - (\sum x)^2][n \sum y^2 - (\sum y)^2]}}\)
rxy = strength of the correlation between variables x and y
n = sample size
∑ = sum of what follows…
X = every x-variable value
Y = every y-variable value
XY = the product of each x-variable score and the corresponding y-variable score
The formula for calculating the Pearson correlation coefficient in both the sample and population cases is as follows:
For the Sample Pearson Correlation Coefficient (denoted by "r"):
rxy= \(\frac{cov (X, Y)}{S _ X S _ Y}\)
rxy= strength of the correlation between variables x and y
cov(x,y) = covariance of x and y
sx = sample standard deviation of x
sy = sample standard deviation of y
For the Population Pearson Correlation Coefficient (denoted by "ρ"):
ρXY = \(\frac{cov (X, Y)}{\sigma _ X \sigma _ Y}\)
ρXY= strength of the correlation between variables X and Y
cov(X, Y) = covariance of X and Y
σX = population standard deviation of X
σY = population standard deviation of Y
In both cases, the numerator of the formula calculates the covariance between X and Y, while the denominator calculates the product of the standard deviations of X and Y. Dividing the covariance by the product of the standard deviations normalizes the correlation coefficient and brings it to a value between -1 and +1, representing the strength and direction of the linear relationship.
Read More: Mean and Median
Spearman's Rank Correlation Coefficient
[Click Here for Sample Questions]
Spearman's rho, also known as Spearman's rank correlation coefficient, is a non-parametric measure that assesses the strength and direction of the monotonic relationship between two variables. It is particularly useful when dealing with data that may not follow a linear relationship. The formula for calculating Spearman's rank correlation coefficient is as follows:
ρ = 1 - (6 * Σ(d2)) / (n * (n2 - 1))
where:
- Σ(d2) represents the sum of the squared differences between the ranks of corresponding observations in the two variables.
- n is the number of observations.
- The Pearson correlation coefficient indicates connection linearity, whereas the Spearman correlation coefficient measures relationship monotonicity.
- For a linear relationship Positive monotonic indicates as one variable rises, the other rises as well, and for Negative monotonic, it indicates while one variable rises, the other falls.
- There are other types of coefficients as well- The correlation of determination (r2) is obtained by squaring the correlation coefficient and the coefficient of alienation is obtained by subtracting the coefficient of determination from one (1 - r2).
Read More: Central Tendency
Solved Examples
[Click Here for Sample Questions]
Example 1: Given the ranked data of two variables, calculate the Spearman's correlation coefficient:
X: 4, 2, 1, 3, 5
Y: 3, 4, 2, 5, 1
Solution: Differences: 1 - 5, 2 - 3, 3 - 1, 4 - 2, 5 - 4 = -4, -1, 2, 2, 1
Squared difference: (-4)2, (-1)2, 22, 22, 12 = 16, 1, 4, 4, 1
Sum of squared differences: 16 + 1 + 4 + 4 + 1 = 26
n = 5
rho = 1 - (6 * sum of squared differences) / (n3 - n)
rho = 1 - (6 * 26) / (53 - 5)
rho = 1 - (156) / (120)
rho = 1 - 1.3
rho = -0.3
Therefore, the Spearman's correlation coefficient between X and Y is – 0.3.
Example 2: Calculate the Spearman's correlation coefficient for the following ranked data:
X: 2, 4, 1, 3
Y: 4, 2, 3, 1
Solution: Differences: 2 - 1, 4 - 3, 1 - 3, 3 - 1 = 1, 1, -2, 2
Squared differences: 12, 12, (-2)2, 22 = 1, 1, 4, 4
Sum of squared differences: 1 + 1 + 4 + 4 = 10
n = 4
rho = 1 - (6 * sum of squared differences) / (n3 - n)
rho = 1 - (6 * 10) / (43 - 4)
rho = 1 - (60) / (60)
rho = 1 - 1
rho = 0
Therefore, the Spearman's correlation coefficient between X and Y is 0.
Things to Remember
- The correlation coefficient measures the strength and direction of the relationship between two variables.
- It ranges from -1 to +1, with -1 indicating a perfect negative correlation, +1 indicating a perfect positive correlation, and 0 indicating no correlation.
- A correlation coefficient of -1 or +1 represents a strong and consistent relationship, while a coefficient close to 0 indicates a weak or no relationship.
- The Pearson correlation coefficient (r) measures the linear relationship between continuous variables and assumes a bivariate normal distribution.
- The Spearman correlation coefficient (ρ) is a non-parametric measure that assesses the monotonic relationship between variables, suitable for both continuous and ordinal data.
- The Kendall correlation coefficient (τ) is another rank-based measure of the monotonic relationship, commonly used for non-parametric data or cases with ties.
- Correlation coefficients can be calculated for both sample data (representing a subset) and population data (representing the entire population).
Sample Questions
Ques: Suppose you have a dataset with two variables, X and Y. The correlation coefficient between X and Y is calculated to be 0.75. Interpret the value of the correlation coefficient in terms of the relationship between X and Y. (2 Marks)
Ans: A correlation coefficient of 0.75 indicates a strong positive linear relationship between variables X and Y. This means that as the values of X increase, the values of Y also tend to increase, and vice versa. The magnitude of 0.75 suggests a relatively strong correlation, indicating that the relationship between X and Y is fairly consistent and predictable.
Ques: You calculate the correlation coefficient between two variables, X and Y, to be -0.3. What does this value indicate about the relationship between X and Y? (2 Marks)
Ans: A correlation coefficient of -0.3 suggests a weak negative linear relationship between variables X and Y. This means that as the values of X increase, the values of Y tend to decrease, and vice versa, but the relationship is not very strong. The negative sign indicates an inverse relationship, meaning that higher values of X correspond to lower values of Y. However, the magnitude of -0.3 suggests a relatively weak correlation, indicating that the relationship between X and Y is not very strong or consistent.
Ques: You calculate the correlation coefficient between two variables, X and Y, and obtain a value of 0. What does this value indicate about the relationship between X and Y? (2 Marks)
Ans: A correlation coefficient of 0 indicates no linear relationship between variables X and Y. It suggests that there is no systematic pattern or tendency for the values of X to change with the values of Y. The variables are independent of each other and there is no direction or strength to their relationship.
Ques: You calculate the correlation coefficient between two variables, X and Y, and obtain a value of -0.9. Interpret the value of the correlation coefficient in terms of the relationship between X and Y. (2 Marks)
Ans: A correlation coefficient of -0.9 indicates a strong negative linear relationship between variables X and Y. This means that as the values of X increase, the values of Y tend to decrease, and vice versa. The negative sign indicates an inverse relationship, where higher values of X correspond to lower values of Y. The magnitude of 0.9 suggests a high degree of correlation, indicating that the relationship between X and Y is strong and consistent.
Ques: You calculate the correlation coefficient between two variables, X and Y, and obtain a value of 0.8. What can you conclude about the relationship between X and Y based on this correlation coefficient? (2 Marks)
Ans: A correlation coefficient of 0.8 indicates a strong positive linear relationship between variables X and Y. This means that as the values of X increase, the values of Y also tend to increase, and vice versa. The positive sign indicates a direct relationship, where higher values of X correspond to higher values of Y. The magnitude of 0.8 suggests a high degree of correlation, indicating that the relationship between X and Y is strong and consistent.
Ques: Calculate the correlation coefficient between X and Y using the given data:
X: 1, 2, 3, 4, 5
Y: 5, 5, 5, 5, 5 (3 Marks)
Ans: Mean(X) = (1 + 2 + 3 + 4 + 5) / 5 = 3
Mean(Y) = (5 + 5 + 5 + 5 + 5) / 5 = 5
Deviations of X: -2, -1, 0, 1, 2
Deviations of Y: 0, 0, 0, 0, 0
Product of deviations: (-2)(0), (-1)(0), (0)(0), (1)(0), (2)(0) = 0, 0, 0, 0, 0
Squared deviations of X: 4, 1, 0, 1, 4
Squared deviations of Y: 0, 0, 0, 0, 0
Sum of squared deviations of X: 4 + 1 + 0 + 1 + 4 = 10
Sum of squared deviations of Y: 0 + 0 + 0 + 0 + 0 = 0
Product of standard deviations: \(\sqrt{}\)(10) * \(\sqrt{}\)(0) = 0
Since the product of the standard deviations is 0, the denominator of the correlation coefficient formula becomes 0, resulting in an undefined correlation coefficient. This indicates that there is no linear relationship between X and Y.
Ques: Calculate the correlation coefficient between X and Y using the given data:
X: 1, 2, 3, 4, 5
Y: 10, 5, 0, -5, -10 (3 Marks)
Ans: Mean(X) = (1 + 2 + 3 + 4 + 5) / 5 = 3
Mean(Y) = (10 + 5 + 0 + (-5) + (-10)) / 5 = 0
Deviations of X: -2, -1, 0, 1, 2
Deviations of Y: 10, 5, 0, -5, -10
Product of deviations: (-2)(10), (-1)(5), (0)(0), (1)(-5), (2)(-10) = -20, -5, 0, -5, -20
Squared deviations of X: 4, 1, 0, 1, 4
Squared deviations of Y: 100, 25, 0, 25, 100
Sum of squared deviations of X: 4 + 1 + 0 + 1 + 4 = 10
Sum of squared deviations of Y: 100 + 25 + 0 + 25 + 100 = 250
Product of standard deviations: \(\sqrt{}\)(10) * \(\sqrt{}\)(250) = 15.811
Correlation coefficient (r) = (Sum of the product of deviations) / Product of standard deviations
r = (-20 + (-5) + 0 + (-5) + (-20)) / 15.811
r = -50 / 15.811
r = -3.16
Therefore, the correlation coefficient between X and Y is approximately -3.16.
Ques: Calculate the Spearman's correlation coefficient for the following ranked data:
X: 1, 2, 3, 4, 5
Y: 5, 3, 4, 1, 2 (3 Marks)
Ans: Differences: 4 - 1, 2 - 2, 3 - 3, 1 - 4, 5 - 5 = 3, 0, 0, -3, 0
Squared differences: 32, 02, 02, (-3)2, 02 = 9, 0, 0, 9, 0
Sum of squared differences: 9 + 0 + 0 + 9 + 0 = 18
n = 5
rho = 1 - (6 * sum of squared differences) / (n3 - n)
rho = 1 - (6 * 18) / (53 - 5)
rho = 1 - (108) / (120)
rho = 1 - 0.9
rho = 0.1
Therefore, the Spearman's correlation coefficient between X and Y is 0.1.
For Latest Updates on Upcoming Board Exams, Click Here: https://t.me/class_10_12_board_updates
Check-Out:



Comments