



Content Curator
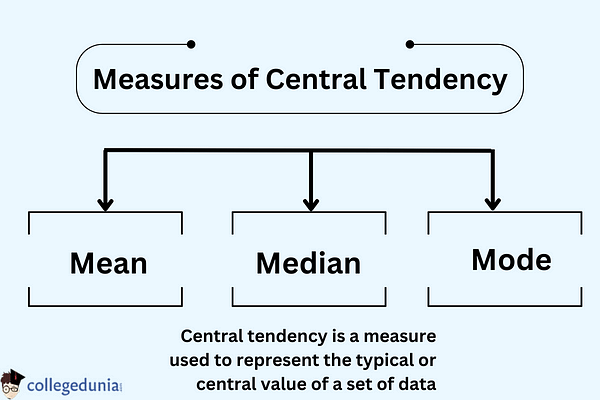
Measures of central tendency can be defined as the statistical measures that describe the central point of distribution. Usually referred to as the measures of central location or measures of central tendency, it is classified into three parts, namely, Mean, Median and Mode.
- Mean: The mean can be calculated by adding up all the values in the distribution and dividing by the total number of values.
- Median: The median is the value separating the distribution into two equal parts. It is not affected by outliers and is the middle value of an ordered set of data.
- Mode: The mode is the value that occurs most frequently in a kind of distribution. It is useful for finding the most common value, but can be misleading if there are multiple modes or the data is continuous.
Also Check: Difference between Mean, Median, and Mode
| Table of Content |
Key Terms: Central Tendency, Mean, Median, Mode, Statistics, Standard Deviation, Symmetric Distribution, Skewed Distribution, Dataset, Ordered Set
Measures of Central Tendency
[Click Here for Sample Questions]
Measures of central tendency is referred to the numerical value representing the center of a set of data. These are further used to describe the average value in a dataset.
The three methods that are commonly used to determine the central tendency of any data are:
- Mean: It is the average of the data in that dataset.
- Median: Median of a set of grouped or ungrouped data is the midpoint of that data set.
- Mode: The value that appears the most in any given set of data is known as mode.
Central tendency is a measure used to represent the typical or central value of a set of data. It gives a single value that describes the central position of a frequency distribution.
Measures of Central Tendency Example
Let's consider the following set of data:
5, 7, 8, 8, 9, 10, 12, 15, 20
Mean
The mean, here, can be calculated by adding all the values and dividing by the total number of values:
(5 + 7 + 8 + 8 + 9 + 10 + 12 + 15 + 20) / 9 = 94 / 9 = 10.44
Thus, the mean is roughly 10.44.
Median
In this case, we can see that there are 9 values in the data set, so the middle value is the 5th value when they are ordered:
5, 7, 8, 8, 9, 10, 12, 15, 20
Thus, the median is 9.
Mode
The mode is the value that appears most frequently in the data set. Here, the value 8 appears twice, so it is the mode.
Hence, the measures of central tendency for this data set are:
- Mean = 10.44
- Median = 9
- Mode = 8
What is Mean?
[Click Here for Previous Year Questions]
Mean is the data's centre point or typical value and summarizes a complete dataset with a single number.
- It is also termed the Arithmetic Average of a Dataset.
- To put it another way, the average of a set of values is determined by dividing the sum of all the observations by the number of observations is termed as mean.
For an observation set: Mean = Sum of the terms/Number of terms
For a set of grouped data: Mean, x̄ = Σfx/Σf
Here,
- x̄ = the mean value of the set of given data.
- f = frequency of each class
- x = mid-interval value of each class
Example of Mean
Let’s understand it with an example,
We have five sticks that are 2, 4, 6, 8, and 10 inches in height. When we add all the value, we get 30. Divide 30 by 5 ( as we have 5 sticks) and we get 6. Therefore, the average height of the stick is 6 inches.
2 + 4 + 6 + 8 + 10 = 30
Average = Sum of observations / Number of observations.
Therefore, Average height of stick = 30/5 =6 Inches
Mean, Median and Mode Video Lecture
Check More:
| Relevant Topics | ||
|---|---|---|
| Frequency Polygon | Mean and Variance of Random Variable | Difference between Mean and Median |
| Interquartile Range | Statistics Formula | Coefficient of Variation Formula |
What is Median?
[Click Here for Sample Questions]
Median is defined as the value that divides an ordered set of data values in half. In statistics, the median can simply be defined as a measure of central tendency signifying the value separating the higher half from the lower half of a dataset.
- It is the middle value of a dataset arranged in ascending or descending order.
- Finding the median is a simple process. Simply multiply the total number of observations by the sum of the values.
- For example, there are five trees of heights 5, 5, 6, 7, and 8. Because 6 is the middle value, the median tree height is 6. There are two values that are higher than it and two that are lower than it.
The method of finding the Median differs depending on the number of observations. If the number of observations is odd, the median will be the value that is in the middle of the data set. When the number of observations is even, the median is determined as the average of the two middle values i.e.,
| Median = [(n/2)th term + ((n/2) + 1)th term]/2 |
If the dataset has an even number of values, the median is the arithmetic mean of the two middle values. For example, in the dataset {1, 2, 3, 4, 5, 6}, the median is (3 + 4)/2 = 3.5.
What is Mode?
[Click Here for Previous Year Questions]
In a series of observations, mode is that value that appears most frequently. In other words, the mode of a data set is the value that occurs the most number of times in it.
- Mode can be determined simply by counting the number of times each value appears in a data collection.
- For example, if the heights of 5 sticks are 2, 4, 4, 7, and 8, the mode of this data set is 4, since it is the most frequently occurring value.
- The mode for grouped data or ungrouped data can also be evaluated by using the mode formulas.
The Mode for ungrouped data can simply be defined as the most recurring observation in the data set. Thus, the Mode for grouped data: L + h ,
| \(\frac{\left(f_{m}-f_{1}\right)}{\left(f_{m}-f_{1}\right)+\left(f_{m}-f_{2}\right)} \) |
Here,
- L = lower limit of the modal class
- h = size of the class interval
- fm = frequency of the modal class
- f1 = frequency of class preceding modal class
- f2 = frequency of class succeeding modal class
Relationship between Mean, Median and Mode
[Click Here for Sample Questions]
An empirical formula can be used to determine the relationship between mean, median, and mode values of a data collection. Mode of a distribution is calculated by subtracting 2 times its mean from 3 times its median. It can be represented as:
| Mode = 3 x Median – 2 x Mean |
There are empirical relations between the measures of central tendency, namely the mean, median, and mode, that can give us an idea about the shape of the distribution.
- When the distribution is roughly symmetric, the mean, median, and mode are also almost equal.
- When the distribution is skewed to the right, the mean is greater than the median, and the median is greater than the mode.
- When the distribution is skewed to the left, the mean is less than the median, and the median is less than the mode.
- When the distribution is bimodal, there are two modes, and the mean and median may not be good measures of central tendency.
Example of Mean, Median and Mode Relation
Ques. The median and mode for a data set given to Rana are 56 and 54 respectively. Help Rana determine the approximate value of the mean for this data set.
Ans. By using the formula, 2 Mean + Mode = 3 Median
We get,
2Mean = 3Median - Mode
2Mean = 3 × 56 - 54
2Mean = 168 - 54 = 114
Mean = 57
Read Also: Skewness Formula
Types of Distribution
[Click Here for Previous Year Questions]
A data set can be expressed in terms of a distribution of 'n' number of observations. The best measure of the central tendency of a data is based on this type of distribution. In terms of measures of central tendency, there are three types of distributions:
- Symmetric Distribution: A distribution is symmetric if its mean, median, and mode are all equal. In other words, the data is evenly distributed on either side of the central point.
- Skewed Right Distribution: A distribution is skewed right if the mean is greater than the median, and the median is greater than the mode. In other words, the majority of the data is on the left-hand side of the distribution, with a long tail to the right.
- Skewed Left Distribution: A distribution is skewed left if the mean is less than the median, and the median is less than the mode. In other words, the majority of the data is on the right-hand side of the distribution, with a long tail to the left.
Also Read: Probability Distribution
Things to Remember
- Central tendency is a summary statistic that reflects the average or centre point of a dataset.
- Mean is the average of the data in that dataset.
- The median is right in the centre of the dataset, with half of the values below it and half above.
- If the number of observations is odd, then the median is represented by a value that is in the middle of the data set.
- When the number of observations is even, the median is determined as the average of the two middle values.
- Mode is the value that appears the most frequently.
- The relationship between Mean, Median and Mode can be represented by the formula Mode= 3 x Median - 2 x Mean.
Also Read:
Sample Questions
Ques. What is the mean of the first ten natural numbers? (2 marks)
Ans. First 10 natural numbers- 1,2,3,4,5,6,7,8,9,10.
Adding the first 10 natural numbers we get 55
Mean = 55/10
=5.5
Mean of the first 10 natural numbers= 5.5.
Ques. How is the mean represented? (1 mark)
Ans. The mean is represented by the average of a set of numbers, obtained by dividing the sum of the numbers by the total count of numbers in the set. It is denoted by the symbol "x̄" (pronounced as x-bar) or "μ" in statistics.
Ques. The weights of 8 boys in kilograms are 45, 39, 53, 45, 43, 48, 50, 45.Determine the mean weight for the given set of values. (2 marks)
Ans. The mean weight of the group:
Mean = Sum of the weights/Number of boys
= (45 + 39 + 53 + 45 + 43 + 48 + 50 + 45)/8
= 368/8
= 46
The mean weight of the group is 46.
Ques. The weights of 8 boys in kilograms are 45, 39, 53, 45, 43, 48, 50, 45. Find the median. (2 marks)
Ans. Arranging the given data set in ascending order: 39, 43, 45, 45, 45, 48, 50, 53
Total number of observations = 8
For even number of observation, Median = [(n/2)th term + ((n/2) + 1)th term]/2
⇒ Median = (4th term + 5th term)/2 = (45 + 45)/2 = 45
The median of the weight of 8 boys is 45.
Ques. The median and mode for a given data set are 56 and 54 respectively. Determine the mean's approximate value for this data set. (2 marks)
Ans. 2 Mean + Mode = 3 Median
2 Mean = 3 Median - Mode
2 Mean = 3 × 56 - 54
2 Mean = 168 - 54 = 114
Mean = 57
Ques. What is the mean, median and mode of the following data (2 marks)
55,77,71,45,96,62,78,94,71
Ans. Mean: There are a total of 9 points given in the data. So the mean of the given data will be their sum divided by 9.
Therefore, 55+77+71+45+96+62+78+94+71 / 9
= 649/9
= 72.11
Median: By arranging the data in ascending order we get,
45, 55, 62, 71, 71, 77, 78, 94, 96
Since this given set of data is odd in number, so we will apply the formula
N+1 / 2 = 9+1 / 2
= 10 / 2
= 5
So the 5th term i.e. 71 is the median of the data.
Mode: It can be seen clearly from the data that the only repeating data number is 71, so 71 is the mode of the data.
Ques. A survey has been conducted regarding the heights of 50 girls of a class and the data acquired is: (3 marks)

Thus, determine the mode of the data by using the measures of central tendency formula.
Ans. Modal class = 150 - 160 [Since it contains maximum frequency]
- l = 150
- h = 10
- fm = 20
- f1 = 12
- f2 = 7
Thus,
Mode = l + [(fm - f1)/(2fm - f1 - f2)] × h
= 150 + [(20 - 12)/(2 × 20 - 12 - 8)] × 10
= 150 + 4
= 154
Ques. Determine the Median: 32, 6, 21, 10, 8, 11, 12, 36, 17, 16, 15, 18, 40, 24, 21, 23, 24, 24, 29, 16, 32, 31, 10, 30, 35, 32, 18, 39, 12, 20. (4 marks)
Ans. If arranged in ascending order, we get:
6, 8, 10, 10, 11, 12, 12, 15, 16, 16, 17, 18, 18, 20, 21, 21, 23, 24, 24, 24, 29, 30, 31, 32, 32, 32, 35, 36, 39, 40
In the data set, the number of values are = n = 30
Thus,
n/2 = 30/2 = 15
This means,
15th data value = 21
(n/2) +1 = 16
Now, we can say that:
16th data value = 21
Thus, as per the formula, we have:
Median = [(n/2)th observation + {(n/2)+1}th observation]/2
= (15th data value + 16th data value)/2
= (21 + 21)/2
= 21
Ques. Find below the list of weekly household expenditures of families residing in a housing society and determine the upper limit of the modal class. (CBSE 2014) (2 marks)

Ans. The Maximum frequency, as per the given table, is = 48
Thus, Modal class = 9,000 – 12,000
Hence, it can be said that the upper limit of the modal class is = 12,000
Ques. What is Mode? (1 mark)
Ans. In statistics, mode is a measure of central tendency that refers to the most frequently occurring value or values in a dataset. It is the value that appears most often in a dataset and can be used to describe the peak or central tendency of a distribution
Join Our Telegram Channel for Live Updates on Board Exams: https://t.me/class_10_12_board_updates
Also Read:



Comments